alumni relations - iium
TRANSCRIPT

D I V I S I O NALUMNI RELATIONS
INTERNATIONAL ISLAMIC UNIVERSITY MALAYSIA
9 789671 396971
ISBN 978-967-13969-7-1


Contributors:Selamah Abdullah Yusof (Head Researcher)
Muhamad Karimi SulaimanHusna JamaluddinZaireena Wan Nasir

© International Islamic University Malaysia, 2018
All rights reserved. No part of this publication may be reproduced, copied, stored in any information storage and retrieval system or transmitted in any form or by any means – electronic, mechanical, photocopying, recording or otherwise; without prior written permission of the publisher.
Perpustakaan Negara Malaysia Cataloging-in-Publication Data
2017 Tracer Study Report
ISBN 978-967-13969-7-1
International Islamic University Malaysia / Selamah Abdullah Yusof, Muhamad Karimi Sulaiman, Husna Jamaluddin, and Zaireena Wan Nasir
Published by:Alumni Relations Division,Level 1, Rectory Building,International Islamic University Malaysia,53100 Gombak, Selangor.Tel : 03-6196 6301Fax : 03-6196 4751E-mail : [email protected]
Printed by:CiME ADV SDN BHD15-1, Jalan 2/27E,Seksyen 10, Wangsa Maju,53300 Kuala Lumpur.Tel: 03 4141 6004Email: [email protected]

v
TABLE OF CONTENTS
List of Abbreviations viiFigures ixTables xi
Introduction 1
1 BACHELOR’S DEGREE GRADUATES 31.1 Profileofgraduates 4 1.1.1Demographicprofile 4 1.1.2 Distribution by kulliyyah 5 1.1.3 Sponsorship 5 1.1.4 Mode of study 6 1.1.5Entryqualification 6 1.1.6 Academic performance 7 1.1.7 Co-curricular activities 9 1.1.8 Internship 9 1.1.9 Determinants of academic performance 101.2 Evaluation of academic programmes, facilities, and services 12 1.2.1 Relevance and helpfulness of study programme 12 1.2.2 Curriculum 13 1.2.3 Acquired skills 14 1.2.4 Facilities and services 17 1.2.5 Degree and University 22 1.2.6 Islamisation, integration, and internationalisation 23 1.2.7 Career enhancement training 24 1.2.8 Disadvantages of studying at IIUM 251.3 Employmentprofile 26 1.3.1 General overview of employment characteristics 26 Box 1: Technical notes 27 1.3.2Employmentprofileofemployedgraduates 31 1.3.3Comparativeprofileofgraduateswithdifferentemploymentstatuses 34 1.3.4 Determinants of employment 37
2 MASTER’S DEGREE GRADUATES 432.1 Profileofgraduates 44 2.1.1Demographicprofile 44 2.1.2 Distribution according to kulliyyah 44 2.1.3 Sponsorship 45 2.1.4 Employment while studying 45 2.1.5 Mode and duration of study 462.2 Evaluation of academic programmes, facilities, and services 49 2.2.1 Relevance and helpfulness of study programme 49 2.2.2 Curriculum 49 2.2.3 Acquired skills 50 2.2.4 Facilities and services 52 2.2.5 Degree and University 54 2.2.6 Islamisation, integration, and internationalisation 56 2.2.7 Advantages and disadvantages of studying at IIUM 572.3 Employmentprofile 58 2.3.1 General overview of employment characteristics 58 2.3.2 Determinants of monthly income 63
. . . . . . . . . . . . . . . . . . . . . . . . . . . . . . . . . . . . . . . . . . . . . . . . . . . . . . . . . . . . . . . . . . . . . . . . . . . . . . . . . . . . . . . . . . . . . . . . . . . . . . . . .
. . . . . . . . . . . . . . . . . . . . . . . . . . . . . . . . . . . . . . . . . . . . . . . . . . . . . . . . . . . . . . . . . . . . . . . . . . . . . . . . . . . . .
. . . . . . . . . . . . . . . . . . . . . . . . . . . . . . . . . . . . . . . . . . . . . . . . . . . . . . . . . . . . . . . . . . . . . . . . . . . . . . . . . . . . . . . . .
. . . . . . . . . . . . . . . . . . . . . . . . . . . . . . . . . . . . . . . . . . . .
. . . . . . . . . . . . . . . . . . . . . . . . . . . . . . . . . . . . . . . . . . . . . . . . . . . . . . . . . . . . . . . . . . . . . . . . . . . . . .
. . . . . . . . . . . . . . . . . . . . . . . . . . . . . . . . . . . . . . . . . . . . . . . . . . . . . . . . . . . . . . . . . . . . . . . . . . . . . . . . . . . . .
. . . . . . . . . . . . . . . . . . . . . . . . . . . . . . . . . . . . . . . . . . . . . . . . . . . . . . . . . . . . . . . . . . . . . . . . . . . . . . . . . . . . . . . . .
. . . . . . . . . . . . . . . . . . . . . . . . . . . . . . . . . . . . . . . . . . . .
. . . . . . . . . . . . . . . . . . . . . . . . . . . . . . . . . . . . . . . . . . . . . . . . . . . . . . . . . . . . . . . . . . . . .
. . . . . . . . . . . . . . . . . . . . . . . . . . . . . . . . . . . . . . . . . . . . . . . . . . . . . . . . . . . . . . . . . . . . . . . . . . . . . . . . . . . . . . . . . . . . . . . . . . . . . . . . . .
. . . . . . . . . . . . . . . . . . . . . . . . . . . . . . . . . . . . . . . . . . . . . . . . . . . . . . . . . . . . . . . . . . . . . . . . . . . . . .
. . . . . . . . . . . . . . . . . . . . . . . . . . . . . . . . . . . . . . . . . . . . . . . . . . . . . .
. . . . . . . . . . . . . . . . . . . . . . . . . . . . . . . . . . . . . . . . . . . . . . . . . . . . . . . . . . . . . . . . . . .
. . . . . . . . . . . . . . . . . . . . . . . . . . . . . . . . . . . . . . . . . . . . . . . . . . . . . . . . . . . . .
. . . . . . . . . . . . . . . . . . . . . . . . . . . . . . . . . . . . . . . . . . . . . . . . . . . . . . . . . . . . . . . . . . . . . . . . . . .
. . . . . . . . . . . . . . . . . . . . . . . . . . . . . . . . . . . . . . . . . . . . . . . . . . . . . . . . . . . . . . . . . . . . . . . . . . . . . . . .
. . . . . . . . . . . . . . . . . . . . . . . . . . . . . . . . . . . . . . . . . . . . . . . . . . . . . . . . . . . . . . . . . . . . . . . . . . . . . . . . . . . .
. . . . . . . . . . . . . . . . . . . . . . . . . . . . . . . . . . . . . . . . . . . . . . . . . . . . . . . . . . . . . . . . . . . . . . . . . . . . . . . . . . . .
. . . . . . . . . . . . . . . . . . . . . .
. . . . . . . . . . . . . . . . . . . . . . . . . . . . . . . . . . . .
. . . . . . . . . . . . . . . . . . . . . . . . . . . . . . . . . . . . . . . . . . . . . . . . . . . . . . . . . . . . . . . . . . . . . . . . . . . . . . . . . . . . . .
. . . . . . . . . . . . . . . . . . . . . . . . . . . . . . . . . . . . . . . . . . . . . . . . . . . . . . . . . . . . . . . . . . . . . . . . . . . . . . . . . . . . . . . . . . . . . . . . . . .
. . . . . . . . . . . . . . . . . . . . . . . . . . . . . . . . . . . . . . . . . . . . . . . . . . . . . . . . . . . . . . . . . . . . . . . . .
. . . . . . . . . . . . . . . . . . . . . . . . . . . . . . . . . . . .
. . . . . . . . . . . . . . . . . . . . . . . . . . . . . . . . . . . . . . . . . . . . . . . . . . . . . . . . . . . .
. . . . . . . . . . . . . . . . . . . . . . . . . . . . . . . . . . . . . . . . . . . . . . . . . . . . . . . . . . . . . . . . . . . . . . . . . . . . . . . . . . . . . . .
. . . . . . . . . . . . . . . . . . . . . . . . . . . . . . . . . . . . . . . . . . . . . . . . . . . . . . . . . . . . . . . . . . . . . . . . . . . .
. . . . . . . . . . . . . . . . . . . . . . . . . . . . . . . . . . . . . . . . . . . . . . . . . . . . . . . . . . . . . . . . . . . . . . . . . .
. . . . . . . . . . . . . . . . . . . . . . . . . . . . . . . . . . . . . . . . . . . . . . . . . . . . . . . . . . . . . . . . . . . . . . . . . . .
. . . . . . . . . . . . . . . . . . . . . . . . . . . . . . . . . . . . . . . . . . . . . . . . . . . . .
. . . . . . . . . . . . . . . . . . . . . . . . . . . . . . . . . . . . . . . . . . . . . . . . . . . . . . . . . . . . . . . . . . . . . .
. . . . . . . . . . . . . . . . . . . . . . . . . . . . . . . . . . . . . . . . . . . . .
. . . . . . . . . . . . . . . . . . . . . . . . . . . . . . . . . . . . . . . . . . . .
. . . . . . . . . . . . . . . . . . . . . . . . . . . . . . . . . . . . . . . . . . . . . . . . . . . . . . . . . . . . . . . . . . . . . . . . . . . . . . . . . . . . . . . . .
. . . . . . . . . . . . . . . . . . . . . . . . . . . . . . . . . . . . . . . . . . . . . . . . . . . . . . . . . . . . .
. . . . . . . . . . . . . . . . . . . . . . . . . . . . . . . . . . . . . . . . . . . . . . . . . . . . . . . . . . . . . . . . . . . . . . . . . . .
. . . . . . . . . . . . . . . . . . . . . . . . . . . . . . . . . . . . . . . . . . . . . . . . . . . . . . . . . . . . . . . . . . . . . . . . . . . .
. . . . . . . . . . . . . . . . . . . . . . . . . . . . . . . . . . . . . . . . . . . . . . . . . . . . . . . . . . . . . . . . . . . . . . . . . . . . . . . . . . . . .. . . . . . . . . . . . . . . . . . . . . . . . . . . . . . . . . . . . . . . . . . . . . . . . . . . . . . . . . . . . . . . . .
. . . . . . . . . . . . . . . . . . . . . . . . . . . . . . . . . . . . . . . . . . . . . . . . . . . . . . . . . . . . . . . . . . . . . . . . . . . . . . . . . . . . . . . . . .. . . . . . . . . . . . . . . . . . . . . . . . . . . . . . . . . . . . . . . . . . . . . . . . . . . . . . . . . . . . . . . . . . . . . . . . . . . . . . . . . . . . .
. . . . . . . . . . . . . . . . . . . . . . . . . . . . . . . . . . . . . . . . . . . . . . . . . . . . . . . . . . . . . . . . . . . . . . . . . . . . . . . . . . . . . . .
. . . . . . . . . . . . . . . . . . . . . . . . . . . . . . . . . . . . . . . . . . . .
. . . . . . . . . . . . . . . . . . . . . . . . . . . . . . . . . . . . . . . . . . . . . . . . . . . . . . . . . . . . . . . . . . . . . . . . . . . . . . . . . . . . . .
. . . . . . . . . . . . . . . . . . . . . . . . . . . . . . . . . . . . . . . . . . . . . . . . . . . . . . . . . . . . . . . . . . . . .
. . . . . . . . . . . . . . . . . . . . . . . . . . . . . . . . . . . . . . . . . . .
. . . . . . . . . . . . . . . . . . . . . . . . . . . . . . . . . . . . . . . . . . . . . . . . . . . . . . . . . . . . . .
. . . . . . . . . . . . . . . . . . . . . . . . . . . . . . . . . . . . . . . . .

TABLE OF CONTENTvi
3 PHD GRADUATES 653.1 Profileofgraduates 66 3.1.1Demographicprofile 66 3.1.2 Distribution according to kulliyyah 66 3.1.3 Sponsorship 67 3.1.4 Employment while studying 67 3.1.5 Mode and duration of study 683.2 Evaluation of academic programmes, facilities, and services 70 3.2.1 Relevance and helpfulness of study programme 70 3.2.2 Curriculum 70 3.2.3 Acquired skills 71 3.2.4 Facilities and services 74 3.2.5 Degree and University 76 3.2.6 Advantages and disadvantages of studying at IIUM 773.3 Employmentprofile 78
4 SUMMARY, SUGGESTIONS, AND RECOMMENDATIONS 814.1 Summary 82 4.1.1 Bachelor’s degree graduates 82 4.1.2 Master’s degree graduates 85 4.1.3 PhD degree graduates 874.2 Suggestions and recommendations 88
APPENDICES 90 Appendix 1: Number of participants and total number of 2017 IIUM graduates 90
Appendix 2: Employment characteristics by undergraduate programme 91
. . . . . . . . . . . . . . . . . . . . . . . . . . . . . . . . . . . . . . . . . . . . . . . . . . . . . . . . . . . . .. . . . . . . . . . . . . . . . . . . . . . . . . . . . . . . . . . . . . . . . . . . . . . . . . . . . . . . . . . . . . . . . . . . . . . . . . . . . . . . . . . . . . . . .
. . . . . . . . . . . . . . . . . . . . . . . . . . . . . . . . . . . . . . . . . . . . . . . . . . . . . . . . . . . . . . . . . . . . .. . . . . . . . . . . . . . . . . . . . . . . . . . . . . . . . . . . . . . . . . . . . . . . . . . . . . . . . . . . . . . . . . . . . . .
. . . . . . . . . . . . . . . . . . . . . . . . . . . . . . . . . . . . . .. . . . . . . . . . . . . . . . . . . . . . . . . . . . . . . . . . . . . . . . . . . . .
. . . . . . . . . . . . . . . . . . . . . . . . . . . . . . . . . . . . . . . . . . . . . . . . . . . . . . . . . . . . . . . . . . . . . . . . . . . . . . . . . . . . . . . . .. . . . . . . . . . . . . . . . . . . . . . . . . . . . . . . . . . . . . . . . . . . . . . . . . . . . . . . . . . . . . . . . . . . . . . . . . . . . . . . . . . . . .
. . . . . . . . . . . . . . . . . . . . . . . . . . . . . . . . . . . . . . . . . . . . . . . . . . . . . . . . . . . . . . . . . . . . . . . . . . .. . . . . . . . . . . . . . . . . . . . . . . . . . . . . . . . . . . . . . . . . . . . . . . . . . . . . . . . . . . . . . . . . . . . . . . . . . . .
. . . . . . . . . . . . . . . . . . . . . . . . . . . . . . . . . . . . . . . . .
. . . . . . . . . . . . . . . . . . . . . . . . . . . . . . . . . . . . . . . . . . . . . . . . . . . . . . . . . . . . . . . . . . . . . . . . . . . . . . . . . . . . . . . . . . . . . . . . . .
. . . . . . . . . . . . . . . . . . . . . . . . . . . . . . . . . . . . . . . . . . . . . . . . . . . . . . . . . . . . . . . . . . . . . . . . . . . . . . . . . . . . . . . .
. . . . . . . . . . . . . . . . . . . . . . . . . . . . . . . . . . . . . . . . . . . . . . . . . . . . . . . . . . . . . . . . . . . . .. . . . . . . . . . . . . . . . . . . . . . . . . . . . . . . . . . . . . . . . . . . . . . . . . . . . . . . . . . . . . . . . . . . . . . .
. . . . . . . . . . . . . . . . . . . . . . . . . . . . . . . . . . . . . . . . . . . . . . . . . . . . . . . . . . . . . . . . . . . . . . . . . . . . .. . . . . . . . . . . . . . . . . . . . . . . . . . . . . . . . . . . . . . . . . . . . . . . . . . . . . . . . . . . . . . . . . . .
. . . . . . . . . . . . . . . . . . . . . . . . . . . . . . . . . . . . . . . . . . . . . . . . . . . . . . . . . . . . . . . . . . . . . . . . . . . . . . . . . . . . . . . . . . . . . . . . . .. . . . . . . . . . . . . . . .
. . . . . . . . . . . . . . . . . . . . . . . .
. . . . . . . . . . . . . . . . . . . . . . . . . . . . . . . . . . . .
. . . . . . . . . . . . . . . . . . . . . . . . . . . . . . . . . . . . . . . . . . . . . . . . . . . . . . . . . . . . . . . . . . . . . . . . . . . . . . . . . . . . . .. . . . . . . . . . . . . . . . . . . . . . . . . . . . . . . . . . . . . . . . . . . . . . . . . . . . . . . . . . . . . . . . . . . . . . . . . . . . . .
. . . . . . . . . . . . . . . . . . . . . . . . . . . . . . . . . . . . . . . . . . . . . . . . . . . . . . . . . . . . . . . . . . . . . . . . . . . . . . . . . . . . . .

vii
AIKOL : Ahmad Ibrahim Kulliyyah of LawsLLB : Bachelor of LawsLLB_S : Bachelor of Laws (Shari’ah)
KENMS : Kulliyyah of Economics and Management SciencesBACC : Bachelor of AccountingBBA : Bachelor of Business AdministrationBECS : Bachelor of EconomicsISFIN : Bachelor of Science (Islamic Finance) KICT : Kulliyyah of Information and Communication TechnologyBCS : Bachelor of Computer ScienceBIT : Bachelor of Information Technology
KIRKHS : Kulliyyah of Islamic Revealed Knowledge and Human SciencesBARB : Bachelor of Human Sciences (Arabic Language and Literature)BENL : Bachelor of Human Sciences (English Language and Literature)COMM : Bachelor of Human Sciences (Communication)HIST : Bachelor of Human Sciences (History and Civilizations)PSCI : Bachelor of Human Sciences (Political Science)PSYC : Bachelor of Human Sciences (Psychology) RKFQ : Bachelor of Islamic Revealed Knowledge and Heritage (Fiqh and Usul al-Fiqh)RKQS : Bachelor of Islamic Revealed Knowledge and Heritage (Qur’an and Sunnah Studies)RKUD : Bachelor of Islamic Revealed Knowledge and Heritage (Usul al-Din and Comparative Religion)SOCA : Bachelor of Human Sciences (Sociology and Anthropology)
KAED : Kulliyyah of Architecture and Environmental DesignAAD : Bachelor of Applied Arts and DesignALA : Bachelor of Landscape ArchitectureAQS : Bachelor of Quantity SurveyingARCH : Bachelor of Science (Architectural Studies)URP : Bachelor of Urban and Regional Planning
KOED : Kulliyyah of EducationGUIDE : Bachelor of Education (Guidance and Counselling)ISED : Bachelor of Education (Islamic Education)TAASL : Bachelor of Education (Teaching Arabic as a Second Language)TEASL : Bachelor of Education (Teaching English as a Second Language)
KAHS : Kulliyyah of Allied Health SciencesAUD : Bachelor of AudiologyBIOMD : Bachelor of Biomedical ScienceDIET : Bachelor of DieteticsOPT : Bachelor of Optometry PHYT : Bachelor of PhysiotherapyRDI : Bachelor of Radiography and Diagnostic Imaging
List of Abbreviations

LIST OF ABBREVIATIONSviii
KLM : Kulliyyah of Languages and ManagementARCOM : Bachelor of Arts (Honours) in Arabic for International Communication ENCOM : Bachelor of Arts (Honours) in English for International CommunicationTPHM : Bachelor in Tourism Planning and Hospitality Management
KOE : Kulliyyah of EngineeringAERO : Bachelor of Engineering (Aerospace)AUTOM : Bachelor of Engineering (Mechanical-Automotive)BIO : Bachelor of Engineering (Biochemical-Biotechnology)CIE : Bachelor of Engineering (Electronics-Computer and Information)COMEG : Bachelor of Engineering (Communication)MATER : Bachelor of Engineering (Materials)MCT : Bachelor of Engineering (Mechatronics)MFG : Bachelor of Engineering (Manufacturing)
KOS : Kulliyyah of ScienceBSMS : Bachelor of Biomedical ScienceBSBT : Bachelor of BiotechnologyCHEM : Bachelor of Science (Applied Chemistry) PHYS : Bachelor of Science (Physics)
KOM : Kulliyyah of MedicineMBBS : Bachelor of Medicine and Bachelor of Surgery
KOP : Kulliyyah of PharmacyPMACY : Bachelor of Pharmacy
KON : Kulliyyah of NursingNURS : Bachelor of Nursing
KOD : Kulliyyah of DentistryDENT : Bachelor of Dental Surgery

ix
Figure 1.1 Graduates by gender and origin 4Figure 1.2 Malaysian graduates by state of origin. 4Figure 1.3 Graduates by family income 5Figure 1.4 Graduates by kulliyyah 5Figure 1.5 Graduates by sponsorship 6Figure 1.6 Graduates by mode of study 6Figure1.7 Graduatesbyentryqualification 7Figure 1.8 Graduates by CGPA 7Figure 1.9 Graduates by class of degree 7Figure 1.10 Mean CGPA by kulliyyah 8Figure 1.11 Mean CGPA of Malaysian graduates by sponsorship 8Figure 1.12 Mean CGPA of non-Malaysian graduates by sponsorship 8Figure 1.13 Co-curricular involvement by gender 9Figure 1.14 Graduates by internship placement 10Figure 1.15 Graduates by internship duration 10Figure 1.16 Graduates by internship allowance 10Figure 1.17 Relevance and helpfulness of study programmes by kulliyyah 12Figure1.18 Languageproficiencybykulliyyah 17Figure 1.19 Evaluation of library facilities and services 18Figure 1.20 Evaluation of other facilities and services 18Figure 1.21 Worthwhileness of degree 22Figure 1.22 Willingness to recommend IIUM to others 22Figure 1.23 Evaluation of aspects of Islamisation by kulliyyah 23Figure 1.24 Advantages of studying at IIUM 24Figure 1.25 Demand for additional training 24Figure 1.26 Demand for additional training by kulliyyah 25Figure 1.27 Preferred training programme by kulliyyah 25Figure 1.28 Disadvantages of studying at IIUM 25Figure 1.29 Overview of employment characteristics 26Figure 1.30 Employment category by gender 27Figure 1.31 Employment category by kulliyyah 29Figure 1.32 Reasons for not participating in the labour force 30Figure 1.33 Graduates by type of employment status 31Figure 1.34 Employment status by type of occupation 31Figure 1.35 Type of occupation by employment type 31Figure 1.36 Type of occupation, employment status, and gender 32Figure 1.37 Mean monthly income by kulliyyah. (.) number of observations 34Figure 1.38 Total monthly income (including allowance) by employment status 36Figure 1.39 Top criteria in searching for a job among those not working 36Figure 2.1 Graduates by gender and origin 44Figure 2.2 Graduates by kulliyyah 44Figure 2.3 Graduates by sponsorship 45Figure 2.4 Employment while studying 45Figure 2.5 Graduates by mode of study 46Figure 2.6 Graduates by programme mode of study 46Figure 2.7 Relevance and helpfulness of study programmes 49
FIGURES
. . . . . . . . . . . . . . . . . . . . . . . . . . . . . . . . . . . . . . . . . . . . . . . . . . . . . . . . . . . . . . . .
. . . . . . . . . . . . . . . . . . . . . . . . . . . . . . . . . . . . . . . . . . . . . . . . . . . . . . . . . . . . . . . . .
. . . . . . . . . . . . . . . . . . . . . . . . . . . . . . . . . . . . . . . . . . . . . . . . . . . . . . . . . . . . .
. . . . . . . . . . . . . . . . . . . . . . . . . . . . . . . . . . . . . . . . . . . . . . . . . .
. . . . . . . . . . . . . . . . . . . . . . . . . . . . . . . . . . . . . . .
. . . . . . . . . . . . . . . . . . . . . . . . . . . . . . . . . . . . . . . . . . . . . . . . . . . . . . . . . . . . . . . . . .
. . . . . . . . . . . . . . . . . . . . . . . . . . . . . . . . . . . . . . . . . . . . . . . . . . . . . . . . . . . . . . . . . . . . . .
. . . . . . . . . . . . . . . . . . . . . . . . . . . . . . . . . . . . . . . . . . . . . . . . . . . . . . . . . .
. . . . . . . . . . . . . . . . . . . . . . . . . . . . . . . . . . . . . . . . . . . . . . . . . . .
. . . . . . . . . . . . . . . . . . . . . . . . . . . . . . . . . . . . . . . . . . . . . . . . . . . . . . . . . . . .
. . . . . . . . . . . . . . . . . . . . . . . . . . . . . . . . . . . . . . . . . . . . . . . . . . . . . . . . . . . . . . . .
. . . . . . . . . . . . . . . . . . . . . . . . . . . . . . . . . . . . . . . . . . . . . . . . . . . . . . . . . . . . . . . . . . . .
. . . . . . . . . . . . . . . . . . . . . . . . . . . . . . . . . . . . . .
. . . . . . . . . . . . . . . . . . . . . . . . . . . . . . . . . . . . . . . . . . . . . . . . . . .
. . . . . . . . . . . . . . . . . . . . . . . . . . . . . . . . . . . . . . . . . . . . . . . . . . . . . .
. . . . . . . . . . . . . . . . . . . . .
. . . . . . . . . . . . . . . . . . . . . . . . . . . . . . . . . . . . . . . . . .
. . . . . . . . . . . . . . . . . . . . . . . . . . . . . . . . . . . . . . . . . . . . . . . . . . . . . . . . . . . . . . .
. . . . . . . . . . . . . . . . . . . . . . . . . . . . . . . . . . . . . . . . . . . . . . . . . . . . . . . . . . . . .
. . . . . . . . . . . . . . . . . . . . . . . . . . . . . . . . . . . . . . . . . . . . . . . . . . . . . . . . . . . . . . .
. . . . . . . . . . . . . . . . . . . . . . . . . . . . . . . . . . . . . . . . . . . . . . . . . . . .
. . . . . . . . . . . . . . . . . . . . . . . . . . . . . . . . . . . . . . . . . . . . . . . . . . . . . . . . . . . . . . . . . . . . . .
. . . . . . . . . . . . . . . . . . . . . . . . . . . . . . . . . . . . . . . . . . . . . . . . . . . . . .
. . . . . . . . . . . . . . . . . . . . . . . . . . . . . . . . . . . . . . . . . . . . . . . . . . . . . . . . . . . . . . . . . . . . . . . .
. . . . . . . . . . . . . . . . . . . . . . . . . . . . . . . . . . . . . . . . . . . . . . . . .
. . . . . . . . . . . . . . . . . . . . . . . . . . . . . . . . . . . . . . . . . . . . . . . . . . . . . . . . . . .
. . . . . . . . . . . . . . . . . . . . . . . . . .
. . . . . . . . . . . . . . . . . . . . . . . . . . . . . . . . . . . . . . . . . . . . . . . . . . .
. . . . . . . . . . . . . . . . . . . . . . . . . . . . . . . . . . . . . . . . . . . . . . . . . . . . . . . . . . . . . . . . . . . .
. . . . . . . . . . . . . . . . . . . . . . . . . . . . . . . . . . . . . . . . . . . . . . . . . . . . . . . . . .
. . . . . . . . . . . . . . . . . . . . . . . . . . . . . . . . . . . . . . . . .
. . . . . . . . . . . . . . . . . . . . . . . . . . . . . . . . . . . . . . . . . . .
. . . . . . . . . . . . . . . . . . . . . . . . . . . . . . . . . . . . . . . . . . . . . . . . . . . . . . . . . . . . . . . . . . . . . . . . . .
. . . . . . . . . . . . . . . . . . . . . . . . . . . . . . . . . . . . . . . . . . . . . . . . . . . . . . . . . . . . . . . . . . . . . . . . . .
. . . . . . . . . . . . . . . . . . . . . . . . . . . . . . . . .
. . . . . . . . . . . . . . . . . . . . . . . . . . . . . . . . . . . . . . . . . . . . . . . . . . . . . . . . . . . . . . . . . . . . . .
. . . . . . . . . . . . . . . . . . . . . . . . . . . . . . . . . . . . . . . . . . . . . . . . . . . . . . . . . . . . . . .
. . . . . . . . . . . . . . . . . . . . . . . . . . . . . .
. . . . . . . . . . . . . . . . . . . . . . . . . . . . . . . . . . . . . . . . . . . . . . . . . . . . . . . . . . . . . . . . . . . . . . . . . . . . . .
. . . . . . . . . . . . . . . . . . . . . . . . . . .
. . . . . . . . . . . . . . . . . . . . . . . . . . . . . . . . . . . . . . . . . . . . . . . . .
. . . . . . . . . . . . . . . . . . . . . . . . . . . . . . . . . . . . . . . . . . . . . . . . . . . . .
. . . . . . . . . . . . . . . . . . . . . . . . . . . . . . . . . . . . . . . . . . . . . . . . . . . . . . . . . . .
. . . . . . . . . . . . . . . . . . . . . . . . . . . . . . . . . . . . . . . . . . . . . . . . . . . . . . . . . . . . . . .
. . . . . . . . . . . . . . . . . . . . . . . . . . . . . . . . . . . . . . . . . . . . . . . . . .
. . . . . . . . . . . . . . . . . . . . . . . . . . . . . . . . . . . . . . . . . . . . . . . . . . . . . . . . . . . . . . . . . . .

FIGURESx
Figure2.8 Languageproficiencybykulliyyah 52Figure 2.9 Evaluation of career guidance services 52Figure 2.10 Evaluation of library facilities and services 52Figure 2.11 Evaluation of other facilities and services 53Figure 2.12 Worthwhileness of degree 55Figure 2.13 Willingness to recommend IIUM to others 55Figure 2.14 Evaluation of aspects of Islamisation by kulliyyah 56Figure 2.15 Advantages of studying at IIUM 57Figure 2.16 Disadvantages of studying at IIUM 57Figure 2.17 Graduates by type of occupation 60Figure 2.18 Employed graduates by economic sector 60Figure 2.19 Total monthly income by type of occupation 61Figure 2.20 Employed Malaysian graduates by type of employment status 62Figure 2.21 Employed non-Malaysian graduates by type of employment status 62Figure 2.22 Total monthly income by employment status 62Figure 3.1 Graduates by gender 66Figure 3.2 Graduates by kulliyyah 66Figure 3.3 Graduates by sponsorship 67Figure 3.4 Employment while studying 67Figure 3.5 Graduates by mode of study 68Figure 3.6 Graduates by programme mode of study 68Figure 3.7 Relevance and helpfulness of study programmes 70Figure3.8 Languageproficiencybykulliyyah 73Figure 3.9 Evaluation of library facilities and services 74Figure 3.1 Evaluation of other facilities and services 74Figure 3.11 Worthwhileness of degree 76Figure 3.12 Willingness to recommend IIUM to others 76Figure 3.13 Advantages of studying at IIUM 76Figure 3.14 Disadvantages of studying at IIUM 77Figure 3.15 Employed graduates by type of employment status 80Figure 3.16 Employed graduates by employment sector 80Figure 3.17 Employed graduates by economic sector 80
. . . . . . . . . . . . . . . . . . . . . . . . . . . . . . . . . . . . . . . . . . . . . . . . . . . . . .
. . . . . . . . . . . . . . . . . . . . .
. . . . . . . . . . . . . . . . . . . . . . . . . . . . . . . . . . . . . . . . . . . . . . . . . . . . . . . . . . . . . . . . . . . . . .
. . . . . . . . . . . . . . . . . . . . . . . . . . . . . . . . . . . . . . . . . . . . . . . . . . . . . . . . . . . . . .
. . . . . . . . . . . . . . . . . . . . . . . . . . . . . . . . . . . . . . . . .
. . . . . . . . . . . . . . . . . . . . . . . . . . . . . . . . . . . . . . . . . . . . . . . . . . .
. . . . . . . . . . . . . . . . . . . . . . . . . . . . . . . . . . . . . . . . . . . . . . . . . . . . . . . . . . . . . . . . . . . . .
. . . . . . . . . . . . . . . . . . . . . . . . . . . . . . . . . . . . . . .
. . . . . . . . . . . . . . . . . . . . . . . . . . . . . . . . . . . . . . . . . . . . . . . . . . .
. . . . . . . . . . . . . . . . . . . . . . . . . . . . . . . . . . . . . . . . . . . . . . . . . . . . . . . . . . . . . . . . . . . . . . . . . . . .
. . . . . . . . . . . . . . . . . . . . . . . . . . . . . . . . . . . . . . . . . . . . . . . . . . . . . . . . . . . . . . .
. . . . . . . . . . . . . . . . . . . . . . . . . . . . . . . . . . . . . . . . . . . . . . .
. . . . . . . . . . . . . . . . . . . . . . . . . . . . . . . . . . . . . . . . . . . . . . . . .
. . . . . . . . . . . . . . . . . . . . . . . . . . . . . . . . . . . . . . . . . . . . . . . . . . . . . . . . . . . . . . .
. . . . . . . . . . . . . . . . . . . . . . . . . . . . . . . . . . . . . . . . . . . . . . . . . . . . . . . . . . . . . . . . . . .
. . . . . . . . . . . . . . . . . . . . . . . . . . . . . . . . . . . . . . . . . . . . . . . . . . .
. . . . . . . . . . . . . . . . . . . . . . . . . . . . . . . . . . . . . . . . . . . . . . . . .
. . . . . . . . . . . . . . . . . . . . . . . . . . . . . . . . . . . . . . . . . . . . . .
. . . . . . . . . . . . . . . . . . . . . . . . . . . . . . . . . . . . . . . . . . . . . . . . . .
. . . . . . . . . . . . . . . . . . . . . . . . . . . . . . . . . . . . . . . . . . . . . . . . . . .
. . . . . . . . . . . . . . . . . . . . . . . . . . . . . . . . . . . . . . . . . . . . . . . . . . . . . . . . . . . .
. . . . . . . . . . . . . . . . . . . . . . . . . . . . . . . . . . . . . . . . .
. . . . . . . . . . . . . . . . . . . . . . . . . . . . . . . . . . . . . . . . . . . . . . . . . . . . . . . . . . . . . . . . . . .
. . . . . . . . . . . . . . . . . . . . . . . . . . . . . . . . . . . . . . . . . . . . . . . .
. . . . . . . . . . . . . . . . . . . . . . . . . . . . . . . . . . . . . . . . . . . . . . . . . . . . . . . . . . . . . . . . . . . . . .
. . . . . . . . . . . . . . . . . . . . . . . . . . . . . . . . . . . . . . . . . . . . . . . . . . . . . . . . . . . . . . . . . . . . . . . . .
. . . . . . . . . . . . . . . . . . . . . . . . . . . . . . . . . . . . . . . . . . . . . . . . . . . . . . . . . .
. . . . . . . . . . . . . . . . . . . . . . . . . . . . . . . . . . . . . . . . . . . . . . . . . . . . . . . . . . . .
. . . . . . . . . . . . . . . . . . . . . . . . . .
. . . . . . . . . . . . . . . . . . . . . . . . . . . . . . . . . . . . . . . . . . . . . . . . . .
. . . . . . . . . . . . . . . . . . . . . . . . . . . . . . . . . . . . . . . . . . . . . . . . . . . . . . . . . . .
. . . . . . . . . . . . . . . . . . . . . . . . . . . . . . . . . . . . . . . . . . . . . . . . . . .

xi
Table 1.1 Non-Malaysian graduates by country of origin 4Table 1.2 Co-Curricular involvement by activity 9Table 1.3 Determinants of academic achievement (CGPA) by kulliyyah 11Table 1.4 Evaluation of curriculum by kulliyyah 13Table 1.5 Top ICT skills by kulliyyah 15Table 1.6 Soft skills by kulliyyah 16Table 1.7 Life skills by kulliyyah 16Table 1.8 Evaluation of career guidance services by kulliyyah 17Table 1.9 Evaluation of facilities and services by kulliyyah, IIUM Tracer Study 20Table 1.10 Worthwhileness of degree by kulliyyah 22Table 1.11 Willingness to recommend IIUM to others by kulliyyah 23Table 1.12 Employment characteristics by kulliyyah and gender 28Table 1.13 Top economic sectors by kulliyyah 33Table 1.14 Characteristics of different employment statuses 35Table1.15 Durationofwaitingforthefirstjob 37Table 1.16 Determinants of duration until getting full-time job by kulliyyah 39Table 1.17 Determinants of monthly income from employment by kulliyyah 42Table 2.1 Duration of study by mode of study 47Table 2.2 Duration of study by mode of study and kulliyyah 48Table 2.3 Evaluation of curriculum by kulliyyah 50Table 2.4 Top ICT skills by kulliyyah 50Table 2.5 Soft skills by kulliyyah 51Table 2.6 Life skills by kulliyyah 51Table 2.7 Evaluation of facilities and services, IIUM Tracer Study 54Table 2.8 Worthwhileness of degree by kulliyyah 55Table 2.9 Willingness to recommend IIUM to others by kulliyyah 56Table 2.10 Key employment statistics 58Table 2.11 Employment characteristics by kulliyyah and gender 59Table 2.12 Determinants of monthly income from employment 63Table 3.1 Duration of study by mode of study 69Table 3.2 Duration of study by mode of study and kulliyyah 69Table 3.3 Evaluation of curriculum by kulliyyah 71Table 3.4 Soft skills by kulliyyah 72Table 3.5 Life skills by kulliyyah 73Table 3.6 Evaluation of facilities and services, IIUM Tracer Study 75Table 3.7 Worthwhileness of degree by kulliyyah 76Table 3.8 Willingness to recommend IIUM to others by kulliyyah 77Table 3.9 Employment characteristics by kulliyyah and nationality 79
. . . . . . . . . . . . . . . . . . . . . . . . . . . . . . . . . . . . . . . . . . . . .. . . . . . . . . . . . . . . . . . . . . . . . . . . . . . . . . . . . . . . . . . . . . . . . . . . . . . . .
. . . . . . . . . . . . . . . . . . . . . . . . . . . . . . . . . . . . . . . . . . . . . . . . . . . . . . . .. . . . . . . . . . . . . . . . . . . . . . . . . . . . . . . . . . . . . . . . . . . . . . . . . . . . . . . . . . . . . . . . . . . . .
. . . . . . . . . . . . . . . . . . . . . . . . . . . . . . . . . . . . . . . . . . . . . . . . . . . . . . . . . . . . . . . . . . . . . . . . .. . . . . . . . . . . . . . . . . . . . . . . . . . . . . . . . . . . . . . . . . . . . . . . . . . . . . . . . . . . . . . . . . . . . . . . . . .
. . . . . . . . . . . . . . . . . . . . . . . . . . . . . . . . . . . . . . .. . . . . . . . . . . . . . . . . . . .
. . . . . . . . . . . . . . . . . . . . . . . . . . . . . . . . . . . . . . . . . . . . . . . . . . . . .. . . . . . . . . . . . . . . . . . . . . . . . . . . . . . . . . . .
. . . . . . . . . . . . . . . . . . . . . . . . . . . . . . . . . . . . .. . . . . . . . . . . . . . . . . . . . . . . . . . . . . . . . . . . . . . . . . . . . . . . . . . . . . . . . . .
. . . . . . . . . . . . . . . . . . . . . . . . . . . . . . . . . . . . . . . . .. . . . . . . . . . . . . . . . . . . . . . . . . . . . . . . . . . . . . . . . . . . . . . . . . . . . . . . . . .
. . . . . . . . . . . . . . . . . . . . . . . . .. . . . . . . . . . . . . . . . . . . . . . . .
. . . . . . . . . . . . . . . . . . . . . . . . . . . . . . . . . . . . . . . . . . . . . . . . . . . . . . . . . .. . . . . . . . . . . . . . . . . . . . . . . . . . . . . . . . . . . . . . . . .
. . . . . . . . . . . . . . . . . . . . . . . . . . . . . . . . . . . . . . . . . . . . . . . . . . . . . . . .. . . . . . . . . . . . . . . . . . . . . . . . . . . . . . . . . . . . . . . . . . . . . . . . . . . . . . . . . . . . . . . . . . . . . .
. . . . . . . . . . . . . . . . . . . . . . . . . . . . . . . . . . . . . . . . . . . . . . . . . . . . . . . . . . . . . . . . . . . . . . . . .. . . . . . . . . . . . . . . . . . . . . . . . . . . . . . . . . . . . . . . . . . . . . . . . . . . . . . . . . . . . . . . . . . . . . . . . . .
. . . . . . . . . . . . . . . . . . . . . . . . . . . . . . . . . .. . . . . . . . . . . . . . . . . . . . . . . . . . . . . . . . . . . . . . . . . . . . . . . . . . . . . .
. . . . . . . . . . . . . . . . . . . . . . . . . . . . . . . . . . . .. . . . . . . . . . . . . . . . . . . . . . . . . . . . . . . . . . . . . . . . . . . . . . . . . . . . . . . . . . . . . . . . . . . .
. . . . . . . . . . . . . . . . . . . . . . . . . . . . . . . . . . . . .. . . . . . . . . . . . . . . . . . . . . . . . . . . . . . . . . . . . . .
. . . . . . . . . . . . . . . . . . . . . . . . . . . . . . . . . . . . . . . . . . . . . . . . . . . . . . . . . .. . . . . . . . . . . . . . . . . . . . . . . . . . . . . . . . . . . . . . . . . .
. . . . . . . . . . . . . . . . . . . . . . . . . . . . . . . . . . . . . . . . . . . . . . . . . . . . . . . .. . . . . . . . . . . . . . . . . . . . . . . . . . . . . . . . . . . . . . . . . . . . . . . . . . . . . . . . . . . . . . . . . . . . . . . . .
. . . . . . . . . . . . . . . . . . . . . . . . . . . . . . . . . . . . . . . . . . . . . . . . . . . . . . . . . . . . . . . . . . . . . . . . . .. . . . . . . . . . . . . . . . . . . . . . . . . . . . . . . . . .
. . . . . . . . . . . . . . . . . . . . . . . . . . . . . . . . . . . . . . . . . . . . . . . . . . . . . .. . . . . . . . . . . . . . . . . . . . . . . . . . . . . . . . . . .
. . . . . . . . . . . . . . . . . . . . . . . . . . . . . . . . .
. . . . . . . . . . . . . . . . . . . . . . . . . . . .
TABLES


1
viii
INTRODUCTION
The Ministry of Higher Education (now Ministry
of Education) conducts the online tracer study
annually on university graduates to obtain
information about their employment, evaluation
of the curriculum, facilities, and services provided
by their respective universities, and other related
matters. The graduates taking part in the survey
each year are those who attend their convocation
in that year. The graduates’ personal information
and courses pursued are provided by the
respective universities and uploaded to the
system prior to the conduct of the survey. All
graduates who wish to attend their convocation
are required to partake in the survey, which
normally starts two to three weeks before and
ends one week after the convocation. The data
collected will then be given to the respective
universities for analysis.1
Like previous years, the Graduate Tracer Study
2017 questionnaire consists of seven parts (A-G).
Part A contains the graduate’s background
information and questions about: (i) challenges
encountered by graduates with disabilities, (ii)
involvement in co-curricular activities, and (iii)
industrial training or internship. Part B comprises
only one question about the graduate’s current
employment status. If the graduate is working at
the time of the survey, they are required to answer
part C, which relates to their employment status,
occupation, income, and other work-related
information.
Graduates who are not working at the time of the
survey are asked to respond to questions in part
D, which ask their reason for not working, job
1 All matters pertaining to the tracer study for IIUM is managed by the Alumni Relations Division.
search, and preferences. Those who are furthering
their studies are asked to complete part E of the
questionnaire. All graduates are asked to
complete Parts F and G, which pertain to their
evaluation of the programmes, services offered by
the University, and the effectiveness of the study
programmes in developing their “self-readiness”
to life after graduation.
Beside the study conducted by the Ministry, IIUM
also carried out a supplementary survey, the
IIUM Tracer Study 2017, on the same graduates.
The survey includes more questions on the
evaluation of the academic programmes,
involvement in student activities, and facilities
and services provided by the University. Several
open-ended questions on the advantages and
disadvantages of studying at IIUM are also
included.
A total of 4,686 IIUM graduates took part in the
two surveys. Analyses of the data obtained from
these surveys are presented in this report. Some
of the information obtained from the IIUM survey
that is redundant—as they are covered in the
ministry survey—are omitted from the report.
Also, this report does not include analysis of
graduates with disabilities as the sample size is
too small to provide a meaningful conclusion and
interpretation.
This report consists of four parts. The first three
parts comprise corresponding analyses for the
bachelor’s (Part 1), master’s (Part 2), and PhD
(Part 3) degree graduates. Each part consists of
three sections. The first section presents the

2INTRODUCTION
ix
profile of the graduates who took part in the
survey. The second section presents their
evaluation of the academic programmes, the skills
that they have acquired, factors affecting their
academic performance, and the facilities and
services provided by the University. The last
section analyses the graduates’ employment
status and profile as well as the factors that
contribute to the duration before getting full-time
employment and the level of income. The fourth
and last part of the report summarizes the
findings and offers some suggestions and
recommendations.
This report endeavours to provide an accurate
presentation of the state of affairs of IIUM
graduates. It is hoped that this effort will be
beneficial in contributing towards the planning
and formulation of strategies and action plans in
the University’s pursuit to achieve its noble vision
and missions.

BACHELOR’S DEGREE GRADUATES
1PART

IIUM TRACER STUDY 20174
2
1.1 Profile of graduates
1.1.1 Demographic profile
Figure 1.1 Graduates by gender and origin
A total of 3,964 bachelor’s degree graduates took
part in the Graduate Tracer Study 2017 upon the
33rd IIUM Convocation.
The majority (93.6 per cent) of the graduates were
Malaysian. In terms of gender, 61.6 per cent of all
graduates were female and Malaysian. Females
outnumbered males among both Malaysian and
non-Malaysian graduates (see Figure 1.1 above).
Among the 3,709 Malaysian graduates, the most
were from Selangor (33.3 per cent), followed by
Kelantan (10.7 per cent), and WP Kuala Lumpur
(8.7 per cent) (see Figure 1.2 below).
Figure 1.2 Malaysian graduates by state of origin.
Most of the 255 non-Malaysian graduates were
from Southeast Asian countries such as Singapore
(20.8 per cent), Indonesia (12.9 per cent), and
Thailand (8.6 per cent) (see Table 1.1 below).
Table 1.1 Non-Malaysian graduates by country of origin
Country % Country % Singapore 20.8 China 2.4 Indonesia 12.9 India 2.4 Thailand 8.6 Afghanistan 1.6 Bangladesh 6.3 Vietnam 1.6 Saudi Arabia 6.3 Yemen 1.2 Brunei, Maldives, Sri Lanka, Sudan, Syria, Tajikistan, Tanzania, Turkey, UAE 2 graduates each Algeria, Bosnia Herzegovina, Chad, Comoros, Egypt, Kenya, Kuwait, Kyrgyzstan, Laos, Mali, Mauritius, Oman, Somalia, Botswana 1 graduate each
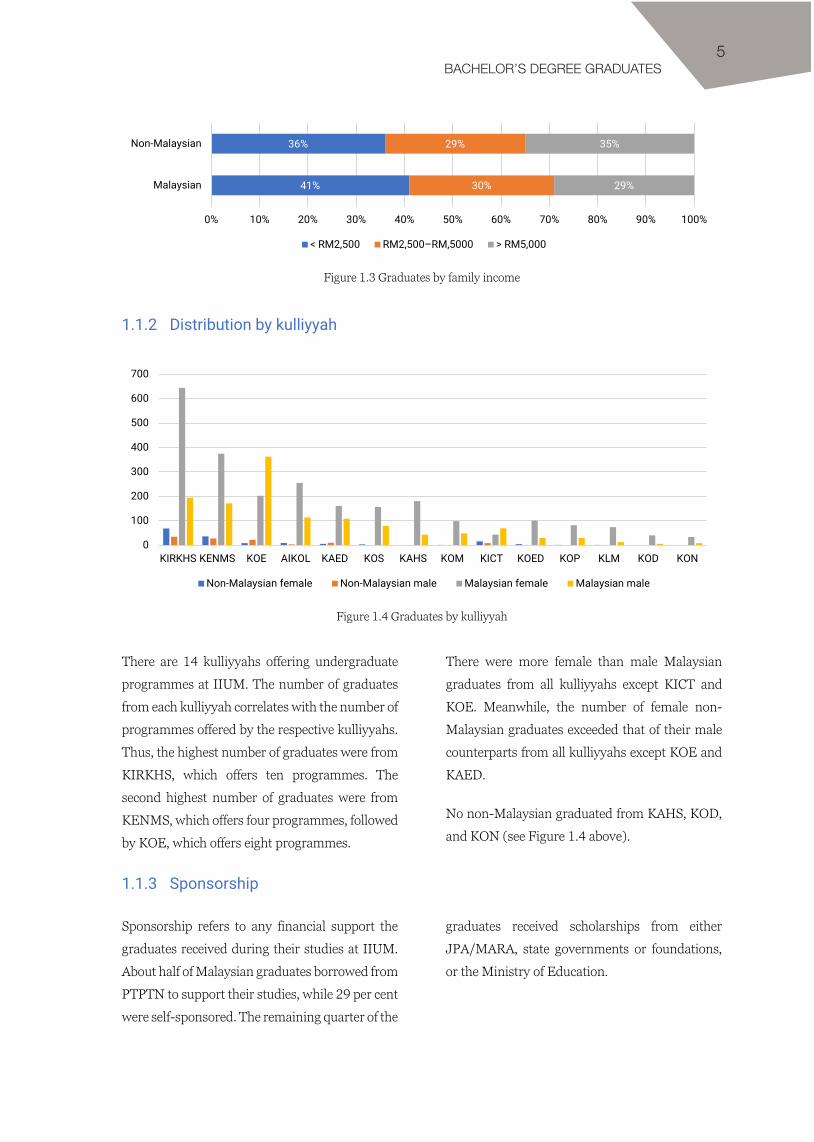
Family income refers to total family monthly
income. Among Malaysian graduates, 41 per cent
were from low-income families earning below
RM2,500 while the rest came equally from
middle-income families earning between
RM2,500 and RM5,000 and higher-income
families earning more than RM5,000 a month.
On the other hand, 36 per cent of non-Malaysian
graduates were from low-income families while
slightly more of the remaining non-Malaysian
graduates came from higher-income (35 per cent)
than middle-income (29 per cent) families (see
Figure 1.3 below).
61.6%
32.0%
3.8%2.6%
Malaysian female
Malaysian male
Non-MalaysianfemaleNon-Malaysian male
3,964graduates
33.3%
10.7%8.7%7.4%
7.0%
7.0%
6.2%
5.2%
SelangorKelantanWP Kuala LumpurTerengganuJohorPahangKedahPerakPenangNegeri SembilanMelakaSarawakSabahWP PutrajayaPerlisWP Labuan
3,709Malaysiangraduates
BACHELOR’S DEGREE GRADUATES5
3
Figure 1.3 Graduates by family income
1.1.2 Distribution by kulliyyah
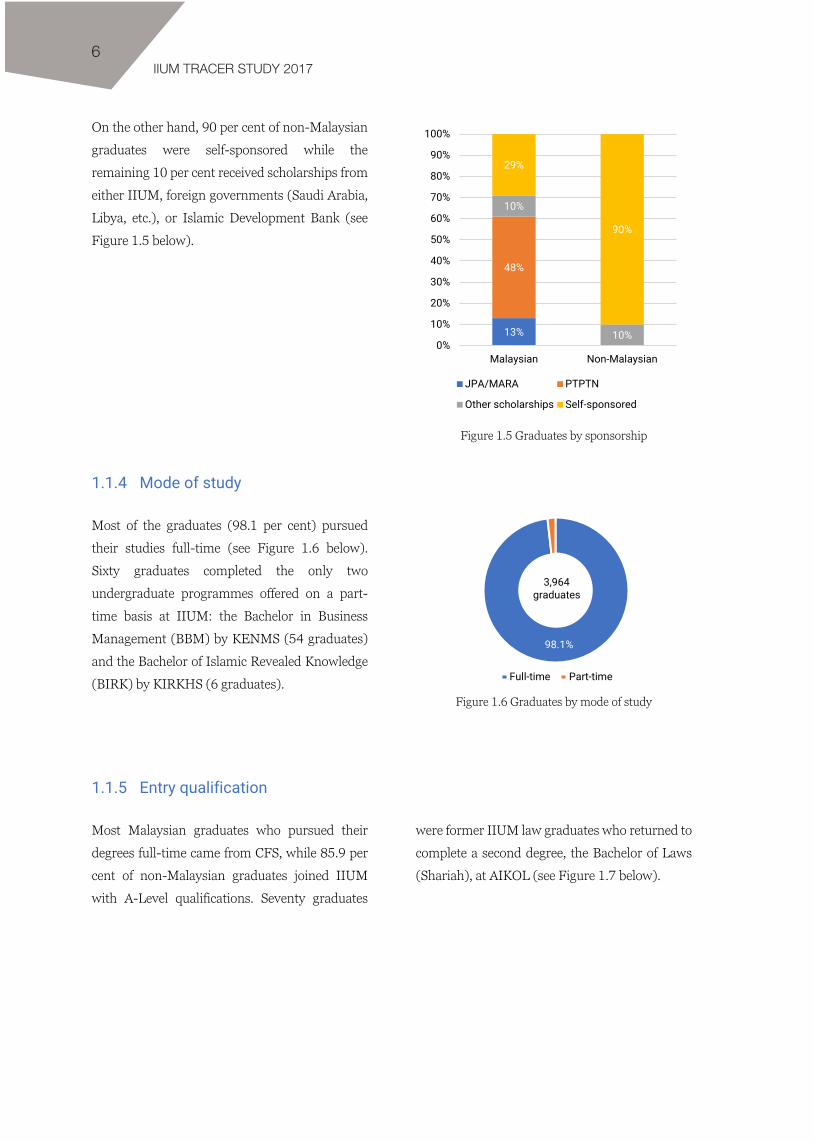
Figure 1.4 Graduates by kulliyyah
There are 14 kulliyyahs offering undergraduate
programmes at IIUM. The number of graduates
from each kulliyyah correlates with the number of
programmes offered by the respective kulliyyahs.
Thus, the highest number of graduates were from
KIRKHS, which offers ten programmes. The
second highest number of graduates were from
KENMS, which offers four programmes, followed
by KOE, which offers eight programmes.
There were more female than male Malaysian
graduates from all kulliyyahs except KICT and
KOE. Meanwhile, the number of female non-
Malaysian graduates exceeded that of their male
counterparts from all kulliyyahs except KOE and
KAED.
No non-Malaysian graduated from KAHS, KOD,
and KON (see Figure 1.4 above).
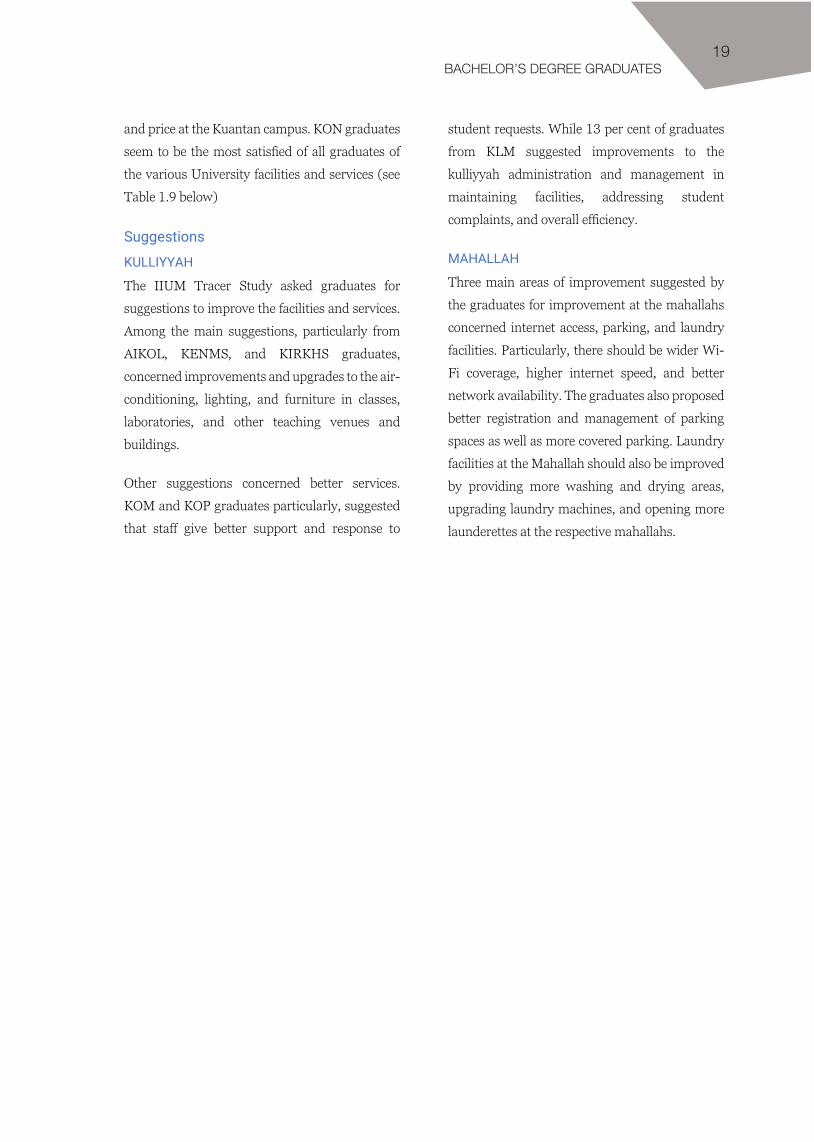
1.1.3 Sponsorship
Sponsorship refers to any financial support the
graduates received during their studies at IIUM.
About half of Malaysian graduates borrowed from
PTPTN to support their studies, while 29 per cent
were self-sponsored. The remaining quarter of the
graduates received scholarships from either
JPA/MARA, state governments or foundations,
or the Ministry of Education.
41%
36%
30%
29%
29%
35%
0% 10% 20% 30% 40% 50% 60% 70% 80% 90% 100%
Malaysian
Non-Malaysian
< RM2,500 RM2,500–RM,5000 > RM5,000
0
100
200
300
400
500
600
700
KIRKHS KENMS KOE AIKOL KAED KOS KAHS KOM KICT KOED KOP KLM KOD KON
Non-Malaysian female Non-Malaysian male Malaysian female Malaysian male
IIUM TRACER STUDY 20176
4
On the other hand, 90 per cent of non-Malaysian
graduates were self-sponsored while the
remaining 10 per cent received scholarships from
either IIUM, foreign governments (Saudi Arabia,
Libya, etc.), or Islamic Development Bank (see
Figure 1.5 below).
Figure 1.5 Graduates by sponsorship
1.1.4 Mode of study
Most of the graduates (98.1 per cent) pursued
their studies full-time (see Figure 1.6 below).
Sixty graduates completed the only two
undergraduate programmes offered on a part-
time basis at IIUM: the Bachelor in Business
Management (BBM) by KENMS (54 graduates)
and the Bachelor of Islamic Revealed Knowledge
(BIRK) by KIRKHS (6 graduates).
Figure 1.6 Graduates by mode of study
1.1.5 Entry qualification
Most Malaysian graduates who pursued their
degrees full-time came from CFS, while 85.9 per
cent of non-Malaysian graduates joined IIUM
with A-Level qualifications. Seventy graduates
were former IIUM law graduates who returned to
complete a second degree, the Bachelor of Laws
(Shariah), at AIKOL (see Figure 1.7 below).
13%
48%
10%
10%
29%
90%
0%
10%
20%
30%
40%
50%
60%
70%
80%
90%
100%
Malaysian Non-Malaysian
JPA/MARA PTPTN
Other scholarships Self-sponsored
98.1%
Full-time Part-time
3,964graduates

BACHELOR’S DEGREE GRADUATES7
5
Figure 1.7 Graduates by entry qualification
1.1.6 Academic performance
Academic performance is measured in terms of
the Cumulative Grade Point Average (CGPA).
The mean CGPA of male and female Malaysian
graduates were 2.95 and 3.12, respectively.
Among non-Malaysian graduates, the mean
CGPA for male and female were 3.01 and 3.12,
respectively (see Figure 1.8 below).2
Figure 1.8 Graduates by CGPA
IIUM awards three classes of degrees: first class
(CGPA > 3.60), upper second class (CGPA 2.80–
3.59), and lower second class (2.00–2.79). Of the
3,709 Malaysian graduates, five per cent obtained
first class degrees compared to fifteen per cent of
2 The difference in the average performance of male and female graduates is significant (p-value = 0.000).
the 255 non-Malaysian graduates. More than half
of both Malaysian and non-Malaysian graduates
obtained upper second-class degrees (see Figure
1.9 below).
Figure 1.9 Graduates by class of degree
Graduates from KOED registered the highest
mean CGPA (3.39), followed by KLM (3.38) and
27.8% 5.6%
8.8%
33.3%
85.9%
66.7%
87.4%
33.3%
33.3%
0% 10% 20% 30% 40% 50% 60% 70% 80% 90% 100%
Malaysian full-time
Non-Malaysian full-time
Malaysian part-time
Non-Malaysian part-time
SPM O-LevelSTPM STAMDiploma A-LevelCFS First/bachelor's degreePKPG Work experience/professional certificate
3.12
2.95
3.01
3.12
2.8 2.9 3 3.1 3.2
Malaysian female
Malaysian male
Non-Malaysian female
Non-Malaysian male
5%15%
72% 54%
23%31%
0%
10%
20%
30%
40%
50%
60%
70%
80%
90%
100%
Malaysian Non-Malaysian
First class Upper second class Lower second class

IIUM TRACER STUDY 20178
6
KAHS (3.31). The lowest mean CGPA was
registered by graduates from KOE (2.85), AIKOL
(2.97), and KOP (3.03). There is no CGPA for
KOM and KOD (see Figure 1.10 below).
Figure 1.10 Mean CGPA by kulliyyah
Graduates with scholarships performed better
than graduates who were either self-sponsored or
PTPTN borrowers. The mean CGPA of
JPA/MARA scholarship recipients was 3.31
compared to 2.99 among PTPTN borrowers (see
Figure 1.11 below).3 Similarly, the mean CGPA of
non-Malaysian graduates with scholarships was
3.25 compared to 3.06 among self-sponsored
graduates (see Figure 1.12 below).4
Figure 1.11 Mean CGPA of Malaysian graduates by
sponsorship
Figure 1.12 Mean CGPA of non-Malaysian graduates
by sponsorship
3 The difference in the average performance of Malaysian graduates who were JPA/MARA scholars, recipient of other scholarships, self-sponsored, and PTPTN borrowers is significant (p-value < 0.05).
4 The difference in the average performance of non-Malaysian graduates who were scholarship recipients and self-sponsored is significant (p-value < 0.05).
3.39
3.38
3.31
3.27
3.26
3.11
3.07
3.06
3.04
3.03
2.97
2.85
2 2.3 2.6 2.9 3.2 3.5 3.8
KOED
KLM
KAHS
KON
KOS
KICT
KENMS
KAED
KIRKHS
KOP
AIKOL
KOE
3.31
3.15
3.09
2.99
2.8
2.9
3
3.1
3.2
3.3
3.4
JPA/MARA Other scholarships
Self-sponsored PTPTN
3.25
3.06
2.95
3
3.05
3.1
3.15
3.2
3.25
3.3
Scholarships Self-sponsored

BACHELOR’S DEGREE GRADUATES9
7
1.1.7 Co-curricular activities
Co-curricular involvement is divided into
involvement in societies, clubs, and sports
activities. Half of all graduates were actively
involved in co-curricular activities and only a
small percentage were not active in any co-
curricular programme (see Table 1.2 below).
Table 1.2 Co-Curricular involvement by activity
Co-curricular involvement (%)
Societies Clubs Sport
Not active 4.2 4.2 10.9
9.2 10.3 19.0
30.9 31.5 32.6
32.3 31.5 22.4
Active 23.4 22.6 15.1
Both male and female graduates were equally
active in societies and clubs, but male graduates
were more actively involved than female
graduates in sports activities.5,6 (see Figure 1.13
below).
Figure 1.13 Co-curricular involvement by gender
1.1.8 Internship
Internship refers to industrial attachment or
training undergone by undergraduate students
during their studies. Seventy-nine per cent of all
graduates went for an internship. Of those, 30 per
cent did their internship with government
agencies while 39 per cent went to local and
multinational companies, including six per cent
who went to government-linked corporations
(see Figure 1.14 below).
5 There was no significant difference between male and female graduates’ involvement in societies and clubs (p-value > 0.05). However, male graduates were
Most internships lasted between one and three
months, although 4.3 per cent of the graduates
went for internships lasting for more than six
months (see Figure 1.15 below).
Sixty-nine per cent of the graduates received an
allowance during their internship (see Figure 1.16
below).
significantly more actively involved in sport than female graduates (p-value < 0.05). 6 The ratings were tested against the value of 3 indicating active participation.
3.70
3.69
3.50
3.57
3.52
2.91
Male Female
Societies
Sport Clubs

IIUM TRACER STUDY 201710
8
Figure 1.14 Graduates by internship placement
Figure 1.15 Graduates by internship duration
Figure 1.16 Graduates by internship allowance
1.1.9 Determinants of academic performance
Several factors were considered as potential
determinants of academic performance (CGPA).
The first factor was gender, as female graduates
appeared to perform better than male graduates.
The analysis also differentiated graduates who
came from the IIUM matriculation programme
(CPS) from direct-intake graduates.
As English is the medium of instruction at IIUM,
the level of English language proficiency at entry
was also considered. This variable was measured
by the result for English at the SPM level. Hence,
only those who took SPM before entering IIUM
were included in this analysis. Those who
obtained an F grade were assigned a value of 1, a
value of 2 for an E, 3 for a D, 4 for a C, 5 for a B,
and 6 for an A grade.
Family income was included as graduates who
came from households that were financially better
off may be at an advantage in facilitating their
studies. The academic performance of graduates
who worked while studying may be adversely
affected as they spent less time studying. Lastly,
No20.9%
37.4%
30.9%
10.1%
7.3%
5.6%
5.5%3.0%
Yes79.1%
0%
10%
20%
30%
40%
50%
60%
70%
80%
90%
100%
Internship Placement
Government Private (Local)
Private (Multinational) GLC
Own business Statutory body
NGO
72.7%
23.0%
2.3% 2.0%0.0%
10.0%
20.0%
30.0%
40.0%
50.0%
60.0%
70.0%
80.0%
Internship Duration
1–3 months 4–6 months
7–12 months > 12 months
Yes69%
No31%
3,135graduates

BACHELOR’S DEGREE GRADUATES11
9
the analysis also considered whether the level of
involvement in co-curricular activities had any
significant impact on CGPA.
The regression results are summarised in Table
1.3 below. Overall, male graduates performed
worse than female graduates across all kulliyyahs
except KOED and KOP, where there was no
significant difference in performance between the
genders.
Graduates who came from CFS did not perform
as well as others in KIRKHS and KAHS but had
similar performance, on average, as direct-intake
graduates in other kulliyyahs. Higher English
proficiency at entry contributed to higher CGPA
particularly among graduates from KENMS,
KICT, KIRKHS, KON, and KOS.
Higher family income led to better academic
performance only among KENMS and KOE
graduates, but it was not a significant factor
among graduates from other kulliyyahs.
As expected, the academic performance of
graduates who worked, either full-time or part-
time, while studying was lower than those who
did not work. The former might not have been
able to manage or devote more time to their
studies when they had to work. Active
involvement in co-curricular activities did not
have any detrimental effect on academic
performance. In fact, among KOE graduates,
active involvement in such activities contributed
positively towards their CGPA.
Table 1.3 Determinants of academic achievement (CGPA) by kulliyyah
Constant Male CFS
English at entry
Family income Worked
Co-curriculum R2 N
AIKOL 2.82 (0.00)
-0.09
(0.04) -0.05 (0.31)
0.03 (0.48)
0.01 (0.15)
-0.05 (0.19)
0.01 (0.75) 0.03 329
KAED 2.60 (0.00)
-0.14 (0.00)
0.04 (0.69)
0.03 (0.32)
0.01 (0.01)
-0.13 (0.00)
0.04 (0.02) 0.10 505
KENMS 2.4 (0.00)
-0.08 (0.02)
0.02 (0.59)
0.11 (0.00)
0.01 (0.10)
-0.09 (0.00)
0.02 (0.32) 0.10 446
KICT 2.72 (0.00)
-0.24 (0.00)
0.05 (0.62)
0.09 (0.08)
0.01 (0.12)
-0.07 (0.33)
-0.02 (0.55) 0.22 101
KIRKHS 2.55 (0.00)
-0.11 (0.00)
-0.07 (0.02)
0.12 (0.00)
0.00 (0.14)
-0.08 (0.00)
-0.02 (0.25) 0.13 738
KOE 2.60 (0.00)
-0.14 (0.00)
0.04 (0.69)
0.03 (0.32)
0.01 (0.01)
-0.13 (0.00)
0.04 (0.02) 0.10 505
KOED 3.57 (0.00)
-0.10 (0.19)
0.11 (0.26)
-0.02 (0.45)
0.00 (0.49)
0.02 (0.68)
-0.03 (0.33) 0.11 68
KAHS 3.54 (0.00)
-0.14 (0.00)
-0.29 (0.05)
0.04 (0.27)
0.00 (0.39)
-0.04 (0.20)
-0.03 (0.16) 0.13 211
KON 2.90 (0.00)
-0.15 (0.05) - 0.09
(0.05) 0.00
(0.57) -0.07 (0.27)
-0.02 (0.42) 0.37 37
KOP 3.01 (0.00)
0.10 (0.11) - 0.03
(0.69) 0.01
(0.35) 0.10
(0.12) -0.06 (0.10) 0.07 98
KOS 2.80 (0.00)
-0.13 (0.00)
-0.18 (0.12)
0.11 (0.00)
0.01 (0.23)
-0.11 (0.00)
0.02 (0.36) 0.18 205
KLM 2.06 (0.00)
-0.16 (0.02)
0.03 (0.63)
0.06 (0.24)
0.01 (0.14)
-0.01 (0.78)
-0.02 (0.58) 0.19 78
Total 2.66 (0.00)
-0.18 (0.00)
-.0.01 (0.62)
0.08 (0.00)
0.0 (0.01)
-0.07 (0.00)
0.02 (0.02) 0.10 3043
Note: (.) p-value

IIUM TRACER STUDY 201712
10
1.2 Evaluation of academic programmes, facilities, and services
1.2.1 Relevance and helpfulness of study programme
Graduates were asked to evaluate the relevance
and helpfulness of their respective study
programmes to their current jobs by rating them
on a scale of 1 (extremely low or not helpful at all)
to 5 (extremely high or extremely helpful).
The results are summarised in Figure 1.17 below.
Overall, IIUM academic programmes were rated
3.8 and 3.9 for relevance and helpfulness,
respectively. The ratings significantly greater than
3.5 suggest that the graduates found that the
programmes were both relevant and helpful. The
similar ratings given by Malaysian and non-
Malaysian graduates also suggest that IIUM
programmes have successfully catered to the
needs of both Malaysian and non-Malaysian
graduates alike.
The highest ratings, both in terms of relevance
and helpfulness, were given by graduates from
KON and KOD. While medical graduates
considered their programme helpful, they rated
lower in relevance at 3.4. Cross-kulliyyah
comparison for non-Malaysians, however, is not
very meaningful given the small number of
observations, especially of the smaller
programmes.
Figure 1.17 Relevance and helpfulness of study programmes by kulliyyah
1
2
3
4
5
KON KICT KOD AIKOL KLM KOP KAED KOED KENMS KAHS KIRKHS KOE KOS KOM Total
Relevance Malaysian Relevance Non-Malaysian Helpfulness Malaysian
Helpfulness Non-Malaysian Relevance Total Helpfulness Total

BACHELOR’S DEGREE GRADUATES13
11
1.2.2 Curriculum
Table 1.4 Evaluation of curriculum by kulliyyah
AIK
OL
KA
ED
KE
NM
S
KIC
T
KIR
KH
S
KO
E
KO
ED
KA
HS
KO
D
KO
M
KO
N
KO
P
KO
S
KLM
Tot
al
Suitability of programme 4.3 4.1 4.3 4.1 4.3 4.1 4.5 4.3 4.6 4.7 4.5 4.4 4.2 4.4 4.3
Theoretical & practical balance
4.1 3.9 4.1 3.9 4.0 3.6 4.4 4.0 4.7 4.7 4.4 4.1 4.0 4.5 4.0
Internship 4.2 4.0 4.2 4.2 4.0 3.9 4.6 4.3 4.6 4.6 4.4 4.3 3.9 4.5 4.1
Compulsory co-curriculum 4.1 3.9 4.1 4.0 4.2 4.0 4.4 4.2 4.5 4.4 4.4 4.2 4.1 4.4 4.1
Compulsory subjects 4.1 4.0 4.2 4.0 4.3 4.1 4.5 4.2 4.5 4.5 4.5 4.2 4.1 4.5 4.2
Variety of co-curriculum 4.2 4.1 4.2 4.1 4.3 4.1 4.4 4.1 4.4 4.4 4.3 4.3 4.0 4.4 4.2
Prepare for working life 4.0 3.8 4.0 3.9 4.0 3.7 4.4 3.9 4.7 4.6 4.5 4.2 3.8 4.3 4.0
Internship helps employment 4.1 4.0 4.2 4.4 4.0 3.9 4.6 4.1 4.6 4.6 4.5 4.4 3.7 4.4 4.1
Malaysian 4.1 4.0 4.2 4.1 4.2 4.0 4.5 4.1 4.6 4.6 4.4 4.3 4.0 4.4 4.2
Non-Malaysian 3.9 4.0 3.9 4.0 3.9 3.4 4.2 N/A N/A 4.0 N/A 4.0 3.1 3.8 3.8
Total 4.1 4.0 4.2 4.1 4.2 3.9 4.4 4.1 4.6 4.6 4.4 4.3 4.0 4.4 4.1
Note: Total value was computed by taking the mean value of all items
Graduates were asked to evaluate the overall
curriculum in terms of (i) suitability of the study
programme, (ii) balance between theoretical and
practical components, (iii) internship
programme, (iv) compulsory co-curriculum, (v)
compulsory subjects, (vi) variety of co-curriculum
offered, (vii) preparing students for working life,
and (viii) whether the internship programme has
helped graduates obtain suitable employment.7
Each item was rated on a scale of 1 (not satisfied
at all) to 5 (extremely satisfied) and the results are
summarised in Table 1.4 above.
Overall, the graduates were satisfied with the
curriculum, as shown by the ratings which were
significantly greater than 3. Except for “preparing
students for working life”, the ratings were
7 While not all programmes require internship, 91 per cent of graduates undertook the attachment.
significantly above 4, suggesting high levels of
satisfaction. The ratings given by Malaysian and
non-Malaysian graduates from AIKOL, KAED,
and KICT were not significantly different.
However, Malaysian graduates from other
kulliyyahs gave significantly higher ratings,
suggesting higher levels of satisfaction, than their
non-Malaysian counterparts.
While the graduates rated the programmes as
relevant and helpful and were satisfied with the
curriculum, they also gave several suggestions to
improve the quality of the programmes. A
common suggestion was to revise the courses
offered to meet the needs of industry and the job
market. This suggestion was mostly raised by
KICT graduates (25.2 per cent). Particularly,

IIUM TRACER STUDY 201714
12
courses which are irrelevant should be removed,
outdated ones brought up-to-date, and new
courses introduced to cover new developments in
the area.
Additionally, 36.4 per cent of the engineering
graduates suggested that the teaching approach
should emphasize knowledge and skills that are
relevant to the needs of industry. The graduates,
particularly from KOP, also suggested that the
management of the programmes concerning
teaching and learning, scheduling of courses,
assessment, and class activities should be
improved.
1.2.3 Acquired skills
Graduates were asked to evaluate the skills they
acquired during their studies in terms of
information and communication technology
(ICT) skills, soft skills, and life skills, as well as
proficiency in the English and Malay languages.
They were asked to list the top three ICT skills
they have acquired and rate their skill levels from
1 (poor) to 5 (excellent). Similarly, with soft skills
and language proficiency. The graduates were
also asked to rate the extent their education at
IIUM affected their lives with regard to a list of life
skills from 1 (no influence at all) to 5 (a lot of
influence).
ICT skills
Graduates across all kulliyyahs rated their ICT
skills to be good (3.6 and above). Most IIUM
graduates were familiar with Microsoft Word (96
per cent), PowerPoint (95 per cent) and Excel (75
per cent), although graduates from KAED and
KICT reported different sets of ICT skills
compared to others (see Table 1.5 below).8 More
than a third of engineering graduates listed
familiarity with AutoCAD while graduates from
KON (51 per cent), KOM (37 per cent), KOP (20
8 AutoCAD is a computer-aided design and drafting software used by architects, graphic designers, and engineers. Adobe Photoshop is extensively used for
per cent), as well as KIRKHS (25 per cent) listed
SPSS, a statistical software.
Soft skills
Soft skills include interpersonal communication,
creative and critical thinking, problem-solving,
analytical, teamwork, inculcating and practising
positive values, and awareness of general
knowledge and current issues. In general, the
graduates rated their soft skill to be good with
mean ratings significantly greater than 3 (see
Table 1.6 below). Malaysian AIKOL and KENMS
graduates rated themselves significantly higher
than their respective non-Malaysian counterparts
for problem-solving. Malaysian KENMS
graduates also rated themselves significantly
higher than others for teamwork, and higher than
non-Malaysian KENMS graduates for inculcating
and practising positive values. Similarly, among
KOS graduates.
photo-editing, and graphic design. PHP is used to create dynamic web pages. Java/J2EE extends the functionality of web services.

BACHELOR’S DEGREE GRADUATES15
13
Life skills
Graduates were asked to rate the extent education
at IIUM influenced their lives and the results are
summarised in Table 1.7 below. Generally, the
graduates indicated that IIUM education has
considerably influenced their lives.
Language proficiency
Graduates reported good levels of proficiency in
the English and Malay languages, with ratings
significantly greater than 3 (see Figure 1.18
below). Unsurprisingly, Malaysian graduates
rated themselves significantly higher than non-
Malaysian graduates for the Malay language.
There was no significant difference between the
ratings of Malaysian and non-Malaysian
graduates for their English language proficiency,
except for KOE graduates. Non-Malaysian KOE
graduates rated themselves higher than
Malaysian graduates for the English language.
Table 1.5 Top ICT skills by kulliyyah
AIKOL KIRKHS KOM
Microsoft Word Microsoft PowerPoint Microsoft Excel
96.2% 95.4% 75.1%
Microsoft Word Microsoft PowerPoint Microsoft Excel
91.5% 87.2% 59.6%
Microsoft PowerPoint Microsoft Word Microsoft Excel
95.2% 87.1% 54.4%
KAED KLM KON
Adobe Photoshop AutoCAD Microsoft Word
74.5% 73.7% 45.7%
Microsoft PowerPoint Microsoft Word Microsoft Excel
94.2% 87.3% 51.7%
Microsoft PowerPoint Microsoft Word SPSS
95.1% 92.7% 51.2%
KAHS Overall KOP
Microsoft Word Microsoft PowerPoint Microsoft Excel
92.8% 87.8% 60.8%
Microsoft Word Microsoft PowerPoint Microsoft Excel
96.2% 95.4% 75.1%
Microsoft Word Microsoft PowerPoint Microsoft Excel
87.4% 84.7% 64.0%
KENMS KOE KOS
Microsoft Excel Microsoft Word Microsoft PowerPoint
88.3% 95.4% 77.9%
Microsoft Word Microsoft Excel Microsoft PowerPoint
70.2% 61.3% 53.9%
Microsoft Word Microsoft PowerPoint Microsoft Excel
87.8% 81.4% 77.2%
KICT KOED KOD
PHP Adobe Photoshop Java/J2EE
55.5% 38.5% 36.3%
Microsoft PowerPoint Microsoft Word Microsoft Excel
90.0% 87.5% 48.7%
Microsoft PowerPoint Microsoft Word Microsoft Excel
97.8% 93.3% 64.4%

IIUM TRACER STUDY 201716
14
Table 1.6 Soft skills by kulliyyah
AIK
OL
KA
ED
KE
NM
S
KIC
T
KIR
KH
S
KO
E
KO
ED
KA
HS
KO
D
KO
M
KO
N
KO
P
KO
S
KLM
Tot
al
Interpersonal communication 4.1 4.1 4.1 4.1 4.1 4.1 4.2 4.2 4.3 4.2 4.0 4.1 4.1 4.2 4.1
Creative & critical thinking 4.1 4.1 4.1 4.1 4.1 4.1 4.3 4.2 4.3 4.2 4.1 4.2 4.1 4.2 4.1
Problem-solving 4.1 4.2 4.2 4.1 4.2 4.2 4.3 4.3 4.3 4.2 4.1 4.1 4.1 4.3 4.2 Analytical 4.1 4.2 4.4 4.1 4.1 4.2 4.3 4.2 4.3 4.2 4.1 4.1 4.1 4.2 4.2 Teamwork 4.4 4.3 4.4 4.3 4.4 4.3 4.5 4.4 4.5 4.4 4.4 4.3 4.4 4.5 4.4 Inculcating & practising positive values 4.4 4.4 4.1 4.3 4.4 4.4 4.6 4.5 4.5 4.5 4.4 4.3 4.4 4.5 4.4
General knowledge & current issues 4.1 4.1 4.3 4.1 4.2 4.0 4.3 4.3 4.3 4.3 4.0 4.2 4.1 4.2 4.1
Malaysian 4.2 4.2 4.2 4.1 4.2 4.2 4.3 4.3 4.4 4.3 4.2 4.2 4.2 4.3 4.2 Non-Malaysian 4.3 4.2 4.2 4.2 4.3 4.2 4.7 N/A N/A 4.0 N/A 3.4 4.2 4.9 4.3
Table 1.7 Life skills by kulliyyah
AIK
OL
KA
ED
KE
NM
S
KIC
T
KIR
KH
S
KO
E
KO
ED
KA
HS
KO
D
KO
M
KO
N
KO
P
KO
S
KLM
Tot
al
Develop self-confidence 4.3 4.2 4.3 4.3 4.4 4.2 4.5 4.3 4.4 4.5 4.4 4.4 4.3 4.5 4.3 Enhance self-maturity 4.3 4.3 4.4 4.3 4.5 4.3 4.5 4.4 4.6 4.6 4.6 4.5 4.4 4.6 4.4 Develop self-resilience 4.3 4.3 4.3 4.3 4.4 4.3 4.5 4.3 4.6 4.5 4.5 4.4 4.3 4.6 4.4 Become more knowledgeable 4.4 4.3 4.4 4.4 4.5 4.4 4.6 4.4 4.6 4.6 4.5 4.6 4.4 4.6 4.4
Enhance interest in learning 4.3 4.2 4.3 4.2 4.4 4.1 4.5 4.2 4.5 4.5 4.5 4.4 4.3 4.4 4.3
More sensitive towards current affairs 4.2 4.1 4.2 4.2 4.4 4.1 4.4 4.2 4.1 4.4 4.4 4.2 4.1 4.4 4.2
Ability to be independent 4.4 4.4 4.4 4.4 4.6 4.4 4.6 4.4 4.6 4.7 4.5 4.6 4.5 4.6 4.5
Creative & critical thinking 4.3 4.3 4.3 4.3 4.4 4.3 4.4 4.3 4.6 4.5 4.5 4.4 4.3 4.5 4.3
Ready to face the working life & its challenges
4.2 4.2 4.2 4.3 4.3 4.2 4.4 4.2 4.5 4.5 4.5 4.4 4.2 4.5 4.3
Problem-solving & decision-making 4.3 4.3 4.3 4.3 4.4 4.3 4.5 4.3 4.6 4.5 4.5 4.5 4.3 4.6 4.4
Teamwork 4.3 4.4 4.4 4.3 4.5 4.4 4.5 4.5 4.6 4.6 4.5 4.5 4.4 4.6 4.4 Effective communication 4.3 4.3 4.3 4.4 4.4 4.3 4.5 4.3 4.6 4.6 4.5 4.5 4.4 4.6 4.4 Malaysian 4.3 4.3 4.4 4.3 4.5 4.3 4.5 4.3 4.5 4.5 4.5 4.5 4.3 4.6 4.4 Non-Malaysian 3.9 4.1 4.0 4.3 4.2 3.7 4.1 N/A N/A 4.9 N/A 3.2 4.3 3.6 4.1

BACHELOR’S DEGREE GRADUATES17
15
Figure 1.18 Language proficiency by kulliyyah
1.2.4 Facilities and services
Graduates were asked to rate their satisfaction of
the various services provided by the University
including career and guidance, library, and other
facilities on a scale of 1 (not satisfied at all) to 5
(extremely satisfied).
Career guidance services
The graduates were satisfied with the career and
guidance services, as the mean ratings were
greater than 3 (see Table 1.8 below). Nursing and
medical graduates were the most satisfied of all
giving the highest ratings.
Table 1.8 Evaluation of career guidance services by kulliyyah
AIK
OL
KA
ED
KE
NM
S
KIC
T
KIR
KH
S
KO
E
KO
ED
KA
HS
KO
D
KO
M
KO
N
KO
P
KO
S
KLM
Tot
al
Information on job & career opportunities 3.9 3.8 4.1 3.8 3.9 3.8 4.1 3.7 4.4 4.5 4.5 4.0 3.6 4.2 3.9
Assistance in interviewing skills 3.8 3.6 3.9 3.8 4.0 3.6 3.9 3.8 4.2 4.3 4.5 3.9 3.9 4.1 3.9
Assistance in job application 3.8 3.7 4.0 3.9 4.1 3.6 3.9 3.8 4.2 4.2 4.6 3.9 3.9 4.2 3.9
Assistance in obtaining jobs 3.7 3.6 3.8 3.7 3.7 3.5 3.9 3.5 4.1 4.3 4.5 3.8 3.4 3.9 3.7
Information on further studies 3.8 3.8 3.9 3.8 3.9 3.7 4.1 3.6 4.0 4.4 4.3 4.0 3.6 4.1 3.9
Job opportunities on campus 3.7 3.5 3.7 3.6 3.7 3.5 3.8 3.4 4.0 4.1 4.2 3.8 3.4 3.9 3.7
Arranging on-campus job recruitments 3.7 3.5 3.9 3.5 3.7 3.6 3.6 3.2 3.4 3.7 4.4 3.5 3.0 3.9 3.6
1
2
3
4
5
AIKOL KAED KENMS KICT KIRKHS KOE KOED KAHS KOD KOM KON KOP KOS KLM Overall
Malaysian English Malaysian Malay Non-Malaysian English Non-Malaysian Malay

IIUM TRACER STUDY 201718
16
Library services
The graduates were very satisfied with library
facilities and services. All aspects of library
facilities and services including online services,
online resources, operating time, and services
provided by the library staff were given mean
ratings greater than 4, including a mean overall
rating of 4.27 (see Figure 1.19 below).
Figure 1.19 Evaluation of library facilities and services
Figure 1.20 Evaluation of other facilities and services
Other facilities and services
The levels of satisfaction for other facilities such as
laboratories, health centre, lecture halls and
classrooms, sports facilities, transportation, and
accommodation were also high (see Figure 1.20
above). The graduates also indicated high levels of
satisfaction for the study area, online integrated
learning system, ICT facilities and services, and
campus security. However, parking facilities were
rated slightly lower at 3.4.
However, the supplementary IIUM Tracer Study
finds that law graduates did not agree that there
was adequate and functional safety equipment
and that theft and disciplinary cases were handled
effectively. They also disagreed that building
defects were rectified immediately. However,
since the AIKOL building is one of the oldest
buildings at the Gombak campus, the views were
not surprising.
Graduates from the Kuantan campus were not
satisfied with the food services available there.
They disagreed that the number of food outlets
was adequate and that the variety and quality of
food offered at the cafeteria were good. They also
did not agree that the prices of the food offered at
the cafeteria were reasonable.
The views, however, were not shared by nursing
graduates, who agreed that there were enough
food outlets with reasonable food variety, quality,
1.002.003.004.005.00
Onlineservices
Onlineresources
Staff
OperatingtimeResources
Study area
Overall
1.00
2.00
3.00
4.00
5.00Laboratories
Health centre
Transportation
Accommodation
Lecture halls &classrooms
Sport facilities
CafeteriaICT facilities &services
Study area
Campusbookshop
Online integratedlearning system
Campus security
Parking
BACHELOR’S DEGREE GRADUATES19
17
and price at the Kuantan campus. KON graduates
seem to be the most satisfied of all graduates of
the various University facilities and services (see
Table 1.9 below)
Suggestions
KULLIYYAH
The IIUM Tracer Study asked graduates for
suggestions to improve the facilities and services.
Among the main suggestions, particularly from
AIKOL, KENMS, and KIRKHS graduates,
concerned improvements and upgrades to the air-
conditioning, lighting, and furniture in classes,
laboratories, and other teaching venues and
buildings.
Other suggestions concerned better services.
KOM and KOP graduates particularly, suggested
that staff give better support and response to
student requests. While 13 per cent of graduates
from KLM suggested improvements to the
kulliyyah administration and management in
maintaining facilities, addressing student
complaints, and overall efficiency.
MAHALLAH
Three main areas of improvement suggested by
the graduates for improvement at the mahallahs
concerned internet access, parking, and laundry
facilities. Particularly, there should be wider Wi-
Fi coverage, higher internet speed, and better
network availability. The graduates also proposed
better registration and management of parking
spaces as well as more covered parking. Laundry
facilities at the Mahallah should also be improved
by providing more washing and drying areas,
upgrading laundry machines, and opening more
launderettes at the respective mahallahs.

IIUM TRACER STUDY 201720
Tab
le 1
.9 E
valu
atio
n of
faci
litie
s an
d se
rvic
es b
y ku
lliyy
ah, I
IUM
Tra
cer
Stud
y
Faci
litie
s an
d m
anag
emen
t A
IKO
L K
IRK
HS
KE
NM
S K
ICT
K
OE
K
AE
D
KO
ED
K
OM
K
OP
KO
N
KO
D
KO
S K
AH
S K
LM
Tot
al
The
ove
rall
faci
litie
s ar
e co
nduc
ive
for
teac
hing
and
lear
ning
act
iviti
es
3.07
3.
11
3.19
3.
32
3.13
3.
18
3.41
3.
18
3.31
3.
50
3.29
3.
22
3.24
3.
37
3.18
The
cla
ssro
oms
are
clea
n an
d w
ell-
mai
ntai
ned
3.01
2.
94
3.10
3.
30
3.08
3.
14
3.32
2.
99
3.14
3.
45
3.24
3.
16
3.15
3.
34
3.08
The
cla
ssro
oms
are
com
fort
able
2.
97
2.89
3.
03
3.28
3.
01
3.10
3.
31
3.01
3.
10
3.33
3.
36
3.11
3.
16
3.36
3.
04
The
land
scap
e is
ple
asan
t and
wel
l-ke
pt
3.23
3.
29
3.32
3.
43
3.32
3.
30
3.50
3.
28
3.46
3.
53
3.40
3.
33
3.33
3.
48
3.32
The
res
pons
e tim
e up
on r
epor
ting
of
any
com
plai
nt is
ade
quat
e 2.
77
2.86
2.
94
2.95
2.
85
2.94
3.
22
2.91
2.
95
3.43
3.
20
2.99
3.
03
3.13
2.
92
The
mai
nten
ance
wor
ks a
re
satis
fact
ory
2.90
2.
96
3.05
3.
12
2.96
3.
01
3.30
3.
04
3.03
3.
50
3.24
3.
06
3.10
3.
22
3.02
Kul
liyya
h A
IKO
L K
IRK
HS
KE
NM
S K
ICT
K
OE
K
AE
D
KO
ED
K
OM
K
OP
KO
N
KO
D
KO
S K
AH
S K
LM
Tot
al
Faci
litie
s in
cla
ssro
oms
are
in g
ood
cond
ition
2.
71
2.64
2.
88
3.38
2.
78
2.95
3.
24
2.78
2.
69
3.13
2.
96
2.90
3.
00
3.36
2.
84
Toi
lets
at k
ulliy
yah
are
in g
ood
cond
ition
2.
80
2.68
2.
97
3.44
3.
07
3.08
3.
19
3.09
3.
25
3.03
3.
13
3.18
3.
30
3.44
2.
99
The
num
ber
of d
iscu
ssio
n ar
eas
is
adeq
uate
2.
73
2.78
2.
90
3.23
2.
94
3.04
3.
20
3.04
2.
64
3.25
3.
09
2.89
3.
00
3.14
2.
91
The
con
ditio
n of
dis
cuss
ion
area
s is
go
od
2.77
2.
84
2.98
3.
33
2.97
3.
03
3.24
3.
03
2.90
3.
20
3.18
2.
94
3.05
3.
30
2.96
Mah
alla
h A
IKO
L K
IRK
HS
KE
NM
S K
ICT
K
OE
K
AE
D
KO
ED
K
OM
K
OP
KO
N
KO
D
KO
S K
AH
S K
LM
Tot
al
Faci
litie
s in
Mah
alla
h ro
oms
are
in
good
con
ditio
n 3.
01
3.20
3.
11
3.14
3.
10
3.08
3.
38
3.36
3.
41
3.68
3.
49
3.40
3.
32
3.20
3.
19
Toi
lets
are
alw
ays
in g
ood
cond
ition
2.
73
2.90
2.
82
2.74
2.
70
2.73
3.
19
3.05
2.
92
3.53
3.
24
3.14
3.
04
2.76
2.
87
Mah
alla
h co
mpo
und
and
land
scap
e ar
e cl
ean/
wel
l-m
aint
aine
d 3.
16
3.27
3.
18
3.25
3.
19
3.18
3.
38
3.27
3.
30
3.63
3.
44
3.35
3.
28
3.36
3.
24

BACHELOR’S DEGREE GRADUATES21
Aux
iliar
y, v
enue
, and
food
out
let
serv
ices
A
IKO
L K
IRK
HS
KE
NM
S K
ICT
K
OE
K
AE
D
KO
ED
K
OM
K
OP
KO
N
KO
D
KO
S K
AH
S K
LM
Tot
al
The
num
ber
of a
uxili
ary
serv
ices
pr
ovid
ed is
ade
quat
e 2.
91
3.06
3.
07
3.13
3.
09
2.96
3.
18
2.50
2.
59
3.18
2.
69
2.69
2.
60
3.06
2.
97
The
con
ditio
n of
aux
iliar
y se
rvic
es
prov
ided
is g
ood
2.92
3.
06
3.10
3.
10
3.08
3.
01
3.22
2.
74
2.71
3.
35
2.89
2.
71
2.68
3.
06
3.00
The
num
ber
of v
enue
faci
litie
s is
ad
equa
te
3.02
3.
16
3.15
3.
28
3.18
3.
16
3.29
3.
01
2.94
3.
28
3.20
3.
01
2.90
3.
23
3.13
The
con
ditio
n of
ven
ue fa
cilit
ies
is g
ood
2.97
3.
08
3.13
3.
19
3.15
3.
14
3.27
2.
88
2.83
3.
20
3.18
2.
98
2.90
3.
24
3.08
The
num
ber
of fo
od o
utle
ts o
n ca
mpu
s is
ade
quat
e 2.
99
3.15
3.
15
3.21
3.
18
3.19
3.
28
2.24
2.
36
2.93
2.
29
2.31
2.
36
3.15
2.
99
The
var
iety
of f
ood
offe
red
at c
ampu
s ca
fete
ria
is g
ood
2.88
3.
10
3.04
3.
18
3.16
3.
13
3.23
2.
23
2.27
2.
98
2.31
2.
25
2.30
3.
11
2.93
The
pri
ce o
f foo
d of
fere
d at
cam
pus
cafe
teri
a is
rea
sona
ble
2.82
2.
93
2.98
3.
09
3.02
2.
91
3.11
2.
56
2.66
3.
00
2.64
2.
52
2.57
2.
86
2.88
The
qua
lity
of fo
od o
ffere
d at
cam
pus
cafe
teri
a is
goo
d 2.
80
2.98
2.
95
3.04
3.
06
3.01
3.
18
2.55
2.
68
3.10
2.
53
2.40
2.
52
2.97
2.
89
Secu
rity
and
saf
ety
AIK
OL
KIR
KH
S K
EN
MS
KIC
T
KO
E
KA
ED
K
OE
D
KO
M
KO
P K
ON
K
OD
K
OS
KA
HS
KLM
T
otal
The
re a
re a
dequ
ate
and
func
tiona
l sa
fety
equ
ipm
ent
2.44
2.
61
2.73
2.
97
2.80
2.
75
2.94
2.
96
3.05
3.
38
3.20
3.
03
3.08
2.
95
2.77
Def
ects
of b
uild
ing
are
atte
nded
to
imm
edia
tely
2.
41
2.65
2.
71
2.87
2.
74
2.73
3.
00
2.79
2.
74
3.33
2.
82
2.94
3.
01
2.91
2.
74
I fee
l saf
e at
the
prem
ises
with
str
inge
nt
secu
rity
pol
icie
s 2.
65
2.85
2.
91
3.11
3.
02
2.93
3.
18
3.03
3.
19
3.40
3.
27
3.22
3.
21
2.94
2.
96
The
sec
urity
forc
e pa
trol
s co
nsta
ntly
2.
73
2.93
2.
95
3.07
3.
05
2.98
3.
16
3.12
3.
19
3.50
3.
40
3.24
3.
22
3.03
3.
01
The
sec
urity
cas
es s
uch
as th
efts
, di
scip
linar
y ca
ses
are
hand
led
effe
ctiv
ely
2.55
2.
79
2.77
2.
90
2.89
2.
75
3.13
2.
93
2.95
3.
35
3.27
3.
08
3.08
2.
87
2.85
Scal
e: 1
(Str
ongl
y di
sagr
ee),
2 (D
isag
ree)
, 3 (A
gree
), 4
(Str
ongl
y ag
ree)
H
ighe
st s
core
R
atin
g no
t sig
nific
antly
(5%
) di
ffere
nt fr
om 2
.5
Rat
ing
sign
ifica
ntly
(5%
) low
er
than
2.5

IIUM TRACER STUDY 201722
20
1.2.5 Degree and University
Most graduates believed that the degrees obtained
were worth the money and time spent (see Figure
1.21 below).
Figure 1.21 Worthwhileness of degree
Malaysian graduates were more likely than non-
Malaysian graduates to recommend IIUM to
others (see Figure 1.22 below).
Figure 1.22 Willingness to recommend IIUM to others
While 84.4 per cent of non-Malaysian graduates
found their degrees worthwhile, only 73 per cent
would recommend IIUM to others. Only half of
non-Malaysian engineering graduates would
recommend IIUM to their friends and family
members as a place of study although two thirds
of them found their degrees worthwhile (see
Table 1.10 and Table 1.11 below).
Table 1.10 Worthwhileness of degree by kulliyyah
92.3%84.4%
7.7%15.6%
0%
10%
20%
30%
40%
50%
60%
70%
80%
90%
100%
Malaysian Non-Malaysian
No
Yes
93.1%
73.0%
6.9%
27.0%
0%
10%
20%
30%
40%
50%
60%
70%
80%
90%
100%
Malaysian Non-Malaysian
No
Yes
Malaysian (%) Non-Malaysian (%)
Yes No Yes No AIKOL 95 5.0 100 0 KAED 86.9 13.1 92.9 7.1 KENMS 93.6 6.4 88.5 11.5 KICT 87.4 12.6 82.6 17.4 KIRKHS 93.2 6.8 84.2 15.8 KOE 87.9 12.1 66.7 33.3 KOED 98.7 1.3 100 0 KAHS 91.9 8.1 N/A N/A KOD 100 0 N/A N/A KOM 100 0 100 0 KON 97.6 2.4 N/A N/A KOP 99.1 0.9 0 100 KOS 88.9 11.1 100 0 KLM 94.2 5.8 100 0 Total 92.3 7.7 84.4 15.6

BACHELOR’S DEGREE GRADUATES23
21
Table 1.11 Willingness to recommend IIUM to others by kulliyyah
Malaysian (%) Non-Malaysian (%) Yes No Yes No
AIKOL 94.4 5.6 75 25.0 KAED 90.3 9.7 71.4 28.6 KENMS 95.7 4.3 77 22.9 KICT 92.8 7.2 78.3 21.7 KIRKHS 96.3 3.7 75.8 24.2 KOE 87.9 12.1 46.7 53.3 KOED 96.1 3.9 100 0 KAHS 88.3 11.7 N/A N/A KOD 95.6 4.4 N/A N/A KOM 96.6 3.4 100 0 KON 100 0 N/A N/A KOP 96.4 3.6 0 100 KOS 87.2 12.8 100 0 KLM 96.5 3.5 100 0 Total 93.1 6.9 73 27.0
1.2.6 Islamisation, integration, and internationalisation
Figure 1.23 Evaluation of aspects of Islamisation by kulliyyah
Islamisation is one of the missions of IIUM. In
this regard, graduates were asked whether they
agree that the University’s courses incorporate
Islamic values, IIUM provides a conducive
environment to practice Islam better, and IIUM
helps students to be better Muslims. The results
are summarised in Figure 1.23 above.
In general, the graduates agreed to the three
aspects of Islamisation as the mean ratings are
above 3.5 out of 5 across all kulliyyahs. This
suggests that the University has successfully
fulfilled its mission with respect to the above three
aspects of Islamisation.
0
1
2
3
4
5
AIKO
L
KAED
KEN
MS
KICT
KIRK
HS
KOE
KOED
KAH
S
KOD
KOM
KON
KOP
KOS
KLM
Courses incorporate Islamic values Conducive environment for better practice of Islam
Helps me to be a better Muslim

IIUM TRACER STUDY 201724
22
Additionally, the graduates were asked an open-
ended question about the advantages of studying
at IIUM, to which they were free to provide more
than one answer.
The most common responses were: (i) the Islamic
environment; (ii) the international environment;
(ii) opportunities for self-improvement as a
Muslim; and (iv) integration of knowledge. These
four responses are consistent with the vision and
missions of IIUM (see Figure 1.24 below).
While encouraging, the results emphasise a need
for IIUM to strive further to fulfil its objectives, as
though a third of the graduates mentioned the
Islamic environment, only slightly above 15 per
cent cited integration of knowledge.
KOP graduates were the most who cited the
Islamic environment, with almost half of them
giving it as the advantage of studying at IIUM.
Surprisingly, more science graduates than non-
science graduates mentioned integration of
knowledge. Particularly, more than half of KOM
graduates, and a quarter of KAHS and KOP
graduates, respectively, wrote the integration of
knowledge as an advantage of studying at IIUM.
More than graduates from other kulliyyahs, 37
per cent of KON graduates reported to have
benefited from self-improvement as a Muslim.
Figure 1.24 Advantages of studying at IIUM
1.2.7 Career enhancement training
Over three quarters of IIUM graduates indicated
that they would like to attend additional training
programmes to enhance their career
opportunities and more than half would be willing
to pay for the training (see Figure 1.25 below).
The highest demand for additional training came
from KAHS graduates (82 per cent) while the
lowest were from KON graduates (56.1 per cent).
Only 39 per cent of KON graduates were willing
to pay for additional training (see Figure 1.26
below).
Overall, the most preferred training programmes
were those related to enhancing English
proficiency and ICT skills. English language
programmes were highly demanded particularly
by AIKOL, KOED, KOM, KOD, and KOS
graduates. KICT and KOE graduates, however,
preferred programmes that would expand their
ICT skills (see Figure 1.27 below).
Figure 1.25 Demand for additional training
15.8%
18.6%
18.9%
35.6%
0% 10% 20% 30% 40%
Integration ofknowledge
Self-improvement as aMuslim
Internationalenvironment
Islamic environment
24%
25%
51%
Would not liketo attend
Would like toattend but notpay
Would like toattend and pay
3,964graduates

BACHELOR’S DEGREE GRADUATES25
23
Figure 1.26 Demand for additional training by kulliyyah
Figure 1.27 Preferred training programme by kulliyyah
1.2.8 Disadvantages of studying at IIUM
Graduates were also asked an open-ended
question about the disadvantages of studying at
IIUM. Over a third of the graduates indicated that
there were no disadvantages of studying at IIUM.
Of the rest, 7.2 per cent respectively mentioned
shortcomings in the study programmes and long
duration of study. Complaints about
shortcomings in the study programmes came
mostly from graduates from KOE (12 per cent)
and KICT (15 per cent), while the long duration
of study was raised by KOD and KOS graduates.
Lastly, 6.7 per cent of the graduates mentioned
poor facilities at the kulliyyahs and mahallahs (see
Figure 1.28 below).
Figure 1.28 Disadvantages of studying at IIUM
0%
20%
40%
60%
80%
100%
AIKOL KAED KENMS KICT KIRKHS KOE KOED KAHS KOD KOM KON KOP KOS KLM
Yes and willing to pay Yes but not willing to pay No
0%
10%
20%
30%
40%
50%
60%
AIKOL KIRKHS KENMS KICT KOE KAED KOED KOM KOP KON KOD KOS KAHS KLM
English proficiency ICT skills
6.7%
7.2%
7.2%
33.4%
0% 10% 20% 30% 40%
Poor kulliyyah/mahallahfacilities
Long duration of study
Weaknesses inprogramme
None

IIUM TRACER STUDY 201726
24
1.3 Employment profile
1.3.1 General overview of employment characteristics
Figure 1.29 Overview of employment characteristics
The labour force includes those who are either
employed or unemployed. The unemployed are
those who do not have a job but are looking for
one (see Box 1 below). In this tracer study, the
labour force consisted of graduates who were full-
time or part-time employed or were unemployed
and searching for a job. Otherwise, they were
outside the labour force. Only fresh graduates
were considered for analysis. Those who were
probably already holding full-time jobs when they
enrolled as undergraduate students at IIUM, such
as those who underwent undergraduate degree
programmes offered by ICCE, were excluded.9
Overall, the graduates’ labour force participation
rate was 76.9 per cent (see Figure 1.29 above) and
it was higher for male (79.2 per cent) than female
graduates (76.1 per cent) (see Figure 1.30 and
Table 1.12 below). The rate of employment was
60.5 per cent, which was also higher for male
(65.2 per cent) than female (57.7 per cent)
9 Graduates who joined IIUM through the Program Khas Pensiswazahan Guru (PKPG), studied on part-time basis”, or were more than 28 years old were excluded from the analysis. 10 Department of Statistics Malaysia (2017, November 9). Principal Statistics of Labour Force, Malaysia,
graduates. In comparison, Malaysia’s overall
labour force participation rate in the same period
was 67.9 per cent (80.1 per cent male and 54.6
per cent female) and employment rate was 96.6
per cent.10
The labour force participation rates were higher
among male than female graduates of all
kulliyyahs except KOED and KOS. All KON
graduates and 93.9 per cent and 95.6 per cent of
KOM and KOD graduates, respectively, were in
the labour force. Apart from these kulliyyahs,
KICT graduates also recorded among the highest
labour participation rate at 90.4 per cent. On the
other hand, AIKOL graduates had the lowest
labour participation rate at 33.9 per cent as many
were undergoing chambering without pay at the
time of the survey. The second lowest labour
participation rate was among KOS graduates at
69.9 per cent (see Table 1.12 and Figure 1.31
below).
Third Quarter (Q3) 2017. Retrieved from https://dosm.gov.my/v1/index.php?r=column/cthemeByCat&cat=149&bul_id=alYvK1J5OTk2NnA2MEJUbG1HcXdTZz09&menu_id=U3VPMldoYUxzVzFaYmNkWXZteGduZz09
Full-time employed, 37.4%
Part-time employed, 9.1%Unemployed, 30.4%
Attending/planning to attend further study/training, 16.9%
Not looking for a job, 6.2%
3,782graduates 76.9% IN LABOUR FORCE
23.1% OUTSIDE LABOUR FORCE

BACHELOR’S DEGREE GRADUATES27
25
Figure 1.30 Employment category by gender
BOX 1: TECHNICAL NOTES
Labour force refers to those who, during the reference week are between 15 to 64 years (in completed years at last birthday) and who are either employed or unemployed.
Employed refers to all persons who, at any time during the reference week worked for at least one hour for pay, profit or family gain (as an employer, employee, own-account worker or unpaid family worker). Also considered as employed are persons who did not work during the reference week because of illness, injury, bad weather, leave, labour dispute, and social or religious reasons but had a job, farm, enterprise or other family enterprises to return to. Also included are those on temporary lay-off with pay who would be called back to work.
Unemployed refers to those who do not have a job but are interested to work. There are two groups of unemployed, i.e., the actively unemployed and inactively unemployed.
Outside labour force: All persons not classified as employed or unemployed as stated above are classified as outside labour force. Includes housewives, students (including those going for further studies), retired, disabled persons, and those not interested in looking for a job.
Labour force participation rate: The economic activity of a population depends on the demographic characteristics of that population. The proportion of the economically active population, therefore, differs between sub-groups of that population. These variations are measured by specific activity rates termed as the labour force participation rate. Labour force participation rate is defined as the ratio of the labour force to the working-age population (15 to 64 years), expressed as a percentage.
Unemployment rate: The proportion of the unemployed population to the total population in labour. This rate measures the percentage of the unemployed population in the labour force.
Adapted from the Department of Statistics Malaysia. Retrieved from https://www.dosm.gov.my/v1/index.php?r=column/cthemeByCat&cat=124&bul_id=aUVrUWh2ZnZubkl2RUxEQU15N3ZWdz09&menu_id=U3VPMldoYUxzVzFaYmNkWXZteGduZz09
In this study:
Graduates in the labour force refer to graduates who were: i. Employed:
a. full-time employed; b. part-time employed; or c. chambering law graduates who
received work allowance. ii. Unemployed:
a. waiting for teaching or other work placement; or
b. still searching for a job.
Graduates outside of labour force refer to graduates who were: i. furthering studies or waiting for
placement for further study; ii. chambering law graduates who did
not receive work allowance; iii. attending short courses or training
programmes; iv. having family responsibility or health
problems; v. lacking self-confidence, feeling job
offered was not suitable, or not willing to relocate to other places;
vi. choosing not to work, not interested to work, or taking a break.
Labour force participation rate
=Labour force
Total graduates× 100
Employment rate
=Total employed
Labour force× 100
14.4%
3.2% 2.5%6.9%
2.9% 2.4% 1.9%
22.9%
5.9% 6.9%
14.3%
6.4% 5.3% 4.1%0%
5%
10%
15%
20%
25%
30%
35%
40%
Full-time Part-time Awaitingplacement
Searching Further studies Training Not interested
Employed Unemployed Not in labour force
Male Female

IIUM TRACER STUDY 201728
Tab
le 1
.12
Em
ploy
men
t cha
ract
eris
tics
by k
ulliy
yah
and
gend
er
Tot
al
Ove
rall
AIK
OL
KA
ED
K
EN
MS
KIC
T
KIR
KH
S K
OE
K
OE
D
KA
HS
KO
D
KO
M
KO
N
KO
P K
OS
KLM
Full-
time/
labo
ur fo
rce
(%)
48.7
75
.2
48.3
56
.9
73.0
45
.0
55.7
27
.4
52.4
4.
7 11
.6
90.2
28
.0
37.0
45
.9
Em
ploy
men
t rat
e (%
) 60
.5
91.2
63
.4
66.9
77
.9
61.5
61
.8
49.3
63
.1
11.6
18
.1
95.1
42
.0
49.1
55
.7
Wai
ting
plac
emen
t/to
tal u
nem
ploy
ed
12.1
0.
0 10
.5
5.6
5.7
3.8
5.4
30.1
7.
0 88
.4
78.3
2.
4 51
.0
6.1
4.9
Labo
ur fo
rce
part
icip
atio
n ra
te (
%)
76.9
33
.9
84.4
79
.0
90.4
79
.1
80.8
91
.3
84.6
95
.6
93.9
10
0 90
.1
69.9
70
.1
(Stu
dy &
trai
ning
)/no
t in
labo
ur fo
rce
(%)
73.2
95
.1
38.6
63
.5
69.2
67
.2
75.4
42
.9
52.9
0.
0 11
.1
- 72
.7
78.9
53
.8
Not
look
ing/
tota
l (%
) 6.
2 3.
3 9.
6 7.
7 3.
0 6.
9 4.
7 5.
0 7.
2 4.
4 5.
4 0.
0 2.
7 6.
4 13
.8
N
3782
35
9 28
0 54
0 13
5 91
9 58
8 80
21
8 45
14
7 41
11
0 23
3 87
Mal
e (3
4.2%
) O
vera
ll A
IKO
L K
AE
D
KE
NM
S K
ICT
K
IRK
HS
KO
E
KO
ED
K
AH
S K
OD
K
OM
K
ON
K
OP
KO
S K
LM
Full-
time/
labo
ur fo
rce
(%)
53.5
70
.5
60.2
66
.1
78.3
43
.8
57.0
11
.1
60.5
0.
0 18
.2
87.5
25
.0
18.5
55
.6
Em
ploy
men
t rat
e (%
) 65
.2
93.2
71
.8
75.6
84
.1
62.9
63
.3
22.2
71
.1
0.0
34.1
10
0.0
45.0
37
.0
66.7
Wai
ting
plac
emen
t/to
tal u
nem
ploy
ed (%
) 9.
1 0.
0 8.
7 3.
9 5.
8 3.
4 5.
1 55
.6
7.9
100.
0 59
.1
0.0
50.0
5.
6 11
.1
Labo
ur fo
rce
part
icip
atio
n ra
te (
%)
79.2
41
.5
88.8
77
.9
89.6
80
.9
83.4
69
.2
90.5
10
0.0
91.7
10
0.0
71.4
71
.1
75.0
(Stu
dy &
trai
ning
)/no
t in
labo
ur fo
rce
(%)
73.2
93
.5
46.2
55
.6
62.5
76
.2
69.8
50
.0
100.
0 -
0.0
- 87
.5
77.3
66
.7
Not
look
ing/
tota
l (%
) 5.
6 3.
8 6.
0 9.
8 3.
9 4.
5 5.
0 15
.4
0.0
- 8.
3 -
3.6
6.6
8.3
N
1293
10
6 11
6 16
3 77
22
0 37
9 13
42
5
48
8 28
76
12
Fem
ale
(65.
8%)
Ove
rall
AIK
OL
KA
ED
K
EN
MS
KIC
T
KIR
KH
S K
OE
K
OE
D
KA
HS
KO
D
KO
M
KO
N
KO
P K
OS
KLM
Full-
time/
labo
ur fo
rce
(%)
45.9
76
.0
39.3
53
.0
66.0
45
.4
53.1
29
.7
50.3
5.
3 8.
5 90
.9
27.8
45
.9
44.2
Em
ploy
men
t rat
e (%
) 57
.7
89.3
57
.0
63.0
69
.8
60.9
58
.8
53.1
61
.1
13.2
10
.6
93.9
40
.5
55.0
53
.8
Wai
ting
plac
emen
t/to
tal u
nem
ploy
ed (%
) 13
.8
0.0
11.9
6.
3 5.
7 4.
0 5.
6 26
.6
6.7
86.8
87
.2
3.0
51.9
6.
4 3.
8
Labo
ur fo
rce
part
icip
atio
n ra
te (
%)
76.1
29
.6
82.3
79
.6
91.4
79
.1
76.6
95
.5
84.7
95
.0
94.9
10
0.0
96.3
69
.4
69.3
(Stu
dy &
trai
ning
)/no
t in
labo
ur fo
rce
(%)
73.8
95
.5
34.5
66
.2
80.0
65
.8
81.6
33
.3
51.9
0.
0 20
.0
- 33
.3
81.3
52
.2
Not
look
ing/
tota
l (%
) 6.
3 3.
2 11
.6
6.9
1.7
7.2
4.3
3.0
7.4
5.0
4.0
- 2.
4 5.
7 14
.7
N
2489
25
3 16
4 37
7 58
69
9 20
9 67
17
6 40
99
33
82
15
7 75

BACHELOR’S DEGREE GRADUATES29
Fi
gure
1.3
1 E
mpl
oym
ent c
ateg
ory
by k
ulliy
yah
0%10%
20%
30%
40%
50%
60%
70%
80%
90%
100%
Working full-time
Working part-time
Awating placement
Searching for a job
Studying
Training
Not looking for a job
Working full-time
Working part-time
Awating placement
Searching for a job
Studying
Training
Not looking for a job
Working full-time
Working part-time
Awating placement
Searching for a job
Studying
Training
Not looking for a job
Working full-time
Working part-time
Awating placement
Searching for a job
Studying
Training
Not looking for a job
Working full-time
Working part-time
Awating placement
Searching for a job
Studying
Training
Not looking for a job
Working full-time
Working part-time
Awating placement
Searching for a job
Studying
Training
Not looking for a job
Working full-time
Working part-time
Awating placement
Searching for a job
Studying
Training
Not looking for a job
AIKO
LKA
EDKE
NM
SKI
CTKI
RKH
SKO
EKO
ED
Fem
ale
Mal
e
0%10%
20%
30%
40%
50%
60%
70%
80%
90%
100%
Working full-time
Working part-time
Awating placement
Searching for a job
Studying
Training
Not looking for a job
Working full-time
Working part-time
Awating placement
Searching for a job
Studying
Training
Not looking for a job
Working full-time
Working part-time
Awating placement
Searching for a job
Studying
Training
Not looking for a job
Working full-time
Working part-time
Awating placement
Searching for a job
Studying
Training
Not looking for a job
Working full-time
Working part-time
Awating placement
Searching for a job
Studying
Training
Not looking for a job
Working full-time
Working part-time
Awating placement
Searching for a job
Studying
Training
Not looking for a job
Working full-time
Working part-time
Awating placement
Searching for a job
Studying
Training
Not looking for a job
KAH
SKO
DKO
MKO
NKO
PKO
SKL
M
Fem
ale
Mal
e

IIUM TRACER STUDY 201730
28
Though AIKOL graduates had the lowest labour
force participation rate, they recorded the highest
employment rate at 91.2 per cent, which means
most of the few law graduates who were in the
labour force managed to secure employment. On
the contrary, KOD graduates, who have the
second highest labour force participation rate had
the lowest employment rate, although 88.4 per
cent of those unemployed were awaiting job
placements. The circumstances of KOS graduates,
however, is of concern since over half of the
graduates were unemployed and most were still
searching for a job.
While the employment levels of graduates of most
kulliyyahs were not low, a significant number of
the graduates were in part-time, rather than full-
time, employment. Excluding part-time
employment, the overall full-time employment
rate was only 48.7 per cent. For instance, almost
half of employed KOED graduates were in part-
time employment. Disproportionately fewer
female graduates were employed full-time
compared to male graduates (see Figure 1.30 and
Table 1.12 above).
Among the graduates who were unemployed at
the time of the study, 12.1 per cent were waiting
for job placements. These consist of 13.8 per cent
of female graduates and 9.1 per cent of male
graduates. The proportion of unemployed female
graduates awaiting job placements was higher
than that of male graduates across all kulliyyahs
except KOED, KAHS, and KLM.
Of those who were outside of labour force, 40 per
cent were waiting to further or were furthering
their studies, 17.2 per cent were AIKOL graduates
undergoing chambering (without allowance), and
14.7 per cent were attending courses or training
programmes. The proportion of male and female
graduates in these pursuits were almost equal.
Other graduates staying outside the labour force
included those who wanted to take a break (11.9
per cent), those with family responsibilities or
health issues (8.7 per cent), and those who were
not interested or lack the confidence to work (see
Figure 1.32 below)
The survey reveals a higher proportion of female
graduates (6.3 per cent) compared to male
graduates (5.6 per cent) not looking for a job.
Among them, graduates from KLM recorded the
highest proportion with 13.8 per cent not
interested or looking for a job.
Figure 1.32 Reasons for not participating in the labour force
39.5%
17.2%
14.7%
11.9%
8.7%
8.0%
0% 10% 20% 30% 40%
Waiting/further studies
Chambering (without allowance)
Attending courses/training
Taking a break/travelling
Family responsibility/health problem
Not interested/not willing to relocate/lack self-confidence/other

BACHELOR’S DEGREE GRADUATES31
29
1.3.2 Employment profile of employed graduates
Of the employed graduates, 80 per cent were in
full-time employment while the remaining 20 per
cent were in part-time employment. The majority
of those in full-time employment was in a
permanent job position (45 per cent) or employed
on a contract basis (36 per cent). The rest were
either employed on a temporary basis (15 per
cent), working with family (2 per cent), or
chambering with work allowance (0.4 per cent)
(see Figure 1.33 below).
On the other hand, those who work part-time
were mostly employed on a temporary basis (57
per cent). About 23 per cent were employed on
contract, 12 per cent were self-employed, and the
remaining 6 per cent worked with their family.
Most of the graduates (66 per cent of full-time and
44 per cent of part-time) filled managerial or
professional roles while 6.3 and 3.3 per cent, in
full-time and part-time employment, respectively,
worked as technicians or associate professionals
(see Figure 1.34 and Figure 1.35 below).
Figure 1.33 Graduates by type of employment status
Figure 1.34 Employment status by type of occupation
Figure 1.35 Type of occupation by employment type
0%
10%
20%
30%
40%
50%
60%
Perm
anen
t
Cont
ract
Tem
pora
ry
Self-
empl
oyed
Wor
king
with
fam
ily
Cham
berin
g
Perm
anen
t
Cont
ract
Tem
pora
ry
Self-
empl
oyed
Wor
king
with
fam
ily
Cham
berin
g
Full-time Part-time
46.0%
43.9%
27.0%
20.4%
18.5%
34.9%
42.9%
44.0%
25.6%
23.5%
0% 10% 20% 30% 40% 50% 60% 70% 80% 90% 100%
Managerial/professional
Technician/associate professional
Clerical support
Service/sales
Others
Permanent Contract Temporary Working with family
66.3%
43.9%
6.3%
3.3%
0% 10% 20% 30% 40% 50% 60% 70% 80% 90% 100%
Full-time
Part-time
Manageria/professional Technician/associate professional Clerical support Service/sales Others

IIUM TRACER STUDY 201732
30
The remaining 27.4 and 52.8 per cent, in full-time
and part-time employment respectively, can be
considered underemployed as they were in jobs
for which they were overqualified such as in
clerical support, service and sales, etc. As such, 32
per cent of all IIUM graduates who were working
at the time of the survey were underemployed.
However, it is suspected that the actual level of
underemployment rate is lower as a significant
number of medical and nursing graduates
claimed to be service and sales workers.11 They
may have misidentified themselves as sales or
service workers when working at private clinics or
retail pharmacies.
Nevertheless, the observed level of
underemployment is comparable to the 34 per
cent rate of underemployment of college
graduates in the United States in 2017.12
Female graduates were found to be at a
disadvantage in the workforce. They were found
disproportionately more in part-time, rather than
full-time, employment and more likely to be
underemployed. Over 31 per cent of female
graduates worked in clerical, or service and sales
roles, compared to about 20 per cent of male
graduates. Only 61 per cent of female graduates
were in managerial and professional roles
compared to 65 per cent of male graduates (see
Figure 1.36 below).
Figure 1.36 Type of occupation, employment status, and gender
Overall, the top three sectors 2017 IIUM
graduates worked in were education (15.1 per
cent), professional, scientific, and technical (15
11 Nine of 24 medical and 21 of 38 pharmacy graduates indicated that they were in the service and sales category. 12 Federal Reserve Bank of New York (2018, July 25). The Labour Market for Recent College Graduates.
per cent), and other services (14.4 per cent).
However, the sectoral concentrations differ across
different kulliyyahs. For instance, 28.1 per cent of
Retrieved from https://www.newyorkfed.org/research/college-labour-market/college-labour-market_underemployment_rates.html.
70.4%63.7%
36.8%47.7%
9.9%
4.1%
5.7%
2.1%
7.3%17.7%
19.8%18.5%
8.4% 12.0%
23.5%19.5%
3.9% 2.5%14.2% 12.3%
0%
10%
20%
30%
40%
50%
60%
70%
80%
90%
100%
Male Female Male Female
Full-time Part-time
Managerial/professional Technician/associate professional Clerical support Service/sales Others

BACHELOR’S DEGREE GRADUATES33
31
KENMS graduates worked in the financial and
insurance or takaful sector while most KICT
graduates, expectedly, were in the information
and communication technology sector; 30 per
cent of engineering graduates were employed in
the manufacturing sector, and 40 per cent of
KAED graduates were in the construction sector.
Most KOP, KAHS, and KOD graduates
predictably worked in the health and social
services sector. A diverse group were found
among KOS graduates, who worked in the
financial and insurance or takaful, education, or
other services sectors (see Table 1.13 below).
Table 1.13 Top economic sectors by kulliyyah
AIKOL KAED KENMS
Professional/scientific/ technical Other services Education
57.4%
21.3% 3.7%
Construction Professional/scientific/ technical Other services
39.7% 20.5%
7.3%
Financial/insurance/takaful Other services Professional/scientific/ technical
28.1% 17.9% 13.0%
KICT KIRKHS KOE
Information/communication Professional/scientific/ technical Other services
54.7% 13.7%
12.6%
Education Other services Administrative/support
32.7% 16.5%
8.5%
Manufacturing Information/communication Professional/scientific/ technical
29.6% 15.3% 15.3%
KOED Overall KAHS
Education Wholesale/retail Other services Water/sewerage management
72.2% 8.3% 5.6% 5.6%
Others Education Professional/scientific/ technical Other services
55.5% 15.1% 15.0%
14.4%
Health/social Professional/scientific/ technical Other services
38.1% 25.4%
13.6%
KOD KOM KON
Health/social Professional/scientific/ technical Agriculture/Forestry/Fishery
40.0% 40.0%
20.0%
Professional/scientific/ technical Other services Health/social Wholesale/retail
24.0%
20.0% 16.0% 16.0%
Health/social Professional/scientific/ technical Others
76.9% 7.7%
7.7%
KOP KOS KLM
Health/social Professional/scientific/ technical Other services
39.0% 26.8%
14.6%
Other services Financial/insurance/ takaful Education
20.0% 17.5%
15.0%
Education Other services Financial/insurance/takaful
35.3% 23.5% 11.8%
Among those who worked full-time, KICT
graduates earned the highest with a mean
monthly income of RM2,547.75, followed by
13 Differences in the mean monthly income between graduates of the different kulliyyahs are significant at the 5 per cent level.
KOE graduates with RM2,312.26.13 KOED
graduates earned the lowest with only RM1,250
monthly (see Figure 1.37 below).14
14 Significantly lower than graduates from all other kulliyyahs except KOM, KOD, and KOP, against which there is no significant difference partly due to small sample sizes.

IIUM TRACER STUDY 201734
32
Figure 1.37 Mean monthly income by kulliyyah. (.) number of observations
1.3.3 Comparative profile of graduates with different employment statuses
This section presents a comparative profile of five
categories of graduates in terms of:
Academic performance;
Duration of internship;
Involvement in co-curricular activities;
Job search behaviour;
Income received, or expected income if
not working; and
Number of job interviews attended and
preferred employment sector if not
working.
The five categories are those who were:
i. employed full-time;
ii. employed part-time;
iii. unemployed;
iv. furthering or planning to further studies;
and
v. not interested or not looking for a job.
The results are summarised in Table 1.14 below.
Graduates who were furthering or planning to
further their studies had the highest mean CGPA
of 3.11. This is expected as only students who are
good academically get accepted into graduate
programmes. It could also be that students with
higher CGPA are those who like to study and
would more likely want to continue studying at
the postgraduate level. On the other hand, those
who were unemployed at the time of the survey
reported the lowest mean CGPA of 3.02.
Of the graduates who were still searching for a job
at the time of the convocation, 44 per cent had not
attended any job interviews and a third was called
for only one or two interviews. The remaining
24.4 per cent had attended at least three
interviews.
Graduates who secured full-time employment
started searching for a job actively, on average,
two weeks upon completion of their studies while
those who obtained only part-time employment
started their search slightly later at about 2.5
weeks. In contrast, those who were still
unemployed at the time of the survey only started
searching for work actively, on average, one
month after completion of their studies.
Graduates in full-time employment also
underwent a longer mean internship duration of
3.37 months during their studies compared to
those in part-time employment (2.7 months) or
RM1,250.00RM1,250.00
RM1,379.63RM1,750.00RM1,761.36
RM1,919.45RM1,962.50RM1,969.57RM2,000.00
RM2,074.32RM2,132.72
RM2,198.98RM2,312.26
RM2,547.75
KOED (20)KOD (2)
KOP (27)KOM (16)
AIKOL (88)KIRKHS (329)
KOS (60)KAED (115)
KLM (28)KON (37)
KENMS (243)KAHS (98)KOE (265)KICT (89)

BACHELOR’S DEGREE GRADUATES35
33
the unemployed (2.91 months). Meanwhile,
involvement in co-curricular activities was
slightly higher among graduates with full-time
jobs compared to others.15 Those who were not
interested or not looking for a job were less active
in co-curricular activities as students.
The mean total monthly income, including
allowances, of graduates working full-time, was
RM2,067.40, which was more than twice that of
graduates working part-time.16 The difference is
not unexpected given part-time employees work
fewer hours than full-time workers.
However, there were divergences in income even
within each employment status.17 For instance,
the mean total monthly income of those employed
full-time on a permanent basis was RM2,366.28,
which was significantly higher than those of other
categories.18 Graduates who were employed full-
time on a contract basis earned an average of
RM2,081.55 and the lowest income from full-
time employment were earned by those who
worked on a temporary basis, self-employed, or
with family. Similar patterns apply among
graduates who were in part-time employment.
On average, those employed on permanent basis
received the highest monthly income, followed by
those appointed on contract, and the lowest were
those whose employment was temporary, were
self-employed, or working with family (see Figure
1.38 below).
Table 1.14 Characteristics of different employment statuses
Employed full-time
Employed part-time Unemployed
Further study
Not looking for a job
CGPA 3.07 3.09 3.02 3.11 3.05 Internship duration (months) 3.37 2.70 2.91 2.80 2.69 Co-curricular involvement 3.53 3.49 3.33 3.42 3.23 Monthly income (RM) 2067.40 957.73 2572.32* 2809.56* 2641.41* When searching for a job (months) 0.53 0.61 1.00 1.06 2.61
Preferred job sector
N/A N/A
Government (71.2&) Private multinational (11.7%) Private local (8.6%)
N/A N/A
Note: * expected
15 The co-curriculum overall rating is the mean value of the graduates’ self-ratings of their level of involvement in (i) societies, (ii) clubs, and (iii) sport, on a scale of 1 (not active) to 5 (very active). 16 The income computed is an approximation of the actual income using the mid-point of the range of income given for each response. For example, the incomes within the range RM1,501-RM2,000 are approximated as RM1,750. Incomes of more than RM10,000 are approximated as RM12,000. 17 Employment status is categorized into: (i) full-time employed; (ii) part-time employed; (iii) not working; (iv) others. Those employed are further divided into categories of employment: (i) permanent; (ii) contract;
(iii) temporary; (iv) self-employed; (v) working for family. 18 T-tests indicate that for full-time employment, the income is highest for permanent employees, followed by those on contract, and then temporary, self-employed, and working with family; i.e., permanent > contract > temporary = self-employed = working with family. For part-time employment, the highest income is received by permanent and contract employees, followed by workers categorized as temporary, self-employed, and working for family; i.e., permanent = contract > temporary = self-employed = working for family.

IIUM TRACER STUDY 201736
34
Figure 1.38 Total monthly income (including allowance) by employment status
Interestingly, graduates who were still
unemployed at the time of the survey expected a
higher monthly income of RM2,572.3219. Those
who were planning or already pursuing higher
studies expected an even higher mean income of
RM2,809.56, while those not looking for a job
expected an income of over RM2641.41 if they
were to work. Most of the unemployed graduates
would prefer to work with the government.
Despite the figures, a high salary was not the
topmost criterion for choosing a job among those
unemployed and outside the labour force. Among
those unemployed, the top two criteria were
opportunities for job enhancement and valuable
work experience. On the other hand, job security
and employee benefits were most important
among graduates who were pursuing further
studies. While those who were not looking or
confident to be in the labour market claimed to
give priority to job security and gaining valuable
work experience over others (see Figure 1.39
below).
Figure 1.39 Top criteria in searching for a job among those not working
19 The expected income is also computed based on the mid-point of the range given.
RM2,366.28
RM2,081.55
RM1,303.74
RM1,307.69
RM1,073.53
RM1,531.25
RM1,201.30
RM861.68
RM898.81
RM855.26
Permanent
Contract
Temporary
Self-employed
Working with family
Part-time Full-time
0%2%4%6%8%
10%12%14%16%18%20%
High salary Job security Flexible hours Benefits Opportunitiesfor job
enrichment
Job satisfaction Valuable workexperience
Unemployed Further studies Not looking/confident

BACHELOR’S DEGREE GRADUATES37
35
1.3.4 Determinants of employment
A more robust examination using regression
analyses were undertaken to identify the
significant factors that affect two employment
variables: duration until getting full-time
employment and monthly income obtained from
employment. Analysis of the duration until
getting full-time employment included only
graduates who were in the labour force while
analysis for income obtained from employment
was restricted to only employed graduates, both
full-time and part-time.
Duration until getting full-time employment
The measurement of the duration until getting
full-time employment was based on responses to
two questions in the survey questionnaire. All
graduates were asked about their current job
status: (i) employed full-time, (ii) employed part-
time, (iii) not working, or (iv) others. Those who
were employed were asked further how long they
had to wait for their first job.
For graduates who were employed full-time, the
following values were assigned for the duration
indicator:
Table 1.15 Duration of waiting for the first job
Response to how long have to wait for the first job
Duration indicator
Before completion of studies 0 1 month 1 2 months 2 3 months 3 4 months 4 5 months 5 6 months 6 7 months 7 8 months 8 9 months 9 10 months 10 11 months 11 12 months 12 More than a year 13
For graduates who were in part-time employment
or unemployed, they were assigned the value 13
for the duration indicator.
Several determinants that may affect the duration
until getting full-time employment were
considered. The first was gender as descriptive
statistics suggest that male graduates may have
an advantage over female graduates in the labour
market. The second and third variables were
CGPA and duration of study. Employers may
place importance on these two variables as they
can be construed to signal their level of ability.
The analysis also considered the graduates’ level
of involvement in co-curricular activities and soft
skills. However, it should be noted that these two
variables were based on the graduates’ own
subjective assessment. The co-curriculum score is
the mean value of the graduates’ self-ratings of
their level of involvement in societies, clubs, and
sport, on a scale of 1 (not active) to 5 (very active).
Similarly, the soft skills score is the mean value of
their self-ratings of seven soft-skill items from 1
(poor) to 5 (excellent).
Duration of industrial training or internship and
whether the graduates worked while they were
studying were also included as explanatory
variables as experience in the working
environment may contribute positively to gaining
full-time employment. The analysis also
considered the time elapsed between the
completion of studies and the date of the
convocation since those who completed earlier
would more likely to obtain a full-time job.
The results as shown in Table 1.16 find that in
general, male graduates took a shorter time to
gain full-time employment compared to female

IIUM TRACER STUDY 201738
36
graduates. Further analysis of each kulliyyah
indicates that this finding applies to graduates
from KENMS, KICT, KAED, and KOS. In
addition, those with higher CGPA were able to
gain full-employment earlier than others,
particularly among AIKOL, KENMS, and KOS
graduates. Interestingly, the result is the opposite
for KOP graduates; controlling for other factors,
those with higher CGPA took longer to secure full-
time employment.
Involvement in co-curricular activities matters in
the duration taken to gain full-time employment
only for KOE, KOS, KOED, and KAHS graduates
but not others. The duration KICT and KOED
graduates took to complete their programme has
a negative effect on the time taken to secure full-
time employment. The longer the time they took
to complete their studies, the longer it took them
to gain full-time employment upon completion of
their studies. This variable is not significant for
other graduates.
Internship is a significant determinant only for
KOS and KENMS graduates. Surprisingly, the
level of soft skills of the graduates, as assessed by
themselves, is not a significant determinant
except for AIKOL graduates. For the latter, it
contributed positively to gaining full-time
employment earlier. The lack of impact of soft
skills on employability is contrary to what is
expected as it is often mentioned that employers
are looking for graduates with the necessary soft
skills. Perhaps, other factors take precedence over
the level of soft skills a graduate has in the time
taken to secure full-time employment. Possibly as
well, the graduates’ self-assessed level of soft skills
may not reflect the actual level.
Working while studying affected the duration
until attaining full-time employment for some
graduates. AIKOL graduates who worked while
studying took longer time to secure full-time
employment. However, it significantly facilitated
KOP graduates gain full-time employment
sooner.
Graduates should not delay searching for jobs as
it will also delay gaining full-time employment. As
expected, graduates who completed their studies
earlier took a shorter time to secure full-time jobs.
However, KOED graduates are the exception.
KOED graduates who completed their studies
closer to the date of the convocation took a shorter
time to gain full-time employment compared to
those who completed much earlier.
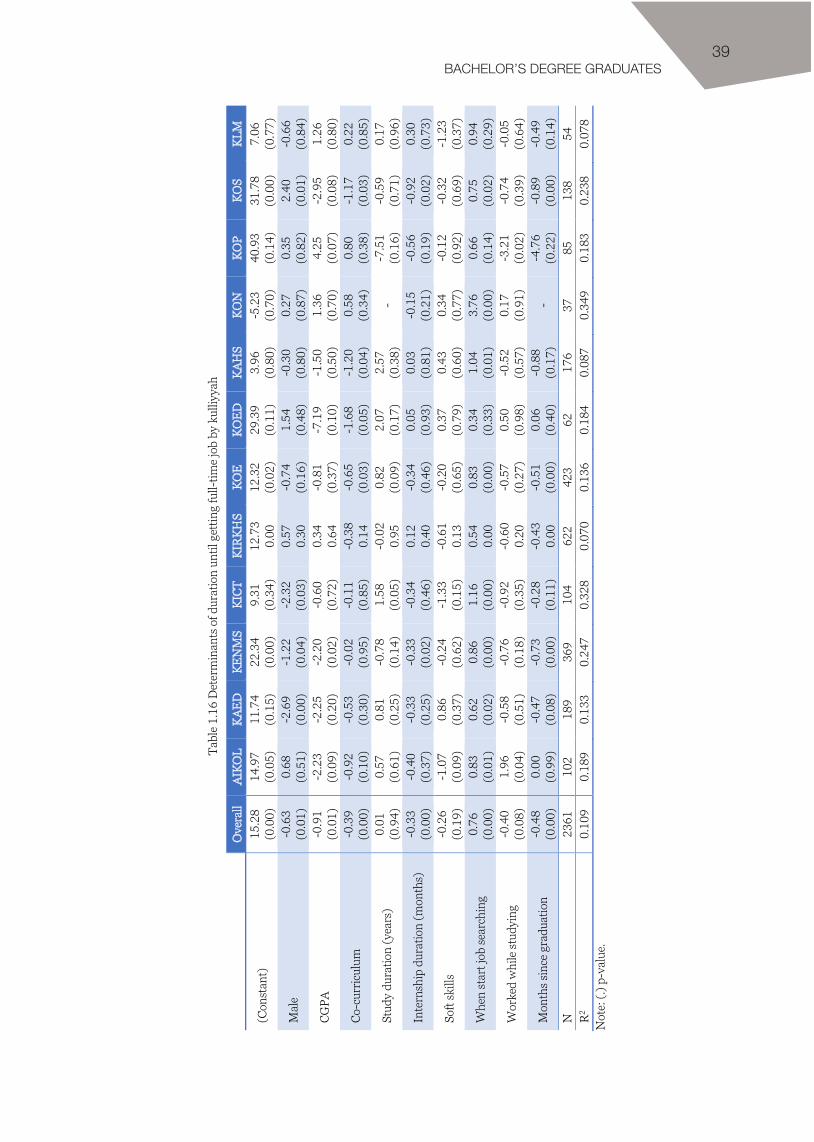
BACHELOR’S DEGREE GRADUATES39
Tab
le 1
.16
Det
erm
inan
ts o
f dur
atio
n un
til g
ettin
g fu
ll-tim
e jo
b by
kul
liyya
h
O
vera
ll A
IKO
L K
AE
D
KE
NM
S K
ICT
K
IRK
HS
KO
E
KO
ED
K
AH
S K
ON
K
OP
KO
S K
LM
(Con
stan
t)
15.2
8 (0
.00)
14
.97
(0.0
5)
11.7
4 (0
.15)
22
.34
(0.0
0)
9.31
(0
.34)
12
.73
0.00
12
.32
(0.0
2)
29.3
9 (0
.11)
3.
96
(0.8
0)
-5.2
3 (0
.70)
40
.93
(0.1
4)
31.7
8 (0
.00)
7.
06
(0.7
7)
Mal
e -0
.63
(0.0
1)
0.68
(0
.51)
-2
.69
(0.0
0)
-1.2
2 (0
.04)
-2
.32
(0.0
3)
0.57
0.
30
-0.7
4 (0
.16)
1.
54
(0.4
8)
-0.3
0 (0
.80)
0.
27
(0.8
7)
0.35
(0
.82)
2.
40
(0.0
1)
-0.6
6 (0
.84)
CG
PA
-0.9
1 (0
.01)
-2
.23
(0.0
9)
-2.2
5 (0
.20)
-2
.20
(0.0
2)
-0.6
0 (0
.72)
0.
34
0.64
-0
.81
(0.3
7)
-7.1
9 (0
.10)
-1
.50
(0.5
0)
1.36
(0
.70)
4.
25
(0.0
7)
-2.9
5 (0
.08)
1.
26
(0.8
0)
Co-
curr
icul
um
-0.3
9 (0
.00)
-0
.92
(0.1
0)
-0.5
3 (0
.30)
-0
.02
(0.9
5)
-0.1
1 (0
.85)
-0
.38
0.14
-0
.65
(0.0
3)
-1.6
8 (0
.05)
-1
.20
(0.0
4)
0.58
(0
.34)
0.
80
(0.3
8)
-1.1
7 (0
.03)
0.
22
(0.8
5)
Stud
y du
ratio
n (y
ears
) 0.
01
(0.9
4)
0.57
(0
.61)
0.
81
(0.2
5)
-0.7
8 (0
.14)
1.
58
(0.0
5)
-0.0
2 0.
95
0.82
(0
.09)
2.
07
(0.1
7)
2.57
(0
.38)
-
-7.5
1 (0
.16)
-0
.59
(0.7
1)
0.17
(0
.96)
Inte
rnsh
ip d
urat
ion
(mon
ths)
-0
.33
(0.0
0)
-0.4
0 (0
.37)
-0
.33
(0.2
5)
-0.3
3 (0
.02)
-0
.34
(0.4
6)
0.12
0.
40
-0.3
4 (0
.46)
0.
05
(0.9
3)
0.03
(0
.81)
-0
.15
(0.2
1)
-0.5
6 (0
.19)
-0
.92
(0.0
2)
0.30
(0
.73)
Soft
ski
lls
-0.2
6 (0
.19)
-1
.07
(0.0
9)
0.86
(0
.37)
-0
.24
(0.6
2)
-1.3
3 (0
.15)
-0
.61
0.13
-0
.20
(0.6
5)
0.37
(0
.79)
0.
43
(0.6
0)
0.34
(0
.77)
-0
.12
(0.9
2)
-0.3
2 (0
.69)
-1
.23
(0.3
7)
Whe
n st
art j
ob s
earc
hing
0.
76
(0.0
0)
0.83
(0
.01)
0.
62
(0.0
2)
0.86
(0
.00)
1.
16
(0.0
0)
0.54
0.
00
0.83
(0
.00)
0.
34
(0.3
3)
1.04
(0
.01)
3.
76
(0.0
0)
0.66
(0
.14)
0.
75
(0.0
2)
0.94
(0
.29)
Wor
ked
whi
le s
tudy
ing
-0.4
0 (0
.08)
1.
96
(0.0
4)
-0.5
8 (0
.51)
-0
.76
(0.1
8)
-0.9
2 (0
.35)
-0
.60
0.20
-0
.57
(0.2
7)
0.50
(0
.98)
-0
.52
(0.5
7)
0.17
(0
.91)
-3
.21
(0.0
2)
-0.7
4 (0
.39)
-0
.05
(0.6
4)
Mon
ths
sinc
e gr
adua
tion
-0.4
8 (0
.00)
0.
00
(0.9
9)
-0.4
7 (0
.08)
-0
.73
(0.0
0)
-0.2
8 (0
.11)
-0
.43
0.00
-0
.51
(0.0
0)
0.06
(0
.40)
-0
.88
(0.1
7)
- -4
.76
(0.2
2)
-0.8
9 (0
.00)
-0
.49
(0.1
4)
N
2361
10
2 18
9 36
9 10
4 62
2 42
3 62
17
6 37
85
13
8 54
R
2 0.
109
0.18
9 0.
133
0.24
7 0.
328
0.07
0 0.
136
0.18
4 0.
087
0.34
9 0.
183
0.23
8 0.
078
Not
e: (.
) p-v
alue
.

IIUM TRACER STUDY 201740
38
Total monthly income
Total monthly income was obtained from the
question asking the graduates their total monthly
income including allowances. The possible
responses were “RM500 and below”, “RM501 to
RM100”, and so on until “RM5001 to RM10,000”
and “more than RM10,000”. Midpoint values
were used to approximate the total monthly
income for analysis.
Again, gender was considered as a factor as male
graduates appear to have an advantage in the job
market. CGPA was also considered as those with
higher CGPA are expected to perform better in the
workplace. Active involvement in co-curricular
activities and soft-skills presumably also
contribute positively to job performance and
therefore income. The analysis also considered
the duration of industrial training or internship as
an explanatory variable as the experience gained
is expected to contribute positively to actual work
performance.
Apart from these variables, the graduates’
assessment of their own ability and capability in
performing their jobs was also considered. This
variable was measured as the mean value of their
ratings of five items, namely, (i) workplace
adaptability, (ii) problem-solving and decision-
making skills, (iii) confidence to perform the task
required, (iv) working in a team, and (v)
communication skills; on a scale of 1 (extremely
low) to 5 (extremely high). A dummy variable to
differentiate between full-time and part-time
employment was included to control for the
differences in income between these two groups
of workers.
The findings as given in Table 1.17 show that,
even after controlling for the other factors, there
was a significant difference in the mean incomes
between male and female graduates. On average,
employed male graduates earned higher incomes
than their female counterparts, particularly for
those from AIKOL, KIRKHS, KENMS, KAED,
KOP, and KOED. Higher CGPA also implied
higher incomes for KIRKHS, KENMS, and KAED
graduates.
Surprisingly, the result for involvement in co-
curricular activities indicates that it had an
adverse effect on income for AIKOL, KIRKHS,
KOED graduates. Involvement in co-curricular
activities only benefited KON graduates.
Industrial training or internship was not a
significant factor in obtaining higher incomes for
most except KAHS graduates, and unexpectedly,
those who went through longer internships while
studying received lower monthly incomes from
work.
The level of soft skills a graduate had did not have
any significant impact on total monthly income
once other factors are controlled for. This finding
is consistent with the earlier results for duration
taken to obtain full-time employment. Work
performance matters in determining the income
received from work. The better the graduates
were in terms of workplace adaptability, problem-
solving and decision-making skills, confidence to
perform task, teamwork, and communication
skills, the higher reward they received in terms of
financial remuneration.
Even after considering the other factors, there
exists a significant difference in income between
full-time and part-time employment. On average,
a graduate with full-time employment received
over RM1,200 more than one with only part-time
employment. The biggest difference is for KOED
graduates, where on average, the income received
from a full-time job was RM1,663.17 higher than
that from a part-time job. Earlier, descriptive

BACHELOR’S DEGREE GRADUATES41
39
statistics indicate that graduates who were in
part-time employment were mostly on a
temporary basis. It may be a choice taken by the
graduates while searching for a permanent full-
time position. However, a full-time job would
ensure a more stable and favourable financial
situation for the graduates.

IIUM TRACER STUDY 201742
Tab
le 1
.17
Det
erm
inan
ts o
f mon
thly
inco
me
from
em
ploy
men
t by
kulli
yyah
O
vera
ll A
IKO
L K
AE
D
KE
NM
S K
ICT
K
IRH
S K
OE
K
OE
D
KA
HS
KO
N
KO
P K
OS
KLM
(Con
stan
t)
-577
.99
(0.1
0)
-91.
28
(0.9
6)
-223
.53
(0.6
7)
-140
5.70
(0
.04)
-1
905.
07
(0.0
0)
-416
.36
(0.5
9)
206.
87
(0.8
2)
3171
.48
(0.5
1)
1310
.05
(0.3
7)
2835
.08
(0.1
9)
-756
.99
(0.7
1)
333.
62
(0.8
2)
5994
.00
(0.0
7)
Mal
e 41
2.87
(0
.00)
11
89.1
7 (0
.00)
19
4.97
(0
.08)
32
9.64
(0
.01)
-1
20.9
5 (0
.14)
33
6.82
(0
.01)
19
9.03
(0
.15)
14
78.4
1 (0
.06)
-7
4.73
(0
.68)
-2
11.7
8 (0
.40)
10
62.8
7 (0
.01)
15
8.03
(0
.51)
14
8.91
(0
.71)
CG
PA
443.
16
(0.0
0)
629.
29
(0.2
5)
426.
65
(0.0
4)
601.
01
(0.0
0)
361.
25
(0.4
5)
489.
78
(0.0
0)
159.
78
(0.4
0)
-917
.94
(0.3
9)
-180
.52
(0.6
1)
-268
.96
(0.6
3)
62.5
2 (0
.89)
42
8.48
(0
.24)
-4
42.5
7 (0
.56)
Co-
curr
icul
um
-127
.43
(0.0
0)
-603
.60
(0.0
1)
-1.0
9 (0
.95)
-8
4.34
(0
.20)
-1
7.47
(0
.11)
-1
80.8
7 (0
.01)
28
.65
(0.7
0)
-646
.63
(0.0
1)
-6.3
7 (0
.95)
17
9.23
(0
.08)
16
4.69
(0
.40)
-1
93.9
4 (0
.14)
-2
35.2
4 (0
.24)
Inte
rnsh
ip d
urat
ion
-6.6
0 (0
.57)
-1
20.5
3 (0
.45)
29
.87
(0.3
0)
-40.
19
(0.1
1)
64.6
4 (0
.84)
39
.89
(0.3
0)
74.8
2 (0
.49)
-2
11.3
1 (0
.25)
-5
2.79
(0
.00)
-1
6.07
(0
.37)
-5
4.87
(0
.52)
-6
.65
(0.9
3)
-73.
35
(0.6
0)
Soft
ski
lls
-70.
75
(0.2
2)
-403
.09
(0.1
6)
58.4
6 (0
.84)
-7
.25
(0.9
5)
-395
.36
(0.5
3)
-93.
21
(0.4
6)
235.
06
(0.1
0)
467.
89
(0.4
4)
-23.
27
(0.8
8)
104.
91
(0.6
4)
42.9
8 (0
.87)
-5
5.61
(0
.74)
-2
42.5
7 (0
.23)
Wor
k pe
rfor
man
ce
181.
86
(0.0
0)
589.
42
(0.0
7)
-43.
43
(0.5
8)
266.
65
(0.0
3)
805.
34
(0.0
1)
144.
14
(0.2
6)
-195
.30
(0.1
5)
434.
34
(0.4
7)
151.
50
(0.3
2)
-191
.37
(0.3
3)
75.3
8 (0
.79)
18
.12
(0.9
2)
-293
.87
(0.3
1)
Wor
king
full-
time
1229
.31
(0.0
0)
1537
.44
(0.0
0)
1013
.29
(0.0
0)
1015
.50
(0.0
0)
1217
.06
(0.0
0)
1167
.55
(0.0
0)
1057
.16
(0.0
0)
1663
.17
(0.0
1)
1218
.74
(0.0
0)
53.7
2 (0
.92)
85
3.24
(0
.00)
10
87.0
4 (0
.00)
99
2.03
(0
.02)
N
16
12
110
124
276
88
403
271
51
115
35
37
71
31
R2
0.19
0.
20
0.41
0.
22
0.39
0.
19
0.11
0.
41
0.35
0.
16
0.43
0.
33
0.34
N
ote:
(.) p
-val
ue

MASTER’S DEGREE GRADUATES
2PART

44IIUM TRACER STUDY 2017
42
2.1 Profile of graduates
2.1.1 Demographic profile
A total of 583 master’s degree graduates took part
in the Graduate Tracer Study 2017 upon the 33rd
IIUM Convocation.
More than two thirds (69.3 per cent) of the
graduates were Malaysian while the remaining
30.7 per cent were non-Malaysian. In terms of
gender, 46.7 per cent of all graduates were female
and Malaysian, though they were more male than
female non-Malaysian graduates (see Figure 2.1
below).
Figure 2.1 Graduates by gender and origin
2.1.2 Distribution according to kulliyyah
Figure 2.2 Graduates by kulliyyah
There are 16 kulliyyahs and institutes offering
master’s degree programmes at IIUM. The
number of graduates from each kulliyyah
correlates with the number of programmes
offered by the respective kulliyyahs. The highest
number of graduates were from KIRKHS, which
offers 13 programmes, followed by KENMS with
six programmes, and KOE with nine
programmes.
There were more female than male Malaysian
graduates except from KICT and KOE. While
there were more male than female non-Malaysian
graduates from all kulliyyahs except KICT and
KOED.
KOD does not offer any postgraduate programme
and no non-Malaysian graduated from INHART
and KON (see Figure 2.2 above).
23%
47%
18%
12%Malaysian male
Malaysianfemale
Non-Malaysianmale
Non-Malaysianfemale
583graduates
0
10
20
30
40
50
60
70
80
90
AIKOL IIiBF INHART ISTAC KAED KENMS KICT KIRKHS KOE KOED KAHS KOM KON KOP KOS KLM
Malaysian female Malaysian male Non-Malaysian female Non-Malaysian male

MASTER’S DEGREE GRADUATES45
43
2.1.3 Sponsorship
Half of Malaysian graduates funded their studies
with scholarships from various government
agencies and PTPTN loans while the remaining
48 per cent were self-sponsored. On the other
hand, 87 per cent of non-Malaysian graduates
were self-sponsored (see Figure 2.3 below).
Figure 2.3 Graduates by sponsorship
2.1.4 Employment while studying
Sixty-three per cent of all graduates; consisting of
56.5 per cent of full-time students and 93 per cent
of part-time students worked through their
studies (see Figure 2.4 below).
Figure 2.4 Employment while studying
50%
13%
48%
87%
0%
10%
20%
30%
40%
50%
60%
70%
80%
90%
100%
Malaysian Non-Malaysian
JPA/MARA/PTPTN Other scholarships
Self-sponsored
272
95
209
7
0%
10%
20%
30%
40%
50%
60%
70%
80%
90%
100%
Full-time Part-time
Worked Did not work

46IIUM TRACER STUDY 2017
44
2.1.5 Mode and duration of study
Most of the master’s graduates were full-time
students; only 18 per cent pursued their degrees
part-time (see Figure 2.5 below).
Figure 2.5 Graduates by mode of study
Duration of study refers to the length of time
graduates take to complete their studies.
According to IIUM Centre for Postgraduate
Studies (CPS), the normal duration for
completing a master’s degree is two years in full-
time mode and four years in part-time mode,
except for executive programmes offered by IIUM
academic centres, which are one to two-year
programmes.
There are three modes of study for non-executive
programmes: (i) coursework, (ii) research, and
(iii) coursework and research. The most common
mode of study was the mixed coursework and
research mode chosen by 42 per cent of the
graduates. A quarter of the graduates opted for
coursework only, and 18.9 per cent chose to do
their master’s by research only. The remaining
14.1 per cent underwent executive master’s
programmes (see Figure 2.6 below).
Generally, graduates took longer than the normal
period to complete their study. Of the graduates
who studied full-time, only 56.3 per cent of those
who pursued their degree by coursework
graduated on time. Full-time graduates who did
their degree by research or coursework and
research modes took even longer, on average.
Their graduate-on-time (GOT) rates were 7.5 and
12.1 per cent, respectively, and half of these
graduates took more than 3.4 and three years,
respectively, to complete their studies.
Figure 2.6 Graduates by programme mode of study
The survey also revealed that a KIRKHS graduate
graduated in less than a year by coursework and
research full-time, while on the other end, another
graduate from KOM took 6.33 years to complete
a programme by research full-time.
GOT rates for graduates in part-time mode, while
not satisfactory, were higher than that of those in
full-time mode. The highest rate was recorded by
graduates who studied by coursework; over 85
per cent of whom were able to complete their
programmes within four years. The rates were
significantly lower among those who pursued
their degree by research (50 per cent) or mixed
coursework and research (16.7 per cent) (see
Table 2.1 below).
82%
Full-time Part-time
583graduates
119 27
1064
215
30
41
41
0%
10%
20%
30%
40%
50%
60%
70%
80%
90%
100%
Full-time Part-time
Coursework Research
Coursework & research Executive

MASTER’S DEGREE GRADUATES47
45
GOT rates of graduates who pursued their studies
full time on coursework and research mode, the
most common mode of study, were dismal.20 The
highest rate was only 12.5 per cent for KOE,
which means only 12.5 per cent of its graduates
were able to complete their programme within
two years. Worse still for KIRKHS, KENMS, and
KOED. Only 10.8 and 6.5 per cent of KIRKHS
and KENMS graduates, respectively, completed
their studies on time. None of the 23 KOED
graduates managed to graduate on time (see
Table 2.2 below).
Table 2.1 Duration of study by mode of study
20 Kulliyyahs with small number of graduates were excluded as comparisons will not be meaningful.
Coursework Research
Coursework & research Executive Overall
Full-time GOT (%) 56.3 7.5 12.1 - -
Median 2.00 3.42 3.00 1.58 2.75
Min 1.17 1.08 0.75 0.58 0.58
Max 5.42 6.33 6.25 2.67 6.33
N 119 106 215 41 481
Part-time GOT (%) 85.2 50.0 16.7 - -
Median 3.42 4.75 5.38 2.42 3.42
Min 1.42 2.25 3.50 1.58 1.42
Max 5.67 6.25 7.00 4.00 7.00
N 27 4 30 41 102

48IIUM TRACER STUDY 2017
46
Table 2.2 Duration of study by mode of study and kulliyyah
AIK
OL
KA
ED
KE
NM
S
KIC
T
KIR
KH
S
KO
E
KO
ED
KA
HS
KO
M
KO
N
KO
P
KO
S
KLM
IIiB
F
INH
AR
T
IST
AC
Executive Full-time
GOT (%) - - Median 1.42 1.58 Min 1.00 0.58 Max 2.42 2.67 N 10 31
Part-time GOT (%) - - Median 2.42 2.67 Min 1.58 1.58 Max 4 3.58 N 13 28
Coursework Full-time
GOT (%) 75.0 52.6 82.4 52.1 83.3 7.7 50.0 Median 1.83 2.00 1.58 2.00 1.50 3.17 2.13 Min 1.42 1.42 1.42 1.42 1.17 2.00 1.67 Max 3.00 3.42 2.83 5.42 2.50 4.58 2.58 N 8 19 17 48 12 13 2
Part-time GOT (%) 100 0.0 100 81.8 83.3 Median 1.42 5.67 2.00 3.42 4.00 Min 1.42 5.67 2.00 2.42 3.00 Max 2.42 5.67 2.00 5.42 4.25 N 6 1 1 11 6
Research Full-time
GOT (%) 0.0 12.5 0.0 66.7 0.0 0.0 20.0 4.2 0.0 20.0 0.0 0.0 Median 5.33 2.96 3.17 1.58 3.25 3.42 2.58 3.83 2.67 2.42 3.79 2.71 Min 5.33 1.92 2.33 1.08 2.33 3.42 1.75 1.83 2.33 2.00 2.33 2.33 Max 5.33 4.42 3.83 2.50 4.67 3.42 4.00 6.33 3.00 4.83 4.42 3.42 N 1 16 3 3 17 1 10 24 2 5 16 0 8
Part-time GOT (%) 0.0 100 0.0 Median 6.25 3.13 5.50 Min 6.25 2.25 5.50 Max 6.25 4 5.50 N 1 2 1
Coursework & research Full-time
GOT (%) 33.3 40.0 6.5 14.3 10.8 12.5 0.0 50.0 0.0 33.3 33.3 Median 2.33 2.08 3.42 2.67 3.25 2.71 4.00 1.79 2.92 2.58 3.25 Min 1.75 2.00 2.00 2.00 0.75 1.50 2.08 1.50 2.83 1.75 1.83 Max 4.08 2.33 5.58 5.83 6.25 5.25 6.00 2.08 4.00 5.08 3.33 N 3 5 31 7 83 40 23 2 6 12 3
Part-time GOT (%) 100 50.0 14.3 0.0 0.0 0 Median 3.92 4.46 5.25 5.92 5.58 5.17 Min 3.92 3.5 3.58 4.42 4.33 5.00 Max 3.92 6.0 6.00 7.00 6.58 6.00 N 1 6 7 4 9 3

MASTER’S DEGREE GRADUATES49
47
2.2 Evaluation of academic programmes, facilities, and services
2.2.1 Relevance and helpfulness of study programme
Graduates were asked to evaluate the relevance
and helpfulness of their respective study
programmes to their current jobs by rating them
on a scale of 1 (extremely low or not helpful at all)
to 5 (extremely high or extremely helpful).
Overall, IIUM master’s degree programmes were
evaluated by the graduates as both relevant and
helpful to their current jobs with respective mean
ratings significantly above 4.
While most of both Malaysian and non-
Malaysian graduates gave their programmes
ratings higher than 4 for both relevance and
helpfulness, Malaysian graduates gave higher
ratings than non-Malaysian graduates for
relevance. Compared to others, KOS graduates
rated their programmes only moderately relevant
and helpful with mean ratings not significantly
different from 3 (see Figure 2.7 below).
Figure 2.7 Relevance and helpfulness of study programmes
2.2.2 Curriculum
The graduates were also asked to rate the contents
of the study programmes in terms of several
aspects, as in Table 2.3 below, from 1 (not
satisfied at all) to 5 (extremely satisfied). In
general, graduates across all kulliyyahs were
satisfied with the curriculum offered by IIUM,
with mean ratings significantly above 3 overall.
The graduates gave several suggestions to
improve the quality of the programmes.
Graduates, particularly from ISTAC, proposed
improvements to the management of the
programmes regarding teaching and learning,
scheduling of courses, assessment, and class
activities.
Another suggestion was to restructure the
programmes and courses to meet the needs of
industry and the job market, by removing
irrelevant courses and offering new courses to
cover new knowledge.
The graduates also proposed more opportunities
and funding for attending conferences, assistance
in publication, and training to improve analytical
skills to enhance research activities.
1
2
3
4
5
AIKO
L
KAED
KEN
MS
KICT
KIRK
HS
KOE
KOED
KAH
S
KOM
KON
KOP
KOS
KLM
IIiBF
INH
ART
ISTA
C
Tota
l
Relevance Malaysian Relevance Non-Malaysian Helpfulness Malaysian
Helpfulness Non-Malaysian Relevance Total Helpfulness Total

50IIUM TRACER STUDY 2017
48
Table 2.3 Evaluation of curriculum by kulliyyah
AIK
OL
KA
ED
KE
NM
S
KIC
T
KIR
KH
S
KO
E
KO
ED
KA
HS
KO
M
KO
S
KLM
IIiB
F
INH
AR
T
IST
AC
Tot
al
Suitability of programme 4.5 4.5 4.3 4.5 4.3 4.2 4.4 4.4 4.8 4.0 4.5 4.7 4.3 4.3 4.4
Theoretical & practical balance 4.2 4.5 4.0 4.0 4.1 4.0 4.1 4.4 4.6 4.1 4.3 4.4 4.1 4.0 4.1
Compulsory co-curriculum 4.3 4.3 3.9 4.0 4.0 4.0 4.2 4.4 4.5 3.6 4.0 4.5 3.7 4.7 4.1
Compulsory subjects 4.4 4.5 4.2 4.3 4.3 4.0 4.3 4.3 4.6 3.9 4.3 4.5 4.3 4.7 4.3 Variety of co-curriculum 4.2 4.5 3.9 4.2 4.2 4.0 4.3 4.5 4.6 3.9 4.3 4.5 3.3 5.0 4.1
Prepare for working life 4.1 4.5 3.9 4.0 4.0 3.8 4.1 4.2 4.6 3.9 4.7 4.5 4.0 4.0 4.0
Malaysian 4.6 4.5 4.2 4.1 4.3 4.0 4.4 4.3 4.7 3.9 4.0 4.6 3.8 4.2 4.3
Non-Malaysian 3.6 4.0 3.7 4.0 3.9 3.8 3.9 3.0 4.3 3.0 4.5 4.6 N/A 4.5 3.9
Total 4.3 4.4 4.0 4.1 4.0 3.9 4.2 4.2 4.6 3.8 4.3 4.5 3.8 4.4 4.1
Note: Total value was computed by taking the mean value of all items
2.2.3 Acquired skills
ICT skills
Overall, the graduates were most familiar with
Microsoft Word (83.7 per cent) and PowerPoint
(76.3 per cent) and rated their skills on the two
applications as good with ratings ranging from
4.0 to 4.4. KOE graduates, however, were more
familiar with Microsoft Excel than Word (see
Table 2.4 below).
Table 2.4 Top ICT skills by kulliyyah
Overall AIKOL Microsoft Word Microsoft PowerPoint
83.7% 76.3%
Microsoft PowerPoint Microsoft Word
95.1%
92.7%
KENMS KIRKHS Microsoft PowerPoint Microsoft Word
84.7%
82.9%
Microsoft PowerPoint Microsoft Word
98.7% 89.5%
KOE KOED Microsoft Excel Microsoft Word
64.4% 60.3%
Microsoft Word Microsoft PowerPoint
94.4% 87.0%
Soft skills
Aspects of soft skills, as in Table 2.5 below, were
rated from 1 (poor) to 5 (excellent). Overall, the
graduates rated themselves positively with mean
ratings greater than 4 across all kulliyyahs except
for two graduates from KON. KOM graduates
rated their soft skills slightly higher than the
others in all aspects.
Life skills
Mean ratings greater than 4 across all kulliyyahs
suggest that education at IIUM has influenced the
lives of the graduates a lot. Again, slightly higher
ratings were given by KOM graduates than others
(see Table 2.6 below).
Language proficiency
Overall, the graduates rated their English and
Malay language proficiency as good with mean
ratings greater than 3.5. Most graduates rated
themselves to be significantly better in the
English than the Malay language (see Figure 2.8
below).

MASTER’S DEGREE GRADUATES51
49
Table 2.5 Soft skills by kulliyyah
AIK
OL
KA
ED
KE
NM
S
KIC
T
KIR
KH
S
KO
E
KO
ED
KA
HS
KO
M
KO
N
KO
P
KO
S
KLM
IIiB
F
INH
AR
T
IST
AC
Tot
al
Interpersonal communication 4.3 4.2 4.3 4.4 4.2 4.1 4.2 4.2 4.7 3.5 4.2 4.4 4.3 4.4 4.4 4.3 4.3
Creative & critical thinking 4.5 4.2 4.2 4.4 4.2 4.2 4.4 4.2 4.6 3.5 4.4 4.4 4.5 4.4 4.5 4.7 4.3
Problem-solving 4.5 4.2 4.3 4.3 4.2 4.3 4.3 4.2 4.6 4.0 4.4 4.4 4.5 4.2 4.4 4.3 4.3 Analytical 4.5 4.2 4.3 4.4 4.2 4.3 4.3 4.3 4.6 4.0 4.4 4.6 4.5 4.4 4.5 4.3 4.3 Teamwork 4.4 4.3 4.4 4.5 4.3 4.1 4.4 4.5 4.7 3.5 4.4 4.5 4.7 4.4 4.5 4.7 4.4 Inculcating & practising positive values
4.5 4.4 4.4 4.5 4.4 4.2 4.4 4.5 4.7 4.0 4.4 4.4 4.7 4.4 4.4 4.7 4.4
General knowledge & current issues 4.5 4.3 4.3 4.4 4.2 4.0 4.2 4.2 4.6 4.0 4.2 4.3 4.5 4.3 4.4 4.7 4.3
Total 4.5 4.3 4.3 4.4 4.2 4.2 4.3 4.3 4.6 3.8 4.3 4.4 4.5 4.4 4.4 4.3 4.3 Note: Total value was computed by taking the mean value of all items
Table 2.6 Life skills by kulliyyah
AIK
OL
KA
ED
KE
NM
S
KIC
T
KIR
KH
S
KO
E
KO
ED
KA
HS
KO
M
KO
N
KO
P
KO
S
KLM
IIiB
F
INH
AR
T
IST
AC
Tot
al
Develop self-confidence 4.4 4.5 4.4 4.4 4.4 4.3 4.5 4.5 4.5 4.0 4.2 4.4 4.8 4.5 4.8 4.7 4.4 Enhance self-maturity 4.4 4.5 4.4 4.6 4.4 4.4 4.4 4.5 4.6 4.0 4.4 4.3 5.0 4.6 4.8 4.7 4.4 Develop self-resilience 4.4 4.4 4.4 4.4 4.5 4.4 4.4 4.5 4.6 4.0 4.4 4.3 4.8 4.5 4.8 4.7 4.4 Become more knowledgeable 4.5 4.5 4.5 4.6 4.5 4.3 4.5 4.5 4.7 4.0 4.4 4.3 5.0 4.6 4.8 4.7 4.5
Enhance interest in learning 4.5 4.5 4.4 4.5 4.5 4.4 4.6 4.6 4.6 4.0 4.4 4.3 4.8 4.4 4.0 5.0 4.5
More sensitive towards current affairs 4.4 4.3 4.4 4.4 4.3 4.2 4.3 4.3 4.5 4.0 4.4 4.1 4.7 4.4 4.3 5.0 4.4
Ability to be independent 4.5 4.6 4.4 4.6 4.5 4.4 4.5 4.5 4.7 4.0 4.4 4.3 4.8 4.4 4.6 5.0 4.5
Creative & critical thinking 4.4 4.5 4.4 4.5 4.4 4.4 4.4 4.4 4.7 4.0 4.4 4.3 4.8 4.6 4.5 5.0 4.4
Ready to face the working life & its challenges
4.4 4.4 4.3 4.5 4.4 4.3 4.4 4.3 4.7 4.0 4.4 4.3 4.8 4.6 3.9 4.7 4.4
Problem-solving & decision-making 4.5 4.5 4.4 4.5 4.5 4.4 4.3 4.5 4.6 4.0 4.4 4.3 4.8 4.6 4.3 4.7 4.4
Teamwork 4.4 4.5 4.4 4.4 4.4 4.2 4.5 4.5 4.6 4.0 4.4 4.3 4.8 4.4 4.3 4.7 4.4 Effective communication 4.5 4.5 4.4 4.6 4.5 4.3 4.4 4.5 4.5 4.0 4.4 4.4 4.8 4.4 4.4 4.7 4.5
Total 4.4 4.5 4.4 4.4 4.4 4.3 4.4 4.5 4.6 4.0 4.4 4.3 4.8 4.5 4.4 4.8 4.4 Note: 1 (has no influence at all), 5 (has a lot of influence)
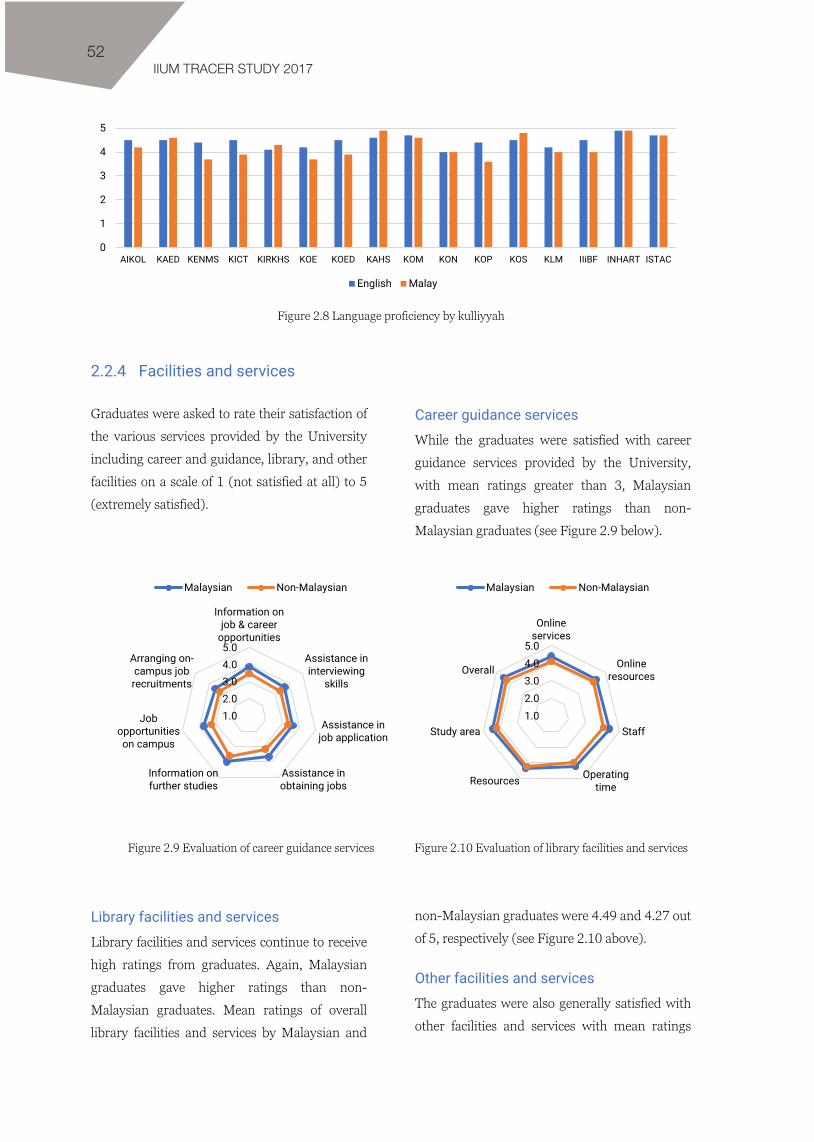
52IIUM TRACER STUDY 2017
50
Figure 2.8 Language proficiency by kulliyyah
2.2.4 Facilities and services
Graduates were asked to rate their satisfaction of
the various services provided by the University
including career and guidance, library, and other
facilities on a scale of 1 (not satisfied at all) to 5
(extremely satisfied).
Career guidance services
While the graduates were satisfied with career
guidance services provided by the University,
with mean ratings greater than 3, Malaysian
graduates gave higher ratings than non-
Malaysian graduates (see Figure 2.9 below).
Figure 2.9 Evaluation of career guidance services
Figure 2.10 Evaluation of library facilities and services
Library facilities and services
Library facilities and services continue to receive
high ratings from graduates. Again, Malaysian
graduates gave higher ratings than non-
Malaysian graduates. Mean ratings of overall
library facilities and services by Malaysian and
non-Malaysian graduates were 4.49 and 4.27 out
of 5, respectively (see Figure 2.10 above).
Other facilities and services
The graduates were also generally satisfied with
other facilities and services with mean ratings
0
1
2
3
4
5
AIKOL KAED KENMS KICT KIRKHS KOE KOED KAHS KOM KON KOP KOS KLM IIiBF INHART ISTAC
English Malay
1.02.03.04.05.0
Information onjob & career
opportunities
Assistance ininterviewing
skills
Assistance injob application
Assistance inobtaining jobs
Information onfurther studies
Jobopportunitieson campus
Arranging on-campus jobrecruitments
Malaysian Non-Malaysian
1.02.03.04.05.0
Onlineservices
Onlineresources
Staff
OperatingtimeResources
Study area
Overall
Malaysian Non-Malaysian

MASTER’S DEGREE GRADUATES53
51
greater than 3.5. Malaysian graduates reported
higher levels of satisfaction with mean ratings
greater than 4 (see Figure 2.11 below).
Similar responses were received in the
supplementary IIUM Tracer Study, summarised
in Table 2.7 below. Graduates were mostly
satisfied with the facilities and services provided
by the University, with Malaysian graduates
giving higher ratings than non-Malaysian
graduates.
A few facilities received less satisfactory ratings of
less than 3. Non-Malaysian graduates disagreed
that the condition of toilets at the mahallahs was
good. Graduates were also generally concerned
about the handling of building defects and
availability of safety equipment. Non-Malaysian
graduates also disagreed that thefts and
disciplinary cases are handled effectively.
Figure 2.11 Evaluation of other facilities and services
Suggestions
KULLIYYAH
The main suggestion given by the graduates
concerned air-conditioners, lightings, and
furniture in classes, laboratories, and in other
teaching venues. The fixtures need to be replaced,
fixed, or upgraded, as many were in poor
condition. The graduates also felt that kulliyyah
administrative staff should be more responsive to
the needs and requests of students. In addition,
kulliyyahs should provide discussion rooms or
lounges for the postgraduate students.
Apart from the general suggestions above, 33 per
cent of ISTAC graduates suggested improvements
to the buildings and lecture rooms at the institute.
On the other hand, 40 per cent of the KOP
graduates felt that improvements were needed
regarding the overall management and
administration of the kulliyyah in maintaining the
facilities, addressing student complaints, and
improving efficiency.
MAHALLAH
With respect to the mahallahs, the graduates
suggested better internet access, particularly
0.0
1.0
2.0
3.0
4.0
5.0
Laboratories,studios, workshops
Health centre
Transportation
Accommodation
Lecture halls &classrooms
Sport facilities
CafeteriaICT facilities &services
Study area
Campus bookshop
Online integratedlearning system
Campus security
Parking
Malaysian Non-Malaysian

54IIUM TRACER STUDY 2017
52
better Wi-Fi coverage, higher connection speed,
and better network availability. In addition,
parking facilities needed to be upgraded,
particularly in terms of management of parking
registration and parking areas, including the
availability of covered parking spaces. Lastly, it
was suggested that the room registration process
should be made smoother and more efficient.
Table 2.7 Evaluation of facilities and services, IIUM Tracer Study
Malaysian Non-Malaysian
Mahallah room facilities are in good condition 3.20 2.94
Mahallah toilets are always in good condition 3.01 2.61
Mahallah compound and landscape are clean and well maintained 3.31 2.98
Number of auxiliary services provided is adequate 3.21 3.09
Condition of auxiliary services is good 3.23 3.07
Number of venue facilities is adequate 3.33 3.22
Condition of venue facilities is good 3.29 3.18
Number of food outlets is adequate 3.23 3.15
Variety of cafeteria food is good 3.18 3.12
Price of cafeteria food is reasonable 3.16 3.13
Quality of cafeteria food is good 3.13 3.14
Classroom facilities are in good condition 3.07 3.05
Toilets at Kulliyyah are in good condition 3.07 3.03
Number of discussion areas are adequate 3.06 3.09
Discussion areas are in good condition 3.12 3.11
There is adequate and functional safety equipment 2.96 2.89
Building defects are attended to immediately 2.83 2.82
I feel safe at the premises due to stringent security policies 3.09 3.06
Security force patrols constantly 3.08 3.00
Security cases such as thefts and disciplinary cases are handled effectively 3.06 2.83
Overall facilities are conducive to teaching and learning 3.33 3.22
Classrooms are clean and well maintained 3.22 3.20
Classrooms are comfortable 3.20 3.18
University landscape is pleasant and well kept 3.39 3.34
Complaint report response time is adequate 3.07 3.03
Maintenance works are satisfactory 3.11 3.06
2.2.5 Degree and University
Overall, 87.3 per cent of graduates believed that
the degrees obtained were worth their time and
money spent and 87 per cent would recommend
IUM to others. In both instances, the results were
less so among non-Malaysian graduates. For
example, 41.9 and 34.9 per cent of KOED and
KENMS graduates, respectively, would not
recommend IIUM as a place of study to their
family members or friends (see Figure 2.12,
Figure 2.13, Table 2.8, and Table 2.9 below).

MASTER’S DEGREE GRADUATES55
53
Figure 2.12 Worthwhileness of degree
Figure 2.13 Willingness to recommend IIUM to others
Table 2.8 Worthwhileness of degree by kulliyyah
Malaysian (%) Non-Malaysian (%)
Yes No Yes No
AIKOL 83.9 16.1 90 10.0
KAED 94.7 5.3 100 0
KENMS 95.6 4.4 81.4 18.6
KICT 94.7 5.3 82.4 17.6
KIRKHS 85.8 14.2 71.8 28.2
KOE 92.9 7.1 58.1 41.9
KOED 93.9 6.1 81 19.0
KAHS 100 0 100 0
KOM 95.8 4.2 100 0
KON 100 0 N/A N/A
KOP 100 0 100 0
KOS 93.3 6.7 100 0
KLM 100 0 100 0
IIiBF 100 0 83.3 16.7
INHART 100 0 N/A N/A
ISTAC 100 0 100 0
Total 91.8 8.2 77.1 22.9
8.2%22.9%
91.8%77.1%
0%
10%
20%
30%
40%
50%
60%
70%
80%
90%
100%
Malaysian Non-Malaysian
Yes
No
8.7%24.0%
91.3%76.0%
Malaysian Non-Malaysian0%
10%
20%
30%
40%
50%
60%
70%
80%
90%
100%
Yes
No

56IIUM TRACER STUDY 2017
54
Table 2.9 Willingness to recommend IIUM to others by kulliyyah
Malaysian (%) Non-Malaysian (%)
n Yes No n Yes No
AIKOL 31 80.6 19.4 10 100 0
KAED 19 89.5 10.5 3 100 0
KENMS 68 88.2 11.8 43 65.1 34.9
KICT 19 100 0 17 88.2 11.8
KIRKHS 113 93.8 6.2 39 76.9 23.1
KOE 42 88.1 11.9 31 58.1 41.9
KOED 33 97 3.0 21 95.2 4.8
KAHS 9 88.9 11.1 1 0 100
KOM 24 95.8 4.2 2 100 0
KON 2 100 0 0 - -
KOP 4 100 0 1 100 0
KOS 15 93.3 6.7 1 100 0
KLM 4 100 0 2 100 0
IIIBF 12 100 0 6 66.7 33.3
INHART 8 62.5 37.5 0 - -
ISTAC 1 100 0 2 100 0
TOTAL 404 91.3 8.7 179 76 24.0
2.2.6 Islamisation, integration, and internationalisation
Overall, the graduates agreed that courses
integrate Islamic values, the IIUM environment
promotes the better practice of Islam, and that the
University helps them become better Muslims.
The mean ratings were greater than 3.5 out of 5
across all kulliyyahs except KAHS and KOE with
ratings 3.2 and 3.4, respectively, for incorporation
of Islamic values in courses; and KOS with rating
3.4 for IIUM helping the graduates to be better
Muslims (see Figure 2.14 below).
Figure 2.14 Evaluation of aspects of Islamisation by kulliyyah
0
1
2
3
4
5
AIKO
L
KAED
KEN
MS
KICT
KIRK
HS
KOE
KOED
KAH
S
KOM
KON
KOP
KOS
KLM
IIiBF
INH
ART
ISTA
C
Tota
l
Courses incorporate Islamic values Conducive environment for better practice of Islam
Helps me to be a better Muslim

MASTER’S DEGREE GRADUATES57
55
2.2.7 Advantages and disadvantages of studying at IIUM
The most common responses for the advantages
of studying at IIUM were: (i) the Islamic
environment, (ii) the international environment,
(ii) self-improvement as a Muslim, and (iv)
integration of knowledge, which are consistent
with the vision and missions of IIUM (see Figure
2.15 below).
While the university has provided an Islamic
environment, as indicated by 31.7 per cent of the
graduates, less than ten per cent explicitly stated
integration of knowledge as an advantage for
studying at IIUM. In this respect, more effort
needs to be put in to achieve this mission.
Figure 2.15 Advantages of studying at IIUM
On the other hand, 34 per cent of the graduates
stated that there was no disadvantage in studying
at IIUM. However, 11.1 per cent, including a third
of ISTAC graduates and 17 per cent from AIKOL,
complained of poor service of the administrative
staff.
Graduates, including 40 per cent from KOP, also
mentioned poor facilities at the classrooms and
mahallahs as a disadvantage of studying at IIUM
(see Figure 2.16 below).
Figure 2.16 Disadvantages of studying at IIUM 9.4%
13.4%
19.0%
31.7%
0% 10% 20% 30% 40%
Integration ofknowledge
Self-improvement as aMuslim
Internationalenvironment
Islamic environment
6.5%
11.1%
34.0%
0% 10% 20% 30% 40%
Poorclassroom/mahallah
facilities
Poor service ofadministrative staff
None
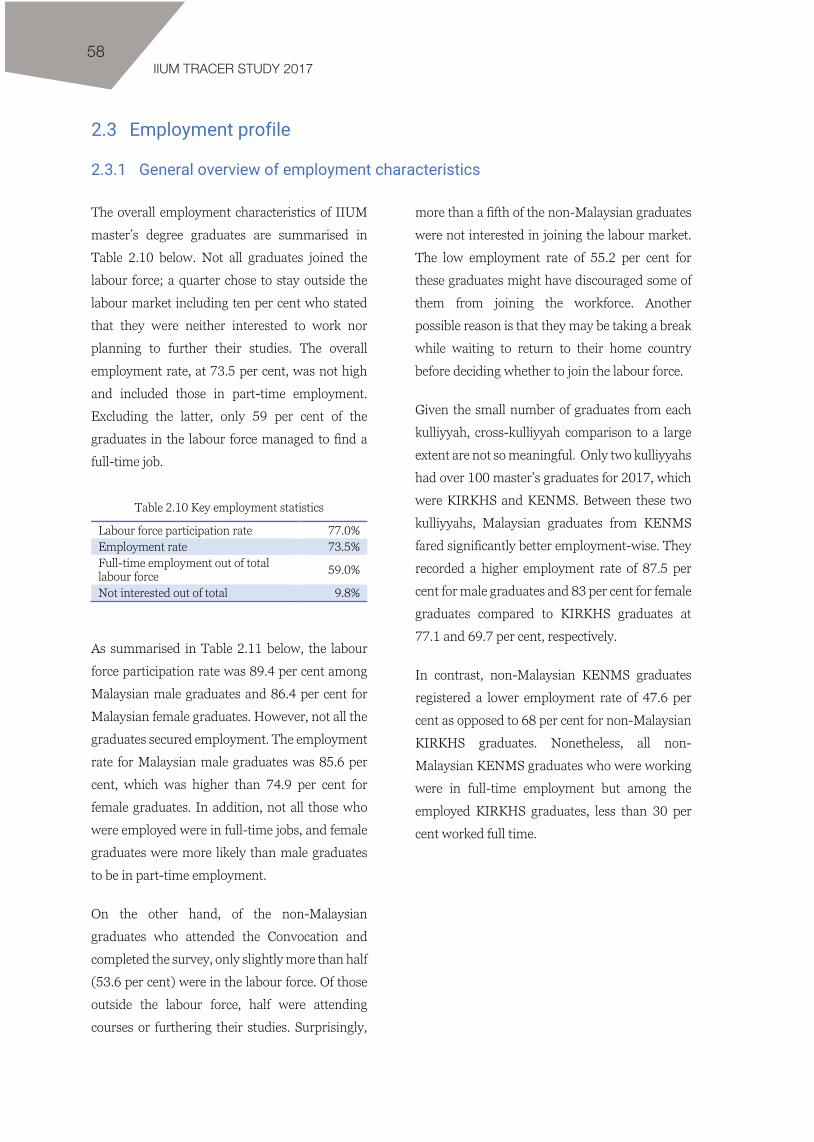
58IIUM TRACER STUDY 2017
56
2.3 Employment profile
2.3.1 General overview of employment characteristics
The overall employment characteristics of IIUM
master’s degree graduates are summarised in
Table 2.10 below. Not all graduates joined the
labour force; a quarter chose to stay outside the
labour market including ten per cent who stated
that they were neither interested to work nor
planning to further their studies. The overall
employment rate, at 73.5 per cent, was not high
and included those in part-time employment.
Excluding the latter, only 59 per cent of the
graduates in the labour force managed to find a
full-time job.
Table 2.10 Key employment statistics
Labour force participation rate 77.0% Employment rate 73.5% Full-time employment out of total labour force 59.0%
Not interested out of total 9.8%
As summarised in Table 2.11 below, the labour
force participation rate was 89.4 per cent among
Malaysian male graduates and 86.4 per cent for
Malaysian female graduates. However, not all the
graduates secured employment. The employment
rate for Malaysian male graduates was 85.6 per
cent, which was higher than 74.9 per cent for
female graduates. In addition, not all those who
were employed were in full-time jobs, and female
graduates were more likely than male graduates
to be in part-time employment.
On the other hand, of the non-Malaysian
graduates who attended the Convocation and
completed the survey, only slightly more than half
(53.6 per cent) were in the labour force. Of those
outside the labour force, half were attending
courses or furthering their studies. Surprisingly,
more than a fifth of the non-Malaysian graduates
were not interested in joining the labour market.
The low employment rate of 55.2 per cent for
these graduates might have discouraged some of
them from joining the workforce. Another
possible reason is that they may be taking a break
while waiting to return to their home country
before deciding whether to join the labour force.
Given the small number of graduates from each
kulliyyah, cross-kulliyyah comparison to a large
extent are not so meaningful. Only two kulliyyahs
had over 100 master’s graduates for 2017, which
were KIRKHS and KENMS. Between these two
kulliyyahs, Malaysian graduates from KENMS
fared significantly better employment-wise. They
recorded a higher employment rate of 87.5 per
cent for male graduates and 83 per cent for female
graduates compared to KIRKHS graduates at
77.1 and 69.7 per cent, respectively.
In contrast, non-Malaysian KENMS graduates
registered a lower employment rate of 47.6 per
cent as opposed to 68 per cent for non-Malaysian
KIRKHS graduates. Nonetheless, all non-
Malaysian KENMS graduates who were working
were in full-time employment but among the
employed KIRKHS graduates, less than 30 per
cent worked full time.

MASTER’S DEGREE GRADUATES59
Tab
le 2
.11
Em
ploy
men
t cha
ract
eris
tics
by k
ulliy
yah
and
gend
er
Mal
aysi
an m
ale
Ove
rall
AIK
OL
KA
ED
K
EN
MS
KIC
T
KIR
KH
S K
OE
K
OE
D
KA
HS
KO
M
KO
N
KO
P K
OS
KLM
II
iBF
INH
AR
T
IST
AC
Fu
ll-tim
e/la
bour
forc
e (%
) 76
.3
86.7
10
0 87
.5
100
57.1
85
.7
50.0
10
0 10
0
0 40
.0
100
66.7
50
.0
E
mpl
oym
ent r
ate
(%)
85.6
86
.7
100
87.5
10
0 77
.1
100
75.0
10
0 10
0
100
60.0
10
0 66
.7
50.0
Wai
ting
plac
emen
t/T
otal
une
mpl
oyed
(%)
5.9
0.0
- 0.
0 -
0.0
- 0.
0 -
-
- 0.
0 -
100
0.0
La
bour
forc
e pa
rtic
ipat
ion
rate
(%
) 89
.4
100
100
94.1
90
.9
100
50.0
10
0 10
0 93
.8
10
0 71
.4
100
60.0
10
0
(Stu
dy &
trai
ning
)/N
ot in
labo
ur fo
rce
(%)
85.7
-
- 10
0 10
0 -
71.4
-
- 10
0
- 10
0 -
100
-
Not
look
ing/
tota
l (%
) 1.
5 -
- 0.
0 0.
0 -
14.3
-
- 0.
0
- 0.
0 -
0.0
-
N
132
15
3 17
11
35
14
4
1 16
1 7
1 5
2
Mal
aysi
an fe
mal
e T
otal
A
IKO
L K
AE
D
KE
NM
S K
ICT
K
IRK
HS
KO
E
KO
ED
K
AH
S K
OM
K
ON
K
OP
KO
S K
LM
IIiB
F IN
HA
RT
IS
TA
C
Full-
time/
labo
ur fo
rce
(%)
62.6
71
.4
60.0
70
.2
62.5
51
.5
52.6
70
.4
40.0
10
0 10
0 66
.7
75.0
50
.0
71.4
50
.0
- E
mpl
oym
ent r
ate
(%)
74.9
78
.6
73.3
83
.0
62.5
69
.7
68.4
77
.8
60.0
10
0 10
0 10
0 75
.0
100
71.4
50
.0
- W
aitin
g pl
acem
ent/
Tot
al u
nem
ploy
ed (%
) 5.
1 0.
0 25
.0
0.0
33.3
5.
0 0.
0 0.
0 0.
0 -
- -
0.0
- 0.
0 0.
0 -
Labo
ur fo
rce
part
icip
atio
n ra
te (
%)
86.4
87
.5
93.8
92
.2
100
84.6
67
.9
93.1
62
.5
87.5
50
.0
100
100
66.7
10
0 10
0 0.
0 (S
tudy
& tr
aini
ng)/
Not
in la
bour
forc
e (%
) 51
.4
50.0
10
0 25
.0
- 33
.3
55.6
10
0 10
0 0.
0 10
0 -
- 10
0 -
- 0.
0 N
ot lo
okin
g/to
tal (
%)
6.3
6.3
0.0
5.9
- 9.
0 14
.3
0.0
0.0
12.5
0.
0 -
- 0.
0 -
- 10
0 N
27
2 16
16
51
8
78
28
29
8 8
2 3
8 3
7 6
1 N
on-M
alay
sian
T
otal
A
IKO
L K
AE
D
KE
NM
S K
ICT
K
IRK
HS
KO
E
KO
ED
K
AH
S K
OM
K
ON
K
OP
KO
S K
LM
IIiB
F IN
HA
RT
IS
TA
C
Full-
time/
labo
ur fo
rce
(%)
29.2
10
0 0.
0 47
.6
30.0
20
.0
31.3
16
.7
0.0
-
0.0
0.0
0.0
20.0
100
Em
ploy
men
t rat
e (%
) 55
.2
100
100
47.6
40
.0
68.0
56
.3
58.3
0.
0 -
0.
0 0.
0 0.
0 60
.0
10
0 W
aitin
g pl
acem
ent/
Tot
al u
nem
ploy
ed (%
) 14
.0
- -
18.2
33
.3
12.5
14
.3
0.0
0.0
-
0.0
0.0
0.0
0.0
Labo
ur fo
rce
part
icip
atio
n ra
te (
%)
53.6
10
.0
33.3
48
.8
58.8
64
.1
51.6
57
.1
100
0.0
10
0 10
0 50
.0
83.3
50.0
(S
tudy
& tr
aini
ng)/
Not
in la
bour
forc
e (%
) 50
.6
66.7
0.
0 27
.3
28.6
57
.1
73.3
66
.7
- 50
.0
-
- 10
0 10
0
0.0
Not
look
ing/
tota
l (%
) 21
.2
20.0
66
.7
34.9
29
.4
15.4
9.
7 14
.3
- 50
.0
-
- 0.
0 0.
0
50.0
N
17
9 10
3
43
17
39
31
21
1 2
1
1 2
6
2

60IIUM TRACER STUDY 2017
58
Most of the graduates who were working at the
time of the survey were employed fittingly in the
top occupational levels as managers or
professionals. However, for some of them,
particularly non-Malaysian graduates, it was only
on a part-time basis.
At the same time, there were graduates who were
underemployed, such as those who worked as
technicians or associate professionals, or those in
much lower levels of occupation such as clerical
support, or service and sales workers. In fact, two
Malaysian graduates stated that they were in
elementary occupations. The underemployment
rate was highest among both male and female
non-Malaysian graduates, at 21.4 and 25 per
cent, respectively (see Figure 2.17 below).
Figure 2.17 Graduates by type of occupation
A high percentage (43 per cent) of the graduates
were employed in the education sector. The other
top sectors were financial and insurance or
takaful; and professional, scientific, and technical
sectors (see Figure 2.18 below).
Figure 2.18 Employed graduates by economic sector
87.4%
46.7%
79.5%
50.0%
7.3%
31.9%
10.5%
25.0%
2.1%
10.0%14.3%
0.6%5.0%
7.1% 9.3% 10.0%3.2%
0%
10%
20%
30%
40%
50%
60%
70%
80%
90%
100%
Malaysian male Non-Malaysian male Malaysian female Non-Malaysianfemale
Lower levels part-time Lower levels full-time
Technician/associate professional part-time Technician/associate professional full-time
Managerial/professional part-time Managerial/professional full-time
Professional/scientific/technical
11%
Education43%
Financial/insurance/takaful12%
Others34%

MASTER’S DEGREE GRADUATES61
59
The income received from employment by those
in part-time employment differed from that of
those in full-time employment, even within the
same job category. For instance, the mean
monthly income for part-time managers was
RM2,650, compared to RM4,931 of full-time
managers. The same situation applies to all the
other job categories. For those in the professional
category, the mean monthly income from part-
time employment was RM1,536, which was
much lower than the RM4,688 mean total income
received by those employed full-time. However,
the differences are expected as those who worked
part-time contributed fewer hours to their jobs
and therefore earned lower incomes (see Figure
2.19 below).
Figure 2.19 Total monthly income by type of occupation
Graduates who were in full-time employment
were mostly employed on either permanent or
contract basis. Three quarters of Malaysian
graduates who worked full-time were employed
on a permanent basis while only a fifth were on a
contract basis (see Figure 2.20 below). The
percentage of non-Malaysian graduates
employed full-time on a permanent basis was
lower at 57.1 per cent while 39.3 per cent were
employed on contract (see Figure 2.21 below).
On the other hand, a significant number of both
Malaysian and non-Malaysian graduates in part-
time employment were on a temporary basis. Half
of the Malaysian graduates who worked part-time
were employed temporarily while a third were on
contract employment. Forty-four per cent of non-
Malaysian graduates who worked part-time were
employed on a temporary basis while a fifth were
on contract and another fifth were self-employed.
RM1,250.00
RM1,000.00
RM1,083.33
RM1,250.00
RM1,535.71
RM2,650.00
RM1,750.00
RM3,400.00
RM2,281.25
RM2,812.50
RM4,688.39
RM4,931.03
Elementary
Service/sales
Clerical support
Technician/associate professional
Professional
Managerial
Full-time Part-time

62IIUM TRACER STUDY 2017
60
Figure 2.20 Employed Malaysian graduates by type of
employment status
Figure 2.21 Employed non-Malaysian graduates by
type of employment status
Figure 2.22 Total monthly income by employment status
Employment status matters in determining the
amount of monthly income received from work.
Graduates in permanent full-time employment
earned a mean income of RM5,277.49, which was
the highest. There were no significant differences
in mean income among those employed full time
on contract, temporary basis, self-employed, or
working with family.21 However, among those in
21 Based on t-tests on difference of means.
part-time employment, the highest mean
incomes were earned by graduates who were
either in permanent positions (RM2,687.50) or
working with family (RM2,666.67). Those
employed part-time on contract, temporary basis,
or self-employed received much lower monthly
incomes, on average (see Figure 2.22 above).
73.8%
5.1%
20.7%
33.3%
48.7%
10.3%
0%
10%
20%
30%
40%
50%
60%
70%
80%
90%
100%
Full-time Part-time
Permanent Contract
Temporary Self-employed
Working with family
57.1%
8.0%
39.3%
20.0%
44.0%
20.0%
8.0%
0%
10%
20%
30%
40%
50%
60%
70%
80%
90%
100%
Full-time Part-time
Permanent Contract
Temporary Self-employed
Working with family
5277.49
2775
1850
2000
2666.67
2687.5
1666.67
1183.33
1111.11
1416.67
0 1000 2000 3000 4000 5000 6000
Permanent
Contract
Temporary
Self-employed
Working with family
Part-time Full-time

MASTER’S DEGREE GRADUATES63
61
2.3.2 Determinants of monthly income
Regression analyses were conducted to identify
the factors that have significant effects on the
monthly income of the recent master’s degree
graduates (see Table 2.12 below). The estimation
was done for all graduates in the sample and
separately for three kulliyyahs which had the
largest number of graduates: KIRKHS, KENMS,
and KOE.22
The findings show that, in general, there was a
significant difference in income between male and
female graduates. Male graduates earned more
than RM1,000 higher than female graduates,
controlling for other factors. While the gender
income disparity applied to KOE graduates, it was
not significant among KENMS and KIRKHS
graduates.
There was no significant difference in monthly
income between Malaysian and non-Malaysian
graduates. Surprisingly, co-curriculum
involvement was negatively related to income for
KENMS graduates; those who were more actively
involved in co-curricular activities while studying
obtained lower incomes when they worked.
As expected, the findings show that incomes were
higher for those who worked full-time compared
to part-time. Incomes from full-time employment
were estimated to be about RM2,400 higher than
incomes from part-time employment, given other
factors constant.
In general, work performance, as assessed by the
graduates themselves, contributed positively to
monthly income. However, it was not a
significant determinant for KIRKHS, KENMS, or
KOE graduates. The level of (self-assessed) soft
skills acquired by the graduates had no impact on
the level of income a graduate received from their
job. On the other hand, academic achievement
mattered for KENMS graduates; those who
earned higher incomes were those who obtained
higher CGPA during their studies.
Table 2.12 Determinants of monthly income from employment All KENMS KIRKHS KOE
(Constant) 325.52 (0.83)
-11962.08 (0.13)
-827.82 (0.72)
6077.86 (0.07)
Male 1136.88 (0.00)
844.38 (0.28)
503.52 (0.32)
1854.73 (0.01)
Malaysian 50.27 (0.90)
992.45 (0.27)
-927.60 (0.14)
568.30 (0.45)
Co-curriculum -415.84 (0.00)
-956.10 (0.00)
-181.55 (0.44)
-390.50 (0.20)
Working full-time 2411.85 (0.00)
1897.67 (0.11)
1981.06 (0.00)
1483.49 (0.10)
Work performance (1-5) 608.53 (0.09)
332.77 (0.68)
424.97 (0.48)
-362.46 (0.62)
Soft skills from university (1-5) -89.15 (0.77)
417.61 (0.60)
-97.72 (0.84)
-590.96 (0.40)
CGPA -53.48 (0.61)
3758.41 (0.03)
545.66 (0.15)
-181.93 (0.43)
N 244 40 73 25 R2 0.24 0.45 0.25 0.52
Note: (.) p-value
22 The sample sizes for graduates of other Kulliyyah are too small to obtain meaningful results.


PhD GRADUATES
3PART

66IIUM TRACER STUDY 2017
64
3.1 Profile of graduates
3.1.1 Demographic profile
There were 138 PhD graduates taking part in the
Graduate Tracer Study 2017 upon the 33rd IIUM
Convocation. More than half of the graduates
(54.3 per cent) were non-Malaysian. Overall,
there was about equal proportion of female and
male graduates at 48 and 52 per cent,
respectively. However, the number of female
Malaysian graduates were more than double that
of male Malaysian graduates with the situation
reversed among non-Malaysian graduates (see
Figure 3.1 below).
Figure 3.1 Graduates by gender
3.1.2 Distribution according to kulliyyah
Thirteen kulliyyahs offer PhD programmes at
IIUM. Of the 138 graduates, 17 each graduated
from AIKOL, KICT, KIRKHS, and KOED,
respectively.
There were more female than male Malaysian
graduates for all kulliyyahs except from KOS. No
Malaysian male graduated from KICT and KOM
while no Malaysian female graduated from KOS.
Among non-Malaysian graduates, there were
more male than female graduates for all
kulliyyahs. No non-Malaysian graduated from
KAHS, KOS, and KOM (see Figure 3.2 below).
Figure 3.2 Graduates by kulliyyah
31.2%
14.5%16.7%
37.7%
Malaysianfemale
Malaysian male
Non-Malaysianfemale
Non-Malaysianmale
138graduates
0
1
2
3
4
5
6
7
8
9
10
AIKOL KAED KENMS KICT KIRKHS KOE KOED KAHS KOM KOP KOS IIiBF ISTAC
Malaysian female Malaysian male Non-Malaysian female Non-Malaysian male
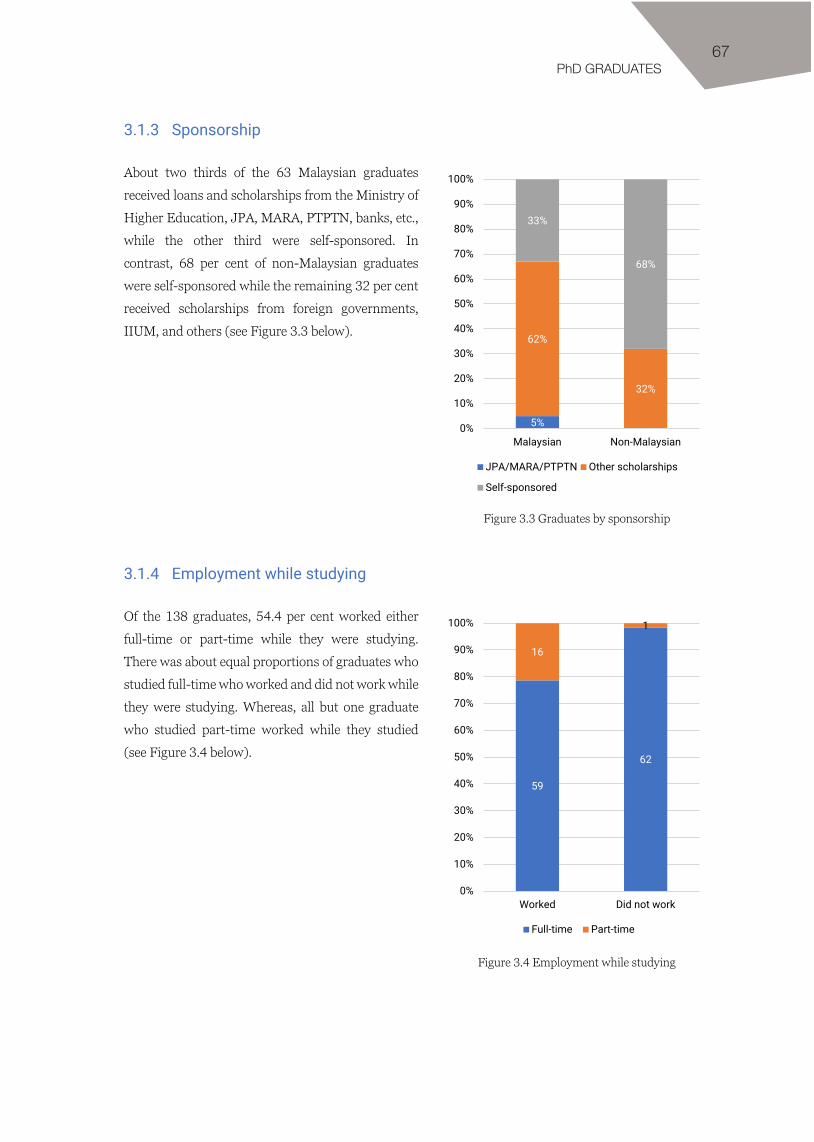
PhD GRADUATES67
65
3.1.3 Sponsorship
About two thirds of the 63 Malaysian graduates
received loans and scholarships from the Ministry of
Higher Education, JPA, MARA, PTPTN, banks, etc.,
while the other third were self-sponsored. In
contrast, 68 per cent of non-Malaysian graduates
were self-sponsored while the remaining 32 per cent
received scholarships from foreign governments,
IIUM, and others (see Figure 3.3 below).
Figure 3.3 Graduates by sponsorship
3.1.4 Employment while studying
Of the 138 graduates, 54.4 per cent worked either
full-time or part-time while they were studying.
There was about equal proportions of graduates who
studied full-time who worked and did not work while
they were studying. Whereas, all but one graduate
who studied part-time worked while they studied
(see Figure 3.4 below).
Figure 3.4 Employment while studying
5%
62%
32%
33%
68%
0%
10%
20%
30%
40%
50%
60%
70%
80%
90%
100%
Malaysian Non-Malaysian
JPA/MARA/PTPTN Other scholarships
Self-sponsored
59
62
16
1
0%
10%
20%
30%
40%
50%
60%
70%
80%
90%
100%
Worked Did not work
Full-time Part-time

68IIUM TRACER STUDY 2017
66
3.1.5 Mode and duration of study
Most of the 138 PhD graduates were full-time
students and only 12 per cent were part-time
students (see Figure 3.5 below).
Figure 3.5 Graduates by mode of study
There are only two methods of study for the PhD
degree: (i) research, and (ii) coursework and
research. More than half (65.2 per cent) of the
graduates pursued their study by research while
the rest by coursework and research (see Figure
3.6 below).
Figure 3.6 Graduates by programme mode of study
The normal duration for completing a PhD degree
is three years full-time and six years part-time.
However, IIUM graduates, whether those who
pursued their degree full-time or part-time,
regardless of the mode of study, generally were
not able to complete their studies within the
normal study period.
The situation was worse among those who
studied full-time compared to part-time. Less
than 3 per cent of the graduates who studied full-
time managed to obtain their degree within the
given three years. More than half of those who
opted for the research-only mode took more than
five years to complete their studies; while half of
those who studied by coursework and research
took longer periods of more than six and a half
years to finish.
A quarter of those who did their PhD part-time
managed to graduate within the given six years.
The median duration was eight years, meaning
half of them took more than eight years to
complete their PhD.
Surprisingly, two graduates—one full-time and
one part-time from KIRKHS and KOED,
respectively—managed to complete their PhD in
just two years. On the other end, a full-time KICT
graduate took 9.42 years while a part-time IIiBF
graduate took 10.33 years to graduate (see Table
3.1and Table 3.2 below).
88%
Full-time Part-time
138graduates
82
8
39
9
0%
10%
20%
30%
40%
50%
60%
70%
80%
90%
100%
Full-time Part-time
Research Coursework & research

PhD GRADUATES69
67
Table 3.1 Duration of study by mode of study
Research
Coursework & research Overall
Full-time GOT (%) 2.4 2.6 2.5
Median 5.00 6.58 5.42
Min 2.00 3.00 2.00
8.33 9.42 9.42 6.33
N 82 39 121
Part-time GOT (%) 25.0 22.2 23.5
Median 7.46 8.00 8.00
Min 2.00 5.42 2.00
Max 10.33 9.17 10.33
N 8 9 17
Table 3.2 Duration of study by mode of study and kulliyyah
AIK
OL
KA
ED
KE
NM
S
KIC
T
KIR
KH
S
KO
E
KO
ED
KA
HS
KO
M
KO
P
KO
S
IIiB
F
IST
AC
Research Full-time
GOT (%) 0.0 0.0 0.0 20.0 0.0 0.0 0.0 0.0 0.0 0.0 10.0 0.0 Median 5.25 5.25 5.00 4.58 4.75 5.42 5.42 4.33 4.63 4.71 4.96 5.54 Min 3.25 4.50 4.08 2.00 3.08 3.58 3.67 4.33 3.42 4.00 2.83 4.17 Max 8.33 5.25 8.25 8.00 6.25 8.25 6.00 4.33 5.08 5.42 7.83 6.92 N 16 3 13 5 11 5 6 1 8 2 10 2
Part-time GOT (%) 0.0 0.0 0.0 0.0 100 100 0.0 Median 6.83 7.83 10.25 9.00 2.00 3.83 8.71 Min 6.83 7.83 10.25 9.00 2.00 3.83 7.08 Max 6.83 7.83 10.25 9.00 2.00 3.83 10.33 N 1 1 1 1 1 1 2
Coursework & research Full-time
GOT (%) 9.10 0.0 0.0 0.0 0.0 0.0 Median 4.58 5.00 7.33 6.67 4.67 6.79 Min 3.00 4.92 3.25 5.58 4.67 6.08 Max 7.08 9.42 8.42 8.58 4.67 8.33 N 11 3 11 7 1 6
Part-time GOT (%) 0.0 0.0 50.0 0.0 Median 8.25 8.00 7.00 8.42 Min 7.67 8.00 5.42 8.42 Max 9.17 8.00 8.00 8.42 N 3 1 4 1

70IIUM TRACER STUDY 2017
68
3.2 Evaluation of academic programmes, facilities, and services
3.2.1 Relevance and helpfulness of study programme
Graduates were asked to evaluate the relevance
and helpfulness of their respective study
programmes to their current jobs by rating them
on a scale of 1 (extremely low or not helpful at all)
to 5 (extremely high or extremely helpful).
Malaysian graduates generally gave higher
ratings than non-Malaysian graduates. The mean
ratings given by Malaysian graduates were mostly
close to 5, indicating their high satisfaction with
the study programmes in terms of both the
relevance and helpfulness to their current jobs.
On the other hand, non-Malaysian AIKOL
graduates gave their programme a mean rating of
2.3 for relevance, indicating that they found the
programme not relevant to their current jobs (see
Figure 3.7 below).
Figure 3.7 Relevance and helpfulness of study programmes
3.2.2 Curriculum
The graduates were also asked to rate the contents
of the study programmes in terms of several
aspects, as in Table 3.3 below, from 1 (not
satisfied at all) to 5 (extremely satisfied). Overall,
PhD graduates across all kulliyyahs were satisfied
with the curriculum offered by IIUM as indicated
by the mean total ratings above 3.5.
The overall value was computed by taking the
mean value of all items. Total mean ratings of
each item in the curriculum assessment were also
above 3.5, indicating that the programmes
fulfilled their objectives in giving various benefits
to the graduates.
1
2
3
4
5
AIKOL KAED KENMS KICT KIRKHS KOE KOED KAHS KOM KOP KOS IIiBF ISTAC
Relevance Malaysian Relevance Non-Malaysian Helpfulness Malaysian Helpfulness Non-Malaysian

PhD GRADUATES71
69
Table 3.3 Evaluation of curriculum by kulliyyah
AIK
OL
KA
ED
KE
NM
S
KIC
T
KIR
KH
S
KO
E
KO
ED
KA
HS
KO
M
KO
P
KO
S
IIiB
F
IST
AC
Tot
al
Suitability of programme 4.5 4.8 4.7 4.5 4.5 4.7 4.5 4.7 5.0 4.1 4.0 4.5 4.8 4.5
Theoretical & practical balance 4.4 4.3 4.1 4.2 4.3 4.5 4.4 4.7 5.0 4.0 4.0 4.1 3.8 4.3
Compulsory co-curriculum 4.2 5.0 4.3 3.4 4.2 4.0 4.0 3.7 - 3.0 4.0 3.1 4.5 3.9
Compulsory subjects 4.3 4.7 4.6 4.0 4.3 4.5 4.6 4.0 3.0 3.1 4.0 3.4 4.6 4.2
Variety of co-curriculum 4.6 5.0 3.9 3.5 3.9 4.3 4.2 4.8 - 2.8 4.0 2.9 4.0 3.9
Prepare for working life 4.5 4.0 4.0 4.1 4.2 4.3 4.5 4.6 5.0 3.2 4.5 4.0 4.4 4.2
Malaysian 4.8 4.7 4.7 4.2 4.5 4.5 4.6 4.4 4.5 4.3 4.1 4.0 4.5 4.5
Non-Malaysian 3.7 3.3 3.7 3.7 4.1 4.3 4.2 - - 3.3 - 3.6 4.2 3.9
Total 4.4 4.4 4.2 3.8 4.3 4.3 4.3 4.4 4.5 3.5 4.1 3.8 4.3 4.2
The graduates offered several suggestions to
improve the quality of the programmes. The main
suggestions included improving the management
of the programmes in terms of teaching and
learning, scheduling of courses, assessment, and
class activities. Programmes and courses should
also be reviewed to meet the needs of the industry
and the job market. Courses which are irrelevant
should be removed, and new courses which cover
new knowledge should be offered. In addition,
more emphasis and opportunities for research
activities should be given to PhD graduates such
as financial support for attending conferences,
assistance in publication, and training to improve
analytical skills.
3.2.3 Acquired skills
PhD graduates were also asked to rate the skills
they acquired from the study programmes in
three categories: ICT skills, soft skills and life
skills.
ICT skills
Graduates were asked to list three ICT skills that
they have and rate them from 1 (poor) to 5
(excellent). Since the number of PhD graduates
across the thirteen kulliyyahs was small, cross-
kulliyyah comparisons were not practical.
However, most graduates knew Microsoft
PowerPoint (77.5 per cent), Word (76.8 per cent),
and Excel (68.1 per cent); and rated their ICT
skills as good, ranging from 4.1 to 4.3.
Soft skills
Aspects of soft skills, as in Table 3.4 below, were
rated from 1 (poor) to 5 (excellent). Graduates,
except those from KOS, gave positive evaluations
to all components of soft skills with most total
mean ratings greater than four out of five. The
total value was computed by taking the mean
value of all items. Malaysian graduates generally
rated themselves higher than non-Malaysian
graduates.

72IIUM TRACER STUDY 2017
70
Life skills
Graduates were specifically asked to what extent
the University influenced specific aspects of their
lives during their study periods. In general,
graduates felt that the IIUM education system
had a lot of influence on their lives as the total
mean ratings were above four (see Table 3.5
below). The total value was computed by taking
the mean value of all items. Again, Malaysian
graduates generally gave higher ratings than non-
Malaysian graduates.
Language proficiency
Graduates were asked to rate their proficiency in
both the English and Malay languages on a scale
of 1 (poor) to 5 (excellent). Overall, there was a
large gap between Malaysian and non-Malaysian
graduates’ Malay language proficiency. Malaysian
and non-Malaysian graduates rated their Malay
at 4.0–5.0 and below 3.0, respectively.
However, the gap was hardly observed in their
proficiency in the English language, except
among KAED graduates. Generally, the graduates
felt that their English was better than their Malay
(see Figure 3.8 below).23
Table 3.4 Soft skills by kulliyyah
AIK
OL
KA
ED
KE
NM
S
KIC
T
KIR
KH
S
KO
E
KO
ED
KA
HS
KO
M
KO
P
KO
S
IIiB
F
IST
AC
Interpersonal communication 4.2 4.3 4.4 4.2 4.2 4.6 4.0 4.4 5.0 3.9 4.0 4.5 4.3 4.3
Creative & critical thinking 4.2 4.3 4.2 4.4 4.2 4.3 4.5 4.4 5.0 4.1 4.0 4.4 4.6 4.3
Problem-solving 4.4 4.5 4.3 4.5 4.2 4.3 4.6 4.3 5.0 4.3 4 4.5 4.6 4.4 Analytical 4.4 4.5 4.3 4.4 4.3 4.5 4.5 4.3 5.0 4.1 3.5 4.2 4.6 4.4 Teamwork 4.4 4.8 4.1 4.5 4.1 4.6 4.6 4.4 5.0 4.0 3.5 4.4 4.6 4.4 Inculcating & practising positive values
4.4 4.8 4.4 4.4 4.4 4.5 4.4 4.4 5.0 4.1 4.0 4.3 4.7 4.4
General knowledge & current issues 4.5 4.5 4.1 4.4 4.2 4.5 4.7 4.4 5.0 4.3 3.5 4.4 4.7 4.4
Malaysian 4.6 4.7 4.6 4.4 4.2 4.6 5.0 4.4 5.0 4.8 3.8 4.5 4.9 4.6 Non-Malaysian 3.8 4.0 3.9 4.5 4.2 4.3 4.3 - - 3.9 - 4.4 4.4 4.2 Total 4.3 4.5 4.2 4.4 4.2 4.4 4.6 4.4 5.0 4.1 3.8 4.4 4.6 4.4
23 Paired sample test found a one per cent significance difference.

PhD GRADUATES73
71
Table 3.5 Life skills by kulliyyah
AIK
OL
KA
ED
KE
NM
S
KIC
T
KIR
KH
S
KO
E
KO
ED
KA
HS
KO
M
KO
P
KO
S
IIiB
F
IST
AC
Tot
al
Develop self-confidence 4.5 4.8 4.6 4.5 4.5 4.6 4.7 4.3 5.0 4.0 4.5 4.5 4.8 4.5 Enhance self-maturity 4.6 4.8 4.6 4.6 4.6 4.7 4.5 4.4 5.0 4.4 4.0 4.6 4.4 4.6 Develop self-resilience 4.6 5.0 4.6 4.5 4.6 4.6 4.6 4.4 5.0 4.3 4.0 4.6 4.4 4.6 Become more knowledgeable
4.6 4.8 4.4 4.8 4.6 4.4 4.8 4.6 5.0 4.4 4.0 4.6 4.8 4.6
Enhance interest in learning
4.6 4.8 4.4 4.7 4.6 4.5 4.8 4.4 5.0 4.5 4.5 4.5 4.2 4.6
More sensitive towards current affairs
4.4 4.3 4.1 4.4 4.5 4.5 4.3 4.4 5.0 4.4 4.0 4.5 4.4 4.4
Ability to be independent 4.6 4.8 4.6 4.5 4.5 4.6 4.4 4.6 5.0 4.4 4.0 4.5 4.8 4.5 Creative & critical thinking 4.5 5.0 4.4 4.7 4.6 4.7 4.5 4.4 5.0 4.3 4.0 4.6 4.7 4.6 Ready to face the working life & its challenges
4.6 4.8 4.5 4.6 4.5 4.3 4.6 4.6 4.5 4.5 4.5 4.5 4.8 4.6
Problem-solving & decision-making
4.6 4.8 4.5 4.6 4.5 4.4 4.6 4.4 4.5 4.5 4.5 4.4 4.7 4.5
Teamwork 4.6 4.5 4.0 4.4 4.4 4.7 4.6 4.6 5.0 4.3 4.0 4.4 4.7 4.4 Effective communication 4.6 5.0 4.4 4.7 4.5 4.8 4.7 4.6 5.0 4.0 4.0 4.5 4.8 4.6 Malaysian 4.8 4.9 4.9 4.8 4.6 4.7 5.0 4.5 5.0 4.7 4.2 4.7 5.0 4.8 Non-Malaysian 4.1 4.2 4.0 4.5 4.5 4.5 4.4 - - 4.2 - 4.4 4.4 4.4 Total 4.6 4.8 4.4 4.6 4.5 4.6 4.6 4.5 5.0 4.3 4.2 4.5 4.6 4.5
Note: 1(has no influence at all), 5 (has a lot of influence)
Figure 3.8 Language proficiency by kulliyyah
1
2
3
4
5
AIKOL KAED KENMS KICT KIRKHS KOE KOED KAHS KOM KOP KOS IIiBF ISTAC
English Malaysian English Non-Malaysian Malay Malaysian Malay Non-Malaysian

74IIUM TRACER STUDY 2017
72
3.2.4 Facilities and services
Graduates were asked to rate their satisfaction of
the various services provided by the University
including career and guidance, library, and other
facilities on a scale of 1 (not satisfied at all) to 5
(extremely satisfied). Graduates were also asked
to rate their level of agreement to a list of
statements on aspects of mahallah, auxiliary,
venue, food outlet, kulliyyah, and security and
safety services; and management of facilities on a
scale of 1 (strongly disagree) to 4 (strongly agree).
The graduates evaluated all the listed services and
facilities positively with most ratings greater than
4. However, a lower but still satisfactory mean
rating of 3.53 was recorded for parking facilities
(see Figure 3.9 and Figure 3.10 below).
Similar, the graduates generally agreed that the
facilities and services provided by the University
were good, adequate, and satisfactory. However,
lower ratings indicated lower levels of satisfaction
for the condition of toilets at the mahallahs and
promptness of building repairs (see Table 3.6
below).
Figure 3.9 Evaluation of library facilities
and services
Figure 3.10 Evaluation of other facilities and services
12345
Onlineservices
Onlineresources
Staff
OperatingtimeResources
Study area
Overall
1
2
3
4
5Sport facilities
Lecture halls &classrooms
Laboratories/studios/workshops
ICT facilities &services
Study area
Campusbookshop
Onlineintegrated…Campus security
Parking
Health centre
Transportation
Accommodation
Cafeteria

PhD GRADUATES75
73
Table 3.6 Evaluation of facilities and services, IIUM Tracer Study
Mahallah room facilities are in good condition 3.13
Mahallah toilets are always in good condition 2.91
Mahallah compound and landscape are clean and well maintained 3.26
Number of auxiliary services provided is adequate 3.17
Condition of auxiliary services is good 3.20
Number of venue facilities is adequate 3.37
Condition of venue facilities is good 3.36
Number of food outlets is adequate 3.19
Variety of cafeteria food is good 3.17
Price of cafeteria food is reasonable 3.19
Quality of cafeteria food is good 3.13
Classroom facilities are in good condition 3.22
Toilets at Kulliyyah are in good condition 3.19
Number of discussion areas are adequate 3.17
Discussion areas are in good condition 3.28
There is adequate and functional safety equipment 3.06
Building defects are attended to immediately 2.95
I feel safe at the premises due to stringent security policies 3.24
Security force patrols constantly 3.18
Security cases such as thefts and disciplinary cases are handled effectively 3.07
Overall facilities are conducive to teaching and learning 3.50
Classrooms are clean and well maintained 3.45
Classrooms are comfortable 3.31
University landscape is pleasant and well kept 3.54
Complaint report response time is adequate 3.21
Maintenance works are satisfactory 3.26
Suggestions
KULLIYYAH
Twelve per cent of the graduates suggested
improving the overall management and
administration of the kulliyyahs, particularly with
regard to the maintenance of classrooms and
laboratories, addressing student needs and
complaints, and improving the overall efficiency
of the running of the kulliyyahs. Additionally,
13.8 per cent of the graduates suggested that
kulliyyahs provide rooms or lounges for students
to hold discussions.
MAHALLAH
A main suggestion was to improve internet
services through wider Wi-Fi coverage, higher
connection speed, and better network availability.
It is also proposed that the room registration
process improved by making it smoother and
more efficient. The graduates suggested that the
mahallah management conduct regular
inspections including spot checks and be more
responsive to complaints and reports. Mahallah
management should also be proactive in
maintaining the facilities and attend to repairs
promptly.
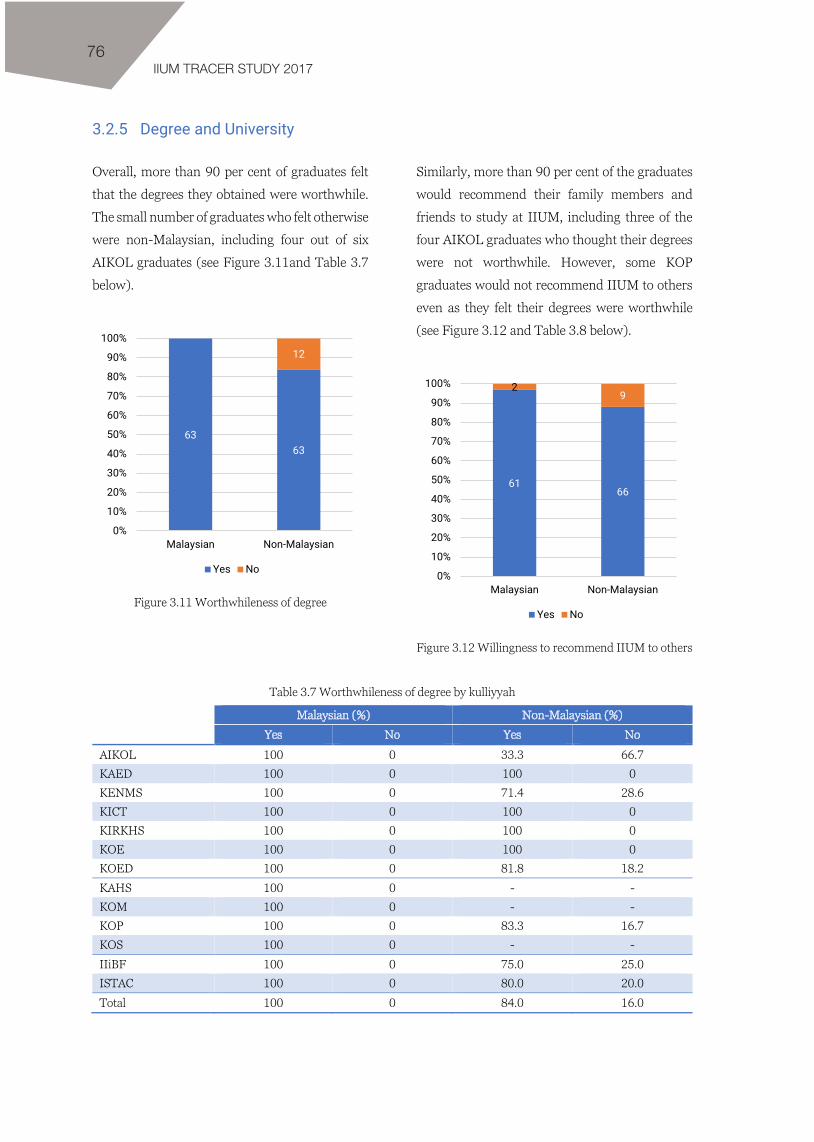
76IIUM TRACER STUDY 2017
74
3.2.5 Degree and University
Overall, more than 90 per cent of graduates felt
that the degrees they obtained were worthwhile.
The small number of graduates who felt otherwise
were non-Malaysian, including four out of six
AIKOL graduates (see Figure 3.11and Table 3.7
below).
Figure 3.11 Worthwhileness of degree
Similarly, more than 90 per cent of the graduates
would recommend their family members and
friends to study at IIUM, including three of the
four AIKOL graduates who thought their degrees
were not worthwhile. However, some KOP
graduates would not recommend IIUM to others
even as they felt their degrees were worthwhile
(see Figure 3.12 and Table 3.8 below).
Figure 3.12 Willingness to recommend IIUM to others
Table 3.7 Worthwhileness of degree by kulliyyah
Malaysian (%) Non-Malaysian (%)
Yes No Yes No
AIKOL 100 0 33.3 66.7
KAED 100 0 100 0
KENMS 100 0 71.4 28.6
KICT 100 0 100 0
KIRKHS 100 0 100 0
KOE 100 0 100 0
KOED 100 0 81.8 18.2
KAHS 100 0 - -
KOM 100 0 - -
KOP 100 0 83.3 16.7
KOS 100 0 - -
IIiBF 100 0 75.0 25.0
ISTAC 100 0 80.0 20.0
Total 100 0 84.0 16.0
6363
12
0%
10%
20%
30%
40%
50%
60%
70%
80%
90%
100%
Malaysian Non-Malaysian
Yes No
6166
29
0%
10%
20%
30%
40%
50%
60%
70%
80%
90%
100%
Malaysian Non-Malaysian
Yes No

PhD GRADUATES77
75
Table 3.8 Willingness to recommend IIUM to others by kulliyyah
Malaysian (%) Non-Malaysian (%)
Yes No Yes No
AIKOL 90.9 9.1 83.3 16.7
KAED 100 0 100 0
KENMS 100 0 85.7 14.3
KICT 100 0 100 0
KIRKHS 100 0 100 0
KOE 75.0 25.0 100 0
KOED 100 0 81.8 18.2
KAHS 100 0 - -
KOM 100 0 - -
KOP 100 0 33.3 66.7
KOS 100 0 - -
IIiBF 100 0 87.5 12.5
ISTAC 100 0 100 0
Total 96.8 3.2 88.0 12.0
3.2.6 Advantages and disadvantages of studying at IIUM
The main advantages of studying at IIUM, as
given by 29 and 22 per cent of PhD graduates
respectively, were the Islamic and international
environment of the university. Additionally, 17
per cent of the graduates cited the integration of
knowledge. Another benefit, according to 9 per
cent of graduates, was personal improvement as a
Muslim (see Figure 3.13 below).
Figure 3.13 Advantages of studying at IIUM
Most graduates stated that there was no
disadvantage in studying at IIUM. Nevertheless,
others cited poor computer and internet facilities,
lack of parking spaces, and poor service of
administrative staff (see Figure 3.14 below).
Figure 3.14 Disadvantages of studying at IIUM
29.0%
21.7%
9.4%
17.4%
0% 10% 20% 30% 40%
Islamic environment
Internationalenvironment
Self-improvement as aMuslim
Integration ofknowledge
5.1%
5.1%
5.1%
38.0%
0% 10% 20% 30% 40%
Computer & internetfacilities
Parking
Poor service ofadministrative staff
None

78IIUM TRACER STUDY 2017
76
3.3 Employment profile
The overall labour force participation rate for
IIUM PhD graduates was 89.9 per cent and the
employment rate was 81.5 per cent. Hence, a fifth
of PhD graduates were unemployed at the time of
the survey. Several were waiting for job
placements, but the majority of the unemployed
were still looking for a job. This was particularly
the case for non-Malaysian graduates, whose
employment rate was considerably lower than
that of their Malaysian counterparts.
The situation was expected. Most Malaysians
pursuing PhD programmes typically were already
employed and attached to an educational
institution. On the other hand, many non-
Malaysians undergoing PhD programmes were
not attached to any institution and were not in the
labour market. They typically will only enter the
labour market upon completion of their studies,
and many will take time to secure employment as
they preferred to work in their countries of origin.
Accordingly, more Malaysian graduates were in
the labour force, at 95.2 per cent compared to a
lower figure of 89.9 per cent for non-Malaysian
graduates. However, of the non-Malaysians who
were not in the labour force, 45.5 per cent were
either furthering their studies (postdoctoral) or
attending training programmes. Non-Malaysian
graduates from ISTAC and KOED had the lowest
labour force participation rates at 60 and 63.6 per
cent, respectively.
Malaysian graduates from all kulliyyahs except
AIKOL, KICT, and KAED recorded full
employment. While the one ICT graduate who
was unemployed was waiting for a work
placement at the time of the survey, the
unemployed AIKOL and KAED graduates were
still searching for jobs. There were two Malaysian
graduates, one from KICT and another from
ISTAC who were not interested to work.
Among non-Malaysian graduates, only two out of
six (33.3 per cent) KOP graduates were employed
at the time of the survey; the rest were searching
for a job. Six of the 12 KICT graduates who were
in the labour force were unemployed. However,
two were waiting for job placements, while the
other four were still searching for jobs. There were
also several non-Malaysian graduates, most of
them female, who stated that they were not
interested to work, particularly from AIKOL,
KOE, KOED, and ISTAC (see Table 3.9 below).
Most of the employed Malaysian graduates were
employed on a permanent basis. Half worked
with the government and another 30 per cent
worked with statutory bodies. Most of the non-
Malaysian graduates were employed as either
permanent or contract staff and worked in the
government sector (56 per cent) or with local
private companies (18.6 per cent) (see Figure
3.15 and Figure 3.16 below).
A large proportion of the graduates, as expected,
worked in the education sector. All those who
were employed worked, appropriately, as
professionals or managers. Hence, there was no
instance of underemployment among the
graduates (see Figure 3.17 below).

PhD GRADUATES79
Tab
le 3
.9 E
mpl
oym
ent c
hara
cter
istic
s by
kul
liyya
h an
d na
tiona
lity
Mal
aysi
an
Tot
al
AIK
OL
KA
ED
K
EN
MS
KIC
T
KIR
KH
S K
OE
K
OE
D
KA
HS
KO
M
KO
P K
OS
IST
AC
II
iBF
Full-
time/
labo
ur fo
rce
(%)
93.3
90
.9
66.7
10
0 66
.7
100
100
100
100
100
100
100
100
80.0
E
mpl
oym
ent r
ate
(%)
95.0
90
.9
66.7
10
0 66
.7
100
100
100
100
100
100
100
100
100
Wai
ting
plac
emen
t/to
tal u
nem
ploy
ed (%
) 33
.3
0.0
0.0
10
0
Labo
ur fo
rce
part
icip
atio
n ra
te (
%)
95.2
10
0 10
0 85
.7
75.0
10
0 10
0 10
0 10
0 10
0 10
0 10
0 75
.0
100
(Stu
dy &
trai
ning
)/no
t in
labo
ur fo
rce
(%)
10
0
Not
look
ing/
tota
l (%
) 3.
2
0.
0 25
.0
25
.0
N
63
11
3
7 4
7 4
6 7
1 2
2 4
5
Non
-Mal
aysi
an
Tot
al
AIK
OL
KA
ED
K
EN
MS
KIC
T
KIR
KH
S K
OE
K
OE
D
KA
HS
KO
M
KO
P K
OS
IST
AC
II
iBF
Full-
time/
labo
ur fo
rce
(%)
57.8
40
.0
100
66.7
41
.7
88.9
57
.1
42.9
33
.3
33
.3
87.5
E
mpl
oym
ent r
ate
(%)
68.8
60
.0
100
66.7
50
.0
88.9
71
.4
71.4
33
.3
66
.7
100
Wai
ting
plac
emen
t/to
tal u
nem
ploy
ed (%
) 20
.0
0.0
50
.0
33.3
0.
0 50
.0
0.0
0.0
0.
0
Labo
ur fo
rce
part
icip
atio
n ra
te (
%)
85.3
83
.3
100
85.7
92
.3
90.0
87
.5
63.6
10
0.0
60
.0
100
(Stu
dy &
trai
ning
)/no
t in
labo
ur fo
rce
(%)
45.5
0.
0
0.0
100
0.0
0.0
75.0
50
.0
Not
look
ing/
tota
l (%
) 6.
7 16
.7
0.0
0.0*
0.
0 10
.0
12.5
9.
1
20
.0
N
75
6
1 7
13
10
8 11
6
5
8
Tot
al
Tot
al
AIK
OL
KA
ED
K
EN
MS
KIC
T
KIR
KH
S K
OE
K
OE
D
KA
HS
K
OP
KO
S IS
TA
C
IIiB
F Fu
ll-tim
e/la
bour
forc
e (%
) 75
.0
75.0
75
.0
83.3
46
.7
93.8
72
.7
69.2
50
.0
66
.7
84.6
E
mpl
oym
ent r
ate
(%)
81.5
81
.3
75.0
83
.3
53.3
93
.8
81.8
84
.6
50.0
83.3
10
0 W
aitin
g pl
acem
ent/
tota
l une
mpl
oyed
(%)
21.7
0.
0 0.
0 50
.0
42.9
0.
0 50
.0
0.0
0.0
0.
0
Labo
ur fo
rce
part
icip
atio
n ra
te (
%)
89.9
94
.1
100
85.7
88
.2
94.1
91
.7
76.5
10
0
66.7
10
0 (S
tudy
& tr
aini
ng)/
not i
n la
bour
forc
e (%
) 42
.9
0.0
50
.0
50.0
0.
0 0.
0 75
.0
33.3
Not
look
ing/
tota
l (%
) 3.
6 5.
9
0.0
0.0
5.9
8.3
5.9
11.1
N
138
17
4 14
17
17
12
17
7
1 8
2 9
13
*One
gra
duat
e cl
aim
ed to
be
not w
orki
ng o
r un
empl
oyed
bec
ause
fore
igne
rs a
re n
ot a
llow
ed to
wor
k in
Mal
aysi
a.

80IIUM TRACER STUDY 2017
78
Figure 3.15 Employed graduates by type of employment status
Figure 3.16 Employed graduates by employment sector
Figure 3.17 Employed graduates by economic sector
53
20
2
21
1
2 1
1
0% 10% 20% 30% 40% 50% 60% 70% 80% 90% 100%
Malaysian
Non-Malaysian
Permanent Contract Temporary Self-employed Working with family
33
24
17
2 5
4
8
1
2 1
1
1
0% 10% 20% 30% 40% 50% 60% 70% 80% 90% 100%
Malaysian
Non-Malaysian
Government Statutory body Private (multinational) Private (local) GLC NGO Others
1
2
4
4
48
31
4
7
0% 10% 20% 30% 40% 50% 60% 70% 80% 90% 100%
Malaysian
Non-Malaysian
Financial/insurance/takaful Professional/scientific/technical Education Others

SUMMARY, SUGGESTIONS, AND RECOMMENDATIONS
4PART

82IIUM TRACER STUDY 2017
80
4.1 Summary
4.1.1 Bachelor’s degree graduates
Academic performance
1. Academic performance of the graduates in
terms of CGPA was relatively high with
means greater than 3 for all kulliyyahs
except AIKOL and KOE. Five and 15 per
cent, respectively, of Malaysian and non-
Malaysian graduates, received first class
honours.
2. Analysis on academic performance shows
that (i) female graduates outperformed
male graduates, (ii) English proficiency at
entry contributed positively to academic
performance, (iii) working while studying
had an adverse effect on academic
performance, and (iv) active co-curricular
involvement did not significantly affect
academic performance.
Co-curricular activities
3. Involvement of the graduates in co-
curricular activities was satisfactory with
over 70 per cent stating that they were
actively involved in societies, clubs, and
sports programmes.
Internship
4. Almost 80 per cent of the graduates
underwent internships that mostly lasted
1–3 months.
Programme evaluation
5. Overall, the graduates felt that their study
programmes were relevant and helpful to
their current jobs. KON and KOD
graduates gave the highest mean ratings.
6. The graduates were generally satisfied with
the curriculum particularly with regard to
its suitability, balance between theory and
practice, and preparation for working life.
7. More than 90 per cent of the graduates
indicated that the degrees they obtained
were worthwhile and would recommend
their family members and friends to study
at IIUM.
Skills
8. The three most common ICT skills most
graduates possessed were Microsoft Word,
PowerPoint and Excel. Other top ICT skills
include AutoCAD, Adobe Photoshop, PHP,
Java/J2EE, and SPSS.
9. In general, the graduates rated their
English language proficiency as high.
Malaysian graduates also rated their Malay
language proficiency as high while non-
Malaysian graduates, expectedly, rated it to
be good, but not as high.
10. More than 75 per cent of the graduates
would like to attend additional training
programmes to enhance their English
proficiency and ICT skills for career
enhancement.
Islamisation
11. IIUM was successful in its Islamisation
mission with respect to the incorporation
of Islamic values in courses and creating an
environment that promotes the better
practice of Islam. However, the University

SUMMARY, SUGGESTIONS, AND RECOMMENDATIONS83
81
needs to strive further in the aspect of the
integration of knowledge.
Facilities and services
12. The graduates were generally satisfied with
the facilities and services provided by the
University. The only exceptions were
issues related to (i) the safety of buildings
and handling of theft and disciplinary
cases, as highlighted by AIKOL graduates;
and (ii) the quality of food services at the
Kuantan campus.
13. Suggestions by the graduates to improve
facilities and services at the kulliyyahs were
generally related to (i) classroom fixtures,
and (ii) buildings and lecture venues.
Disadvantages of studying at IIUM
14. Three main disadvantages of studying at
IIUM were:
i. Weaknesses in some programmes,
particularly in engineering and ICT.
ii. The long duration of study at KOD
and KOS.
iii. Poor facilities in the classrooms and
mahallahs.
Employment
15. More than 70 per cent of the graduates
were in the labour force but only 37.4 per
cent were employed full-time and 30.4 per
cent were unemployed. Three quarters of
those who were not in the labour force
were either furthering or planning to
further their studies or were attending
training courses.
24 Although KOM, KOP, and KOD graduates had lower employment rates, most of these graduates were
16. KON graduates had the highest
employment rate, while Kulliyyah of KOS
graduates had the lowest.24
17. A fifth of employed graduates was in part-
time rather than full-time employment and
disproportionately more female graduates
were part-time workers. Most of those who
worked full-time were in a permanent
position or employed on a contract basis,
while those who worked part-time were
mostly on a temporary basis.
18. Almost 14 per cent of graduates from KLM
were not interested or looking for a job.
19. Among the graduates who were working,
32 per cent were underemployed as they
were employed in clerical support, service
and sales, and other lower levels jobs for
which they were overqualified—and more
so for female graduates.
20. On average, graduates who were
unemployed started searching for a job
later (1 month after completion of studies)
than those who were employed (2 to 2½
weeks after completion of studies).
21. Male graduates took shorter times to gain
full-time employment than female
graduates. AIKOL, KENMS, and KOS
graduates with higher CGPA were more
likely to gain full-time employment earlier
than others. However, the reverse was true
for KOP graduates. Involvement in co-
curricular activities and duration of
internship were significant factors in the
duration until gaining full-time
waiting for job placements while KOS graduates were mostly still searching for jobs.

84IIUM TRACER STUDY 2017
82
employment for some, but not all
graduates. Self-assessed levels of soft-skills
were not a significant determinant in the
length of time taken to obtain a full-time
job.
22. Among the employed graduates, the mean
income for females was significantly lower
than that for males. Expectedly, work
performance contributed positively to
income. Controlling for other factors, on
average, a graduate with full-time
employment received RM1,200 more than
one with part-time employment.

SUMMARY, SUGGESTIONS, AND RECOMMENDATIONS85
83
4.1.2 Master’s degree graduates
Academic performance
1. Over 80 per cent of the graduates studied
full-time.
2. 42 per cent of the graduates pursued their
programmes by coursework and research.
Only about 19 per cent pursued their
master’s degrees by research, while 14 per
cent completed the executive master’s
programmes.
3. Most of the graduates were self-sponsored
and were working while studying for their
master’s degree.
Duration of study
4. Less than 60 per cent of the graduates who
underwent the master’s programmes by
coursework on a full-time basis managed
to graduate on time within two years.
5. It was worse for those who underwent
their master’s programmes by research, or
coursework and research, where only 7.5
and 12 per cent, respectively, were able to
graduate on time.
6. A similar situation, although slightly
better, applied to those who studied part-
time. The median duration for completing
the full-time and part-time master’s
programmes were 2.75 and 3.42 years,
respectively.
Programme evaluation
7. In general, most of the graduates felt that
their study programmes were relevant and
helpful to their current jobs, with the
exception of KOS graduates, who rated
their programme as just average.
8. The graduates were generally satisfied with
the curriculum particularly with regard to
suitability, balance between theory and
practice, and preparation for working life.
9. The majority (87.3 per cent) of the
graduates stated that the degrees they
obtained were worthwhile and would
recommend IIUM as a place of study to
their family members and friends.
However, a significant number of non-
Malaysian graduates from KOED (41.9 per
cent) and KENMS (34.9 per cent) would
not recommend IIUM as a place of study.
Language proficiency
10. In general, the graduates rated their
English language proficiency as high.
11. The graduates also rated their Malay
language proficiency as good, but not as
high as their proficiency in the English
language.
Islamisation
12. While IIUM has created an Islamic
environment, less than 10 per cent of the
graduates explicitly stated the integration
of knowledge as a main advantage to
studying at IIUM.
Facilities and services
13. The graduates were generally satisfied with
the facilities and services provided by the
University.
14. The only exceptions, especially among
non-Malaysian graduates, were in the
condition of the toilets at the mahallahs,
timely repair of building defects and

86IIUM TRACER STUDY 2017
84
having adequate safety equipment, and the
handling of theft and disciplinary cases.
15. Suggestions to improve kulliyyah facilities
and services include: (i) fixing classroom
fixtures such as air-conditioners, lightings,
and furniture; (ii) having administrative
staff becoming more responsive towards
student needs and requests; and (iii)
providing discussion rooms or lounges.
Employment
16. The labour force participation rate was 77
per cent and only 59 per cent of those in the
labour force were employed full-time. Ten
per cent of the graduates indicated that
they were not interested to work nor plan
to further their study.
17. Underemployment was highest among
non-Malaysian graduates for both male
and female, at 21.4 and 25 per cent,
respectively.
18. The top three sectors in which the
graduates were employed were education
(43 per cent), financial and insurance or
takaful (12 per cent) and professional,
scientific, and technical (11 per cent).
19. Analyses indicate that the mean income of
employed male graduates is estimated to
be over RM1,000 higher than that of
female graduates, controlling for the other
factors. Additionally, the income from full-
time employment was about RM2,400
higher than that from part-time
employment. Academic performance
contributed positively to income for
KENMS graduates.

SUMMARY, SUGGESTIONS, AND RECOMMENDATIONS87
85
4.1.3 PhD degree graduates
Profile
1. Slightly more than half of the PhD
graduates were non-Malaysian. Among
Malaysian graduates, more than two thirds
were female, while among non-Malaysian
graduates more than two thirds were male.
Mode and duration of study
2. Over 80 per cent of the graduates studied
full-time. Sixty-five per cent pursued their
PhD by research and 35 per cent by
coursework and research.
3. Regardless of the mode of study, less than
3 per cent of those who studied full-time
graduated on time. Half of them took more
than 5.42 years to complete their studies.
4. Among the graduates who did their PhD
part-time basis, the graduate-on-time rate
was 23.5 per cent and half of them took at
least 8 years to obtain a PhD degree.
Programme evaluation
5. Overall, the graduates felt that their study
programmes were relevant and helpful to
their current jobs.
Disadvantages of studying at IIUM
6. The three main disadvantages of studying
at IIUM were:
i. Lack of good computer laboratories
and internet facilities;
ii. Lack of parking spaces; and
iii. Poor service of administrative staff.
Facilities and services
7. The graduates were generally satisfied with
the facilities and services provided by the
University.
8. Among the suggestions to improve the
facilities and services at the kulliyyahs were
to improve the overall management and
administration in the maintenance of
classrooms and laboratories and
addressing student complaints, as well as
to provide discussion rooms or lounges for
students.
Language proficiency
9. The graduates rated their English language
proficiency as high, with the exception of
non-Malaysian KAED graduates who
indicated that their level of proficiency was
just average.
10. Malaysian graduates rated their Malay
language proficiency as high, whereas non-
Malaysian graduates, rated it as not good,
expectedly.
Employment
11. The overall labour force participation rate
was 89.8 per cent with an employment rate
of 81.5 per cent.
12. The employment rate for non-Malaysian
graduates was considerably lower (68.8
per cent) than Malaysian graduates (95 per
cent).
13. Several non-Malaysian graduates, mostly
female, were not interested to work.
14. Most of the graduates worked in the public
education sector and were employed on a
permanent basis. None of the working
PhD graduates was underemployed.

88IIUM TRACER STUDY 2017
86
4.2 Suggestions and recommendations
Facilities and services
1. Maintain the good facilities and services provided by the Library.
2. Improve the University’s facilities and services particularly with regard to:
i. Having adequate and functional safety equipment, timeliness of building repair, and
effectiveness in the handling of theft and disciplinary cases particularly at AIKOL.
ii. Lecture rooms fixtures such as air-conditioners, lightings, and furniture particularly at AIKOL,
KIRKHS, and KENMS
iii. Toilets particularly at postgraduate student accommodation.
iv. Food services at Kuantan campus.
v. Administrative staff responses to undergraduate student needs and complaints particularly at
KOM, KOP, and KLM.
vi. Services provided by the administrative staff to postgraduate students particularly at ISTAC
and AIKOL.
vii. Overall kulliyyah management and administration in relation to maintenance of classrooms
and laboratories, addressing student needs and complaints, and the overall running of the
kulliyyah especially catering to postgraduate students.
viii. The absence of lounges or discussion rooms for postgraduate students.
ix. Internet access and services including Wi-Fi coverage, particularly at the mahallahs.
x. Management of parking areas and registration at the mahallahs.
xi. Laundry facilities including washing and clothes-drying areas and launderettes at the
mahallahs.
xii. Overall maintenance and management of mahallah facilities and services.
Islamisation
3. Maintain and improve the Islamic and international environment of IIUM.
4. Increase efforts in realizing the university’s mission of integration of knowledge especially in:
i. Undergraduate programmes offered by non-science kulliyyahs.
ii. All masters’ programmes offered by IIUM.
IIUM as a place of study
5. Investigate the reasons a significant number of non-Malaysian graduates would not recommend
IIUM to others as a place to study, especially among:
i. Bachelor’s degree graduates from KOE.
ii. Master’s degree graduates from KENMS and KOED.

SUMMARY, SUGGESTIONS, AND RECOMMENDATIONS89
87
Undergraduate programmes
6. Consider offering training courses to all final year students to improve and enhance their English
language proficiency and ICT skills to complement those offered within their respective academic
programmes.
7. Undertake efforts to improve the English language proficiency of first-year students to improve their
academic performance.
8. Monitor and assist students who need to work while studying to ensure that their studies will not be
affected.
9. Encourage participation in co-curricular activities as these pursuits do not have a detrimental effect
on academic performance.
10. Examine the duration of study of programmes offered by KOS and KOD to determine if they are too
long.
11. Undertake efforts to improve the full-time employment rate of all graduates, particularly from KOS.
12. Put more emphasis on incorporating practical knowledge and the latest developments and
technologies in the respective fields of study in undergraduate programmes. Additionally, the
programmes should include more hands-on applications and building of prototypes, real case studies
and projects, collaborations with industry, field trips and visits, etc.
13. Impress on students the importance of academic performance and not delaying their job search in
securing a full-time job faster.
Postgraduate programmes
14. Investigate the factors, such as quality of student intake, academic programmes, process and
monitoring of supervision, selection and appointment of examiners, duration of thesis examination,
etc., to explain the low proportion of students graduating on time.
15. Review the relevance and helpfulness, particularly of KOS master’s degree and AIKOL PhD degree
(for non-Malaysians) programmes in preparing graduates for the labour market.
16. Impress on students, particularly KENMS master’s degree graduates, the importance of academic
performance as a significant determinant of income from employment after graduation.

90IIUM TRACER STUDY 2017
APPE
NDI
CES
Appe
ndix
1: N
umbe
r of p
artic
ipan
ts a
nd to
tal n
umbe
r of 2
017
IIUM
gra
duat
es
Num
ber
of p
artic
ipan
ts, G
radu
ate
Tra
cer
Stud
y 20
17
N
atio
nalit
y A
IKO
L K
IRK
HS
KE
NM
S K
ICT
K
OE
K
AE
D
KO
ED
K
OM
K
OP
KO
N
KO
D
KO
S K
AH
S K
LM
IST
AC
II
iBF
InH
AR
T
Tot
al
Bac
helo
r M
alay
sian
36
8 83
8 54
5 11
2 56
4 26
8 12
9 14
6 11
0 41
45
23
4 22
3 86
-
- -
3709
Non
-Mal
aysi
an
12
102
63
23
30
15
4 1
1 0
0 3
0 1
- -
- 25
5
Mas
ter
Mal
aysi
an
31
113
68
19
42
19
33
24
4 2
- 15
9
4 1
12
8 40
4
Non
-Mal
aysi
an
10
39
43
17
31
3 21
2
1 0
0 1
1 2
2 6
0 17
9
PhD
M
alay
sian
11
7
7 4
4 3
6 1
2 -
- 2
7 -
4 5
- 63
Non
-Mal
aysi
an
6 10
7
13
8 1
11
0 6
- -
0 0
- 5
8 -
75
Num
ber
of 2
017
IIU
M g
radu
ates
N
atio
nalit
y A
IKO
L K
IRK
HS
KE
NM
S K
ICT
K
OE
K
AE
D
KO
ED
K
OM
K
OP
KO
N
KO
D
KO
S K
AH
S K
LM
IST
AC
II
iBF
InH
AR
T
Tot
al
Bac
helo
r M
alay
sian
37
2 85
4 55
5 11
7 57
2 27
0 13
4 14
7 11
0 41
45
23
8 22
5 88
-
- -
3768
Non
-Mal
aysi
an
14
123
100
35
62
22
5 3
2 0
1 5
0 1
- -
- 37
3
Mas
ter
Mal
aysi
an
33
118
73
21
44
20
33
26
4 2
- 16
9
4 1
13
8 42
5
Non
-Mal
aysi
an
23
74
76
25
67
6 31
5
4 0
- 1
3 3
7 15
2
342
PhD
M
alay
sian
13
8
8 4
4 3
6 1
2 -
- 2
7 -
5 6
- 69
Non
-Mal
aysi
an
18
40
23
24
19
1 28
1
7 -
- 3
- -
10
15
- 18
9

SUMMARY, SUGGESTIONS, AND RECOMMENDATIONS91
Appe
ndix
2: E
mpl
oym
ent c
hara
cter
istic
s by
und
ergr
adua
te p
rogr
amm
e
Em
ploy
men
t cha
ract
eris
tics
by u
nder
grad
uate
pro
gram
me
A
IKO
L K
EN
MS
KIC
T
LLB
LL
B_
S O
vera
ll B
AC
C
BB
A
BE
CS
ISFI
N
Ove
rall
BC
S B
IT
Ove
rall
Full-
time/
labo
ur fo
rce
(%)
74.4
77
.1
75.2
82
.8
42.4
56
.8
42.3
56
.9
81.8
71
.0
73.0
Em
ploy
men
t rat
e (%
) 91
.1
91.4
91
.2
85.2
62
.0
66.3
52
.8
66.9
81
.8
77.0
77
.9
Wai
t pla
cem
ent/
Tot
al u
nem
ploy
ed (%
) 0.
0 0.
0 0.
0 22
.2
8.6
15.6
20
.7
16.8
0.
0 30
.4
25.9
Labo
ur fo
rce
part
icip
atio
n ra
te (
%)
30.2
49
.3
33.9
75
.3
77.3
80
.5
82.0
78
.7
84.6
91
.7
90.4
(Stu
dy &
trai
ning
)/N
ot in
labo
ur fo
rce
(%)
95.7
91
.7
95.1
77
.5
55.6
47
.8
59.3
62
.4
75.0
66
.7
69.2
Not
look
ing/
tota
l (%
) 3.
0 4.
2 3.
3 5.
6 10
.1
10.2
6.
0 7.
7 3.
8 2.
8 3.
0
N
298
71
369
162
119
118
150
549
26
109
135
K
IRK
HS
BA
RB
B
EN
L C
OM
M
HIS
T
PSC
I PS
YC
RK
FQ
RK
QS
RK
UD
SO
CA
O
vera
ll
Full-
time/
labo
ur fo
rce
(%)
28.8
53
.8
42.6
40
.4
55.7
48
.7
31.1
41
.0
46.3
39
.2
45.0
Em
ploy
men
t rat
e (%
) 47
.9
66.3
55
.7
55.8
66
.4
66.4
66
.7
62.3
64
.8
52.9
61
.5
Wai
t pla
cem
ent/
Tot
al u
nem
ploy
ed (%
) 18
.4
5.7
11.1
4.
3 12
.2
7.9
20.0
8.
7 5.
3 4.
2 9.
9
Labo
ur fo
rce
part
icip
atio
n ra
te (
%)
75.3
73
.2
81.3
77
.6
80.8
85
.0
67.2
81
.3
83.1
86
.4
79.1
(Stu
dy &
trai
ning
)/N
ot in
labo
ur fo
rce
(%)
70.8
81
.6
28.6
60
.0
72.4
70
.0
68.2
50
.0
81.8
50
.0
67.2
Not
look
ing/
tota
l (%
) 7.
2 4.
9 13
.3
9.0
5.3
4.5
10.4
9.
3 3.
1 6.
8 6.
9
N
97
142
75
67
151
133
67
75
65
59
931
K
AE
D
KO
ED
AA
D
ALA
A
QS
AR
CH
U
RP
Ove
rall
GU
IDE
IS
ED
T
AA
SL
TE
ASL
O
vera
ll
Full-
time/
labo
ur fo
rce
(%)
51.2
61
.5
44.6
41
.4
47.6
48
.3
20.0
30
.0
36.4
25
.9
27.4
Em
ploy
men
t rat
e (%
) 79
.1
66.7
51
.8
60.3
64
.3
63.4
33
.3
45.0
45
.5
63.0
49
.3
Wai
t pla
cem
ent/
Tot
al u
nem
ploy
ed (%
) 22
.2
23.1
14
.8
26.1
66
.7
28.7
60
.0
54.5
66
.7
60.0
59
.5
Labo
ur fo
rce
part
icip
atio
n ra
te (
%)
87.8
83
.0
82.4
82
.9
87.5
84
.4
93.8
87
.0
91.7
93
.1
91.3
(Stu
dy &
trai
ning
)/N
ot in
labo
ur fo
rce
(%)
16.7
62
.5
25.0
33
.3
66.7
38
.6
0.0
33.3
0.
0 10
0.0
42.9
Not
look
ing/
tota
l (%
) 10
.2
6.4
13.2
11
.4
4.2
9.6
6.3
8.7
8.3
0.0
5.0
N
49
47
68
70
48
282
16
23
12
29
80

92IIUM TRACER STUDY 2017
K
AH
S K
LM
AU
D
BIO
MD
D
IET
O
PT
PHYT
R
DI
Ove
rall
AR
CO
M
EN
CO
M
TPH
M
Ove
rall
Full-
time/
labo
ur fo
rce
(%)
93.8
22
.6
47.8
88
.5
58.3
54
.5
52.4
35
.7
51.4
40
.0
45.9
Em
ploy
men
t rat
e (%
) 93
.8
43.4
60
.9
92.3
62
.5
59.1
63
.1
57.1
56
.8
50.0
55
.7
Wai
t pla
cem
ent/
Tot
al u
nem
ploy
ed (%
) 0.
0 16
.7
5.6
50.0
33
.3
33.3
18
.8
0.0
12.5
20
.0
11.1
Labo
ur fo
rce
part
icip
atio
n ra
te (
%)
80.0
75
.7
93.9
89
.7
82.8
88
.0
84.2
73
.7
64.9
90
.9
70.1
(Stu
dy &
trai
ning
)/N
ot in
labo
ur fo
rce
(%)
25.0
76
.5
33.3
0.
0 20
.0
66.7
51
.4
80.0
50
.0
0.0
53.8
Not
look
ing/
tota
l (%
) 15
.0
5.7
4.1
10.3
10
.3
4.0
7.2
5.3
17.5
9.
1 13
.8
N
20
70
49
29
29
25
222
19
57
11
87
K
OE
AE
RO
A
UT
OM
B
IO
CIE
C
OM
EG
M
AT
ER
M
CT
M
FG
Ove
rall
Full-
time/
labo
ur fo
rce
(%)
56.5
46
.7
41.7
48
.1
71.4
57
.4
56.4
62
.1
55.7
Em
ploy
men
t rat
e (%
) 58
.7
52.0
47
.2
51.9
76
.2
70.2
66
.0
65.2
61
.8
Wai
t pla
cem
ent/
Tot
al u
nem
ploy
ed (%
) 21
.1
16.7
15
.8
8.0
13.3
7.
1 15
.6
13.0
14
.2
Labo
ur fo
rce
part
icip
atio
n ra
te (
%)
78.0
81
.5
80.0
80
.0
79.7
79
.7
78.3
88
.0
80.6
(Stu
dy &
trai
ning
)/N
ot in
labo
ur fo
rce
(%)
69.2
76
.5
88.9
53
.8
81.3
75
.0
76.9
77
.8
74.8
Not
look
ing/
tota
l (%
) 6.
8 4.
3 2.
2 9.
2 3.
8 3.
4 5.
0 2.
7 4.
7
N
59
92
45
65
79
59
120
75
594
K
OS
KO
M
KO
P K
ON
K
OD
BSB
T
BSM
S C
HE
M
PHYS
O
vera
ll M
BB
S PM
AC
Y N
UR
S D
EN
T
Full-
time/
labo
ur fo
rce
(%)
21.6
54
.4
26.9
30
.0
37.0
11
.6
28.0
90
.2
4.7
Em
ploy
men
t rat
e (%
) 27
.5
67.6
38
.5
55.0
49
.1
18.1
42
.0
95.1
11
.6
Wai
t pla
cem
ent/
Tot
al u
nem
ploy
ed (%
) 10
.8
18.2
12
.5
0.0
11.9
95
.6
87.9
50
.0
100.
0
Labo
ur fo
rce
part
icip
atio
n ra
te (
%)
69.9
73
.1
68.4
60
.6
69.6
93
.9
90.1
10
0.0
95.6
(Stu
dy &
trai
ning
)/N
ot in
labo
ur fo
rce
(%)
72.7
80
.0
83.3
76
.9
77.8
11
.1
72.7
-
0.0
Not
look
ing/
tota
l (%
) 8.
2 5.
4 5.
3 6.
1 6.
3 5.
4 2.
7 0.
0 4.
4
N
73
93
38
33
237
147
111
41
45

D I V I S I O NALUMNI RELATIONS
INTERNATIONAL ISLAMIC UNIVERSITY MALAYSIA
9 789671 396971
ISBN 978-967-13969-7-1