alyssa galea - 3b34sbzotwundnsc2cenabf3-wpengine.netdna ...€¦ · alyssa galea political science...
TRANSCRIPT

Are Minority Voting Rights In Danger? The Aftermath of Shelby County v. Holder
Alyssa Galea
Political Science Senior Thesis
Advisor: Dr. Voorhees
Hartwick College
Fall 2013

1
While it might not be the branch of the American government that is in the news most
often or that people know the most about, people may find that the Supreme Court is something
they really ought to pay more attention to. This past summer, the Court made a major decision
regarding how state and local governments can change their voting laws. In Shelby County v.
Holder (2013), the Court overturned Section 4 of the Voting Rights Act of 1965, which
prescribed the formula for determining the jurisdictions subject to preclearance. Preclearance is
where changes to the voting laws in certain areas must be pre-approved by the Attorney General
or District Court of Washington D.C. Previously, areas were subject to preclearance if less than
50% of their population was eligible to vote or actually voted in the last presidential election
since the law was updated or if they employed a test or device to prevent certain groups from
voting. While the preclearance provision itself was kept intact, the fact that there is no current
formula to determine which jurisdictions it applies to means that it does not currently apply
anywhere. The areas previously subject to preclearance were mainly southern states and counties
where racially discriminatory laws were used to keep African Americans from the polls. The
Court decided that the formula was antiquated and no longer an appropriate way to serve the
current needs of the nation. Thus, while preclearance still stands, it is currently powerless
because of the Shelby County decision. It is up to Congress to design a new formula for
determining which jurisdictions are subject to preclearance.
When I heard about the case, I also heard that there were many African Americans and
minority advocacy groups that were quite unhappy with the Court’s decision. I decided to use my
thesis to explore whether there is really anything to be worried about. Are the concerns about
discrimination that led to the Voting Rights Act of 1965 merely a part of American history, or
are they still a problem in contemporary society? Part of the reason that Section 4 was found

2
unconstitutional is because the laws that resulted in jurisdictions being placed on the
preclearance list originally, such as poll taxes and literacy tests, have not been used in decades.
However, I expect that there are laws today that have discriminatory impacts on minority voters,
particularly voter ID laws. Therefore, one of the things I look at is what scholars have to say
about the impacts that such laws have on minority voters. One of the intentions of this thesis is to
discover whether current trends indicate that laws found to be detrimental to minority voters are
likely to be implemented in areas that were previously unable to do so. This leads to an
additional goal of learning whether the passage of discriminatory laws is occurring in areas that
were covered by preclearance until the Court’s decision, in areas that were once covered by
preclearance but were off the list by 2013, or the areas that never were subject to preclearance. In
answering these questions, I will be able to take a look at the characteristics that the states
passing discriminatory laws have in common to see whether a pattern emerges.
This question is clearly an important topic in political science. Aside from the relevance
of the recent Supreme Court decision, voting in general is a crucial part of American politics.
Being a democracy is arguably the most important part of America’s identity, both in how it
functions at home and how it maintains its power and reputation in world affairs. If not all
citizens are given the equal right to vote, this would impact the very core of the American
identity. Likewise, this is a question that should concern every American citizen. The right to
vote is one that many people take for granted. However, the fact that voting gives people the
ability to choose who will make the laws that they must follow, set their taxes, and otherwise
significantly impact the way they live means that it is a law that should not be taken lightly.
Minorities should be particularly concerned. If it turns out that laws exist which discriminate

3
against them, this will mean a loss of voice and power when it comes to having their interests
represented by the government.
In order to understand the implications of the Court’s decision, some background on the
Voting Rights Act of 1965 will be necessary to gain a sense of why the law was passed and what
it entails so that we can put the decision in a functional context. Like most Supreme Court
decisions, there has been preclearance-related precedent leading up to Shelby County v. Holder.
Therefore, it makes sense to take a look at the previous cases first to be better able to put the
decision in its historical context as well. The next logical step is to examine the scholarly
literature about discriminatory voting laws in today’s society. Once we understand the laws that
we are dealing with, it will be possible to look at whether the states previously under
preclearance are now implementing them. I have three hypotheses to explore: that states now
free from preclearance will pass discriminatory voting laws, that these laws will occur in states
with certain state party control and population demographic trends, and that the states with
discriminatory laws include some of, but are not limited to, the states that were recently subject
to preclearance. In order to look for patterns on a national level, I collect information from
several states with different preclearance experiences. These characteristics include things like
which political party controls the state government and which presidential candidates the states
have supported, what the percentage breakdowns for racial demographics in the states are and
what percentage of the states’ voters are minorities, and, naturally, what kind of potentially
discriminatory voting laws they have. Analyzing these results enables me to evaluate the validity
of my hypotheses and gain a sense of what the implications of the Shelby County v. Holder
decision are: whether we really do have something to be worried about.

4
Literature Review
I. The Voting Rights Act of 1965
In order for one to look at the possible implications of the Shelby County v. Holder
decision, it is crucial to understand some of the basic background and contents of the Voting
Rights Act of 1965. Prior to the Civil War, the United States Constitution was largely mum on
the issue of who was eligible to vote and how that right would be legally protected. Left to their
own devices, most states made it so the only people who were eligible to vote were land-owning
white males. After the war’s conclusion, the Fourteenth and Fifteenth Amendments were added
to the Constitution. These laws defined citizenship and prohibited the denial or abridgement of
voting rights based on race, skin color, or prior servitude, respectively. The idea was to extend
the right to vote to African American men as well, and this effort was initially somewhat of a
success, until the former confederate states began to observe the effects of this newly franchised
minority. When scores of former slaves became eligible to vote and not only registered, but
voted and ran for political office as well, the South soon felt threatened and began to take action
to ensure that African American political power would not become a dominant force. Thus, the
Jim Crow era was born. Formerly confederate states devised a number of tactics to keep African
Americans from the polls. In blatant disregard of the Fourteenth and Fifteenth Amendments, a
number of devices, in addition to undisguised violence and intimidation, were used to limit
suffrage to white males only. Poll taxes, which the majority of African Americans could not
afford, and literacy tests, which the majority of African Americans could not pass, were the most
popular devices of disenfranchisement. Additionally, grandfather clauses that made it difficult
for descendants of slaves to register, and extreme racial gerrymandering were all employed in an
effort to maintain the status quo of the white political monopoly. In frustration at seeing the

5
South work for decades to undo the progress that the post-Civil War efforts had tried to achieve,
Congress sought to end the issue with the Voting Rights Act of 1965 (DOJ Website). For the
sake of convenience, the Voting Rights act of 1965 will henceforth be referred to as the VRA.
The aim of the VRA was essentially to enforce the Fifteenth Amendment (DOJ). Indeed,
it was in effect restated in Section 2: “No voting qualification or prerequisite to voting, or
standard, practice, or procedure shall be imposed or applied by any State or political subdivision
to deny or abridge the right of any citizen of the United States to vote on account of race or
color” (VRA 1965). The sections at issue in Shelby County v. Holder are those that pertain to
determining whether a jurisdiction has denied or abridged that right and what steps the federal
government will take to ensure that this violation does not continue. These issues correspond to
sections 4 and 5 of the VRA, respectively. It makes logical sense to discuss the latter first.
Section 5 of the VRA reads, in part,
Whenever a State or political subdivision with respect to which the prohibitions
set forth in section 4(a) are in effect shall enact or seek to administer any voting
qualification or prerequisite to voting, or standard, practice, or procedure with
respect to voting different from that in force or effect on November 1, 1964, such
State or subdivision may institute an action in the United States District Court for
the District of Columbia for a declaratory judgment that such qualification,
prerequisite, standard, practice, or procedure does not have the purpose and will
not have the effect of denying or abridging the right to vote on account of race or
color, and unless and until the court enters such judgment no person shall be
denied the right to vote for failure to comply with such qualification, prerequisite,
standard, practice, or procedure…(VRA 1965).

6
In layman’s terms, Section 5 says that jurisdictions that are found by the determining formula to
be in violation of the law will be required to get federal approval to change their voting laws, and
said changes will only be approved if they are found not to have any discriminatory impact on
voter eligibility. This process is referred to as preclearance (DOJ).
Section 4 is rather verbose, but it is very important because it contains the formula for
determining which jurisdictions are subject to preclearance. Essentially, the VRA outlines a two-
pronged test to define which jurisdictions are engaged in discriminatory voting requirements.
The first prong questions whether the jurisdiction employs “any test or device” (VRA 1965) that
has a discriminatory impact on determining who is eligible to vote. The second prong simply
asks whether at least half of the jurisdiction’s population was registered to vote or actually voted
in the 1964 election. Any jurisdiction that employed a discriminatory test or device or had a less
than 50% voter eligibility or turnout rate was ruled to be subject to preclearance (VRA 1965).
This provision was originally intended to be in effect for a period of five years in the hope that
after this period supervision would no longer be necessary, but it has been extended each time
the law has been updated: 1970, 1975, 1982, and 2006. The final extension was to last for 25
years, so it would still be in effect today if not for the Shelby County v. Holder ruling. It is also
worth noting that the preclearance test was added to in 1975. To address the concerns of
discrimination against certain immigrant groups, it was decided that jurisdictions with certain
proportions of minorities with a native language besides English would be required to make
election materials and assistance available in that native language or else be added to the
preclearance list (DOJ). Additional relevant concerns to the matter at hand are the fact that the
federal government was given 60 days to approve preclearance requests and that jurisdictions
that felt they had reformed their discriminatory practices were able to apply to bailout from the

7
preclearance requirements. In order to bail out, a state must be able to show that it has complied
with a set of standards for voting rights for the previous ten years as well as that they have taken
action to increase minority voting and decrease the discrepancy between white and minority
participation in elections (Faircloth 2012). Likewise, jurisdictions found to later employ
discriminatory practices could be bailed in to preclearance coverage (VRA 1965).
II. The Supreme Court’s Decision and Precedent
Naturally, the decision reached in Shelby County v. Holder is of central importance. It
was a very close decision, with the justices split 5 to 4. While scholars and members of the
public on both sides are concerned about the implications for the future of voting laws, the key is
to understand what the Court did and did not do in its decision. The Court only overturned
Section 4, which prescribed the formula for determining which states were subject to
preclearance. The rest of the VRA was left intact. For instance, Section 2, which applies to the
entire nation, still forbids any state or jurisdiction from enacting any law that denies a person the
right to vote based on their race or the color of their skin. Section 5, where preclearance is
established, was also upheld. This is because the justices in the majority did not deny that voting
discrimination still exists. However, they did feel that the formula, which was still the same 50%
turnout requirement and check for tests or devices limiting voting abilities that was established in
1965, was outdated and no longer a fair way to serve the needs of the nation. When the law was
originally passed, the preclearance provision was only supposed to last for five years. However,
the problem with discrimination persisted and Congress saw it necessary to continually prolong
its coverage. The Court did not take issue with this, but rather the fact that Congress neglected to
update the formula. As the Court explained:

8
Nearly 50 years later, things have changed dramatically. Largely because of the
Voting Rights Act, “[v]oter turnout and registration rates” in covered jurisdictions
“now approach parity. Blatantly discriminatory evasions of federal decrees are
rare. And minority candidates hold office at unprecedented levels.” Northwest
Austin, supra, at 202. The tests and devices that blocked ballot access have been
forbidden nationwide for over 40 years. Yet the Act has not eased §5’s restrictions
or narrowed the scope of §4’s coverage formula along the way. Instead those
extraordinary and unprecedented features have been reauthorized as if nothing has
changed, and they have grown even stronger. (Shelby County v. Holder 2013, 3)
The majority decided that it could simply no longer justify this encroachment on state
sovereignty. Chief Justice Roberts references the Tenth Amendment in his decision, stating that
“Outside the strictures of the Supremacy Clause, States retain broad autonomy in structuring
their governments and pursuing legislative objectives… more specifically, ‘the Framers of the
Constitution intended the States to keep for themselves, as provided in the Tenth Amendment,
the power to regulate elections’” (Shelby County v. Holder 2013, 9-10). Furthermore, there exists
a “‘fundamental principle of equal sovereignty’ among the States” (Shelby County v. Holder
2013, 10) that is violated by the fact that only a fraction of them are required to have their
election laws pre-approved. Referencing the necessity of having all states treated equally and
fairly in order for the nation to function in harmony, Chief Justice Roberts explained that he
could no longer justify subjecting a handful of states to the old preclearance formula, especially
in light of the increasing minority voting rates and the election of minorities to political
positions. The Chief Justice reported that,
9
“By 2009, “the racial gap in voter registration and turnout [was] lower in the
States originally covered by §5 than it [was] nationwide”… Since that time,
Census Bureau data indicate that African American voter turnout has come to
exceed white voter turnout in five of the six States originally covered by §5...
(Shelby County v. Holder 2013, 2)
In summary, the Court felt that adequate progress had been made in the states subject to
preclearance- not enough to remove the safeguards completely, but certainly enough to update
the coverage formula.
While many were surprised at the Shelby County v. Holder decision, this is hardly the
first time that the Supreme Court has seen a case regarding preclearance issues. Meghann
Donahue, Victor Rodriguez, and Mark Rush are three scholars who have written about the
Court’s preclearance jurisprudence. There have been several notable cases concerning this
matter, the first of which was South Carolina v. Katzenbach in 1966. Unhappy with their
subjection to federal oversight of their voting laws, the state of South Carolina brought forth a
suit alleging that the VRA exceeded Congressional enforcement power under the civil rights
amendments and violated the federalism provision outlined in the Tenth Amendment. A decisive
8-1 majority found that no such violation had occurred. While recognizing that the federal
government was given an immense amount of power to oversee the states subject to
preclearance, the justices felt that the extreme discrimination in the covered states and the fact
that they were unlikely to correct this behavior themselves warranted such close supervision.
Chief Justice Warren responded to South Carolina’s protests by stating:
On the contrary, [the enforcement provision] of the Fifteenth Amendment
expressly declares that "Congress shall have power to enforce this article by

10
appropriate legislation." By adding this authorization, the Framers indicated that
Congress was to be chiefly responsible for implementing the rights created in § I
....Accordingly, in addition to the courts, Congress has full remedial powers to
effectuate the constitutional prohibition against racial discrimination in voting.'"
(Rodriguez 2003, 788)
Essentially, Warren found the VRA to be neither overly broad nor overly powerful as a way to
correct the issue at hand. This idea was reinforced by the accompanying case of Katzenbach v.
Morgan, also decided in 1966. The provision challenged in this case dealt with state laws that
penalized voters who were unable to speak English. This directly contradicted voting procedures
as outlined in the New York State constitution, which required English literacy as a condition for
voting eligibility. Again, it was argued that the VRA violated the principle of federalism. Yet
again, the Court found that it was well within the right of Congress to determine the scope of
voting rights and thus take whatever actions necessary to protect them (Rodriguez 2003). This
idea of deferring to Congressional authority was furthered in 1969, when the Court decided Allen
v. State Board of Elections. The Court’s ruling gave Congress a broad range of authority for
regulating voting laws in covered states. Not only were they allowed to review laws related to
the act of voting itself, but also indirectly related laws such as the location of polling places,
election district lines, and candidate qualifications (Donahue 2004).
However, the willingness of the Court to give Congress unlimited authority under the
VRA would not last long. The first limitations were suggested by Beer v. United States in 1976.
While it was initially the case that any laws that would have a discriminatory impact were
prohibited under preclearance, the Court ruled in Beer that the purpose of preclearance was for
the government to reject any laws that had a retrogressive effect on minority voters- that is, any

11
law that would make them worse off than they already were. This represented a moderate
narrowing of the scope of federal authority at the time, but would have broader implications a
few years down the road because the case would be used as a precedent in decisions to whittle
down what counted as a preclearance violation even further (Donahue 2004). The first major
limitations of the VRA began in the 1990’s. In 1993, the decision in Shaw v. Reno altered the
paradigm of the federal government always erring on the side of minority voters. The case was
concerned with several states creating highly abnormally shaped voting districts. The states were
actually attempting to comply with the VRA by ensuring that the lines were drawn in such a way
as to give minority voters an advantage in electing candidates of their choosing. However, the
Court struck down this practice of extreme racial gerrymandering. As Rush describes it, the
Shaw decision “removed the privileged status of remedial redistricting” (1995, 158). While such
a practice would earlier have been welcomed as a sign of trying to benefit minority voters, the
Court was now saying that the district boundaries were unconstitutional because race was
weighed too heavily as a factor in their creation. Racial redistricting policies were now required
to be narrowly tailored and not used to achieve any sort of quotas, similar to the way California
v. Bakke placed a limit on how much of a role race can play in admissions decisions. In 1995, the
Court solidified this decision in Miller v. Johnson, effectively establishing that states should be
careful not to allow racial considerations to impact the shape of their districts too much, as the
resulting irregularity of shape would give away the fact that race was weighed too heavily as a
consideration (Rush 1995). Donahue concurs and explains that these two cases were influential
in getting the Court to recognize just how much power the federal government, and the
Department of Justice (DOJ), in particular, had been granted in reviewing voting laws before this
subsequent limitation on their authority (2004). In addition to reviewing changes to voting laws,

12
the DOJ had essentially been able to regulate how covered states could draw their district lines in
the name of preventing discrimination. Rush went as far as to state that these decisions would
make it more difficult for minorities to file a claim of discrimination under the VRA’s second
section and would even make it more difficult for the states to comply with the VRA’s
requirements (1995).
Perhaps the biggest blow to preclearance came with the Bossier Parish cases of 2000. In
the first case, the Court ruled that Section 2 criteria under the VRA could not be taken into
consideration when the DOJ reviewed laws submitted for preclearance. This meant that DOJ
could look only at the effects of the laws when making its decision, not their intentions. The
Court also returned to their Beer policy of retrogression as the standard for deciding whether a
law was acceptable, a position it solidified in the second case. The Court ruled that retrogression
was to be the sole consideration when determining whether a law passed preclearance. This
meant that even if a law was passed with the intention of discriminating against minority voters,
the DOJ was obligated to approve it unless it would actually cause the position of minority voters
to decline. Donahue remarks that, after these cases, “section 5 could be accurately described not
as ‘the goddamnedest toughest’ attempt to prevent continuing discrimination against minority
voters, but rather as solely a ban on ‘backsliding’" (2004, 1661-2).
The final significant event prior to the case at hand came with Georgia v. Ashcroft in
2003. The state of Georgia was in the process of redistricting and wished to break up some of its
predominately black districts in order to create a greater number of districts with a Democratic
majority. The Court’s ruling shifted the ability of minorities to elect candidates of their choice to
only a consideration, rather than the central concern, when states under preclearance adjusted
their district boundaries. Previously, redrawing the lines to make it less likely that a black

13
majority would elect their desired candidate would have undoubtedly failed preclearance. Now,
however, Justice O'Connor explained that "'[T]he power to influence the political process is not
limited to winning elections."' Rather, ‘[a]s ... in the [Section] 2 context, a court or the
Department of Justice should assess the totality of the circumstances in determining retrogression
under [Section] 5’" (Donahue 2004, 1665-6). In short, the Court has come a long way from its
permissiveness in the 1960’s and 1970’s to strictly regulating the types of laws that could be
constitutionally denied under preclearance.
Among the scholars who reviewed these cases, it would hardly be a surprise that a
preclearance issue came before the Court yet again. All three scholars recognized that the
weakening of the federal authority on such matters would provoke preclearance’s opponents to
try and kill it once and for all. As Donahue predicted, the fact that the Court has deemed it
acceptable to narrow the oversight power of the federal government was used as support by its
opponents to argue that the VRA has outlived its purpose (2004). Rodriguez was able to identify
three key reasons why preclearance might be in danger: the precedents that have limited federal
oversight authority, the declining concern about race-based claims, and the decisions that have
limited what can be overturned as a VRA violation. He also pointed to the fact, as the Chief
Justice did in his Shelby County opinion, that the amount of time that has passed since the law
was enacted makes some of its provisions seem rather outdated (2003, 28). In what seems to
echo Chief Justice Robert’s words, he wrote that,
In 2007, the Act will have been in place for forty-two years. Since only a few
jurisdictions have been able to "bail out" of the Act's coverage, most jurisdictions
that were initially brought into coverage at the very beginning still remain under
the auspices of the Act's provisions. These jurisdictions, along with conservative

14
activist organizations like the Pacific Legal Foundation and the Center for
Individual Rights, would likely challenge any reauthorization that occurred
(Rodriguez 2003, 30).
The time limits for preclearance were initially established to satisfy the argument that the VRA
violated the principles of federalism. It was thought that people would be more accepting of this
encroachment on state authority if they knew that it would only last for a short time. However,
the fact that so much time has passed, coupled with the continual limitations of VRA
enforcement power, led to the belief that preclearance would be most in danger if it was
extended, unchanged, in 2007 (Rodriguez 2003; Donahue 2004). In fact, Rodriguez argues in his
paper for Congress to protect the VRA at the time of the 2007 extension by extending it for a
shorter period, making it easier for jurisdictions to bail out, and only requiring states that have
had objections filed against them since 1982 to be subject to preclearance (2003, 47). Yet, as we
know, Congress simply extended the preclearance provision for another 25 years without making
any changes to the formula.
Despite these negative predictions, the scholars were confident that preclearance would
prevail in the end (Rodriguez 2003; Donahue 2004; Rush 1995). As Donahue explained, the
weakening of the VRA was not its “death knell,” but rather an opportunity for Congress to
improve the law (2004, 36). Rush agreed, taking the decisions of cases like Shaw to mean that
the Court wanted Congress to come up with a better and more clear way to enforce the VRA and
that the Court might be rethinking how to best apply the law to protect minority voting rights
(1995, 14-6). For his part, Rodriguez, too, believes that the Court is not ready to part with the
VRA completely and will continue to make exceptions for its oversight powers. As evidence, he
cites the fact that preclearance oversight appears to still be very much needed, and that this

15
oversight is targeted at the areas that need it the most. Between 1980 and the publication of his
article in 2003, the DOJ entered 624 objections to voting law changes, roughly 94% of which
were in the eight states fully covered by preclearance (2003, 32; 37). He added that what the
VRA forbids is not inherently constitutional behavior, but rather that which seeks to unfairly
deprive Americans of their rights. As a last reason for believing that preclearance would survive,
Rodriguez compares it to Justice O’Connor’s reasoning in Planned Parenthood v. Casey: VRA
protection is something that minorities have come to depend upon to protect their rights, and,
should the Court choose to remove that protection entirely, they will essentially have nowhere to
turn for help if those rights are in danger (2003, 54).
Another interesting thing to point out about the scholarly research is that, while
accurately predicting the fate of the constitutional status of preclearance, all the scholars have
focused their research and opinions on Section 5. Perhaps because it has been left unchanged for
so long, no one seemed to predict that Section 4 would be the one to meet its demise, perhaps
because it has been extended with little change so many times. They seemed to expect an all-or-
nothing decision either maintaining preclearance requirements or removing them entirely. None
of the scholars seemed to expect the Court to leave preclearance intact but strip it of all of its
actual powers. As such, the goal of this project is to examine the current state of affairs in light
of precedent to try and get a sense of where preclearance is now headed.
III. Potentially Discriminatory Laws Today
As a result of the laws passed since the early sixties, poll taxes and literacy tests are not
the type of measures that people worry about when it comes to discrimination against minority
voters. That is not to say, however, that no such measures exist today. As one scholar pointed
out, the very fact that preclearance received yet another quarter-century extension as recently as

16
2006 indicates that the federal government still had real concerns about discriminatory voting
laws (Clarke 2007). Perhaps the biggest concern about discrimination is due to the growing
popularity of voter ID laws. When the Supreme Court addressed the issue in 2008 with Crawford
v. Marion County Election Board, the general consensus amongst the judges was that there was
not enough proof of discriminatory impacts to render all such laws unconstitutional (de Alth
2009). However, a fair number of political scientists and voting rights advocates have examined
the issue and feel that there is much to worry about. One legal scholar analyzed data available in
2006 to conclude that voter ID laws had a significant impact on voter turnout in a negative way,
estimating that 3 to 4.5 million voters were disenfranchised because of laws enacted between
2002 and 2006 (de Alth 2009, 186). According to the estimates from the Brennan Center for
Justice, this number was up to over 5 million by 2012 (NAACP 2011, 13). This is due to the fact
that many people lack the required ID for one reason or another, especially where minorities are
concerned. de Alth found that 11 to 12% of white voters did not possess the required ID, but that
25% of African American voters lacked it (de Alth 2009, 189). The NAACP found similar
statistics in a report they published:
An astonishing 25% of African Americans (over 6.2 million African-American
voters) and 16% of Latinos (over 2.96 million Latino voters) do not possess valid
photo ID. By comparison, only 8% of whites are without a current government-
issued photo ID. Another study found that 19% of African Americans, but only
3% of whites, do not possess a driver’s license. In addition, given their higher
mobility rates, minorities are less likely to have photo ID showing a current
address, even if they have an otherwise valid photo ID. (NAACP 2011, 35)

17
The report goes on to describe a number of reasons why minorities lack the required ID.
Hispanics who immigrated to the United States obviously are unlikely to have American birth
certificates, but this is also a widespread problem for elderly African Americans. Since
segregation was still so prominent when they were born, many did not have equal access to
hospitals and thus no official records of their birth exists. The higher poverty rates amongst
minority groups and their tendency to live in urban areas accounts for the lack of driver’s
licenses. High poverty rates also mean that minorities are less likely to own their own permanent
homes, and those that do experience higher rates of foreclosure, so providing proof of address
can also be a struggle (NAACP 2011).
This difficulty in obtaining ID has led some scholars to compare voter ID laws to
modern-day poll taxes (Clarke 2007). The laws’ supporters find this view to be extreme, but the
NAACP’s explanation for this comparison makes sense. In many states, the cost of a valid form
of ID, such as a driver’s license or passport, is a significant sum of money. Further, although
there are some states that offer free forms of identification, a person is required to submit a birth
certificate in order to obtain them. For anyone who does not have or is unable to obtain a copy of
their birth certificate, a fee is charged to get it replaced. This cost is not as much as it would be
for other forms of identification, but is still enough to place a financial burden on someone with a
low socioeconomic status (NAACP 2011).
Another point of contention for voting rights advocates is the fact that voter ID laws seem
to be the most prevalent in places where minority populations are the highest. Based on turnout
figures from the 2008 election, the states with the highest African American turnout rates, such
as Georgia, Texas, and Florida, have been leaders in strengthening their voting requirements over
the past few years. The same is true for the states with the highest Latino turnout (NAACP 2011,

18
13-4). This may be a coincidence, but additional survey evidence has reported that African
Americans and Hispanics, even in states where ID is not required, are asked to present it at a
significantly higher rate than white voters are (de Alth 2009; NAACP 2011).
These figures lead one to wonder why these laws are being passed in the first place. It is
no secret that the only one of the two major political parties supports them. One need look no
further than the Democratic National Committee’s report on “the real cost of photo ID,” which
describes the laws as “an unnecessary, expensive, and intrusive voter restriction in a time of
fiscal crisis,” to prove this point (DNC 2011, 1). The report laments that “Republican legislators
across the country are advancing an unnecessary and expensive government mandate: the
requirement that voters obtain and produce certain specified government-issued photo
identification at the polls on Election Day” (DNC 2011, 2). Republicans, on the other hand, feel
that photo ID laws are necessary to prevent voter fraud. However, studies suggest that such fraud
is really not that serious of an issue. A report from Demos that examined voter fraud in America
studied a variety of states, including Mississippi and Texas, and found that “little evidence of
significant fraud in these states or any indication that fraud is more than a minor problem.
Interviews with state officials further confirmed this impression” and that “some of the most
notable allegations of fraud have proved to be baseless” (Minnite 2003, 6). The report also found
that even reforms that were designed to make it easier for people to vote, such as Election Day
registration and less strict absentee ballot rules, have not led to an increase in fraud. Furthermore,
it contains a number of suggestions for states that are worried about fraud to make their elections
less susceptible to it. These include things like training poll workers better, updating registration
lists, not requiring voters to register more than once, and improving communication to make it
more clear to voters what the laws are (Minnite 2003). Nowhere in this list does it suggest voter

19
ID laws. If fraud is not really a significant problem and there are other non-discriminatory
measures available to prevent it, then there clearly has to be something else going on with these
strict ID laws. That is one of the things this thesis will examine.
IV. What States Are Doing Now
There appear to be several indications already that states are going to take advantage of
their freedom from preclearance requirements to pass new voting laws without the fear that they
will fail to be preapproved by the federal government. Indeed, states that previously had changes
rejected under preclearance have already begun to enact those now-legal changes, and some of
them in even more strict forms. For example, Texas had a voter ID law rejected in the spring of
2012. The state was unable to prove that the proposed law would not have a retrogressive impact
on minority voters, or that there was no other, less discriminatory, action that could be taken
(Coleman, Fisher, and Whitaker 2012). However, the Shelby County decision means that Texas
is now free to enact voter ID laws without having to submit them to review by the federal
government. And this is precisely what Texas has done.
The law proposed by Texas was quite strict. It would require voters to present a driver's
license, Texas ID card, military ID, citizenship certificate, passport or concealed handgun license
(Janes 2013, 2). While the Justice Department feared that the law would discriminate against all
minorities, it was the state’s growing Hispanic population that they were particularly worried
about. An analysis of surnames revealed that twice as many Hispanics as non-Hispanics lacked
the required ID, meaning that 800,000 Hispanic voters could lose the right to vote (New York
Times 2012, 2). It is not hard to see why the law was rejected under preclearance. Yet, less than
a month after the Shelby County decision was announced, the Texas Attorney General announced
that the state would begin enforcing the law immediately (Janes 2013). The Texans were not the

20
only ones to take advantage of their new freedom. Arizona Republicans are already fighting a
legal battle to redraw their district lines. The attorney for the case insists that the Shelby County
decisions renders Arizona’s current district map unconstitutional because the voting districts
were designed to overcrowd Republican districts so that there were fewer districts with
Republican majorities and consequently fewer seats in the state legislature likely to go to
Republicans. This meant more districts with Democratic majorities, thus allowing the Democrats
to gain more seats in the state legislature. This was intended to allow the state to improve its
minority representation rates as per the VRA requirements, but the attorney believes that the end
of the state’s preclearance supervision means that it is no longer legitimate to draw the district
lines in this manner (Duda 2013).
Texas was hardly the only state to have proposed laws rejected under preclearance. A
similar situation occurred in South Carolina. In the spring of 2011, the state legislature proposed
a voting ID law that would require all potential voters to present photo identification before they
could cast a ballot. It failed to pass review by the Justice Department which found that the law
would have a disproportionate impact on minorities. This finding was due to reports that
minorities were 20% more likely than whites to lack the proper ID: a driver’s license or state
DMV card. South Carolina could not present any evidence of voter fraud that would justify such
results (Fessler and Siegel 2011). A 2005 Georgia law failed for the same reason. Passed in
2005, it would have required a state-issued photo ID to be presented at polling places. Just like in
Texas and South Carolina, it was found to be discriminatory and unwarranted. When the law
went under preclearance-required review, the Justice Department judge went as far as to compare
it to a poll tax because it would require otherwise eligible voters to pay for an ID in order to vote
(Jet 2006). The state plans to enforce this law in the coming election season (Devlin 2013). In

21
fact, several of the states whose laws failed preclearance are now planning to implement them
now that they are able to do so. For example, the Mississippi legislature passed a voter ID law in
2012 that opponents feared would make it more difficult for minorities, as well as the elderly and
the poor, to vote. It was so controversial that all of the state’s black officials refused to attend the
signing ceremony (New York Times 2012). This law wound up not making it through
preclearance, either, but it looks like it will now be implemented. The same is true for a similar
law in Virginia (Cornish 2013).
This is not to say that there is nothing the federal government can do about
discriminatory voting laws, because the other provisions of the VRA still stand. Section 2, which
pertains to all jurisdictions, prohibits discriminatory laws and allows for both the government
and private citizens to challenge voting laws in court (Coleman, Fisher, and Whitaker 2012).
This is currently happening with Texas. The Obama Administration has already announced that
it will take steps to return the state to federal supervision. This is possible using the bail-in
provision of the VRA. Section 3 permits the federal government to add jurisdictions to the
preclearance list if they can prove that laws with discriminatory intentions are being passed. This
is a much stricter standard than the previous formula under Section 4, but Attorney General
Holder believes he has a strong enough case against Texas. Unsurprisingly, Governor Rick Perry
has stated that his state will fight any attempts to re-subject Texas to preclearance. Holder plans
to bail in other states as well, but whether this strategy will be successful remains to be seen
(Devlin 2013). One problem is the fact that such a method is expensive and time-consuming.
This is especially the case if the Court requires proof of the law’s effects in order to justify
overturning it, the laws might have to be in place for a few elections before that proof can be
provided. Even if the laws are then overturned, that will not erase the consequences of any

22
discriminatory effects that occurred in the meantime. In addition, it appears unlikely that all
potentially discriminatory laws will receive the attention that Texas’s law has. According to Bill
Yeomans, a former assistant attorney general in the Civil Rights Division of the Department of
Justice,
enforcement of the voting rights laws depend on the Department of Justice and
private litigants going out and finding election changes. And that will be easy for
the big ones. So for redistricting and major changes, they'll be visible. For smaller
changes, it's going to be much more difficult… Those things simply aren't going
to surface the way they used to. (Cornish 2013, 1)
It is a major change that the federal government now has to be on the lookout for problematic
voting law changes instead of having those changes brought directly to their attention. While no
state or jurisdiction is legally permitted to have discriminatory laws, it is not easy for the federal
government to monitor every jurisdiction in the United States. Texas is parading its new law
around in the national news, but now that areas with a history of discrimination are no longer
required to report their proposed changes to the government, it will potentially allow laws to slip
through the cracks. While an incredibly strict, state-wide voter ID law is hard not to notice,
smaller changes in counties or even towns that were previously subject to preclearance might not
come to the government’s attention.
A final, sobering thought is that is seems as though potentially discriminatory laws are
backed by public support. A Pew research poll from 2012 reported that a clear majority of voters
supported requiring voters to present some sort of identification before casting a ballot- 77% in
favor and only 20% opposed. A Washington Post poll conducted a few months later concurred
with these results, and added that 81% of respondents thought that voting fraud was at least a

23
minor problem. Only 41% of respondents to the second poll believed that the fact that such laws
can prevent otherwise eligible voters from casting ballots was a serious problem. Additionally,
the same poll reported that more people felt that voter fraud was a more important concern than
this disenfranchisement, albeit by a 4% margin. Taken along with the fact that 41 states have
considered passing some sort of voter ID laws since 2011, it does not look like these laws will be
disappearing on their own any time soon (Coleman, Fisher, and Whitaker 2012, 3-4; 18).
Hypotheses
1. If they remain free from the supervision of preclearance, many of the states that were formerly
subject to it will pass discriminatory laws.
Recent news events describe state efforts to enforce new voter ID laws, in particular, that
were rejected under preclearance. Texas is one example. The fact that the Supreme Court has
weakened federal authority to approve those laws and limited what constitutes a violation of the
VRA leads me to believe that these states will be able to enact such laws and public opinion and
recent events suggest that they will want to do so.
2. Discriminatory voter ID laws are the biggest problem in Republican-controlled states where
minorities are becoming a bigger part of the population and thus the voting pool.
There has been a lot of controversy over whether or not voter ID laws actually do
anything to prevent fraud like their proponents say they do, however the literature suggests that
fraud is not truly an issue. What is known is that these laws are favored by Republicans and tend
to disenfranchise would-be Democratic voters. It seems like the Republican governments might
perhaps be taking advantage of these discriminatory impacts in states where they fear that a
growing percentage of minority voters will eventually cause them to lose their political power
and become the minority party.

24
3. The states that were subject to preclearance and those that have passed or proposed
discriminatory laws are not necessarily one and the same. When it comes to predicting
whether states will pass discriminatory voting laws, the presence of particular political and
demographic characteristics is a better indicator than the state’s previous preclearance status.
Since there were provisions that allowed states to bail out from preclearance, those who
were unable to do so likely had good reasons why. Recent news articles report that some of these
states are now passing strict voter ID laws. However, other states do have voter ID laws in effect
and similar political and demographic conditions, so it seems unlikely that those who were not
covered by preclearance, and thus not having their actions monitored by the federal government,
will be totally free of voter discrimination. Also, the fact that the Supreme Court overturned the
formula for preclearance because they felt it did not represent the current needs of the nation
implies that the states that need and the states that were under preclearance were not necessarily
the same.
Methods
The data examination for my thesis is in the form of a comparative analysis. I have
chosen ten states to study that have been drawn from different categories of preclearance
supervision: those that were under preclearance for the whole time it was in effect, for a portion
of that time, and for none of the time. I tried to pick the states with these categories from
different regions of the country so that they would be as representative of the whole group as
possible. The first group consists of the states that were covered by preclearance from 1965 until
Shelby County was decided in 2013. From these I have chosen South Carolina, Alaska, and
Mississippi. South Carolina was an obvious choice because it is one of the states that has been in
the news lately for passing a law that had been denied under preclearance and is already being

25
challenged as discriminatory. The other states were chosen because of their geographic locations:
Mississippi is located in the Deep South (a region long associated with racist policies) while
Alaska is hundreds of miles away from any other state that was under preclearance. The next
category is states that were under preclearance at one time, but had bailed out of the
requirements by 2013. Maine was chosen because I was quite surprised that such an independent
state with a reputation for tolerance was ever under preclearance at all, and it was only subject to
it for a few years. Idaho and Connecticut were chosen because, like Alaska and Mississippi, they
are in two very different regions on the United States. There are, of course, a number of states
that were never subject to preclearance at all. From this group I picked Vermont, Tennessee, and
Washington, as they represent the northeast, south, and west, respectively. Tennessee was
particularly interesting to me because six of the states it shares a border with were subject to
preclearance while it was not. The tenth state I chose is Texas. I feel that it warrants special
attention because, while it was not subject to preclearance for the entire duration of the law, it
was still fully covered in 2013 and has been in the media spotlight over the passage of its new
voter ID law and the subsequent DOJ challenge. I felt that it would thus be crucial to include it in
my study.
I collected data on several variables for each of the states that I hoped would allow me to
get an idea of which ones are likely to or have passed voter ID laws and to see what they have in
common that might suggest why they are doing so. To start, I recorded what period of time, if
any, that the state was subject to preclearance. The DOJ’s website provides all of this useful
information. I then looked at whether or not the state has a voter ID law in effect and how strict it
is. The National Conference of State Legislatures has compiled this information. I also collected
some political demographic information for each of the states, including whether they have

26
traditionally voted for Democrats or Republicans in the presidential elections since preclearance
was first established in 1965. To go along with this, I looked at whether their state legislatures
and governors have traditionally been Democrats or Republicans. I also examined each state’s
population by race and voter turnout by race and how these might have changed over the past
several years. Voter ID laws really started to come onto the scene in 2011, and a combination of
exit polls and census data can provide these numbers. Exit poll data for the last three presidential
elections (2004, 2008, and 2012) is available through sources such as CNN to provide details
about voter turnout by race. The population data for the previous six censuses is also available
and helps show how the minority portion of state populations has changed over the years.
The reason for collecting this particular data was to try and get a sense of what states with
strict voter ID laws either in effect or that they are currently trying to enact have in common
compared to states without such strict laws. I felt that the answer to both the question of which
states are more likely to have such laws and why they have enacted them lies within the political
and demographic information about the state. Specifically, it seemed as though the states with
Republican governments and growing minority populations should be the ones to pass strict laws
as an attempt to maintain political control, while those controlled by Democrats and with smaller
or more stable minority populations would not have such strict laws. The former group seemed
most likely to have been under preclearance for the longest time while the latter would be the
states that were only temporarily under preclearance or not at all. Collecting the relevant data
enabled the validity of such predictions to be tested.
Results
An important note about results: All of the maps and tables referred to in this section are
contained in the appendix. The information is color-coded based upon each state’s experience

27
with preclearance. The same color key contained in the appendix is used for all of the maps and
tables and for the discussion of the results as well.
It is clear from the literature that my first hypothesis, that many of the states recently
freed from preclearance are going to pass discriminatory voting laws, is correct. Now that there
is no longer the restriction of preclearance on state voting laws, passing new voter ID laws is
exactly what many of the states that were formerly subject to it are doing. Updated reports from
Frontline explain that five of the states that would have needed to get federal approval to
implement new voting laws before the Shelby County v. Holder decision had new ID laws in the
works within 24 hours of the ruling. In addition to Texas, South Carolina, Virginia, Alabama,
and Mississippi all have passed or are now in the process of passing photo ID laws for their
voters. Evidence strongly suggests this surge would not have happened had preclearance
remained in effect. The Mississippi law was awaiting federal review at the time the decision was
released, while Alabama never even bothered to submit its law for review. Both states are
prepared to have these laws in effect by the 2014 elections. While we cannot say for certain that
these two particular laws would have been rejected by the federal government, that is precisely
what happened in South Carolina and twice in Texas. The Texas law, now the strictest voter ID
law in the nation, took effect immediately. South Carolina’s government is working on
implementing their new photo ID law as well (Childress 2013).
As Table 1 shows, there are a number of states with new strict photo ID laws that will be
in place for the first time during the 2013 or 2014 election seasons. In addition to those
mentioned above, Arkansas, North Carolina, Pennsylvania, Virginia, and Wisconsin all have new
strict photo ID laws. As the notes for Table 1 explain, this means that voters who do not provide
photo identification from an approved list when they go to the polls are only able to fill out

28
provisional ballots, which will not be counted unless the voter is able to provide approved
identification to election officials within a short period of time. So, unless they left their wallet
on the kitchen table, voters in states with strict photo ID laws are highly unlikely to see their
votes counted unless they are able to bring acceptable ID to the polls. Given the potential for
disenfranchisement, and discriminatory disenfranchisement, with these laws, it is very interesting
to look at why states might be passing them if fraud is not the issue that voter ID supporters
claim it to be. This is the subject of my second hypothesis. I shall discuss how each of the factors
that I examined plays out in the states I studied to show why I believe they are the ones that
determine a state’s likelihood of passing strict voter ID laws. For ease of discussion and to
transition to the last hypothesis, I will discuss them by their color groups according to Figure 5.
To recap this coding system, the red states are those that were fully subject to preclearance from
1965-2013, the blue states are those that had jurisdictions covered from 1965-2013, the green
states were once subject to preclearance but had fully bailed out by 2013, and the white states
were never subject to preclearance.
The first group is the red states. Again, two of these three states now have or are in the
process of implementing strict photo voter ID laws. As Table 2 illustrates, the red states have all
overwhelmingly supported Republican candidates in every presidential election since 1964, the
first election that was taken into consideration in the preclearance formula. All three of them
chose Republican candidates for at least 11 of the 13 elections that have since occurred. They
also tended to be controlled by Republican governments at the state level. As Table 3
demonstrates, they have all had Republican governors and Republican-controlled state
legislatures for at least the latter half of the past decade, if not longer. The only exception is
Mississippi’s legislature, which was controlled by Democrats until 2012. However, the gap

29
between the parties in the legislature was not large. According to the data from polidata.org, the
Democratic Party did not have more than a 4-person majority in the state senate or a 28 person
majority in the state house since the 2006 elections. If anything, this perhaps suggests that the
Republican Party may be anxious to retain the majority that it has finally achieved.
The most interesting findings come into play when you look at the party control in the red
states alongside their minority populations and voter turnout rates. All three states generally have
seen decreases in their white populations and increases in their black and Hispanic populations
over the past six decades. This is not a surprise as the trend is true for the nation as a whole, as
Table 4 clearly shows. If you look at the table more closely, however, you can see that the red
states (along with Texas, which will be discussed shortly) had the lowest white population
percentages out of the ten states I examined. When the states are ranked in order based on what
percentage of their population is white, these three states consistently fell into the bottom three or
four spots, with Mississippi and South Carolina often numbers nine and ten, respectively.
Mississippi and South Carolina were also always the two states with the highest black population
percentages. They fell in the middle with Hispanic population percentages, although Table 6
reports that South Carolina had the largest Hispanic percentage increase out of all 50 states from
2000-2010. While the Hispanic percentage of the national population increased 43% during this
decade, the Hispanic population of South Carolina increased by 143% during this time. Alaska
was in the middle for both minority groups.
The same phenomenon present in the population percentage data occurs with voter
turnout rates as well. The three red states tended to have some of the lowest white percentage of
total voters, while they were among the highest as far as the percentage of their voters that were
minorities. Table 5 illustrates these results. Alaska was again more in the middle of the group,

30
but Mississippi and South Carolina were more extreme. Both had very low white portions of
their voters compared to the other states and were first and second in the portion of black voters,
respectively. There is not as clear of a pattern of white decrease and minority increase as there
was with the population results, but from the data available it appears that this is this case in all
of the states I studied more often than not. It is important to remind ourselves at this point,
however, that the pattern of voter turnout does not mean that voter ID laws are not affecting
minorities in the way they have shown to in the past and have been predicted to continue doing.
Since they were under preclearance until this past summer, the strict photo ID laws in the red
states were not in effect during any of the elections that this data describes, so they have no
bearing on any of the information Table 5 contains. Referring back to Table 1, we can see that
this is the case for quite a few of the states with the more strict ID laws. Thus, it is important that
we not use the turnout percentages to draw false conclusions about the impacts of these laws.
Before we move on to the next category of states, Alaska warrants some special attention
because it is somewhat of an outlier as compared to the other red states. As I mentioned in the
previous section, I chose Alaska on purpose because it is so different from the other red states as
far as geography and history are concerned. Referring back to Figure 5, we are reminded that all
of the other red states form a near-continuous band in the heart of the American South that
shared a history of slavery, seceded from the Union during the Civil War, and were infamous for
their segregation and Jim Crow laws. Alaska, however, is thousands of miles north of its nearest
red neighbor and had a much different past, so the fact that it is different is not all that surprising
at all. Unlike South Carolina and Mississippi, Alaska does not have strict photo ID laws (it has
non-strict, non-photo) or black and Hispanic populations that are increasingly becoming
significant percentages of the state population or voting at significant and increasing rates. What

31
Alaska does have in common in its relatively low white population percentage. While Alaska
also does have a fairly large minority population, it is not composed of the same minority groups
as in Mississippi and South Carolina. American Indians, Eskimos, and Aleuts make up a much
more significant portion of the Alaskan population than blacks and Hispanics do (US Census
Bureau). It is quite possible that voter ID laws do not impact these groups in the same way they
impact blacks and Hispanics and also possible that these groups do not vote for Democrats at a
rate that would concern a Republican government enough to take measures that would
potentially disenfranchise them. Either way, for the purposes of this research we can see that
Alaska lacks the full scope of the characteristics associated with the presence of voter ID laws.
However, Texas, our blue state, has characteristics very similar to those of South
Carolina and Mississippi. Again, Texas is now a strict photo ID state. A clear majority of
presidential elections went to Republican candidates and the states government overwhelmingly
controlled by Republicans. Texas also was near the bottom of the list for the white percentage of
both the general population and of people who voted. These percentages for blacks were still in
the top four for both categories and, as we can see from Table 6, Texas was ranked third in
overall black population growth from 2000-2010. The important thing to notice here is that
Texas is the clear leader in all things Hispanic. No other state had a Hispanic population
percentage anywhere close to Texas’s, and the state was second nationally in Hispanic
population growth during the 2000’s. Unsurprisingly, Texas also had the highest percentage of
voters that were Hispanic and this, too, was a percentage much larger than any of the other states
I studied.
As we examine the last two color groups, we will see that the trend established by the red
and blue states remains in these categories as well. When we look at the three green states, none

32
of which have strict photo ID laws in effect or proposed at this time, we can see that they tend to
have different characteristics than the previous groups. Maine and Connecticut both chose
Democratic presidential candidates in the majority of the last 13 elections and their state
governments were either dominated by Democrats or more mixed between the two parties, such
as the way that Connecticut’s legislature has been largely Democratic. All three of these states
also tended to have higher percentages of their populations and voters that were white. Maine,
for example, was in the top two for white population and had the highest white percentage of
voters out of the ten states while these same percentages were some of the lowest for minorities.
Even though, as Table 6 reports, Maine had the largest percentage growth for its black
population during the 2000’s, the population still remains a significantly smaller percentage of
the population than in the other states. Connecticut had a middle-to-high white percentage of the
population and voter turnout. These percentages for the black population were in the middle of
the group as well. Connecticut was second only to Texas with the Hispanic percentage of
population and voter turnout, but these percentages are still only about a third of those in Texas.
Idaho was not far behind Connecticut for Hispanic percentages, but also had the third highest
white percentage of both population and voter turnout and one of the lowest percentages for
blacks.
The last group that I examined, the white states, was perhaps the most mixed. Two of the
states, Vermont and Washington, were similar to Maine and Connecticut in the fact that they
voted most often for Democratic presidential candidates and had mixed or Democratic-controlled
state governments. While Vermont did experience the third-highest national growth of its black
population, it still had one of the highest white populations and voter turnout percentages of all
the states I studied and was on the lower end for minority population and voter turnout

33
percentages. Washington was in the middle for both white and minority percentages of its
population and voter turnout. These two states have no and non-strict, non-photo voter ID laws,
respectively. Tennessee does have a strict photo ID law. Tennessee has also chosen Republican
presidential candidates in the majority of elections. Its state government looks most similar to
Mississippi’s: control split between the two parties but under Republican control for the last few
years. Tennessee’s white and Hispanic percentages of both the population and voter turnout were
in the middle-to-low end of the group, while the same percentages for blacks were some of the
highest.
These results are summarized briefly in Table 8. As you can see, it seems that the factors
I have examined appear to be indicators of whether a state will pass strict voter ID laws because
they generally follow the same pattern. We see strict voter ID laws when a state generally
chooses Republican presidential candidates, has a Republican-controlled state government, and
has a lower percentage of the population and voters that is white and higher minority
percentages, be them black or Hispanic. It is particularly significant when these characteristics
are present in the late 2000’s, when the push towards voter ID laws has grown stronger. This
definitely makes sense as a potential explanation for the growing popularity of these laws. It is
common knowledge that black and Hispanic Americans are most often supporters of the
Democratic Party. We can see this fact from the exit poll data from the past three elections. In
2004, 88% of black voters and 53% of Hispanic voters voted for the Democratic presidential
candidate (CNN 2004). In 2008, 95% of black and 67% of Hispanic voters supported the
Democratic candidate and in 2010 93% of black and 71% of Hispanic voters supported the
Democratic candidate (CNN Politics 2008; 2012). Thus, in states where the white percentage of
the population is shrinking and the minority populations are growing, which appears to

34
correspond with a growing percentage of the people who vote in those states belonging to
minority races, there is a growing percentage of Democratic voters. This trend is occurring
nationally, but in some of the states that I researched the gap between whites and minorities is
much smaller than in others. For example, referring again to Table 4, Idaho’s white population in
2010 was still 77.3% greater than the combination of its black and Hispanic populations, but that
difference was only 21% in Texas. Even though both states are controlled by and tend to vote for
Republicans, Texas clearly has a bigger problem with a growing minority and thus likely
Democratic population. You do not really see strict photo ID laws in the states that are run by
and support Democrats, but they would have no reason to mind having more Democratic voters.
For the states like Texas, however, it looks like something is going to have to change. As the
projections in Table 7 show, the trend of growing minority and shrinking white populations is
not about to change. Common sense says that the Republican Party is not going to deal with this
by waiting for Democratic majorities to take over. They have to either find a way to win over
these growing minority populations, or to find some other way to prevent an influx of
Democratic voters. Preventing these minorities from voting might be a way for them to do this.
It is interesting to note that the pattern of what factors were connected to strict voter ID
laws were consistent across the states, but there was not necessarily any consistent pattern
present for states by color group. This leads to my third hypothesis that the fact that a state
belongs to a certain color group does not always correspond with whether or not it possesses the
characteristics indicative of strict voter ID laws because a state’s political and demographic
conditions are really what are important for predicting whether it will pass discriminatory voting
laws. This, too, seems to be an accurate prediction. For example, Alaska did not really fit in with
the laws and characteristics in the other red states, and Tennessee also did not really fit in with its

35
group either. We can see this trend nationally as well, according to Table 1. As it currently
stands, all of the red states that were fully covered by preclearance for its full duration now have
voter ID laws. Aside from the Alaska and Louisiana laws, they are all classified as strict photo
ID laws by the National Conference of State Legislatures. While such laws are the most
common in the states that were under preclearance from 1965-2013, they are present in other
states as well. Both states that had jurisdictions under preclearance from 1965-2013 and six of
the states that were never under preclearance have strict photo ID laws. Three of the five states
with jurisdictions still covered in 2013 have non-strict photo ID laws, and a number of others
have laws requiring non-photo ID, whereas all but two of the 16 states with no voter ID laws at
all were never subject to or had fully bailed out of preclearance requirements prior to the
Supreme Court’s decision. These results indicate that the red states are still the worst offenders
as a whole with strict laws that are expected to have discriminatory consequences, but it helps to
show why the Supreme Court overturned the coverage formula as no longer being an accurate
way to prevent voter discrimination. The data suggest that there are some states that were once
subject to preclearance that no longer need it, but also some that were not subject that might
benefit from the supervision.
Conclusion
There is, of course, additional information that could have made the results of this
research even more meaningful. If time and resources had allowed, I would have liked to
examine the characteristics of all 50 states in order to establish whether the characteristics I
identified as being indicators of strict voter ID laws indeed hold true for the entire nation. I was
fairly pleased with the amount of information that I was able to obtain about the states that I
studied. However, I was disappointed to see that exit polls had been cut in so many states prior to

36
the 2012 election. Even though the pattern was still visible without it, it would have been nice to
have the complete set of data. I also would have liked to have had the time to look at other type
of voting laws like felon disenfranchisement and same-day registration to see how their effects
compared to those of voter ID laws. Other potentially useful information that was not available is
a record of what states and jurisdictions applied for bailout but were denied. I feel that this might
have helped to further support the claim that preclearance is still a necessary provision in certain
states. The last data that would have been interesting to have is a list of which jurisdictions were
bailed in to preclearance over time. I was unable to discover how frequent and widespread the
use of this VRA provision has been, but I feel that it would have provided a clearer picture of
how successful the federal government will be with using bail in procedures to place
jurisdictions under preclearance now that this is the only way they can do so.
Despite these concerns, the data I have collected has a lot to say. Perhaps the most
important message is that racially discriminatory voting laws are not an archaic vestige of a
bygone era, but rather a real and relevant concern that our nation still faces today. The fact that
more states are increasingly proposing and passing strict voter ID laws is something that should
be of great concern to all Americans. Particularly if it is true that these laws are a Republican
attempt to hold on to power in the face of an increasingly Democratic electorate, this has some
important implications for democracy as we know it. Rather than changing their policies and
party platforms to adapt to the changing population, the nation that a party can influence their
electoral success by manipulating the electorate itself is a scary thought that seems to go against
the principles of democracy and universal suffrage that our nation has spent many years striving
for. Additionally, we would be quite remiss if we only look at voter ID laws as an indication that
voter discrimination still exists. Perhaps the case of Alaska is the best evidence of this out of the

37
ten states that I examined. Alaska differed from its red peers in the fact that it does not have strict
photo ID laws or large black and Hispanic minority populations. However, Alaska was still
under preclearance for nearly 50 years and never bailed out of its requirements, so we know that
there had to have been some other sort of discrimination occurring there. This is an excellent
reminder that there are other laws with discriminatory impacts and other groups being
discriminated against that we need to pay attention to as well.
It seems that the Supreme Court has put minority voting rights in a rather precarious
position by invalidating the preclearance formula. The Court’s jurisprudence on the subject
suggests that minority voters have something to be worried about when it comes to
discriminatory voting laws. The fact that the Court has gradually lessened the power of the
federal government to oversee voting law changes and had limited what can be rejected as a
discriminatory law implies that it is not going to be easy for such laws to be prosecuted in the
future. The reality that discriminatory laws must now be brought to the attention of the federal
government instead of being submitted for pre-approval in problematic areas and that these laws
have to be shown to decrease the ability of minorities to elect the candidates of their choice
instead of having the potential or even the intention of discriminating against a particular group
clearly shows how far the VRA’s protections have been limited since it was passed in 1965. This
latest decision seems to have taken away one of the strongest weapons in the fight against
discriminatory voting laws. In her dissenting opinion, Justice Ginsburg expressed her
disappointment in the verdict by saying that “one would expect more from an opinion striking at
the heart of the Nation’s signal piece of civil-rights legislation” (Shelby County v. Holder 2013,
23). Speaking for the majority, Chief Justice Roberts was careful to explain that voting
discrimination still exists, but that the improvements in minority voter turnout and election rates

38
mean that “the conditions that originally justified these measures no longer characterize voting in
the covered jurisdictions” (Shelby County v. Holder 2013, 2). However, many people are afraid
that these political gains are the direct result of preclearance, and that getting rid of the
requirement will cause these gains to disappear. Justice Ginsburg’s simile expresses this fear
perfectly: “Throwing out preclearance when it has worked and is continuing to work to stop
discriminatory changes is like throwing away your umbrella in a rainstorm because you are not
getting wet” (Shelby County v. Holder 2013, 33). Again, we can see from the data that minority
voter turnout rates are improving even in the states that were subject to preclearance, but there is
absolutely no grounds for assuming that these improvements will be able to withstand the strict
new voter ID laws because they have not yet been in place during any elections. Unfortunately, it
seems that the Court will need evidence that laws like these have a retrogressive effect on
minority voters before the Court will act on them, and it is sad to think that discrimination and
the consequences of minorities losing their political voice will have to occur in order to provide
this evidence.
However, before we say that the Court has left minority voters to fend for themselves, it
is important to remember that it did not go as far as saying that preclearance was unconstitutional
or that it is no longer needed anywhere. The Court had the opportunity to strike down
preclearance in its entirety by ruling that Section 5 of the VRA was unconstitutional as well, but
the justices stopped at Section 4 with the formula. This suggests that the justices feel that
preclearance is still a necessary provision of the VRA. Furthermore, it is unfair to deny that the
Court’s argument that the formula no longer fits the needs of our contemporary society is a
completely sound and accurate argument. The list of state voter ID laws in Table 1 alone is
evidence enough that there are some states with discriminatory laws that were not even subject to

39
preclearance, as well as states that were subject to preclearance that might not have any
discriminatory voting laws. It seems that the most logical explanation for the Court’s decision is
perhaps exactly what Rush suggested, that it is trying to force Congress to improve the formula
that it has neglected to update for so long and that the Court itself may be taking a different
approach to protecting minority voting rights (1995).
The only problem is that with the current nature of our politically divided Congress, it
seems highly unlikely that there will be a new preclearance formula devised and adopted anytime
soon, despite the fact that these results indicate that there ought to be. While it would be
thoroughly unconstitutional to make a state’s political affiliation criteria for subjecting it to
preclearance, there are other indicators that could become part of a new formula. Two factors
that could be used are whether the strictness of fraud-preventing measures corresponds to how
much of a problem voter fraud has been in the state or jurisdiction and whether increasing
minority populations are reasonably corresponding to increasing minority voter turnout rates. If
the laws are very strict in places where fraud has not been shown to be a problem and the
minority voter turnout percentages do not increase along with the population increases, this may
be the best indication that discrimination is taking place. Since a new formula is unlikely to be
established, however, it seems like the public might be the best bet for keeping discrimination in
check, at least for the time being. Public education about voting rights and requirements and the
effects of things like voter ID laws seems like a crucial part of the solution. Groups like the
NAACP are already speaking up about these laws, but it is important for all American voters to
understand what effect these laws have. We are not only talking about presidential elections, but
state and local elections as well. The reason why preclearance could be applied to jurisdictions as
well as entire states was to protect the right to vote for smaller, yet still crucially important

40
matters like property taxes and school budgets in addition to the election of the president and
congressional representatives. We may not always think about these types of voting situations,
but they have just as much, if not more of an impact on the lives of all Americans. It seems that
we should be doing all that we can to make sure that everyone has a voice in such important
decisions. The voting rights of minorities are the matter of concern right now, but if political
parties make a habit of silencing opposing voices by taking their voting rights away, then any
one of us could someday be in the same position that blacks and Hispanics find themselves in
today. That thought alone should be enough to make anyone pay attention and fight against
voting discrimination.

41
Appendix
Figure 1: Preclearance in 19651
Map and Table Key
Full state covered
Full state covered 1965-2013
Jurisdictions covered
Once had jurisdictions covered, but fully bailed out by 2013
State not covered. On the final map, these are the states that were never subject to preclearance
Jurisdictions covered 1965-2013
/ Jurisdictions or state added to preclearance this year
1 All map data is from the US Department of Justice website
ID
AZ
AK
HI
WA
OR
CA
NV
MT
UT
WY
CO
NM
ND
SD
NE
KS
OK
TX
MI
IA
MO
AK
LA
WI
IL
MI
IN
KY
TN
MS AL GA
FL
SC
NC
VA WV
OH PA
NY
ME
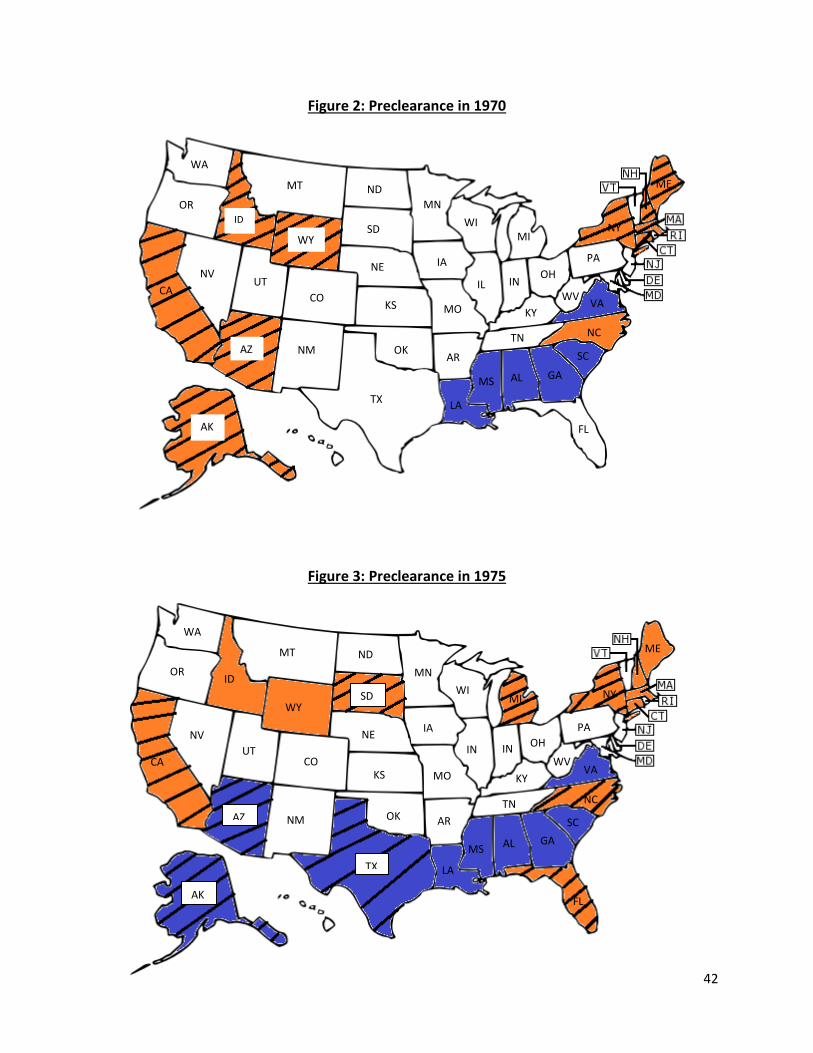
42
Figure 2: Preclearance in 1970
Figure 3: Preclearance in 1975
WA
OR
CA
ID
NV
MT
UT
WY
AZ
AK
CO
NM
ND
SD
NE
KS
OK
TX
MN
IA
MO
AR
LA
WI
IL
MI
IN OH
KY
TN
MS AL GA
FL
SC
NC
VA WV
PA
NY
ME
WA
OR
CA
ID
NV
AZ
UT
MT
WY
CO
NM
AK
ND
SD
NE
KS
OK
TX
MN
IA
MO
AR
LA
WI
IN
MI
IN
KY
TN
MS AL GA
FL
SC
NC
VA WV
OH
PA
NY
ME

43
Figure 4: Preclearance as of 2013
Figure 5: A Visual History of Preclearance
WA
OR
CA
ID
NV UT
AZ
MT
CO
WY
NM
AK
HI
ND
SD
NE
KS
OK
TX
WI
MN
IA
MO
AK
LA
IL
MI
IN
KY
TN
MS AL
OH
GA
FL
SC
NC WV
PA
NY
ME
WA
OR
CA
ID
NV UT
AZ
MT
WY
CO
NM
ND
SD
NE
KS
OK
TX
AK
HI
MN
IA
MO
AR
LA
WI
IL
MI
IN OH
KY
TN
MS
FL
AL GA
SC
NC
VA WV
PA
NY
ME

44
Table 1: State Voter ID Laws2
State Law Type State Law Type
AL Strict Photo* MT Non-Strict Non-Photo
AK Non-Strict Non-Photo NE None
AZ Strict Non-Photo NV None
AR Strict Photo* NH Photo
CA None NJ None
CO Non-Strict Non-Photo NM None
CT Non-Strict Non-Photo NY None
DE Non-Strict Non-Photo NC Strict Photo*
FL Photo ND Non-Strict Non-Photo
GA Strict Photo OH Strict Non-Photo
HI Photo OK Non-Strict Non-Photo
ID Photo OR None
IL None PA Strict Photo*
IN Strict Photo RI Non-Strict Non-Photo
IA None SC Strict Photo*
KS Strict Photo SD Photo
KY Non-Strict Non-Photo TN Strict Photo
LA Photo TX Strict Photo*
ME None UT Non-Strict Non-Photo
MD None VT None
MA None VA Strict Photo*
MI Photo WA Non-Strict Non-Photo
MN None WV None
MS Strict Photo* WI Strict Photo*
MO Non-Strict Non-Photo WY None *These laws were not yet in effect during the last election Definitions from the National Conference of State Legislatures: Strict vs. Non-Strict: In the "strict" states, a voter cannot cast a valid ballot without first presenting ID. Voters who are unable to show ID at the polls are given a provisional ballot. Those provisional ballots are kept separate from the regular ballots. If the voter returns to election officials within a short period of time after the election (generally a few days) and presents acceptable ID, the provisional ballot is counted. If the voter does not come back to show ID, that provisional ballot is never counted. Photo vs. Non-Photo: Some states require that the ID presented at the polls must show a photo of the voter. Some of these are "strict" voter ID laws, in that voters who fail to show photo ID are given a provisional ballot and must eventually show photo ID in order to get that provisional ballot counted. Others are "non-strict," and voters without ID have other options for casting a regular ballot. They may be permitted to sign an affidavit of identity, or poll workers may be able to vouch for them if they know them personally. In these "non-strict" states, voters who fail to bring ID on Election Day aren't required to return to election officials and show ID in order to have their ballot counted. In the other voter ID states, there is a wide array of IDs that are acceptable for voting purposes, some of which do not include a photo of the voter. Again, some of these states are "strict" in the sense that a voter who fails to bring ID on Election Day will be required to vote a provisional ballot, and that provisional ballot will be counted only if the voter returns to election officials within a few days to show acceptable ID.
2 Information from the National Conference of State Legislatures, http://www.pbs.org/wgbh/pages/frontline/government-elections-politics/with-voting-rights-act-out-states-push-voter-id-laws/, http://www.huffingtonpost.com/2013/04/01/arkansas-voter-id-bil_n_2994119.html, http://blog.al.com/wire/2013/06/alabama_photo_voter_id_law_to.html

45
Table 2: State Party Choice in Presidential Elections3
AK CT ID ME MS SC TN TX VT WA National
1964 D D D D R R D D D D D
1968 R D R D O R R D R D R
1972 R R R R R R R R R R R
1976 R R R R D D D D R R D
1980 R R R R R R R R R R R
1984 R R R R R R R R R R R
1988 R R R R R R R R R D R
1992 R D R D R R D R D D D
1996 R D R D R R D R D D D
2000 R D R D R R R R D D R
2004 R D R D R R R R D D R
2008 R D R D R R R R D D D
2012 R D R D R R R R D D D
Total R (12/1)
D (8/5)
R (12/1)
D (8/5)
R (11/1/1)
R (12/1)
R (9/4)
R (10/3)
D (7/6)
D (9/4)
R (7/6)
D=Democrat, R=Republican, O=Other
Table 3: Party Control of State Governments (Legislature, Governor)4
2000 2002 2004 2006 2008 2010 2012
Leg Gov Leg Gov Leg Gov Leg Gov Leg Gov Leg Gov Leg Gov
AK R D R R R R R R R/T R T/R R R R
CT D R D R D R D R D R D D D D
ID R R R R R R R R R R R R R R
ME S I D D D D D D D D R R D R
MS D D D D D R D R D R D R R R
SC R D R R R R R R R R R R R R
TN D R D D S D S D R/T D R R R R
TX S R R R R R R R R R R R R R
VT S D S R D R D R D R D D D D
WA D/T D S D D D D D D D D D D D
D=Democrat, R=Republican, I=Independent, T=Tied, S=Split
3 Information collected from uselectionatlas.org 4 Information from polidata.org

46
Table 4: Percentage of State Population By Race (White, Black, Hispanic)5
1960 1970 1980 1990 2000 2010
W6 B H7 W B H W B H W B H W B H W B H
AK 77.2 3.0 NA 78.8 3.0 NA 75.8 3.4 2.4 73.9 4.1 3.2 67.6 3.4 4.1 66.7 3.3 5.5
CT 95.6 4.2 NA 93.5 6.0 NA 88.0 7.0 4.0 83.8 8.3 6.5 77.5 8.7 9.4 77.6 10.2 13.4
ID 98.5 0.2 NA 98.1 0.3 NA 93.9 0.3 3.9 92.2 0.3 5.3 88.1 0.4 7.9 89.1 0.6 11.2
ME 99.4 0.3 NA 99.3 0.3 NA 98.3 0.3 0.4 98.0 0.4 0.6 96.5 0.5 0.7 95.2 1.2 1.3
MS 57.7 42.0 NA 62.8 36.8 NA 63.6 35.2 1.0 63.1 35.6 0.6 60.7 36.2 1.4 59.1 37.0 2.7
SC 65.1 34.8 NA 69.3 30.5 NA 68.3 30.4 1.1 68.5 29.8 0.9 66.1 29.4 2.4 66.2 27.9 5.1
TN 83.5 16.5 NA 83.9 15.8 NA 83.1 15.8 0.7 82.6 16.0 0.7 79.2 16.3 2.2 77.6 16.7 4.6
TX 87.4 12.4 NA 86.8 12.5 NA 65.7 12.0 21.0 60.6 11.9 25.5 52.4 11.3 31.2 70.4 11.8 37.6
VT 99.8 0.1 NA 99.6 0.2 NA 98.5 0.2 0.6 98.1 0.3 0.7 96.2 0.5 0.9 95.3 1.0 1.5
WA 96.4 1.7 NA 95.4 2.1 NA 90.2 2.6 2.9 86.7 3.1 4.4 78.9 3.1 7.5 77.3 3.6 11.2
US 88.6 10.5 NA 87.5 11.7 NA 79.6 11.7 6.4 75.6 12.1 9.0 69.1 12.1 12.6 63.7 12.6 16.3
Table 5: Voter Turnout Rates (Percentage of Total Voters) by Race8
2004 2008 20129
White Black Hispanic White Black Hispanic White Black Hispanic
AK 83 4 3 78 3 6 NA NA NA
CT 86 6 7 78 12 8 79 11 6
ID 93 1 4 90 1 6 NA NA NA
ME 97 1 1 96 1 1 96 1 1
MS 65 34 0 62 33 4 59 36 3
TN 84 13 1 84 12 2 NA NA NA
TX 66 12 20 63 13 20 NA NA NA
SC 67 30 1 71 25 3 NA NA NA
VT 97 1 1 95 1 1 95 1 2
WA 88 2 5 83 4 7 76 3 10
US 77 11 8 74 13 9 72 13 10
5 All data according to the US Census Bureau 6 White (Non-Hispanic Origin) for 1980 onward. The 1960 and 1970 percentages have no specification about Hispanic Origin. 7 Hispanic Origin is a separate question from race and may include individuals who do identify as other races as well. This information was not collected prior to 1980. 8 Information collected from CNN and NBC exit polls 9 According to the New York Times, the National Election Pool decided in 2012 to reduce the number of states in which it conducted election polls. Unfortunately, several of the states in this study were cut.

47
Table 6: NAACP Racial Growth Statistics
Race
(% of 2010
population)
Rate of Growth, 2000-2010 Absolute Growth, 2000-2010
(in thousands)
National
Growth Rate
Top States by Growth Rate Total Growth
Nationally
Top States by
Absolute Growth
Latino
(16.3%)
43.0% South Carolina (148%)
Alabama (145%)
Tennessee (134%)
Kentucky (122%)
Arkansas (114%)
15,172 California (3,047)
Texas (2,791)
Florida (1,541)
Arizona (600)
New York (550)
African-American
(12.6%)
12.3% Maine (132%)
South Dakota (118%)
Vermont (105%)
North Dakota (103%)
Idaho (80%)
4,271 Florida (664)
Georgia (601)
Texas (575)
North Carolina
(300)
Maryland (225)
Asian
(4.8%)
43.3% Nevada (117%)
North Dakota (92%)
Arizona (92%)
4,431 California (1,163)
Texas (402)
New York (375)
Two or More races
(2.9%)
32.0% South Carolina (100%)
North Carolina (100%)
Delaware (83%)
2,183 California (208)
Texas (164)
North Carolina
(103)
Non-Hispanic White
(63.7%)
1.2% 2,265
Data Source: U.S. Census Bureau, 2000 Census and 2010 Census
Source: NAACP report
Table 7: US Census Bureau Population Projections by Race (Percentages)10
2020 2040 2060
Non-Hispanic White 59.69 51.02 42.58
Black 12.51 12.83 13.16
Hispanic 19.10 24.97 30.64
10 Projection from the US Census Bureau website

48
Table 8: The Indicators of Strict Voter ID Laws
State Voter ID Law
Type
Does the state
usually vote for
Republican
presidential
candidates?
Has the state
government been
largely controlled
by Republicans?
How does the
white to minority
ratio of the state
population
compare to the
national ratio?
How does the
white to minority
ratio of the state
voter turnout
compare to the
national ratio?
Alaska Non-Strict Non-
Photo
Yes Yes Similar Similar
Connecticut Non-Strict Non-
Photo
No No Similar Similar
Idaho Photo Yes Yes Higher Higher
Maine None No No Higher Higher
Mississippi Strict Photo Yes Yes Lower Lower
South Carolina Strict Photo Yes Yes Lower Lower
Tennessee Strict Photo Yes Yes Similar Similar
Texas Strict Photo Yes Yes Lower Lower
Vermont None No No Higher Higher
Washington Non-Strict Non-
Photo
No No Similar Similar

49
Bibliography
“A Rejection of Discrimination: Editorial.” New York Times, March 12, 2012.
http://www.nytimes.com/2012/03/13/opinion/a-rejection-of-discrimination.html?_r=0
(September 13, 2013).
Bensen, Clark H. 2013. “Party Control Project.” February 7. http://www.polidata.org/party/.
(October 1, 2013).
Census Scope. 2000. “Population by Race.” http://www.censusscope.org/us/chart_race.html.
(October 5, 2013).
Childress, Sarah. 2012. “’Unprecedented’ Number of Restrictive Voting Laws Being
Introduced.” May 31. http://www.pbs.org/wgbh/pages/frontline/government-elections-
politics/unprecedented-number-of-restrictive-voting-laws-being-introduced/. (October 1,
2013).
Childress, Sarah. 2013. “With Voting Rights Act Out, States Push Voter ID Laws.” June 26.
http://www.pbs.org/wgbh/pages/frontline/government-elections-politics/with-voting-
rights-act-out-states-push-voter-id-laws/. (October 1, 2013).
Clarke, Kristen. 2007. “Burdening the Right to Vote: Assessing the Impact of Mandatory Photo
Identification Requirements on Minority Voting Strength.” Harvard Journal of African
American Public Policy. 13: 9-16.
CNN. 2004. “Election Results: America Votes 2004.” http://www.cnn.com/ELECTION/2004/
pages/results/states/US/P/00/epolls.0.html. (October 9, 2013).
CNN Politics. 2008. “Election Center 2008.” http://www.cnn.com/ELECTION/2008/results/
polls/#val=USP00p1. (October 9, 2013).

50
CNN Politics. 2012. “Election Center.” http://www.cnn.com/ELECTION/2012/. (October 1,
2013).
Coleman, Kevin J., Eric A. Fischer, and L. Paige Whitaker. 2012. “Photo ID Requirements for
Voting: Background and Legal Issues.” Congressional Research Service.
http://www.fas.org/sgp/crs/misc/R42806.pdf. (September 13, 2013).
Connelly, Marjorie. 2012. “Election Exit Polls Are Eliminated in 19 States.” New York Times,
October 4. http://thecaucus.blogs.nytimes.com/2012/10/04/election-exit-polls-are-
eliminated-in-19-states/?_r=2. (October 5, 2013).
Cornish, Audie. 2013. “Election Laws Likely To Change Without Voting Rights Act.” All
Things Considered (NPR), June 28. Newspaper Source (September 13, 2013).
de Alth, Shelley. 2009. “ID at the Polls: Assessing the Impact of Recent State Voter ID Laws on
Voter Turnout.” Harvard Law & Policy Review. 3(1): 185-202.
Devlin, Barrett. 2013. “U.S. Aims To Reassert Federal Voting Oversight.” Washington Post,
July 26. Business Source Index (September 13, 2013).
Donahue, Meghann E. 2004. “The Reports of My Death Are Greatly Exaggerated:
Administering Section 5 of the Voting Rights Act after Georgia v. Ashcroft.” Columbia
Law Review. 104(6): 1651-1685.
Duda, Jeremy. 2013. “GOP Attorney in Arizona IRC Case Says Voting Rights Act Ruling
Should Be Retroactive.” Arizona Capitol Times, July 22.
http://azcapitoltimes.com/news/2013/07/22/gop-attorney-in-irc-case-says-voting-rights-
act-ruling-should-be-retroactive/. (September 13, 2013).
Faircloth, Francis E. 2012. “The Future of the Voting Rights Act: Lessons from the History of
School (Re-) Segregation.” The Yale Law Journal. 121 (999): 999-1012.

51
Fessler, Pam and Robert Siegel. 2011. “Justice Department Blocks New S.C. Voting ID Law.”
All Things Considered (NPR), December 23. Newspaper Source (September 13, 2013).
Fox News. 2012. “2012 Fox News Exit Polls.” http://www.foxnews.com/politics/elections/2012-
exit-poll/WA/President. (October 1, 2013).
Gibson, Campbell and Kay Jung. 2002. “Historical Census Statistics on Population Totals By
Race, 1790 to 1990, and By Hispanic Origin, 1970 to 1990, For The United States,
Regions, Divisions, and States.” September. http://www.census.gov/population/www
/documentation/twps0056/twps0056.html. (October 7, 2013).
Janes, Jared. 2013. “Outreach Group Eyes Voter ID After Supreme Court Ruling.” The Monitor
(Texas), July 7. http://www.themonitor.com/news/local/article_60a47d54-e695-11e2-
a937-0019bb30f31a.html. (September 13, 2013).
Leip, Dave. 2012. “United States Presidential Election Results.” http://uselectionatlas.org/
RESULTS/index.html. (October 4, 2013).
Minnite, Lorraine C. 2003. “An Analysis of Voter Fraud in the United States.” Demos.
http://www.demos.org/sites/default/files/publications/Analysis.pdf. (October 30, 2013).
“Mississippi: ID Law Signed, but Remains In Limbo.” New York Times, May 18, 2012.
http://www.nytimes.com/2012/05/18/us/mississippi-id-law-signed-but-remains-in-
limbo.html. (Septmeber 13, 2013).
NAACP. 2011. “Defending Democracy: Confronting Modern Barriers to Voting Rights in
America.” http://www.naacp.org/pages/defending-democracy (September 13, 2013).
National Conference of State Legislatures. 2013. http://www.ncsl.org/. (October 15, 2013).
NBC News. 2004. “Exit Poll: Decision 2004.” http://www.nbcnews.com/id/5297144. (October 9,
2013).

52
Pew Research Center for the People and the Press. 2012. “Broad Support for Photo ID Voting
Requirements.” http://www.people-press.org/2012/10/11/broad-support-for-photo-id-
voting-requirements/. (October 12, 2013).
Pilkington, Ed. 2013. “North Carolina Governor Vows to Fight Justice Department Voter ID
Lawsuit.” The Guardian, October 1. http://www.theguardian.com/world/2013/oct
/01/north-carolina-voting-bill-discrimination. (October 10, 2013).
Rodriguez, Victor Andres. 2003. “Section 5 of the Voting Rights Act of 1965 After Boerne: The
Beginning of the End of Preclearance.” California Law Review. 91(3): 769-825.
Rush, Mark E. 1995. “From Shaw v. Reno to Miller v. Johnson: Minority Representation and
State Compliance with the Voting Rights Act.” Oxford University Press. 25(3):155-172.
Shelby County, Alabama v. Holder, Attorney General, et al. 2013. 570 U.S. 12-96.
The US Department of Justice. 2013. “Voting.” http://www.justice.gov/crt/about/vot/. (October
5, 2013).
United States Census Bureau. 2010. “2010 Census Interactive Population Search.” http://www.
census.gov/2010census/popmap/ipmtext.php?fl=02. (October 1, 2013).
United States Census Bureau. 2012. “2012 National Population Projections: Summary Tables.”
http://www.census.gov/population/projections/data/national/2012/summarytables.html.
(October 13, 2013).
Voting Rights Act. 1965. Ourdocuments.
Voting Rights Institute. 2011. “The Real Cost Of Photo ID: An Unnecessary, Expensive, And
Intrusive Voter Restriction In A Time Of Fiscal Crisis.”http://assets.democrats.org/pdfs
/photoid/Dems-report-real_cost_of_voting_ID.pdf (17 November 2013).
“Voter ID Card Law in Georgia Ruled Illegal.” 2006. Jet. 110 (4): 14.