amadeus 2018 results...amadeus altéa departure control system and amadeus baggage reconciliation...
TRANSCRIPT

Amadeus 2018 Results
February 28, 2019
© 2
018
Am
adeu
s IT
Ho
ldin
g an
d it
s af
filia
tes
and
su
bsi
dia
rie
s

_ This presentation may contain certain statements which are not purely historical facts, including statements about anticipated orexpected future revenue and earnings growth. Any forward-looking statements in this presentation are based upon informationavailable to Amadeus on the date of this presentation. Any forward-looking statements involve risks and uncertainties that couldcause actual events or results to differ materially from the events or results described in the forward-looking statements. Amadeusundertakes no obligation to publicly update or revise any forward-looking statements, whether as a result of new information, futureevents or otherwise. Readers are cautioned not to place undue reliance on forward-looking statements.
_ This presentation has to be accompanied by a verbal explanation. A simple reading of this presentation without the appropriateverbal explanation could give rise to a partial or incorrect understanding.
2
Disclaimer
Operating review
© 2
018
Am
adeu
s IT
Gro
up
an
d it
s af
filia
tes
and
su
bsi
dia
rie
s

© 2
018
Am
adeu
s IT
Gro
up
an
d it
s af
filia
tes
and
su
bsi
dia
rie
s
Operating Review
Luis MarotoPresident & CEO

4
© 2
018
Am
adeu
s IT
Gro
up
an
d it
s af
filia
tes
and
su
bsi
dia
rie
s
2018 - Profitable growth
1. Including TravelClick’s 2018 consolidation effect of: Revenue, EBITDA and Adjusted Profit contributions of €86.7m, €22.3m and €14.3m, respectively, while excluding TravelClick’s related acquisition transaction costs, PPA adjustment and bank acquisition financing interest expense. For full details on TravelClick’s acquistion and impacts, see section 3.2 of 2018 Management Review. Also, compared to 2017 figures restated for IFRS 15 and IFRS 9, applied from January 1, 2018. See section 3.1 of 2018 Management Review for further details. In addition, we are early adopters of IFRS 16, which we applied since January 1, 2018. 2017 figures are not restated for IFRS 16. In 2018, IFRS 16 had a positive €47.4 million impact on EBITDA. See section 3.1 of 2018 Management Review for further details.
2. Defined as EBITDA, minus capex, plus changes in our operating working capital, minus taxes paid, minus interests and financial fees paid. Including TravelClick’s 2018 Free Cash Flow contribution of €14.8m, while excluding TravelClick’s related acquisition transaction costs paid and TravelClick’s acquisition financing interest paid and related non-recurring fees. For full details on TravelClick’s acquistion and impacts, please see section 3.2 of 2018 Management Review.
_ Revenue +6.6%1(Exc. FX: high single-digit growth %)
• Negative FX impact
_ EBITDA +9.7%1(Exc. FX & IFRS161: high single-digit growth %)
• Negative FX impact on EBITDA
• Positive FX and IFRS 161 impact on costs
• Exc. FX and IFRS 161: broadly stable margin
_ Adjusted profit1 +1.0%• 6.0% growth excluding positive non-recurring deferred tax
liability adjustments in 2017
_ Free Cash Flow2 +7.8%
_ Leverage 1.47x
989
2,041
4,944
1,123In
€m
illion
s
RevenueEBITDA
Adj. profitFree CF
20181
5
Recent business highlights
© 2
018
Am
adeu
s IT
Gro
up
an
d it
s af
filia
tes
and
su
bsi
dia
rie
s
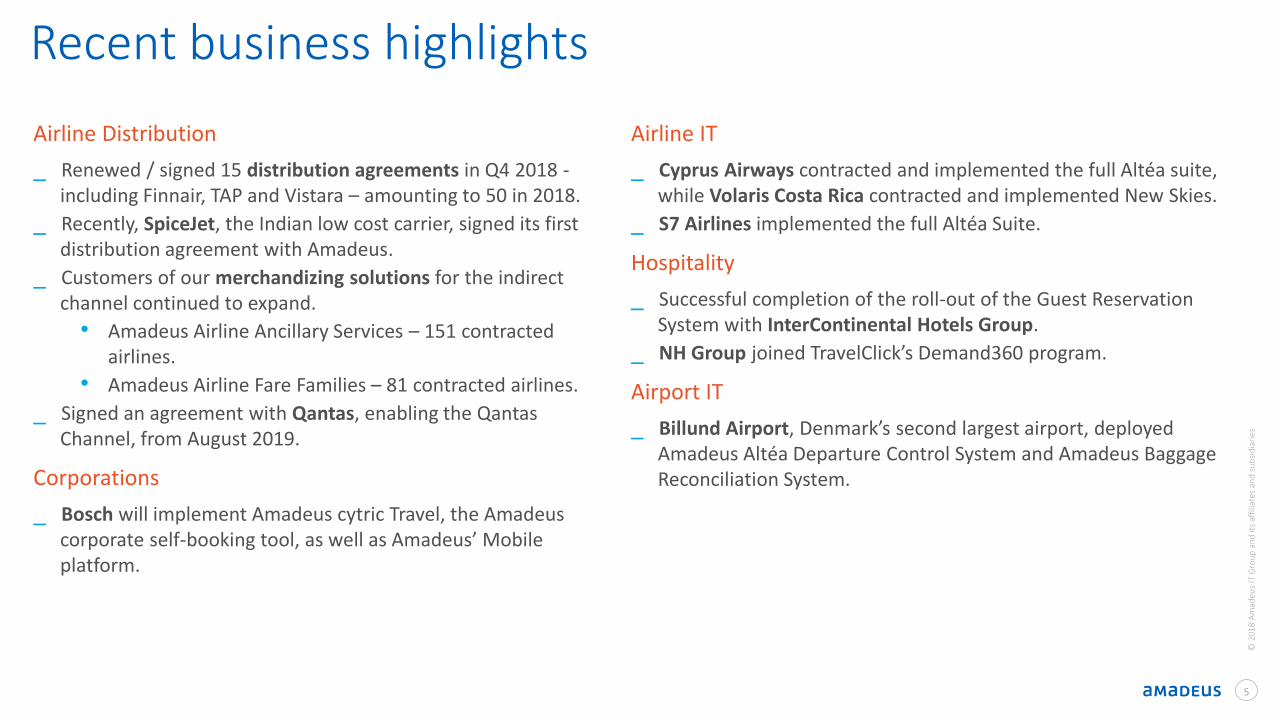
Airline Distribution
_ Renewed / signed 15 distribution agreements in Q4 2018 -including Finnair, TAP and Vistara – amounting to 50 in 2018.
_ Recently, SpiceJet, the Indian low cost carrier, signed its first distribution agreement with Amadeus.
_ Customers of our merchandizing solutions for the indirect channel continued to expand.
• Amadeus Airline Ancillary Services – 151 contracted airlines.
• Amadeus Airline Fare Families – 81 contracted airlines.
_ Signed an agreement with Qantas, enabling the Qantas Channel, from August 2019.
Corporations
_ Bosch will implement Amadeus cytric Travel, the Amadeus corporate self-booking tool, as well as Amadeus’ Mobile platform.
Airline IT
_ Cyprus Airways contracted and implemented the full Altéa suite, while Volaris Costa Rica contracted and implemented New Skies.
_ S7 Airlines implemented the full Altéa Suite.
Hospitality
_ Successful completion of the roll-out of the Guest Reservation System with InterContinental Hotels Group.
_ NH Group joined TravelClick’s Demand360 program.
Airport IT
_ Billund Airport, Denmark’s second largest airport, deployed Amadeus Altéa Departure Control System and Amadeus Baggage Reconciliation System.

6
© 2
016
Am
adeu
s IT
Ho
ldin
g a
nd
its
affi
liate
s an
d s
ub
sid
iari
es
1. When we refer to our competitive position, we take into account our travel agency air bookings in relation to the travel agency air booking industry, defined as the total volume of travel agency air bookings processed by the three major global reservation systems (Amadeus, Sabre and Travelport). It excludes air bookings made directly through airlines’ direct distribution channels (airline offices and websites), single country operators (primarily in China, Japan, Russia and Turkey), other content aggregators and direct connect applications between airline systems, travel agencies, corporations and meta-bookers, which together combined represent an important part of the industry.
568.4 580.2
64.0 63.0
2017 2018Air bookings Non air bookings
Vo
lum
e gr
ow
th (%
)
WE = Western Europe; APAC = Asia Pacific; NA = North America (incl. Mexico); MEA =
Middle East and Africa; CESE = Central, Eastern and Southern Europe; LatAm = Latin
America
4.5%2.9%
2017 2018
Distribution
TA air booking industry growth1
Amadeus TA air bookings by region
Competitive position1
WE,
33.0%
APAC,
20.9%
NA,
18.6%
MEA,
12.4%
CESE,
8.4%
LatAm,
6.6%WE (7.0%)
APAC +11.7%
NA +9.3%
MEA +3.8%
CESE +1.8%
LatAm +2.2%
Amadeus TA bookings (millions)
Weigh
t (%)
+2.1%
+1.7% 643.2632.3
6
© 2
018
Am
adeu
s IT
Gro
up
an
d it
s af
filia
tes
and
su
bsi
dia
rie
s
43.9% 43.7%
2017 2018
Ex-WE: +7.2%
2018
Ex-WE: +1.1p.p.

777
© 2
018
Am
adeu
s IT
Gro
up
an
d it
s af
filia
tes
and
su
bsi
dia
rie
s
WE = Western Europe; APAC = Asia Pacific; NA = North America (incl. Mexico); MEA =
Middle East and Africa; CESE = Central, Eastern and Southern Europe; LatAm = Latin
America
IT SolutionsAmadeus PB1 by region
WE +2.1%
APAC +18.2%
NA +39.9%
LatAm (6.9%)
MEA +8.6%
CESE +24.4%
WE,
33.7%
APAC,
32.1%
NA,
13.3%
LatAm,
7.5%
CESE,
6.0%MEA,
7.5%
Passengers Boarded1 (millions)
1,442.51,552.7
213.9301.2
2017 2018Non organicOrganic
Vo
lum
e gr
ow
th (%
)
Weigh
t (%)
_ At the end of 2018, 2143 customers had contracted for Altéa or New Skies, of which 204 had been migrated
_ 11.9% PB growth driven by:
• 7.6%2 organic growth
• Full-year effect from the 2017 migrations (including Southwest Airlines, Japan Airlines, Malaysia Airlines, Kuwait Airways, Boliviana de Aviación, SmartWings, Norwegian Air Argentina, Air Algerie and MIAT Mongolian Airlines on Altéa, as well as, GoAir, Viva Air Perú, Andes Líneas Aéreas, JetSMART and flyadeal on New Skies) and the 2018 migrations (including S7 Airlines, Maldivian Airlines, Cyprus Airways and Aeromar on Altéa, and Volaris Costa Rica on New Skies)
• Ceasing of operations of Air Berlin and Monarch Airlines in 2017
• De-migration of LATAM Airlines Brazil from our platform during the second quarter of 20181. Passengers Boarded (“PB”) refers to actual passengers boarded onto flights operated by our Altéa and New Skies migrated customers. 2. Calculated based on passengers boarded adjusted to reflect growth of comparable airlines on the Altéa and New Skies platforms during both periods. 3. Customers that have contracted at least the Altéa Inventory module, in addition to the Reservations module, or Navitaire’s New Skies solution.
1,656.5
+7.6%2
1,853.9
7
+11.9% 2018

© 2
018
Am
adeu
s IT
Gro
up
an
d it
s af
filia
tes
and
su
bsi
dia
rie
s
Financial highlights
Ana de Pro CFO
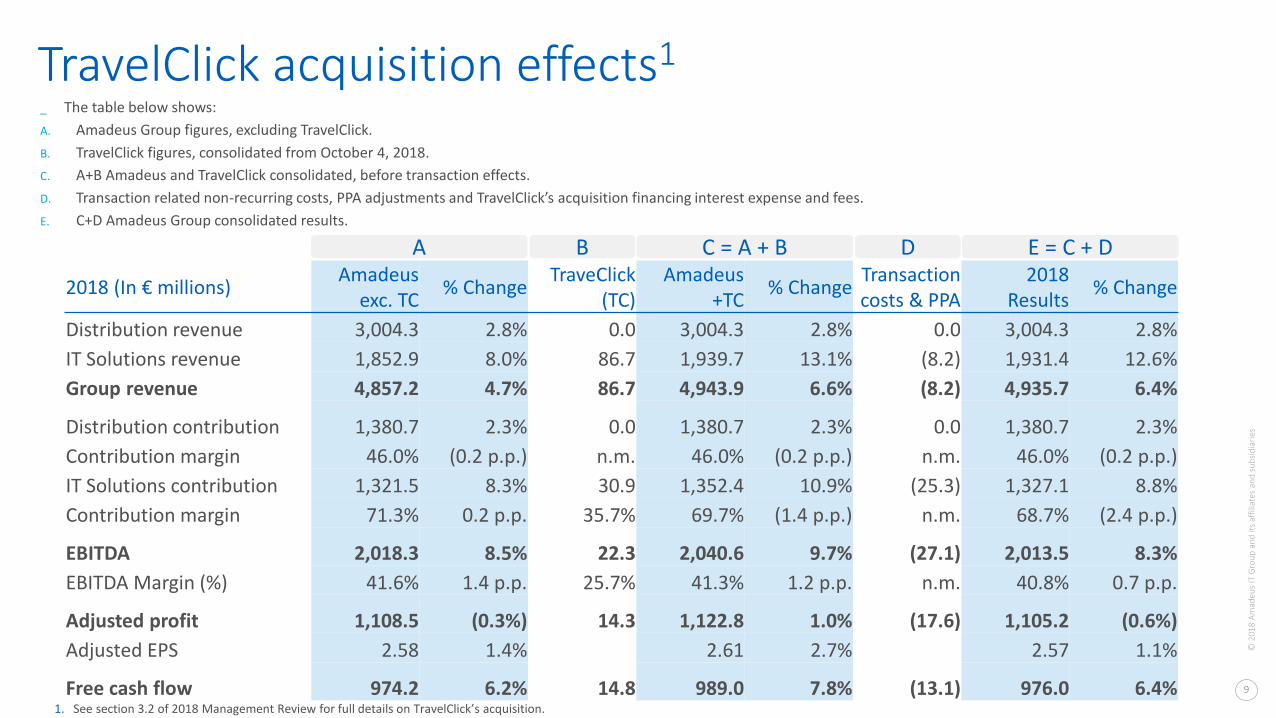
_ The table below shows:
A. Amadeus Group figures, excluding TravelClick.
B. TravelClick figures, consolidated from October 4, 2018.
C. A+B Amadeus and TravelClick consolidated, before transaction effects.
D. Transaction related non-recurring costs, PPA adjustments and TravelClick’s acquisition financing interest expense and fees.
E. C+D Amadeus Group consolidated results.
9
© 2
018
Am
adeu
s IT
Gro
up
an
d it
s af
filia
tes
and
su
bsi
dia
rie
s
TravelClick acquisition effects1
2018 (In € millions)Amadeus
exc. TC% Change
TraveClick(TC)
Amadeus +TC
% ChangeTransaction costs & PPA
2018 Results
% Change
Distribution revenue 3,004.3 2.8% 0.0 3,004.3 2.8% 0.0 3,004.3 2.8%
IT Solutions revenue 1,852.9 8.0% 86.7 1,939.7 13.1% (8.2) 1,931.4 12.6%
Group revenue 4,857.2 4.7% 86.7 4,943.9 6.6% (8.2) 4,935.7 6.4%
Distribution contribution 1,380.7 2.3% 0.0 1,380.7 2.3% 0.0 1,380.7 2.3%
Contribution margin 46.0% (0.2 p.p.) n.m. 46.0% (0.2 p.p.) n.m. 46.0% (0.2 p.p.)
IT Solutions contribution 1,321.5 8.3% 30.9 1,352.4 10.9% (25.3) 1,327.1 8.8%
Contribution margin 71.3% 0.2 p.p. 35.7% 69.7% (1.4 p.p.) n.m. 68.7% (2.4 p.p.)
EBITDA 2,018.3 8.5% 22.3 2,040.6 9.7% (27.1) 2,013.5 8.3%
EBITDA Margin (%) 41.6% 1.4 p.p. 25.7% 41.3% 1.2 p.p. n.m. 40.8% 0.7 p.p.
Adjusted profit 1,108.5 (0.3%) 14.3 1,122.8 1.0% (17.6) 1,105.2 (0.6%)
Adjusted EPS 2.58 1.4% 2.61 2.7% 2.57 1.1%
Free cash flow 974.2 6.2% 14.8 989.0 7.8% (13.1) 976.0 6.4%1. See section 3.2 of 2018 Management Review for full details on TravelClick’s acquisition.
A C = A + B E = C + DB D

Revenue growth by segment1
101010
4,637.2 4,857.2
2017 2018
+4.7%
Group revenue (€ millions)
Distribution IT Solutions
Segment revenue (€ millions)
© 2
018
Am
adeu
s IT
Gro
up
an
d it
s af
filia
tes
and
su
bsi
dia
rie
s
_ Group revenue expanded by 4.7%, supported by the performances across our Distribution and IT Solutions segments. Per segment, Distribution revenue grew 2.8% and IT Solutions grew 8.0%. Exc. negative FX, Group revenue grew at a mid to high single-digit growth rate:
_ Distribution: exc. negative FX, revenue grew at a mid single-digit growth rate, resulting from volume growth and an expansive revenue per booking, driven by (i) booking mix (increasing weight of global bookings and declining weight of non-air bookings) and (ii) customer renegotiations.
_ IT Solutions: exc. negative FX, revenue grew at a low double-digit growth rate, driven by (i) PB volume expansion coupled with a dilutive airline IT unitary revenue from increasing weight of low-cost and hybrid carriers, and (ii) double-digit growth rate of our new businesses, supported by the positive performance of Hospitality IT (exc. TravelClick).
2,922.1 3,004.3
2017 2018
1,282.4 1,380.7
118.4 137.8 314.3 334.4
2017 2018IT transactional Direct Distribution Non transactional
+2.8% +8.0%
Exc. FX: mid to high
single-digit growth %
1,715.11,852.9
Exc. FX: mid single-digit growth %
Exc. FX: low double-digit
growth %
1. The figures in this slide are presented excluding TravelClick and related acquisition effects.

Contribution growth across segments1
111111
709.9 683.8
2017 2018
(3.7%)
Segment Contribution (€ millions)
Distribution +2.3% IT Solutions
_ Distribution: margin dilution driven by (i) a unitary distribution cost expansion, resulting from competitive pressure and country and customer mix, (ii) a net fixed cost decline and (iii) a positive FX impact. Exc. FX, margin dilution in line with past.
_ IT Solutions: margin expansion supported by positive FX. Exc. FX, broadly stable margin, resulting from (i) airline IT operating leverage, (ii) NBU expansion, and (iii) a higher capitalization ratio.
_ Indirect costs: decline driven by IFRS 16 adoption. Exc. IFRS 16, net indirect costs grew 2.9%, resulting from (i) R&D investment expansion in cross-area technology, and (ii) higher resources in corporate functions to support our overall business expansion, partly offset by (iv) a higher capitalization ratio and (v) a positive FX impact.
Net indirect costs (€ millions)
© 2
018
Am
adeu
s IT
Gro
up
an
d it
s af
filia
tes
and
su
bsi
dia
rie
s
+8.3%
1,350.1 1,380.7
46.2% 46.0%
0.10
0.20
0.30
0.40
0.50
0.60
800.0
810.0
820.0
830.0
840.0
850.0
860.0
870.0
880.0
890.0
900.0
910.0
920.0
930.0
940.0
950.0
960.0
970.0
980.0
990.0
1000.0
1010.0
1020.0
1030.0
1040.0
1050.0
1060.0
1070.0
1080.0
1090.0
1100.0
1110.0
1120.0
1130.0
1140.0
1150.0
1160.0
1170.0
1180.0
1190.0
1200.0
1210.0
1220.0
1230.0
1240.0
1250.0
1260.0
1270.0
1280.0
1290.0
1300.0
1310.0
1320.0
1330.0
1340.0
1350.0
1360.0
1370.0
1380.0
1390.0
2017 2018Contribution Cont. margin
1,219.71,321.5
71.1% 71.3%
0.65
0.70
600.0
610.0
620.0
630.0
640.0
650.0
660.0
670.0
680.0
690.0
700.0
710.0
720.0
730.0
740.0
750.0
760.0
770.0
780.0
790.0
800.0
810.0
820.0
830.0
840.0
850.0
860.0
870.0
880.0
890.0
900.0
910.0
920.0
930.0
940.0
950.0
960.0
970.0
980.0
990.0
1000.0
1010.0
1020.0
1030.0
1040.0
1050.0
1060.0
1070.0
1080.0
1090.0
1100.0
1110.0
1120.0
1130.0
1140.0
1150.0
1160.0
1170.0
1180.0
1190.0
1200.0
1210.0
1220.0
1230.0
1240.0
1250.0
1260.0
1270.0
1280.0
1290.0
1300.0
1310.0
1320.0
1330.0
1340.0
1350.0
2017 2018Contribution Cont. margin
1. The figures in this slide are presented excluding TravelClick and related acquisition effects.

EBITDA and Adjusted EPS growth1
121212
1,112.1 1,108.5
€2.54 €2.58
0.00
0.50
1.00
1.50
2.00
2.50
3.00
800.0
820.0
840.0
860.0
880.0
900.0
920.0
940.0
960.0
980.0
1000.0
1020.0
1040.0
1060.0
1080.0
1100.0
1120.0
1140.0
1160.0
1180.0
1200.0
2017 2018
Adjusted Profit Adjusted EPS
(0.3%)
1. The figures in this slide are presented excluding TravelClick and related acquisition effects.2. Excluding after-tax impact of the following items: (i) accounting effects derived from PPA exercises and impairment
losses, (ii) non-operating exchange gains (losses) and (iii) other non-recurring items.3. EPS corresponding to the Adjusted profit attributable to the parent company. Calculated based on weighted average
outstanding shares of the period.
12
_ Adjusted profit decrease as a result of :
_ EBITDA growth, coupled with lower financial expenses, offset by D&A growth and a significantly higher tax expense
_ 2017 tax rate was positively impacted by non-recurring effects, including adjustments to deferred tax liabilities in France and the U.S.
_ Exc. 2017 deferred tax liability adjustments, adjusted profit grew by 4.7%
+1.4%
_ EBITDA growth resulting from:
• Distribution and IT Solutions positive performance• Positive IFRS 16 impact and negative FX effect
_ Excluding FX and IFRS 16 impacts, EBITDA grew at a mid to high single-digit growth rate and EBITDA margin was broadly stable
12
© 2
018
Am
adeu
s IT
Gro
up
an
d it
s af
filia
tes
and
su
bsi
dia
rie
s
EBITDA (€ millions) Adj. Profit2 (€ millions) & Adj. EPS3 (€)
1,859.92,018.3
40.1% 41.6%
0.10
0.20
0.30
0.40
0.50
0.60
1200.0
1210.0
1220.0
1230.0
1240.0
1250.0
1260.0
1270.0
1280.0
1290.0
1300.0
1310.0
1320.0
1330.0
1340.0
1350.0
1360.0
1370.0
1380.0
1390.0
1400.0
1410.0
1420.0
1430.0
1440.0
1450.0
1460.0
1470.0
1480.0
1490.0
1500.0
1510.0
1520.0
1530.0
1540.0
1550.0
1560.0
1570.0
1580.0
1590.0
1600.0
1610.0
1620.0
1630.0
1640.0
1650.0
1660.0
1670.0
1680.0
1690.0
1700.0
1710.0
1720.0
1730.0
1740.0
1750.0
1760.0
1770.0
1780.0
1790.0
1800.0
1810.0
1820.0
1830.0
1840.0
1850.0
1860.0
1870.0
1880.0
1890.0
1900.0
1910.0
1920.0
1930.0
1940.0
1950.0
1960.0
1970.0
1980.0
1990.0
2000.0
2010.0
2020.0
2030.0
2017 2018
EBITDA EBITDA Margin
+8.5% Exc. FX and IFRS 16: mid
to high single-digit growth %
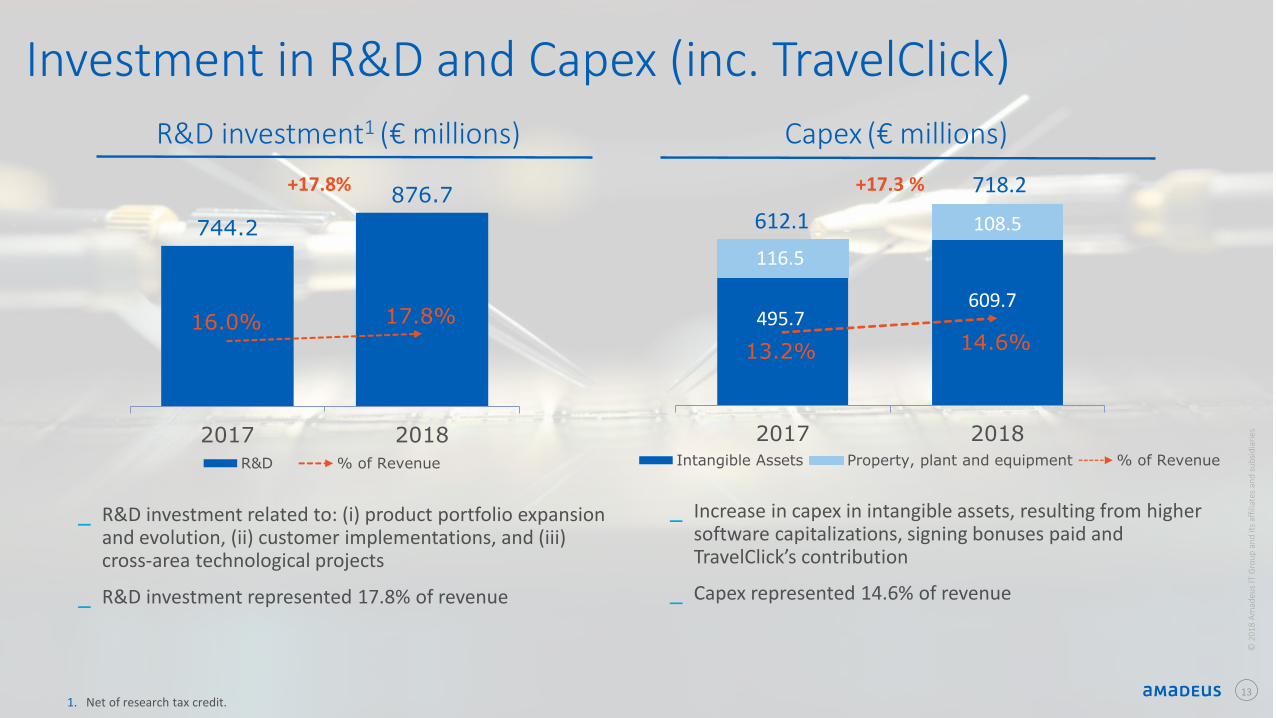
Investment in R&D and Capex (inc. TravelClick)
495.7609.7
116.5
108.5
13.2% 14.6%
2017 2018Intangible Assets Property, plant and equipment % of Revenue
744.2
876.7
16.0% 17.8%
2017 2018
R&D % of Revenue
+17.8% +17.3 %
1. Net of research tax credit.
_ R&D investment related to: (i) product portfolio expansion and evolution, (ii) customer implementations, and (iii) cross-area technological projects
_ R&D investment represented 17.8% of revenue
_ Increase in capex in intangible assets, resulting from higher software capitalizations, signing bonuses paid and TravelClick’s contribution
_ Capex represented 14.6% of revenue
Capex (€ millions) R&D investment1 (€ millions)
718.2
612.1
13
© 2
018
Am
adeu
s IT
Gro
up
an
d it
s af
filia
tes
and
su
bsi
dia
rie
s
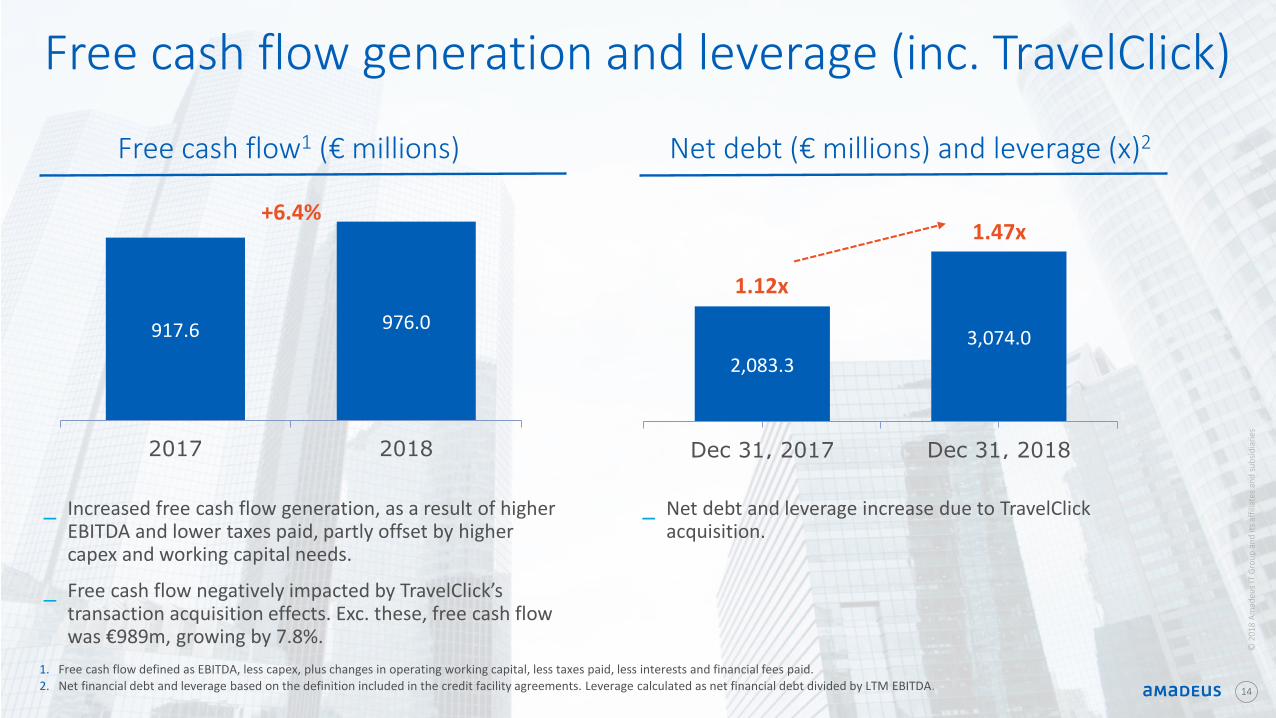
Free cash flow generation and leverage (inc. TravelClick)
917.6 976.0
2017 2018
2,083.3
3,074.0
Dec 31, 2017 Dec 31, 2018
1.47x
1.12x
+6.4%
Net debt (€ millions) and leverage (x)2
1. Free cash flow defined as EBITDA, less capex, plus changes in operating working capital, less taxes paid, less interests and financial fees paid.
2. Net financial debt and leverage based on the definition included in the credit facility agreements. Leverage calculated as net financial debt divided by LTM EBITDA. 14
_ Increased free cash flow generation, as a result of higher EBITDA and lower taxes paid, partly offset by higher capex and working capital needs.
_ Free cash flow negatively impacted by TravelClick’stransaction acquisition effects. Exc. these, free cash flow was €989m, growing by 7.8%.
_ Net debt and leverage increase due to TravelClickacquisition.
Free cash flow1 (€ millions)
© 2
018
Am
adeu
s IT
Gro
up
an
d it
s af
filia
tes
and
su
bsi
dia
rie
s

© 2
016
Am
adeu
s IT
Gro
up
an
d it
s af
filia
tes
and
su
bsi
dia
rie
s
2019 Outlook

_ Low double-digit growth rate
_ High single-digit to low double-digit growth rate
_ Capex: 12-15% of revenue_ Free cash flow generation: €950-1,025 million
2019 Outlook
Free cash flow1
EBITDA1
Revenue1
1. Including TravelClick contribution, while excluding TravelClick’s related acquisition costs and PPA adjustment.
Capital structure
_ 1.0 – 1.5x Net Debt / EBITDA
Shareholderremuneration
_ Ordinary dividend 50% pay-out ratio
16
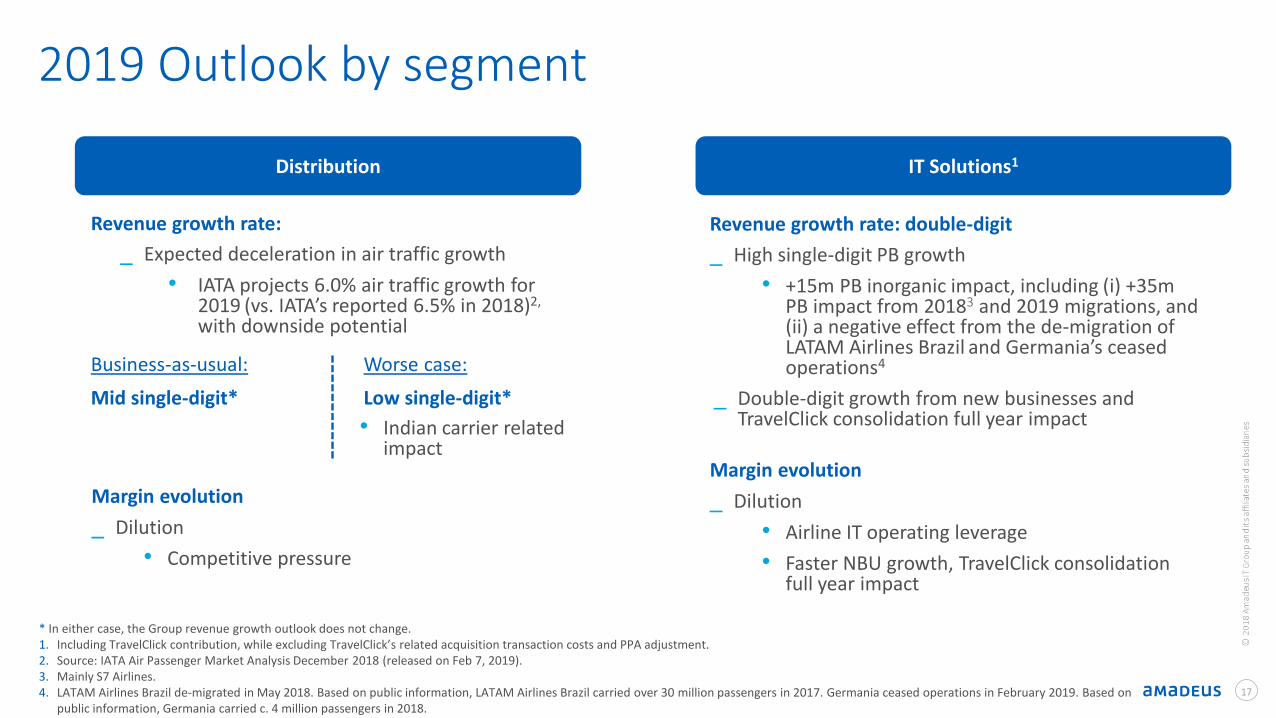
_ Expected deceleration in air traffic growth
• IATA projects 6.0% air traffic growth for 2019 (vs. IATA’s reported 6.5% in 2018)2,
with downside potential
Revenue growth rate: double-digit
_ High single-digit PB growth
• +15m PB inorganic impact, including (i) +35m PB impact from 20183 and 2019 migrations, and (ii) a negative effect from the de-migration of LATAM Airlines Brazil and Germania’s ceased operations4
_ Double-digit growth from new businesses and TravelClick consolidation full year impact
Margin evolution
_ Dilution
• Airline IT operating leverage
• Faster NBU growth, TravelClick consolidation full year impact
17
2019 Outlook by segment
Revenue growth rate:
* In either case, the Group revenue growth outlook does not change.1. Including TravelClick contribution, while excluding TravelClick’s related acquisition transaction costs and PPA adjustment.2. Source: IATA Air Passenger Market Analysis December 2018 (released on Feb 7, 2019).3. Mainly S7 Airlines.4. LATAM Airlines Brazil de-migrated in May 2018. Based on public information, LATAM Airlines Brazil carried over 30 million passengers in 2017. Germania ceased operations in February 2019. Based on
public information, Germania carried c. 4 million passengers in 2018.
Distribution IT Solutions1
• Indian carrier related impact
Margin evolution
_ Dilution
• Competitive pressure
Worse case:
Low single-digit*
Business-as-usual:
Mid single-digit*

18
Support materials
© 2
018
Am
adeu
s IT
Gro
up
an
d it
s af
filia
tes
and
su
bsi
dia
rie
s

19
134.0 135.3
16.4 16.2
Q4 2017 Q4 2018Air Bookings Non-air bookings
1. Passengers Boarded (“PB”) refers to actual passengers boarded onto flights operated by our Altéa and New Skies migrated airlines.2. Calculated based on passengers boarded adjusted to reflect growth of comparable airlines on the Altéa and New Skies platforms
during both periods
151.5+0.7%
+1.0%
150.4
Amadeus TA Air Bookings by regionAmadeus TA Bookings (in millions)
Passengers Boarded1 (in millions) Amadeus PB1 by region
Q4 Volumes
356.3 381.9
72.1 74.7
Q4 2017 Q4 2018Organic Non organic
428.4 456.6+6.6%
+7.2%2
Vo
lum
e gr
ow
th (%
)
WE = Western Europe; CESE = Central, Eastern and Southern Europe; MEA =
Middle East and Africa; LatAm = Latin America; NA = North America (incl. Mexico)
WE,
32.6%
APAC,
20.2%
NA,
18.6%
MEA,
12.6%
CESE,
8.9%
LatAm,
7.1%WE (7.9%)
APAC +3.2%
NA +12.6%
MEA +5.7%
CESE (1.1%)
LatAm 6.9%
Weigh
t (%)
Vo
lum
e gr
ow
th (%
)
WE = Western Europe; CESE = Central, Eastern and Southern Europe; MEA =
Middle East and Africa; LatAm = Latin America; NA = North America (incl. Mexico)
WE,
32.5%
APAC,
33.1%
NA,
13.9%
LatAm,
7.3%
MEA,
7.2%
CESE,
6.1%WE +4.9%
APAC +9.8%
NA +8.1%
LatAm (13.7%)
MEA +9.3%
CESE +25.4%
Weigh
t (%)
Ex-WE: +5.9%

Q4 revenue by segment1
202020
1,114.7 1,173.4
Q4 2017 Q4 2018
704.2 724.9
Q4 2017 Q4 2018
410.5 448.4
Q4 2017 Q4 2018
+5.3%
Group Revenue (in € millions)
Distribution+2.9%
IT Solutions+9.3%
Segment Revenue (in € millions)
_ Group revenue expanded by 5.3%, resulting from the positive evolution of Distribution and IT Solutions and a small positive FX impact.
_ Distribution: volume growth, coupled with an expansionary average revenue per booking (positive booking mix from higher weight of global bookings and lower weight of non-air bookings, as well as customer renegotiations).
_ IT Solutions: (i) airline IT growth, supported by volume expansion, and (ii) double-digit growth delivered by our new businesses.
© 2
018
Am
adeu
s IT
Gro
up
an
d it
s af
filia
tes
and
su
bsi
dia
rie
s
Exc. FX: mid single-
digit growth %
1. The figures in this slide are presented excluding TravelClick and related acquisition effects.
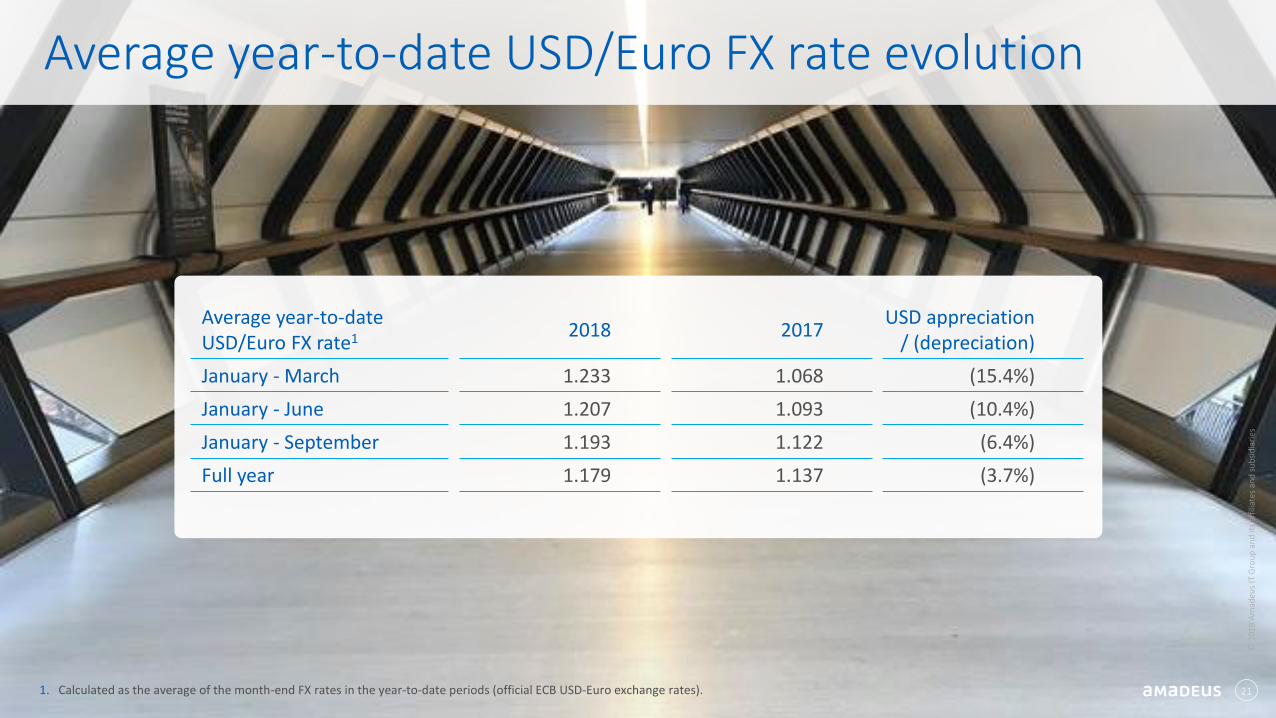
Average year-to-date USD/Euro FX rate1 2018 2017
USD appreciation / (depreciation)
January - March 1.233 1.068 (15.4%)
January - June 1.207 1.093 (10.4%)
January - September 1.193 1.122 (6.4%)
Full year 1.179 1.137 (3.7%)
Average year-to-date USD/Euro FX rate evolution
21
© 2
018
Am
adeu
s IT
Gro
up
an
d it
s af
filia
tes
and
su
bsi
dia
rie
s
1. Calculated as the average of the month-end FX rates in the year-to-date periods (official ECB USD-Euro exchange rates).

2018 2017 Change
Amadeus TA air bookings (m) 580.2 568.4 2.1%
Passengers Boarded (m) 1,853.9 1,656.5 11.9%
Revenue (€m) 4,943.9 4,637.2 6.6%
EBITDA (€m) 2,040.6 1,859.9 9.7%
Adjusted profit (€m) 1,122.8 1,112.1 1.0%
Adjusted EPS (€) 2.61 2.54 2.7%
Free Cash Flow (€m) 989.0 917.6 7.8%
Key Performance Indicators1
22
© 2
018
Am
adeu
s IT
Gro
up
an
d it
s af
filia
tes
and
su
bsi
dia
rie
s
1. Including TravelClick’s 2018 consolidation effect, while excluding TravelClick’s related acquisition transaction costs, PPA adjustment and bank acquisition financing effects. For full details on TravelClick’s acquistion and impacts, see section 3.2 of 2018 Management Review. Also, compared to 2017 figures restated for IFRS 15 and IFRS 9, applied from January 1, 2018. See section 3.1 of 2018 Management Review for further details. In addition, we are early adopters of IFRS 16, which we applied since January 1, 2018. 2017 figures are not restated for IFRS 16. In 2018, IFRS 16 had a positive €47.4 million impact on EBITDA. See section 3.1 of 2018 Management Review for further details.

Thank you!
You can follow us on:
AmadeusITgroupamadeus.comamadeus.com/blog
© 2
018
Am
adeu
s IT
Gro
up
an
d it
s af
filia
tes
and
su
bsi
dia
rie
s