amanda k. cecil
TRANSCRIPT

THE ROLE OF SMALL TOURISM BUSINESSES IN URBAN TOURISM
DEVELOPMENT: A CASE STUDY OF INDIANAPOLIS
Amanda K. Cecil
Dissertation submitted to the faculty of University Graduate School in partial fulfillment of the requirements
for the degree Doctor of Philosophy
in the School of Health, Physical Education, and Recreation Indiana University
January 2006
ii
Accepted by the Graduate Faculty, Indiana University, in partial fulfillment of the requirements for the degree of Doctor of Philosophy.
Doctoral Committee: ____________________________________ Craig Ross, Re.D., Chair ____________________________________ Sotiris Avgoustis, Ph.D. ____________________________________ Rafael E. Bahamonde, Ph.D. ____________________________________ Cem Basman, Ph.D. ____________________________________ David Koceja, Ph.D.
Date of Oral Examination December 14, 2005

iii
ACKNOWLEDGEMENTS
The past three years have been the most challenging and rewarding time of my
life. I will fondly remember many things from this exciting period and never forget those
who have helped me accomplish this lifelong goal.
I will always treasure and will continue to be grateful to my parents, David and
Sharon Wood, both educators in Anderson Community Schools and “life” educators to
me and my sister, Emily. They taught us from an early age the importance of education,
and it is their influence that has inspired me to work hard in and out the classroom, and to
Emily, best friend, for her life lessons of patience and compassion for all people.
I am forever in debt to Dr. Craig Ross and Dr. Sotiris Avgoustis for their
encouragement and mentorship. I am very appreciative of the time and energy they have
spent assisting and coaching me though this process. Without their patience and support,
I would not be at this point in my doctoral career. Additionally, it has been a pleasure and
a wonderful opportunity to work with Dr. Rafael Bahamonde and Dr. Cem Basman.
Their input and advice was invaluable. My dissertation committee was comprised of four
extremely talented professionals and I am truly lucky they agreed to partner with me on
this project.
A special thank you to my TCEM faculty family especially Dr. Linda Brothers,
Dr. Sotiris Avgoustis, and Dean Nicholas Kellum for taking a chance on me and adding
me to the incredible PETM faculty. Working with this IUPUI faculty is not a job; it is a
privilege and I am blessed to be associated with this university and school.
I am humbled to have such amazing friends. To Meredith Robinson, Heather
(Quire) Denny, and Jennifer (Burmeister) McCoy, thanks for always being my dearest

iv friends for the last twenty years and for life. I am honored to share this year with Heather,
who will be a wonderful elementary teacher upon her graduation.
During my days in Bloomington, I have been in the company of great academics,
leaders, and thinkers. Some of my dearest friends and colleagues, who will always be
important to me, have come from this Indiana University doctoral program. I hope we
will continue to always work together for the advancement of our profession. My respect
goes out to the entire Department of Health, Physical Education and Recreation (HPER)
and the Department of Higher Education at Indiana University, notably, Dr. Lynn
Jaimeson, Dr. Gilbert Brown, Dr. John Bean, Dr. Barbara Hawkins, Dr. Joel Meier, and
Dr. Ruth Russell, who have assisted me along the way.
They say “all good things must come to an end” and it is time for the journey to
conclude. I look forward to focusing my efforts and spending more quality time with my
husband Rhett and son Cooper, who are the loves of my life. They both inspire me to be a
better person, wife, mother, and educator. Thank you for your patience and love during
this time.
This dissertation is dedicated to my four grandparents, who have taught me the
importance of family, faith, and values. Their influence will continue to guide me in my
daily actions and my decisions in life. I love them all dearly.
In honor of: Esther Stoops
In memory of:
Phyllis and Paul Wood Marshall Stoops

v
ABSTRACT
The problem of this study was to construct a testable model by investigating the
dimensions of small tourism businesses and to explore if these characteristics predict
support of tourism development in Indianapolis, Indiana. Based on the review of
literature, a number of variables were identified for use in the study. A proposed model
was developed and small tourism businesses were examined in terms of the type of
business activity, type of business ownership, motivation of business ownership, financial
success, projected growth, business geographical location, its customer base, and the
business’ level of community involvement.
To answer the research questions, an instrument was developed and administered
to small tourism businesses located in one of the six Indianapolis cultural districts (Broad
Ripple Village, Wholesale, Fountain Square/Southeast Neighborhood, Downtown Canal,
Mass Avenue, and Indiana Avenue Cultural District). For this project, a small tourism
business was defined as a business with less than 40 full-time employees, very small
market share, annual revenue less than $250,000, or limited infrastructure and assets, and
was categorized as one of the following establishments: (a) art galleries or studios, (b)
restaurants, (c) historic attractions, (d) museums, (e) performing/visual arts, (f)
unique/gift shops, and (g) accommodations. A total of 152 surveys were used in the
analysis, which represented a 48.2% response rate; 315 small tourism businesses fit the
sample criteria.
The initial analysis of the data was conducted using SPSS and produced a number
of descriptive statistics describing small tourism businesses in Indianapolis. This
information was used to better understand the nature of owners and managers of small

vi tourism businesses. Factor analysis procedures were conducted using principal factors
extraction with Promax rotation, resulting in a five-factor solution. A multiple regression
analysis was then used to distinguish whether support of tourism development could be
predicted by the small tourism businesses’ financial success, business performance,
owner motivations, perceived self-image, owner values, business activity type, business
location, and business ownership type.
Based on the conclusions of the study, evidence was not found that this set of
independent variables predict the support of tourism development. Results indicate that
only 5.8% of support for tourism development by small tourism business owners could be
explained by this set of independent variables. The ANOVA table and the standardized
coefficients, or the converted beta weights, were examined to review which, if any, of the
independent variables contributed to the explanation of the dependent variable. Both data
reports support the conclusion that this set of independent variables did not predict the
level of support of tourism development by small tourism businesses.
From this study a better understanding of the dimensions of small tourism
businesses and support for tourism development was reported. This research should be
used as a foundation to expand and continue work on future theory development and
modification in the areas of small business and tourism.
_________________________ Craig Ross, Re.D., Chair
____________________________ _______________________________ Sotiris Avgoustis, Ph.D. Rafael Bahamonde, Ph.D. ____________________________ ________________________________ Cem Basman, Ph.D. David Koceja, Ph.D.

vii
TABLE OF CONTENTS Chapter 1: INTRODUCTION Page
Introduction………………………………………………………………….. 1 Background of the Problem…………………………………………………. 2
Statement of the Problem……………………………………………………..4
Purpose of the Study …………………………………………………………4 Hypotheses…………………………………………………………………....5 Justification of the Study …………………………………………………….6
Indianapolis, Indiana………………………………………………………....7
Delimitations………………………………………………………………….9 Limitations…………………………………………………………………..10 Assumptions…………………………………………………………………10 Definition of Terms …………………………………………………………11
Chapter 2: REVIEW OF LITERATURE AND MODEL DEVELOPMENT
Introduction ………………………………………………………………....13
Overview of Content………………………………………………………...13 Theory Review ……………………………………………………………...19
Summary…………………………………………………………………….23

viii Chapter 3: METHODOLOGY
Introduction……………………………………………………………….….25 Arrangements/ Site …………………………………………………………..25 Selection of Subjects…………………………………………………………26 Procedures for Data Collection …………………………………………….. 27
Design of Study and Instrument……………………………………………...28 Method of Analysis …………………………………………………………..30 The Proposed Model………………………………………………………….30 Summary ……………………………………………………………………..34
Chapter 4: DATA ANALYSIS
Introduction……………………………………………………………….….35 Response Rate………………………………………………………………..36 Screening the Data…………………………………………………………...36
Demographic Data …………………………………………………………..38 Factor Analysis………………………………………………………………61 Labeling Factors……………………………………………………………..67 Multiple Regression Analysis………………………………………………..71 Summary……………………………………………………………………..79
ix Chapter 5: SUMMARY, FINDINGS, CONCLUSIONS, IMPLICATIONS, AND
RECOMMENDATIONS Summary……………………………………………………………………..80 Findings………………………………………………………………………82 Conclusions…………………………………………………………………..86 Implications…………………………………………………………………..90 Recommendations………………………………………………………..…..92 REFERENCES …………………………………………………………………..95 APPENDICES
Appendix A: Human Subjects Approval………………………………..105
Appendix B: Research Team Guidelines………………………………..107 Appendix C: Letter………………………………………………………109 Appendix D: Research Instrument ………………………………………111 Appendix E: Curriculum Vita……………………………………………118

x
LIST OF FIGURES
1. Map of Indianapolis Cultural Districts…………………………..……..…..…..26
2. The Proposed Model……………………………………………..……..………32
3. Scree Plot for PCA Analysis……………………………………..……..…….. 64 4. Normality Probability Plot of Regression Standardized Residuals …..….…….75
5. Scatterplot of Total Tourism Development Support (Dependent Variable)…... 76 6. The Modified Model………………………………………………………...….85

xi
LIST OF TABLES
1. Independent Variables Used in the Study……………………………………... 29
2. Dependent Variable Used in the Study……………………………...………… 29
3. Respondents by Business Activity Type……………………………………… 39 4. Respondents by Business Location…………………………………………….40
5. Respondents by Business Ownership Type ……………………………………41
6. Respondents by Title Type……………………..………………………………42
7. Respondents by Gender……………………………………………………….. 42
8. Respondents by Age……………………………………………………………43 9. Respondents by Years in the Business/Working Experience…………………..44
10. Respondents by Motivation for starting a small tourism business……………..46
11. Number of Employees………………………………………………………… 48
12. Employment last 12 months……………………………………………………49
13. Employment over next 12 months…………………………………………….. 49
14. Customer/Revenue Trends over the last 12 Months ………………………….. 51
15. Customer/Revenue Trends over the next 12 Months…………………………..51
16. Obstacles for Improved Performance…………………………………………. 52
17. Business Revenue from Local Residents……………………………………… 53
18. Total Business Revenue………………………………………………………. 54
19. Business Profitability relative to Significant Competitors……………………. 55 20. Level of Business Performance……………………………………………….. 56 21. Number of Professional, Civic, Religious, Charitable, Volunteer Organizations…………………………………………………………..………57
xii 22. Professional, Formal Membership Types………………………………………..58
23. Civic or Service Organizations……………………………………………... …58
24. Community or Religious Affiliated Programs………………………………... 59
25. Contacted for Assistance in Mission Development…………………………... 59
26. Part of the City’s Tourism Industry ………………………………………….. 60
27. Level of Support……………………………………………………………..... 61 28. Total Variance Explained by PCA Analysis – Extractions Sums of Squared
Loading…………………………………………………………………………63 29. Principal Component Analysis: Component Matrix…………………………. 65 30. Principal Component Analysis: Structure Matrix…………………………….. 67 31. Factor 1: Financial Success …………………………………………………. 68 32. Factor 2: Business Performance……………………………………………… 69 33. Factor 3: Owner Motivation………………………………………………….. 70 34. Factor 4: Perceived Self-Image ………………………………………………. 70 35. Factor 5: Owner Values ……………………………………………………… 71 36. Factor Summary………………………………………………………………. 72 37. Correlation Matrix: Independent Variables versus Dependent Variables……. 74
38. Multiple Regression Analysis of Coefficients: Collinearity Statistics……… 77
39. Analysis of the Variance: Regression…………………………………………. 78
40. Multiple Regression Analysis: Significance of Beta Weights……………….. 79

1
Chapter 1
INTRODUCTION
Attaining small tourism businesses’ support is perhaps the most ignored facet in
urban tourism development. Urban tourism development improves the quality of life for
its residents, boosts the city’s vitality, and improves its economic position. Urban tourism
remains an under-researched topic of study, as is the element of small tourism business in
developed urban areas (Hall & Page, 1999; Rogerson, 2004; Shaw & Williams, 2004;
Thomas, 2004, 2000).
Many urban governments and policy makers are now relying on tourism for
economic regeneration and for strategic local development (Ioannides & Peterson, 2003;
Law, 2002; Rogerson, 2004). According to Jurowski and Brown (2001), “When
attempting to maximize the benefits for a specific community, planners should gather
information about individuals who stand to gain economically from the development,
those who are currently using the resource to be developed, those who are attached to
their community and those with a strong environmental attitude” (p. 9). A better
understanding of the level of support for tourism development by small businesses is
essential to tourism developers, planners, and officials. This information can assist in
capitalizing on those small tourism businesses that support tourism development through
influence of public policy and provide a better understanding of non-supporters (Jurowski
& Brown, 2001). Without adequate information on the small tourism business sector,
policymaking and planning may be impeded (Page, Forer, & Lawton, 1999).
As in many cities, Indianapolis has a large number and variety of small tourism
businesses that significantly contribute to the economic well-being, as well as, to the

2 authenticity and ambiance of the city. This research uncovered the variables that
influence small tourism businesses’ support for or opposition to tourism development in
Indianapolis and detailed the descriptive, behavioral, and operational differences among
these stakeholder groups. From this information, a testable model was developed that
identified the strength of the relationship between each of the variables and the support
for tourism development.
Background of the Problem
Little is known about the roles of tourism, small business, and their relationship to
economic development (Page et al., 1999). According to Shaw and Williams (1994),
there is an absence of studies on small tourism business, even though “the tourism and
leisure industry tend to be dominated by a few large businesses operating alongside a
large number of small, independent ones” (p. 100). Until the 1990’s, small businesses
were simply considered a miniature version of large firms, and differences in business
objectives, management style, funding, and marketing were unnoticed (Friel, 1999).
Furthermore, Curran and Storey (1993) stated that, “many of the major conceptual
developments in the area of research have been derived from the small business
researchers with no connection to tourism” (as cited in Page et al., 1999, p. 436).
Research on small tourism businesses is needed to assist urban communities in
capitalizing on new markets. Today’s educated leisure and business travelers are
demanding a unique cultural experience that requires more than chain restaurant food and
retail mall shopping. As the impact of globalization takes center stage, tourists are now
more experienced and knowledgeable regarding language, use of transportation, and
travel resources and have increasingly more discretionary dollars to spend on travel
3 (Smeral, 1998). To experience the true flavor of a destination and the culture of the local
residents, tourists seek out small tourism businesses. According to Bastakis, Buhalis, and
Butler (2004), small and medium tourist enterprises “provide a very diverse range of
tourism products and services, facilitate rapid infusion of tourism spending into local
economies, while in leisure tourism they usually shoulder the distinctive function of
offering a local character to the increasingly homogenized tourism packages” (p. 151).
These establishments are typically “off the beaten path” from tourist accommodations
and large attractions but are recognized as essential ingredients in the economic well-
being of a community and image of a destination (Page et. al, 1999; Simmons, 1994).
Small tourism businesses, such as galleries, independent restaurants, theatres, art
studios, bed and breakfasts, and local stores, find it difficult to compete and survive in a
chain-dominated economy. However, it is this group of businesses that shapes the
destination’s image, exposing tourists to the destination’s distinctiveness. Small tourism
businesses are being ignored or overlooked in tourism planning and development.
It is imperative that tourist programming, marketing, and government efforts be
coordinated among all urban tourist businesses, particularly small tourism businesses, and
large events or conventions attracting travelers to the city. Smeral (1998) noted “the
quality of interactions between all these small and medium enterprises – given strategies,
factor and demand conditions and environmental influences- would play an important
role in the competitiveness of a tourism destination” (p. 374). Strategic tourism planning
should reflect the viewpoints and input of small tourism business owners, and policy
should reflect their needs and issues. There continues to be a significant gap in the

4 tourism literature regarding public policy, community involvement, and the social
impacts of tourism (Thyne & Lawson, 2001).
Statement of the Problem
The problem was to construct a testable model by investigating the dimensions of
small tourism businesses and explore if these characteristics impact support of tourism
development in Indianapolis. Each small tourism business was examined in terms of the
type of the business activity, type of business ownership, motivation of business
ownership, financial success, projected growth, business geographical location, its
customer base, and business’ level of community involvement. The importance of the
study was that support for tourism development leads to increased tourism activities and
inevitably increased economic benefit to the community. Successful planning and
management of tourism development benefits a community’s residents, businesses, and
visitors. Building community loyalty to attract more tourists into the community is
imperative to the success of any initiative or grass-roots project (Chen, 2000).
Purpose of the Study
The purpose of this study was to identify the small tourism business factors that
explain and predict support for tourism development in a community. The objectives of
this research are stated in the following two research questions:
1. To what extent can the variation of support for tourism development (dependent
variable) be explained by the set of independent variables: type of the business activity,
type of business ownership, motivation of business ownership, financial success,
projected growth, business geographical location, its customer base, and business’ level
of community involvement?

5 2. What is the best linear combination of independent variables to predict support of
tourism development in this sample?
Hypotheses
The following eight null hypotheses were tested in this project:
H1: There are no significant relationships between small tourism business’
involvement (membership in professional, civic, religious, charitable or volunteer
organizations) and support of tourism development.
H2: There are no significant relationships between small tourism business’ motivation
(such as lifestyle, enjoyment, retirement, and business investment) and support of tourism
development.
H3: There are no significant relationships between small tourism business’ projected
growth and support of tourism development.
H4: There are no significant relationships between small tourism business’ financial
success and support of tourism development.
H5: There are no significant relationships between small tourism business’ clientele
base and support of tourism development.
H6: There are no significant relationships between small tourism business’ activity
type and support of tourism development.
H7: There are no significant relationships between small tourism business’ type of
ownership and support of tourism development.
H8: There are no significant relationships between small tourism business’ location
and support of tourism development.

6
Justification for the Study
Tourism has become an important and essential element of urban area economics
and can significantly contribute to a city’s revitalization or recovery (Haywood & Muller,
1988). According to the World Travel and Tourism Council (WTTC, 2004), in 2004
alone travel and tourism contributed 11.3% of the world’s gross domestic products
(GDP), or US$6201.5 billion, and accounted for 221 million jobs, or 8.3% of the world’s
total employment. Sirgy and Su (2000) noted tourism had grown into the “largest
industry surpassing automobiles, steel, electronics and agriculture” (p. 342).
The World Travel and Tourism Council’s Tourism Highlights Edition 2004,
reported that international tourism arrivals have grown from 451 million in 1990 to 691
million in 2003. Receipts from international tourism exchanges reached US$523 billion
in 2003, making it one of the largest categories of international trade. The WTTC
forecasted there will be 1.6 billion international tourists worldwide by 2020, spending
over US$2 trillion dollars (WTO, 2005, Facts & Figures section). Specifically, it is
estimated that between 35 and 70% of international tourists are now cultural tourists
(Antolovic, 1999; McKercher & DuCros, 2003; Richards, 1996).
Tourism has become an important part of global economics and tourism research
is being centered on direct, indirect, and total effects of visitor spending, which affects
jobs, regional output, and taxes (McHone & Rungeling, 2000). The economic impact of
tourism is driving researchers to explore several aspects of this industry, including
consumer satisfaction, travel behavior, hospitality opportunities, leisure measurement,
and recreation interests (Kozak & Rimmington, 2000).

7
Balancing tourism development and maintaining a quality urban environment that
meets the needs of local businesses and residents has become a major challenge.
Achieving community support for tourism requires an understanding of how attitudes are
formed and what factors influence their perspective on tourism advancement (Jurowski &
Brown, 2001; Jurowski, Uysal & Williams, 1997). Additionally, sound planning should
produce a plan designed to identify and control the tourism carrying capacity of the city.
Frangialli (2002), Milman, King, and Pizam (1993), Smith and Krannich (1998), and
Zwick (1991) noted with increased tourism, communities struggle with congestion, loss
of open space, price increases, disruption of social structure, changes in local values, loss
or endangerment of local traditions and ceremonies, problems with community
organization, threats to biodiversity, demand on water and energy resources,
overcrowding at cultural sites and monuments, exploitation of workers, and organized
sex tourism. Yamashita (1997) stated, “It is simply impossible to stop the spread of
tourism activity in the modern age of mass tourism, so the question is not how to stop or
avoid it but is one of how one may minimize the harm to, and destruction of, native
society; and how one may derive a beneficial effect from tourism, not only in economic
but also in cultural terms as well” (pg. 219).
Indianapolis, Indiana
Tourism development is playing a critical role in service sector economies (Copp
& Ivy, 2001). The economy of Indianapolis, the state capital of Indiana, is heavily based
on service-oriented businesses catering to the hospitality market. The city has focused its
tourism marketing and promotion efforts on the MICE market (meeting, incentives,
conferences and expositions) and sports tourism. Indianapolis is widely recognized

8 throughout the United States as one of the premier destinations for amateur sport
competition, and has hosted such events as the 1987 Pan America Games, 2000 NCAA
Men’s Final Four, and 2003 World Basketball Championships.
Indianapolis is the 12th largest city and the 29th largest metropolitan area in the
United States. According to the U.S. Bureau of the Census (2000), the greater
Indianapolis metropolitan area has a population of approximately 1,607,486 people and
spans 3522.9 square miles. The median household income is $45,500; 81.3% of residents
are high school graduates, and 70.4% are white (U.S. Bureau of the Census, 2000, Quick
Facts section). Additionally, the U.S. Census Bureau (2002) conducted a survey of
business owners in Indianapolis. Over 70% of the business owners in Indianapolis are
male, and 88.3% are white. Indianapolis is the most centrally located city of the top 100
markets in the U.S. and is served by seven segments of interstate highway (Indianapolis
Chamber of Commerce, 2004, Economic Development Section). In June 2004, the
National Association of Homebuilders named Indianapolis the most affordable city with
over one million people, and the city was named one of the five “up and coming cities”
by Money Magazine (Indianapolis Chamber of Commerce, 2004, Accolades Section).
In 2002, the Indianapolis Cultural Development Commission, an organization that
supports arts and culture while promoting Indianapolis as a unique cultural destination,
implemented a Cultural Tourism Initiative. This program was designed to improve the
quality of life for Indianapolis residents and enhance travelers’ experiences while visiting
the city. A $10 million initiative focusing on the marketing of grass-root projects and
“big picture” strategic planning is being allocated and distributed to support the
initiative’s goals. The Commission is allocating significant funding to several key areas:
9 (a) media relations, (b) grant programs, (c) training programs, (d) marketing and
outreach, and (e) community projects (Indianapolis Cultural Tourism Initiative, 2005,
About Us Section). The project’s goals are to strengthen Indianapolis’ image as a cultural
destination and build sustainable infrastructure to support cultural development.
In addition, the Cultural Districts Program was started in 2003 to showcase the
distinct pockets of cultural opportunity in six prominent areas throughout Indianapolis.
These six areas include Broad Ripple Village, Fountain Square, The Canal and White
River State Park, Mass Avenue Arts and Theater District, Downtown Wholesale District,
and Indiana Avenue District.
Delimitations
The study was delimited in scope by the following: 1. Only those small tourist businesses within the six cultural districts of Indianapolis,
Indiana were administered the survey. Small businesses outside the cultural districts were
not mailed a survey.
2. A small tourism business was defined by number of employees and annual
revenue. Surveys collected for businesses not meeting the criteria were discarded.
3. The study was administered in July and August of 2005.
4. The study was conducted by paper pencil survey. A trained research team visited
the businesses meeting the criteria and requested the small business owners’
participation.
5. The study was conducted during a tourism transition time in Indianapolis. The
survey was administered following significant recent events in the city, including the

10 approval of a new dome for the Indianapolis Colts football franchise and an expansion for
the Indiana Convention Center.
Limitations
The study was limited in scope by the following: 1. The instrument was administered only to Indianapolis small tourism businesses as
identified by the Indianapolis Cultural Development Commission, which did not include
all businesses in the downtown or greater Indianapolis area.
2. The truthfulness and accuracy of the selected participant responses to the survey
items were considered.
3. The ability of the selected participants at each business to understand and
accurately interpret the survey items was considered.
4. The degree to which the identification of the various small tourism businesses was
accurate in capturing the full range and scope of the population under investigation.
Assumptions
The study was based on the following assumptions:
1. The selected subjects were truthful and accurate in their responses.
2. Participants understood and accurately interpreted the survey.
3. The group of selected small tourism businesses was comprised of a diverse range
of tourism enterprises in Indianapolis.
4. The survey instrument was appropriate for use within the framework of this
particular study.
5. The items comprising the survey instrument captured a diverse array of small
tourism business factors across the array of tourism businesses in Indianapolis.

11
Definition of Terms
The basic terminology used in the study was defined as follows:
City Infrastructure: Facilities, equipment, and installations needed for basic
functioning in the daily lives of the residents, including utilities, transportation, health
services, etc. (Richie & Goeldner, 1994).
City Superstructure: Facilities, equipment, and installations needed to meet the
needs of visitors, including hotels, catering facilities, markets, etc. (Richie & Goeldner,
1994).
Cultural Tourism: The movement of persons for essentially cultural motivations
including tours, performing arts, travel to festivals, visits to sites and monuments
satisfying the human need for diversity, new knowledge, and exciting experiences (World
Tourism Organization, 1985 as cited in McKercher & du Cros, 2003 ).
Small Tourism Business: Business with less than 40 full-time employees, very
small market share, annual revenue less than $250,000, or limited infrastructure and
assets. A small tourism business consisted of establishments in the following categories:
(a) art galleries or studios, (b) restaurants, (c) historic attractions, (d) museums, (e)
perform/visual art center, (f) unique gift/souvenir shop, and (g) accommodations.
Stakeholder: Any person or organization who is vested in or has a passion for an
interest; includes external and internal participants such as media, artists, government
officials, local business owners, etc. (Goldblatt & Nelson, 2001).
Strategic Tourism Planning: The creation of a plan of action for a tourism area’s
foreseeable future and the implementation of those actions (Gunn, 2002).

12
Tourism: Tourism is “a hybrid of meaning, interpretations, sites, and
experiences…..everything from leisure, learning activity that generates interest and
purpose to a social process with economic, social, cultural, and environmental impacts”
(Ryan, 2000, p. 119).
Tourism Development: Tourism development is essentially tourism marketing.
The elements of the marketing activities include recruiting, as well as the creation of
products that entice visitors to linger and seek leisure activities that will part them from
their money (Glover, 1998).
Tourist or traveler: A person who is a non-resident traveling over 50 miles for
any purpose; meetings, shopping, events, visiting relatives, etc. (Masberg, 1998).
Urban Tourism: Travel to areas of high population density where cultural, artistic
and recreational activities are offered. Travelers residing in the city’s hotels and motels
distinguish themselves from residents (Richie & Goeldner, 1994).
Urban Tourism Product: Tourist elements which include historic buildings,
attractions, art galleries, museums, sporting events, theaters, and urban landscapes
(Jansen-Verbeke, 1986).

13
Chapter 2
LITERATURE REVIEW
The literature related to the factors influencing support of tourism by small
tourism businesses is presented in this chapter. For organizational purposes, this review
covered three sections: (a) overview of content related to the definition, characteristics,
and components of a small tourism business, (b) a conceptual review of theories and
theoretical framework, and (c) summary of the review.
Overview of Content
Although there is a significant amount of literature on small business, few studies
address what constitutes a small tourism business, making the term difficult to define and
conceptualize (Cressy, & Cowling, 1996; Curran, 1996; Morrison, 1996; Page et al.,
1999; Shaw & Williams, 2004; Thomas, 1998, 2000, 2004). According to Storey (1994),
there is not “a single, uniformly acceptable definition of a small firm” (p. 8). Most small
businesses are defined solely in terms of one key element, number of employees, or in the
case of lodging, number of hotel beds. Studies have described small business as
employing less than 10 people to up to 500 people; the definition is selected and justified
by the user on the basis of its value in the project (Storey, 1994; Thomas, 2000). For
instance, Friel (1999) defined a micro-enterprise as one employing 10 individuals or less
and a small enterprise as one that employs 10-49 individuals, whereas Getz and Carlsen
(2005) defined a small tourism business as “less than 20 employees, very small market
share, annual revenue less than $50,000, or limited infrastructure and assets” (p. 239).
The number of employees or number of beds should not be the only variables to
determine the size of a tourism enterprise (Bulalis, 1993). Other key elements that should

14 be added to the descriptors include market share, revenue per employee, management and
organizational structure, financial strength, operational procedures, decision-making
process, entrepreneurial involvement, integration level, internationalization of operation,
and managerial expertise (Buhalis, 1993; Quinn, Larmour, & McQuillian, 1992; Reichel
& Haber, 2005).
Most studies exploring the role of small tourism business were conducted in
European and African rural, developing areas, and there is relatively little research
regarding small tourism business in rural areas or cities in the United States. However,
Carter (1996) noted that:
irrespective of the relative size of each country’s small business sector, the main management characteristic of small firms remain similar regardless of nationality.
Researchers have consistently noted that small firms play an important role in new product and process innovation and are characterized by their product specialization…[and]…that these firms are undercapitalized, product-led, family-owned concerns in which the management function is confined to one person or a few key individuals (p. 4503-4504). In many industrialized countries, such as the United Kingdom, United States,
Japan and Germany, the small business sector has continued to increase, employing a
high percentage of the community’s residents. In France, 80% of tourism business is
dominated by firms employing less than 10 people (Buhalis, 1993). In Britain, the Bolton
Committee was put into place in 1969 to examine the problems small business was facing
and to advise the British government on policy reform regarding small business. The
committee published its findings in 1971, and in fact 96% of all firms in the hotel and
catering industry could be described as “small” and “employed 75% of the total number
of employees in the sector” (Quinn et al., 1992, p. 12).

15
Small business owners are easily attracted to the hospitality industry for a number
of reasons. Mainly, the barriers to entry are very low, the amount of capital investment to
get started is minimal, and the skill level is typically not at a specialist level (Deloitte
Touche Tomatsu, 1994; Quinn et al., 1992). Tourism offers sole proprietors or families
an easy access to a number of small or micro-business types (Getz & Carlsen, 2005).
Small business and family-owned business are often used synonymously in the
literature; however, there are a variety of differing components that differentiate the two
business types (Getz & Carlsen, 2000; Getz & Carlsen, 2005). Not all small businesses
are family owned and operated. It has been estimated that family firms generate up to
60% of the United States’ gross national product (Ward & Aronoff, 1990; Westhead &
Cowling, 1998). Ownership is another element that is commonly used to describe small
business; however, motivation and the profile of a small business owner may or may not
match those of family-owned and operated establishments. Family-owned small firms
may be reluctant to “abandon the enterprise in difficult times” (Getz & Carlsen, 2005, p.
241), and the balance of family life and business becomes critical as a large percentage of
tourism businesses are operated by couples (Litz & Stewart, 2000). Business interest may
focus on lifestyle, location or leisure preferences instead of profitability in family-owned
operations (Ateljevic & Doorne, 2000; Getz & Carlsen, 2000).
Furthermore, researchers simply cannot group all small hotels, tour guide
companies, art galleries, or novelty stores into a homogenous category, regardless of their
similarities in number of employees or amount of revenue generation. These small
tourism firms differ amongst the various industry segments: accommodations, tourist

16 activities, and recreational ventures, each having different business objectives, direction,
and performance measures (Reichel & Haber, 2005).
Small businesses share distinctive characteristics and functional weaknesses that
affect the product, operation, and services that they offer (Bastakis et al., 2004). Carter
(1996) identified six categories that distinguish small business firms from large business
firms. These include planning, environmental reaction and strategy, business objectives,
range of management skills, communication styles, and company performance measures.
Lack of strategic planning, vision, and long-term goals has been identified as a
major problem of small business firms (Buhalis & Cooper, 1992; Bastakis et al., 2004;
Olsen, 1991). Small tourism businesses are notable for being ‘product oriented’ or
‘family oriented’ versus ‘market oriented’ and find it unavoidable to depend heavily on
intermediaries (Bastakis et al., 2004; Buhalis, 1993; Hankinson, 1989). Short-term
problems and pressure seem to dominate small business planning and vision (Brownlie,
1994). Many struggle to survive during times when unexpected incidents, such as war,
terrorism, and natural disasters occur (Buhalis, 1993).
Small and medium tourism enterprises tend to be weakly managed, lacking the
business skill and savvy of larger firms (Bastakis et al., 2004; Brownlie, 1994; Buhalis,
1993; Friel, 1999; Getz & Carlsen, 2005; Page et al., 1999; Thomas, 2000). An
incomplete management team is typically inevitable, as most small businesses lack the
financial resources to attract specialized managers and personnel necessary to grow the
business (Bastakis et al., 2004; Brownlie, 1994). Ioannides and Peterson’s (2003) study
revealed that the majority of employers did not require any tourism-related education,
experience, or training upon hiring a new employee. On the other hand, small firms can
17 be more successful in “soliciting employee support and involvement because there are
fewer management layers to permeate and fewer people to convince of the benefits”
(Andreichuk, 1992 as cited in Kuratko, Goodale, and Hornsby, 2001, p. 294).
Due to the size of small business market share, funding for small tourism business
is typically from the owner’s personal funds rather than formal funding sources
(Ioannides & Peterson, 2003). Hankinson (1989) found small business owners of hotels
were reluctant to take outside loans, even when they could improve profitability.
Important factors, such as risk, opportunity costs, cost of capital, and overall investment
strategies were ignored. Because of the resource constraints, few small business owners
provide critical services, such as adequate staff training or supervision to their employees
(Hankinson, 1989).
Access to primary research and funding also affects the ability for small firms to
differentiate and identify a profitable niche in the market (Buhalis, 1993). Many firms,
large and small, find it financially prohibitive to obtain research that assists companies
with monitoring significant trends, market shifts, and forecasting (Brownlie, 1994).
However, it is critical that small business use market opportunity analysis (MOA), which
large firms have found beneficial (Brownlie, 1994).
Buhalis (1993) describes the network of small and medium tourism enterprises as
one that needs to be combined into an integrated product to maximize the tourist
experience. Bastakis et al. (2004) concluded “it is almost impossible for SMTEs (small
and medium tourism enterprises) to avoid partaking in concentration trends, either as
small firms’ consortia or as parts of a large travel organization of the future” (p. 166).
Sharing problems, ideas and experiences can assist in creating cooperative marketing

18 ventures and idea pooling (Brownlie, 1994). More importantly, the quality of this
cooperation of small business can play a critical role in the competitiveness of a
destination or region (Simmons, 1994).
Small tourism business is known for low involvement in regional tourism
organizations and certification programs, but the need for formal and informal business
and social networking is important in small business survival (Copp & Ivy, 2001;
Ioannides & Peterson, 2003; Page et al., 1999). Quinn et al. (1992) noted many small
businesses avoid being part of the “system” and opt to operate independently of the larger
hospitality community.
The lack of technology skills exhibited by tourism employers and employees
matched with their lack of information systems inhibits the marketing and operational
activities of small tourism businesses (Buhalis, 1993; Ioannides & Peterson, 2003;
Mutch, 1995; Wood, 2001). In 2001, Wood found as Internet usage by small firms is
increasing, “the informality of the systems manifests itself in the reliance on personal
contacts and individual manager’s experience and knowledge rather than hard facts and
quantitative data” (p. 293-294). Improved information technology control allows for
monitoring of trends and for increasing personal involvement, and decreases such tasks
as manual input and time-consuming projects. As noted above, the financial situation of
the firm may dictate whether or not specialty staff is employed to support the technology
system and train employees (Mutch, 1995). Ioannides and Peterson’s (2003) study found
despite the heavy number of PC users, SMTEs did not utilize software “specially
designed for the needs of their operation or in a manner that allows them to practice
significant process innovation” (p. 427). To improve their competitive position, small

19 tourism firms must seek new strategic tools that help them overcome size, structural and
functional problems (Buhalis, 1993).
Small business owners and firms make significant contributions to the economic
welfare of a destination. As major corporations face downsizing, small business has the
ability to create new jobs and opportunities for a city or region’s residents. Additional
contributions include, “improvements to industrial relations and working environment;
diversified and flexible industrial base; stimulating competition, leading to an energetic
enterprise culture, and the ability to stimulate innovation” (Armstrong & Taylor as cited
in Wanhill, 2000, p. 134). As described by Ibielski (1997), these small businesses are:
Mighty minnows, reflecting the competitive spirit that a market economy needs for efficiency; they provide an outlet for entrepreneurial talents, a wider range of consumer goods and services, a check to monopoly inefficiency, as source of innovation, and a seedbed for new industries; they allow an economy to be more adaptable to structural change though continuous initiatives embodying new technologies, skills, process, or products (p.1). Small tourism firms have product and process flexibility, demonstrating the
capability to handle non-standard requests and orders and change production based on
customer needs and demands (Kuratko et al., 2001). These small firms can “fill the gap”
of heavy demand for products and services during seasonal times in a destination
(Ioannides & Peterson, 2003). Buhalis (1993) identified other strengths of small and
medium tourism business to include cultural resources, the personal and family
relationship to the business, and the entrepreneurial activity.
Theory Review
“Causes are connected with effects, but this is because our theories connect them,
not because the world is held together by cosmic glue” (Hanson, 1958, p. 64, as cited in
20 Pedhazur, 1982). Many tourism studies have addressed a number of theories and factors
that influence small business ownership, community participation in planning, support for
tourism, and/or tourism development (Ateljevic & Doorne, 2000; Besser, 1999; Chen,
2001, 2000; Copp & Ivy, 2001; Friel, 1999, Getz & Carlsen, 2005, 2000; Hankinson,
1989; Ioannides & Peterson, 2003; Jamel & Getz, 1995; Jurowski & Brown, 2001;
Jurowski et al., 1997; Kuratko et al., 2001; Litz & Stewart, 2000; Milman et al., 1993;
Page et al., 1999; Reichel & Haber, 2005; Quinn et al., 1992; Reid, Mair, & George,
2004; Schroeder, 1996; Simmons, 1994; Thomas, 2000, 1998, Thyne & Lawson, 2001;
Tosun & Jenkins, 1996, Wanhill, 2000; Williams & Lawson, 2001; Yoon, Chen, &
Gursoy, 1999). The following section presents a theoretical background and framework
for the variables examined in the proposed model. Factors are typically proposed in a
model based on one or more of the following three rationale: (a) theory-based research,
(b) empirical research, and (c) researcher intuition or experience. Each factor used in the
proposed model is supported below by one or more of the three justifications.
This section describes elements of social theory (Davis, 2001), organizational
typologies (Litz & Stewart, 2000), social exchange theory (Chen, 2000; Jurowski et al.,
1997), the enlightened self-interest model of business social responsibility (Besser,
1999), and the systemic model (Besser, 1999) as it relates to the factors proposed. These
theories were reviewed and used as the conceptual framework for the study.
Davis (2001) reported that the social theory can assist tourism researchers in two
ways: (a) “in describing and understanding contemporary tourism landscapes” and (b) “in
aiding those who study how tourism enterprises behave and why” (p. 126). The
perceptions of all people, including small business owners and employees, define and add
21 to the place, and this approach assumes people deal in social constructs naturally. This
interdisciplinary approach attempts to analyze social structures, instead of explaining
patterns of social life.
Because so many small tourism businesses are owned and/or operated by families,
it is important to review organizational theory related to family firm typology. Litz and
Stewart (2000) conceptualized a four-cell typology of family firms that “recognized the
possibility of familial influence along the two dimensions of structure and intent” (p.
136). Family firms are categorized as (a) potential family business, (b) family business,
(c) potential non-family business, or (d) non-family business and compared based on
level of community involvement. This unique approach explored the practical
implications of the typology on community involvement levels of small, family
establishments.
The social exchange theory is used in a number of tourism studies exploring or
explaining resident or business support of tourism or development. In attempting to
understand the perspectives of small tourism business owners, it is equally important to
understand this approach. According to Chen (2000), “If a host community perceives
that the total tourism effects are negative, the level of support from the community is
likely to diminish” (p. 5). In turn, individuals will typically enter into exchanges if the
rewards are perceived as higher than the costs (Chen, 2000; Jurowski et al., 1997).
Besser (1999) used the enlightened self-interest model for business social
responsibility to describe the behavior and commitment of firms to their community.
This approach postulates that responsible behavior exhibited by the business will result in
positive public relations, increased profits, better relationships with suppliers, and
22 potential new partners. Additionally, the systemic model posits that urban business
communities, as well as rural communities, can equally become attached to the city or
region (Besser, 1999). Community and civic involvement have proven important
elements in determining cooperation and support levels of individuals in terms of tourism
development issues (Jurowski & Brown, 2001; Jamal & Getz, 1995).
Tourism can provide direct and indirect economic benefits and costs to a host
community (Mak, 2004). Due to tourism revenues driving Indianapolis’ economy and
development strategies, economic theory provides the logical framework for this study.
Many factors in the proposed model are based in terms of macroeconomic theory; in
other words, the relationship of economic theory and planning principles to tourism
development. Understanding economic choices and the performance of business allows
better understanding of demand analysis, firm behavior, market structure, public goods,
externalities, and the role of information in markets.
The most notable benefit used to promote and support tourism is its positive
impact on economic benefit to the community (Gursoy, Jurowski, & Uysal, 2002). Using
economics as a theoretical base illustrates how economics can explain small business life
and the problems faced by these owners and managers. Due to difficult economic times
and the changing nature of society and work, many “push and pull” factors can force
people into small business management (Getz & Carlsen, 2000).
The concept of economic theory has it roots in business, tourism, and urban
planning literature. Several microeconomic approaches have been developed to
specifically address the needs of urban tourism development. According to the
evolutionary and institutional economic approach, tourism production and the role of

23 small business are integral parts of the destination’s economy, and the business’ ability to
compete depends on product forms, market competition, and its ability to be flexible
(Getz & Carlsen, 2000; Ioannides & Peterson, 2003).
Also, economic base theory is an approach to explaining regional growth. Hoover
(1975) describes economic base theory as “basic activities which bring in money from
the outside world, generally by producing goods and services for export” (p. 219). In
addition, urban economic theory tends to be of interest to researchers in urban
economics, location theory, urban geography, and urban planning (Fujita, 1991). The
focus of this approach is on special aspects of economic decision making, location
choice, land use, and local government policy. Urban areas have unique economic
benefits and unique problems due to population density, crowding, and congestion
(Fujita, 1991). The key rationale for using economic theory is that it attempts to
understand the range of problems, challenges, and strengths of small tourism business
and direct strategy for addressing policy decisions.
Summary
The literature focusing on small tourism business as it pertains to support of
tourism is starting to receive attention by tourism researchers worldwide. Gaining the
support of small tourism businesses is important to the development of any urban tourism
region. Several common themes have emerged from the literature: (a) an absence of a
common understanding or definition of small tourism business restricts the ability to
compare and contrast study results and conclusions in this field of study, (b) there is a
lack of small business studies based on gender, family studies, and family-related
dimensions, even though a majority of small business is family-owned and managed, (c)

24 additional research based on theoretical understanding and improved data collection is
imperative, and (d) significant research needs be used to advance public policy and the
needs of small tourism business owners.

25
Chapter 3
METHODOLOGY
The purpose of the study was to examine if any small tourism business factors, or
independent variables (IVs), explain and predict support for tourism development, the
dependent variable (DV), using a variety of descriptive statistics and multivariate analysis
techniques. The methods used to address the research problem are described in the
following sections: (a) arrangements/site, (b) selection of subjects, (c) procedures for data
collection, (d) design of the study and instrument, (e) method of analysis, (f) the proposed
model, and (g) summary.
Arrangements/ Site
The study was conducted in the six cultural districts (Broad Ripple Village,
Wholesale, Fountain Square/Southeast Neighborhood, Downtown Canal, Mass Avenue,
and Indiana Avenue Cultural District) in the greater Indianapolis, Indiana area. These six
districts offer a unique mix of arts, cultural, and hospitality activity that define the
character of the Indianapolis area. In 2003, the Indianapolis Cultural Development
Commission created these districts to leverage Indianapolis’ existing offerings. Five of
the six districts were started in 2003 as part of the cultural districts pilot program, with
the Indiana Avenue Cultural District being added in 2004 (Cultural Tourism
Commission, 2004). A map of the Indianapolis cultural districts is illustrated in Figure 1.
26
Figure 1. Map of Indianapolis Cultural Districts
Selection of Subjects
The sample for this study was small tourism business owners or managers located
in one of the Indianapolis six cultural districts. A small tourism business was defined
using two criteria: (a) number of employees and (b) annual revenue. For the purpose of
this study, small tourism business was defined as having less than 40 full-time employees
and less than $250,000 in annual revenue. A comprehensive list of businesses in these six
districts was obtained from the Indianapolis Cultural Tourism Commission, and the list
was reduced to only the businesses reflecting the above criteria. The list consisted of the
following categories: (a) theaters, (b) art galleries, (c) restaurants, (d) night life, (e) retail,
(f) services, (g) worship, and (h) key organizations. Currently, there were approximately
650-700 businesses in these areas, of which approximately 315 businesses meet the small
tourism business criteria for the study. Businesses in the services, worship, and key

27 organizations were also eliminated as they tend not to serve tourists. The small tourism
businesses for this study were defined using the following categories: (a) art galleries or
studios, (b) restaurants, (c) historic attractions, (d) museums, (e) perform/visual art
center, (f) unique gift/souvenir shop, and (g) accommodations. The researcher gathered
158 surveys for analysis.
Procedures for Data Collection
A human subject’s compliance agreement was submitted to Indiana University’s
Institutional Review Board (IRB) by the researcher. The documentation of approval for
dissertation research and exempt review of human subjects was filed on April 29, 2005.
All federal regulations and university policies were reviewed and followed. The
acceptance of the project was received on May 11, 2005 (Appendix A).
The primary researcher mailed a letter the 315 small business owners in the six
districts two weeks prior to the collection of data (Appendix B). The letter detailed the
study’s purpose and asked for the small business owner’s participation. Additionally, it
stated when the owner should anticipate a researcher visiting his/her establishment.
A research team of 5 students was assembled and trained in June 2005. All
research team members were required to pass the Indiana University Human Subjects test
prior to participating in the collection of data. A research team training guide was
distributed to and reviewed by each research team member (Appendix C). The team was
divided and assigned a cultural district. The research team visited each small tourism
business and asked the owner or manager to complete the questionnaire. Surveys were
then collected, compiled, and returned to the primary researcher for analysis. This
procedure was implemented to give the study an external validity factor that would allow

28 the results to be generalized to a population of small tourism business in the Indianapolis
area.
Design of the Study and Instrument
This research tested multiple predictors previously considered in other studies
investigating the support for tourism development. Least squares multiple regression
analysis was used to demonstrate the interrelationships and elements that affect support
of tourism development. Each factor was theoretically linked to the model, and the model
depicts the theoretical concept of the causal connections.
The study developed a comparative research methodology using similar survey
question items and themes from earlier work by a number of notable researchers in the
areas of small business, economic development, and tourism (Bastakis, et al., 2004,
Besser, 1999; Friel, 1999; Getz & Carlsen, 2000; Jurowski & Brown, 2001; Litz &
Stewart, 2000; Page et al., 1999; Reichel & Haber, 2005; Reid et al., 2004; Schroeder,
1996; Thomas, 1998, 2000; Williams & Lawson, 2001). Variables selected for this study
were justified using previous theories and concepts presented in the small business and
tourism literature. The intent of this process was to select the minimum number of
variables that explained the most variance (Pedhazur, 1982).
The questionnaire contained 35 questions that included both closed and open-
ended questions, and continuous and categorical measurement levels (Appendix D). The
study consisted of eight independent variables and one dependent variable described in
Table 1 and Table 2.

29 Table 1
Independent Variables Used in the Study
Independent Variable Measure Level of Measurement Involvement Questions 26, 27, 28, 29,
30, 31 Interval
Ownership Motivation Question 8 and 9 Interval –Likert scale (1-5)
Projected Performance Growth
Question 12, 14, 15, 16, 17, 18
Interval
Financial Success Questions 24, 25 Interval – Likert scale (1-5)
Clientele Base Question 22 Interval
Business Type Question 1 (8 categories) Categorical
Business Ownership Question 3 (6 categories) Categorical
Business Location Question 2 (7 categories) Categorical
Table 2
Dependent Variable Used in the Study
Dependent Variable Measure Level of Measurement
Support for Tourism Development
Question 35 (8 items) Interval – Likert scale (1-5)
The validity of a study is an indication that the instrument measures what it is
intended to measure, while reliability refers to whether the instrument yields consistent
results (Patten, 2002). Validity has been defined in terms of appropriateness, usefulness,
meaningfulness, and truthfulness (Fraenkel & Wallen, 2003). Determining content
validity, or the appropriateness of the content, and face validity, judgment as to whether
an instrument appears legitimate, is important for any project.

30
Steps were implemented to improve both types of validity through multiple ways.
First, multiple questions were created to evaluate each predictor and the outcome
variable. Second, the format and content of the survey were reviewed by four tourism
professionals for appropriateness and usefulness. Next, the questionnaire was pilot tested
to a small sample of small tourism business owners who were asked to identify confusing
or inappropriate items, themes, or questions. The intent of the review was to verify the
directions and ensure statements compiled in the survey are understandable, clear, and
concise.
Method of Analysis
The analysis of the data was conducted using Statistical Package for Social
Sciences (SPSS). Mean scores and standard deviations were initially computed, and a
variety of descriptive statistics were reviewed and reported. Assumptions including
normality of the distribution, homoscedasticity, linearity, and multicollinearity were each
evaluated. Additional multivariate statistical techniques, such as factor analysis and
determination of correlation coefficients, were used to enhance the predictive accuracy.
Using least squares regression analysis, the regression coefficients were estimated so as
to minimize the total of the sum of the squared residuals. This process allowed for the
selection of the best independent variables to be used in the model (Hair, Anderson,
Tatham, & Black, 1998).
The Proposed Model
Social and behavioral researchers have shown growing interest in studying
causation among variables (Pedhazur, 1982). Models are typically constructed as a
process by which one can visualize interrelationships and directional relationships among

31 factors. Model building has been used extensively by those looking to explain the
relationship among tourism impacts, perceived benefits and costs, resident quality of life,
attitudes, support for tourism, and a number of other variables.
There are six types of relationships in simple causal modeling: (a) direct causal
relationship, where one variable X directly causes another Y, (b) indirect causal
relationship, where X exerts a causal relationship on Y but only through its impact on Z,
(c) spurious relationship, where X and Y are related because of a common cause Z, (d)
bi-directional causal relationship, where X has a causal relationship on Y and Y has a
causal relationship on X, (e) unanalyzed relationship, where there is a relationship
between X and Y, but the relationship is unspecified, and (f) moderated causal
relationship, where the relationship between X and Y is moderated by Z, a third variable
(Jaccard, Turrisi, & Wan, 1990). In this study, a spurious relationship was observed as
the X variables in the proposed model are all related to a common theme, support of
tourism development.
A research model project is used to develop a new model or to test an existing
model and provides a systematic process for problem solving and decision making. As
described by the U.S. Environmental Protection Agency (2005), a research model
involves six important descriptive steps: (a) product description, including the scope,
purpose, objectives and participant roles, (b) model description, including the theoretical
approach and/or mathematical relationship between variables, (c) model development,
including code development, technology requirement, and model documentation, (d)
model calibration, or process of refining the model, (e) model assessment or validation,
and (f) references.

32
This study proposes a model for investigating the support of tourism development
given the unique characteristics, or factors, that describe and influence small tourism
business using the six steps outlined above. The proposed model is shown in Figure 2.
The product description of the model includes eight independent variables, five of which
are continuous variables and three of which are categorical variables.
Based on a priori research findings and a number of theoretical approaches,
support of tourism development may be coded as a number of predictors, including civic,
community or professional involvement (X1), motivation of the business ownership (X2),
the potential growth and performance of the establishment (X3), financial success (X4),
and sources of income for the small business firm (X5). Three categorical variables,
business type (X6), ownership (X7), and location (X8) have been added to the model to
determine differences in the sample’s perspectives based on these different segments.
Model refinement, validation, and assessment will be addressed in subsequent studies.

33
X2
X5
X3
X6X7
X8
Z2
Z1
Y1
X4
X1 Unmeasured Variables
KEY Independent Variables X1= Involvement X2= Motivation X3= Projected Growth X4= Financial Success X5= Clientele Base X6= Business Type X7= Business Ownership X8= Business Location Dependent Variable Y1 = Support of Tourism Development Unmeasured Variables Z1= Increased Tourism Z2 = Increased Economic Impact
Figure 2: The Proposed Model

34
Summary
This chapter was primarily focused on the research design for this study. It
contained a detailed explanation of the study’s arrangements and site, including an
overview of the six cultural districts. Selection of subjects and definition of small tourism
business was presented in the second section. The procedures for data collection,
including the human subject approval were reviewed, and the details of the survey
instrument’s distribution and collection were discussed. A thorough discussion of the
design of the study and instrument was developed based on a priori studies and proposed
theories. Procedures for data analyses involving a number of multivariate statistical
techniques were provided. Lastly, the proposed model provided a macro framework
focused at the local urban level.
The outcome of the project derived generalizations regarding small tourism
business and support of tourism, while questioning a number of previous assumptions
and conclusions on this topic. This research paper aimed to present a descriptive picture
of small tourism business in Indianapolis and to present small tourism business owners’
viewpoints on how to approach future tourism development.

35
Chapter 4
DATA ANALYSIS
The problem in this study was to construct a testable model by investigating the
extent to which small tourism businesses support tourism development in Indianapolis.
The importance of the study was that support for tourism development leads to increased
tourism activities and inevitably increased economic benefit to the community. Eight null
hypotheses were tested in this project and are reported in this chapter.
The purpose of this study was to identify the small tourism business factors that
explain and predict support for tourism development in a community. The objectives of
this research are stated in the following two research questions:
1. To what extent can the variation of support for tourism development (dependent
variable) be explained by the set of independent variables: type of business activity, type
of business ownership, motivation of business ownership, financial success, projected
growth, business geographical location, its customer base, and business’ level of
community involvement?
2. What is the best linear combination of independent variables to predict support of
tourism development in this sample?
The analysis of data was organized in this chapter according to the following
topics: (a) response rate for this study, (b) demographic profile of small tourism
businesses in Indianapolis, (c) screening of the data, (d) confirmatory factor analysis
using principal components analysis, (e) labeling of the factors, (f) multiple regression
analysis pertaining to the predictability of tourism support, and (g) summary.

36
Response Rate
The study’s population consisted of approximately 315 small businesses located
in one of the six cultural districts: Broad Ripple Village, Wholesale, Fountain
Square/Southeast Neighborhood, Downtown Canal, Mass Avenue, and Indiana Avenue
Cultural District. The sample consisted of small tourism businesses that represented an
art gallery or studio, independent restaurant, historic attraction, museum,
performing/visual art center, unique gift shop, or accommodation. The entire procedure
yielded a total of 161 surveys (51.1 % of the population). Of those, 152 were valid and
usable (48.2 % of the population). Nine surveys were discarded due to participants either
not representing the sample criteria or returning the surveys with substantial incomplete
data.
Each questionnaire was personally delivered by the research team to the small
business in an attempt to meet the owner or key contact. The researcher inquired about
who would be the most qualified to complete the information, ensuring that they met the
sample criteria, and asked for a time and date to return to collect the instrument. A
follow-up phone call was made prior to the second visit to ensure the survey was
completed. If the completed instrument was still not available, a second visit was
scheduled to encourage participation. A personalized thank-you note was delivered when
the survey was collected.
Screening the Data
As suggested by Tabachnick and Fidell (2001), data from the study was screened
for a number of potential problems in relation to accuracy of the data, missing data,

37 normality, absence of outliers, absence of multicollinearity and singularity, and
factorability.
A thorough review of the descriptive statistics exposed values not representative
of the minimum and maximum values of the 35 questions on the questionnaire. The
review did indicate some inaccurate data points that were essentially mistakes in data
entry and were appearing as outliers. When values outside the minimum or maximum
values were found, the original surveys were checked and values were corrected in the
data set eliminating the concern of outliers and inaccuracy of the data.
Data from the returned instruments were reviewed for patterns of missing data.
The missing data, as discussed in the descriptive statistics section, were in categories or
questions where only a small business owner completing the survey could answer.
Sections on small business ownership motivations and projected business growth were
left blank when the small business owner was not able to complete the survey. Therefore,
the mean replacement procedure was used to handle missing data during the factor
analysis procedure.
Multivariate normality is the assumption that all variables, and all combinations
of the variables, are normally distributed. This is typically assessed through a review of
skewness and kurtosis of the variables. However, principal component analysis has no
distributional assumptions (Fabrigar, Wegener, MacCallum, & Strahan, 1999).
The Kaiser-Meyer-Oklin (KMO) of Sampling Adequacy value was also
calculated to predict if the data would likely factor well and if the sample was adequate
for factor analysis. A score of .701 was reported in the KMO statistic, exceeding the
recommended value of .6 (Tabachnick & Fidell, 2001). The Barlett’s Test of Sphericity
38 was also calculated and showed significance (p=.000), testing all factors together and
each factor separately, against the hypothesis that the correlations in a correlation matrix
are zero (Tabachnick & Fidell, 2001). Based on the results of these tests, absence of
multicollinearity and singularity is met, and factor analysis is appropriate.
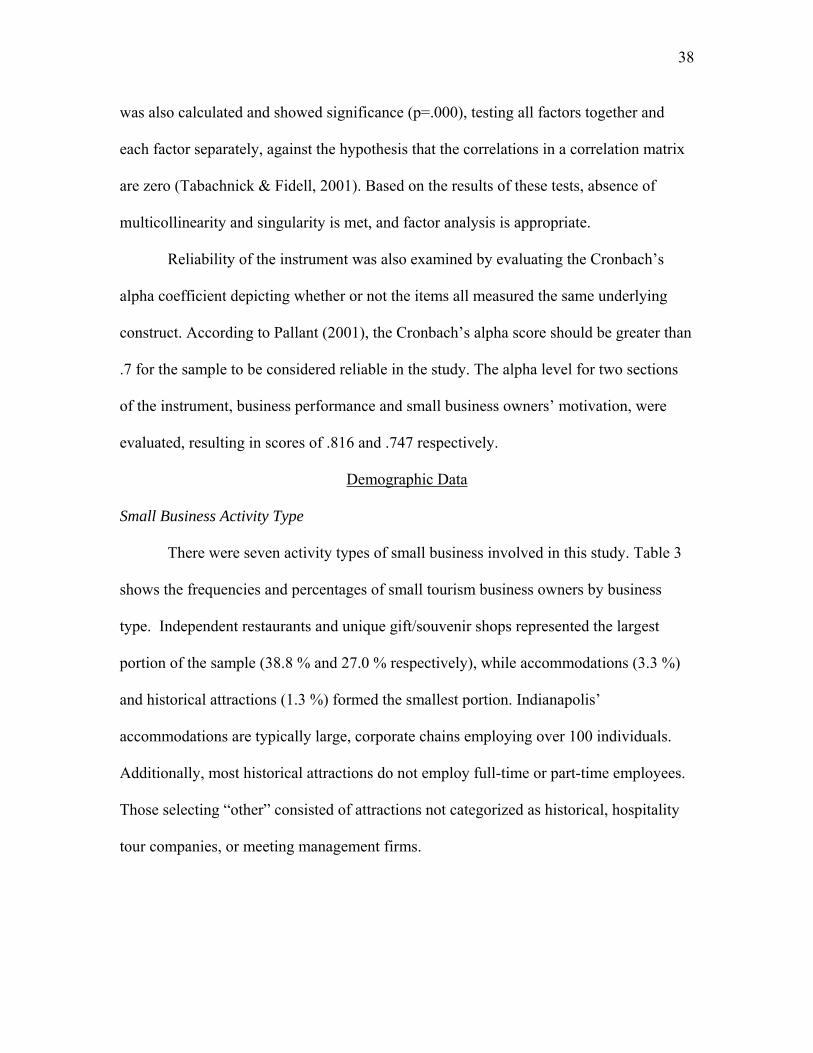
Reliability of the instrument was also examined by evaluating the Cronbach’s
alpha coefficient depicting whether or not the items all measured the same underlying
construct. According to Pallant (2001), the Cronbach’s alpha score should be greater than
.7 for the sample to be considered reliable in the study. The alpha level for two sections
of the instrument, business performance and small business owners’ motivation, were
evaluated, resulting in scores of .816 and .747 respectively.
Demographic Data
Small Business Activity Type
There were seven activity types of small business involved in this study. Table 3
shows the frequencies and percentages of small tourism business owners by business
type. Independent restaurants and unique gift/souvenir shops represented the largest
portion of the sample (38.8 % and 27.0 % respectively), while accommodations (3.3 %)
and historical attractions (1.3 %) formed the smallest portion. Indianapolis’
accommodations are typically large, corporate chains employing over 100 individuals.
Additionally, most historical attractions do not employ full-time or part-time employees.
Those selecting “other” consisted of attractions not categorized as historical, hospitality
tour companies, or meeting management firms.

39 Table 3 Respondents by Business Activity Type
Type of Small Business Frequency %
Art Gallery or Studio 15 9.9
Restaurants 59 38.8
Historic Attraction 2 1.3
Museum 7 4.6
Performing/Visual Arts 10 6.6
Unique Gift or Souvenir Shops 41 27.0
Accommodations 5 3.3
Other 13 8.5
TOTAL 152 100.0
Business Location by Cultural District
Respondents were asked to indicate the location of the business: (a) Broad Ripple
Village, (b) Wholesale, (c) Fountain Square, (d) Canal/Downtown, (f) Massachusetts
Avenue, or (g) Indiana Avenue. Small tourism business owners and managers located in
the Broad Ripple Village district represented the largest percentage of respondents of the
project (28.5 %), closely followed by Massachusetts Avenue business owners (23. 2 %).
These two districts make up 190 of the 315 businesses in the sample, as they are by far
the largest two cultural districts in the Indianapolis area. Table 4 shows the frequency and
percentage of the response by each cultural district location returning the survey
instrument.

40 Table 4
Respondents by Business Location
Cultural District Total Number Received % Total Response %
Broad Ripple 109 43 28.5 39.4
Wholesale 33 18 11.9 54.5
Fountain Square 41 20 13.2 48.7
Canal/Downtown 32 21 13.9 65.6
Mass Avenue 81 35 23.2 43.2
Indiana Avenue 19 8 5.3 42.1
Don’t know 6 4.0
TOTAL 315 151 100.0 48.2
Types of Business Ownership
As indicated in Table 5 below, individually-owned, for-profit business owners
make up the largest portion of the sample, 45.4 %. Family-owned, for-profit and non- or
not-for profit equally represented 14.5 % of the respondents, and jointly-owned, for-profit
business made up 11.8 % of the sample. Most of those selecting “other” noted they were
functioning as a small business, but were owned and managed by a corporation.

41 Table 5
Respondents by Business Ownership Type
Type of Ownership Frequency % Individually-owned, for profit 69 45.4
Family-owned, for profit 22 14.5
Non- or not-for profit 22 14.5
Jointly-owned, for profit 18 11.8
Part of a chain or franchise 11 7.2
Other (Corporate) 10 6.6
TOTAL 152 100.0 Title of the Respondent
Of those subjects completing the survey, 95 of the 152 indicated they were a sole
or joint owner of the small tourism business, representing 32.9 % and 29.6 %
respectively. Additionally, 26.3 % of the sample noted they were the manager or
supervisor of the business, yet did not have any ownership responsibilities or obligations
to the business. Those selecting “other” indicated group sales director, coordinator,
employee, event manager, or operations director as their primary role. Table 6 presents
this breakdown of respondents by title.

42 Table 6
Respondents by Title Type
Type of Title Frequency % Sole Owner 50 32.9
Joint Owner 45 29.6
Manager 40 26.3
Other 17 11.2
TOTAL 152 100.0 Gender of the Business Owner or Manager
Table 7 presents the small business owners or managers by gender. Men and
women were evenly distributed, with 74 women and 70 men represented. However, this
data may be skewed as some who selected joint-owner or family-owned in the question
above, were allowed to only select man or woman for this question. Because this question
allowed for only one response, those small tourism businesses that were jointly-owned by
a female-male couple or family-owned tended to represent only the individual completing
the survey.
Table 7
Respondents by Gender
Gender Frequency %
Male 70 48.6
Female 74 51.4
TOTAL 144 100.0

43 Age of Business Owner or Manager The age of the respondents reflected the maturity and stability needed to start a
small business and the energy level needed to work and sustain the establishment. The
majority of small business owners are between the ages of 36 and 50 (42.7 %), while
those 51 to 65 made up the second largest group (25.9 %). According to Table 8, very
few small business owners or managers are under the age of 25 or over the age of 66,
2.6% and 4.9 % respectively.
Table 8 Respondents by Age Age Frequency % 18-25 4 2.6
26-35 34 23.8
36-50 61 42.8
51-65 37 25.9
66+ 7 4.9
TOTAL 143 100.0
Years in Business/Working Experience
Table 9 describes the number of years that small tourism business owners have
operated his/her establishment. The largest percentage of respondents reported that they
individually owned or jointly owned a small business less than two years (32.8 %). Those
owning a business less than five years represented over 55.5 % of the sample. Notably, a
number of owners, 21.1 %, have been operating their own business for 11 to 20 years.
Only 119 of the 152 respondents in the survey completed this question. Many of those

44 indicating the business was owned by a franchise, chain or corporation chose not to
respond.
Table 9
Respondents by Years in the Business/Working Experience
Years Frequency Valid percentage
0-2 39 32.8
3-5 27 22.7
6-10 22 18.4
11-20 25 21.1
20+ 6 5.0
TOTAL 119 100.0
Motivation for Starting Small Tourism Business The study’s participants were motivated by several variables when starting their
own small tourism business. Each respondents’ motivations were measured on a 1-5
Likert scale, with 1 representing not important, 2 somewhat important, 3 moderately
important, 4 very important, and 5 extremely important. The selection “to do what I enjoy
while making a living” received the most favorable mean score, 4.48, with “recognized a
market need for business” as a close second (4.06). Other positively viewed responses
include “to be my own boss” (3.83), “to live in the right environment” (3.66), “to give
back to the community” (3.58), and “to permit me to become financially independent”
(3.56). Factors regarding semiretirement (1.73), unemployment (1.88), retirement income
(2.84), and prestige (2.71) were viewed as less important to small business owners. These

45 findings are not surprising, as noted above, many of the tourism small business owners
are younger than 50 years of age. Such things as “appealing lifestyle,” “business
investment,” “meeting people,” “thought it would be fun,” “keeping my family together”
and “to make lots of money” were only moderately important to this sample of small
business owners.
Many respondents to the survey who were not the sole or joint owner opted not to
answer this set of questions, selecting the “not applicable or does not apply” choice. This
is the reason for the lower sample response on Table 10 on the concurrent page.
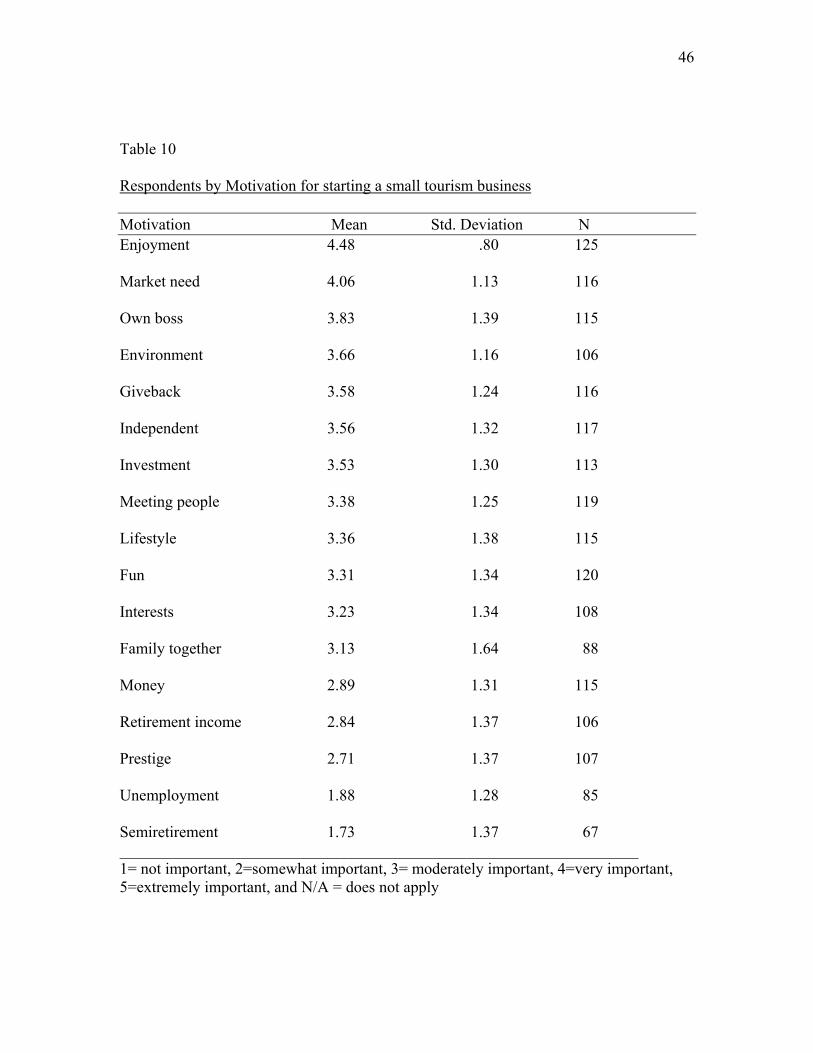
46
Table 10
Respondents by Motivation for starting a small tourism business
Motivation Mean Std. Deviation N Enjoyment 4.48 .80 125
Market need 4.06 1.13 116
Own boss 3.83 1.39 115
Environment 3.66 1.16 106
Giveback 3.58 1.24 116
Independent 3.56 1.32 117
Investment 3.53 1.30 113
Meeting people 3.38 1.25 119
Lifestyle 3.36 1.38 115
Fun 3.31 1.34 120
Interests 3.23 1.34 108
Family together 3.13 1.64 88
Money 2.89 1.31 115
Retirement income 2.84 1.37 106
Prestige 2.71 1.37 107
Unemployment 1.88 1.28 85
Semiretirement 1.73 1.37 67 _________________________________________________________________ 1= not important, 2=somewhat important, 3= moderately important, 4=very important, 5=extremely important, and N/A = does not apply
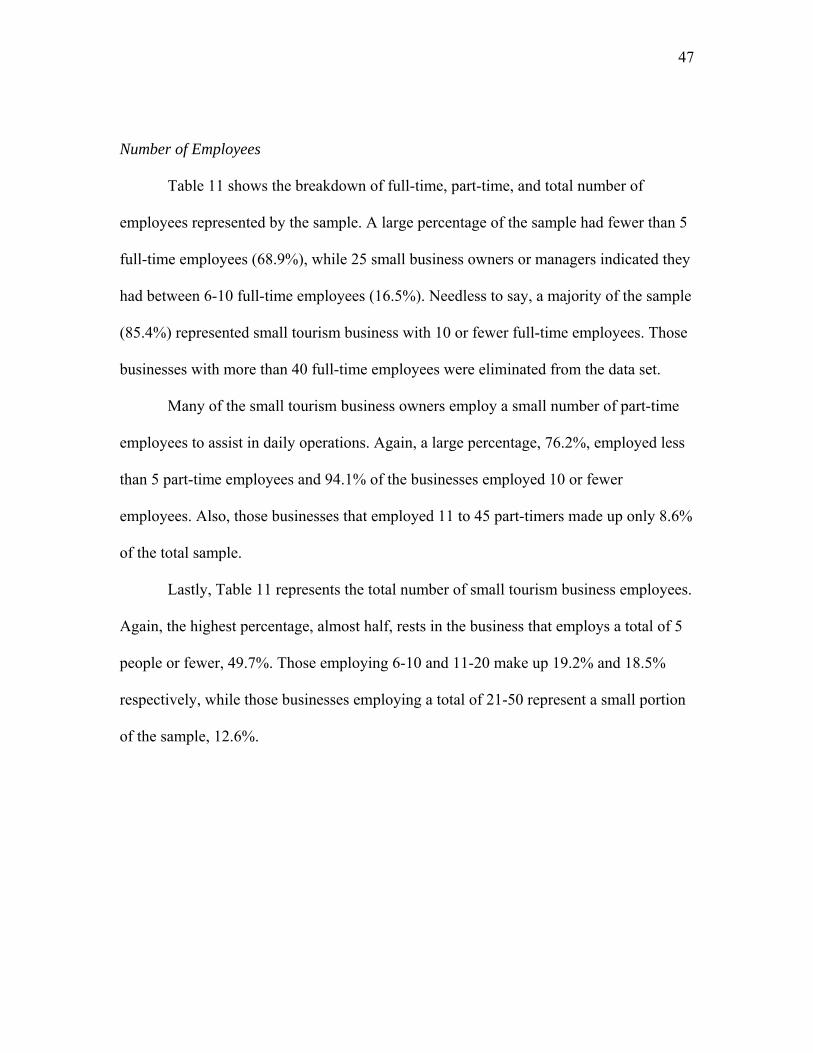
47
Number of Employees
Table 11 shows the breakdown of full-time, part-time, and total number of
employees represented by the sample. A large percentage of the sample had fewer than 5
full-time employees (68.9%), while 25 small business owners or managers indicated they
had between 6-10 full-time employees (16.5%). Needless to say, a majority of the sample
(85.4%) represented small tourism business with 10 or fewer full-time employees. Those
businesses with more than 40 full-time employees were eliminated from the data set.
Many of the small tourism business owners employ a small number of part-time
employees to assist in daily operations. Again, a large percentage, 76.2%, employed less
than 5 part-time employees and 94.1% of the businesses employed 10 or fewer
employees. Also, those businesses that employed 11 to 45 part-timers made up only 8.6%
of the total sample.
Lastly, Table 11 represents the total number of small tourism business employees.
Again, the highest percentage, almost half, rests in the business that employs a total of 5
people or fewer, 49.7%. Those employing 6-10 and 11-20 make up 19.2% and 18.5%
respectively, while those businesses employing a total of 21-50 represent a small portion
of the sample, 12.6%.
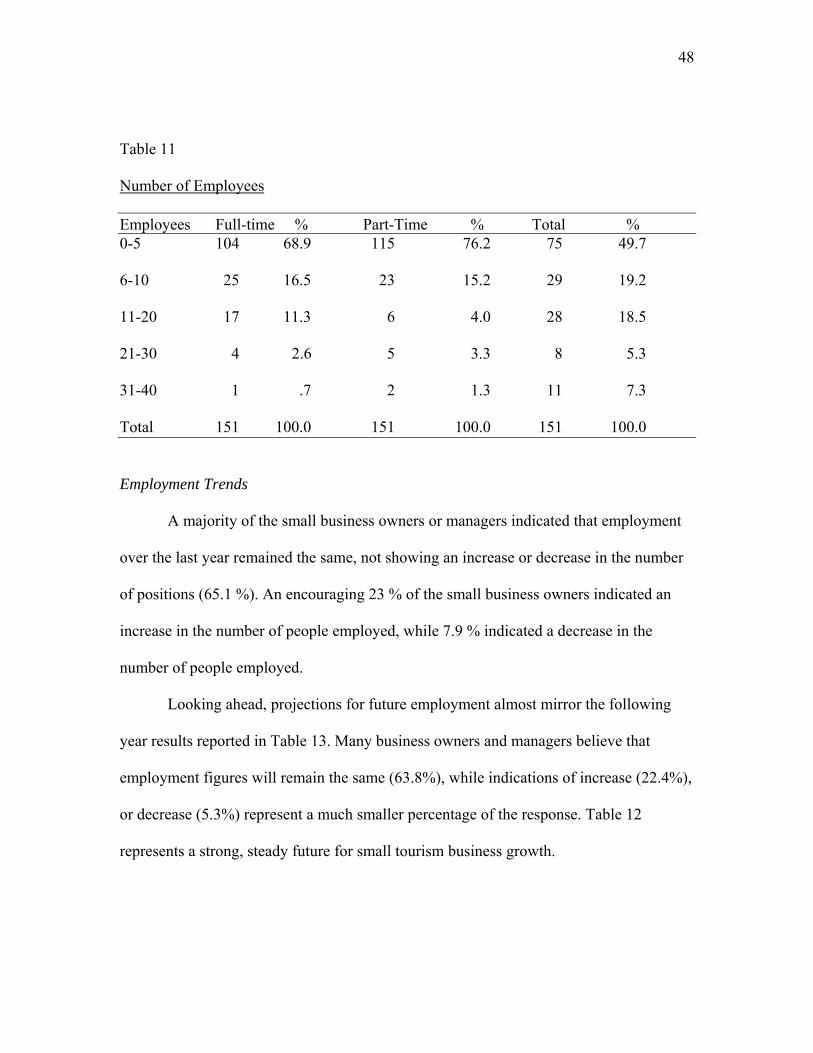
48
Table 11
Number of Employees
Employees Full-time % Part-Time % Total % 0-5 104 68.9 115 76.2 75 49.7
6-10 25 16.5 23 15.2 29 19.2
11-20 17 11.3 6 4.0 28 18.5
21-30 4 2.6 5 3.3 8 5.3
31-40 1 .7 2 1.3 11 7.3
Total 151 100.0 151 100.0 151 100.0
Employment Trends
A majority of the small business owners or managers indicated that employment
over the last year remained the same, not showing an increase or decrease in the number
of positions (65.1 %). An encouraging 23 % of the small business owners indicated an
increase in the number of people employed, while 7.9 % indicated a decrease in the
number of people employed.
Looking ahead, projections for future employment almost mirror the following
year results reported in Table 13. Many business owners and managers believe that
employment figures will remain the same (63.8%), while indications of increase (22.4%),
or decrease (5.3%) represent a much smaller percentage of the response. Table 12
represents a strong, steady future for small tourism business growth.

49
Table 12
Employment last 12 months
Change Frequency %
Increased 35 23.0
Remained the Same 99 65.2
Decreased 12 7.9
Don’t Know 6 3.9
TOTAL 152 100.0
Table 13
Employment over next 12 months
Change Frequency %
Increase 34 22.4
Remain the Same 97 63.8
Decrease 8 5.2
Don’t Know 13 8.6
TOTAL 152 100.0
Customer/Revenue Trends

50 As shown in Table 14, a majority of small businesses reported an increase in the
number of customers served (57%) and overall business revenue (53.3%). Also, 41.7 %
of the subjects noted an increase in the average spending of customers over the last 12
months. A moderate percentage experienced flat line growth noting their number of
customers, average customer spending, and overall business revenue remained the same
(21.2%, 35.8%, and 19.3%). A small but significant number of small tourism business
owners saw decreases in these categories (17.9% in number of customers, 15.2% in
average customer spending and 19.3% in overall business revenue), and 4.0% did not
know their trends in terms of number of customers and overall business spending.
A large percentage of small business owners and managers are predicting an
increase in the number of customers (64.2%), average customer spending (41.3%) and
overall business revenue (63.6%). Table 15 represents a positive trend in all three
categories with over 80% of the sample forecasting increases or steady growth. A higher
percentage indicated they “don’t know” in terms of business trends. This may be
reflective of the level of employee completing the instrument. Those who are managers
or supervisors may not be privy to financial information or feel comfortable making
future predictions.
Table 14

51 Customer/Revenue Trends- The Last 12 Months
Increased Same Deceased Don’t Know
Number of Customers 86 57.0 32 21.2 27 17.9 6 4.0
Average Spending 63 41.7 54 35.8 23 15.2 11 7.3
Overall Bus Revenue 80 53.3 35 23.3 29 19.3 6 4.0
Table 15
Customer/Revenue Trends- The Next 12 Months
Increase Same Decease Don’t Know
Number of Customers 97 64.2 35 23.2 9 6.0 10 6.6
Average Spending 62 41.3 68 45.8 8 5.31 2 8.0
Overall Bus Revenue 96 63.6 30 19.9 11 7.3 14 9.3 Obstacles for Improved Performance
Small tourism businesses face a number and variety of obstacles in attempting to
improve their overall business performance, as shown in Table 16. Indianapolis is known
for its large number of corporate and chain businesses, especially in the hospitality
industry. Therefore, it is no surprise that competition from large business was the most
frequently selected obstacle. Owners and managers also felt they did not receive enough
support from the tourists. On the financial front, inflation, especially rising gas and
transportation prices, and poor cash flow were seen as serious issues. On the other hand,
interest rates and limited access to finances were not viewed as concerning.
Table 16
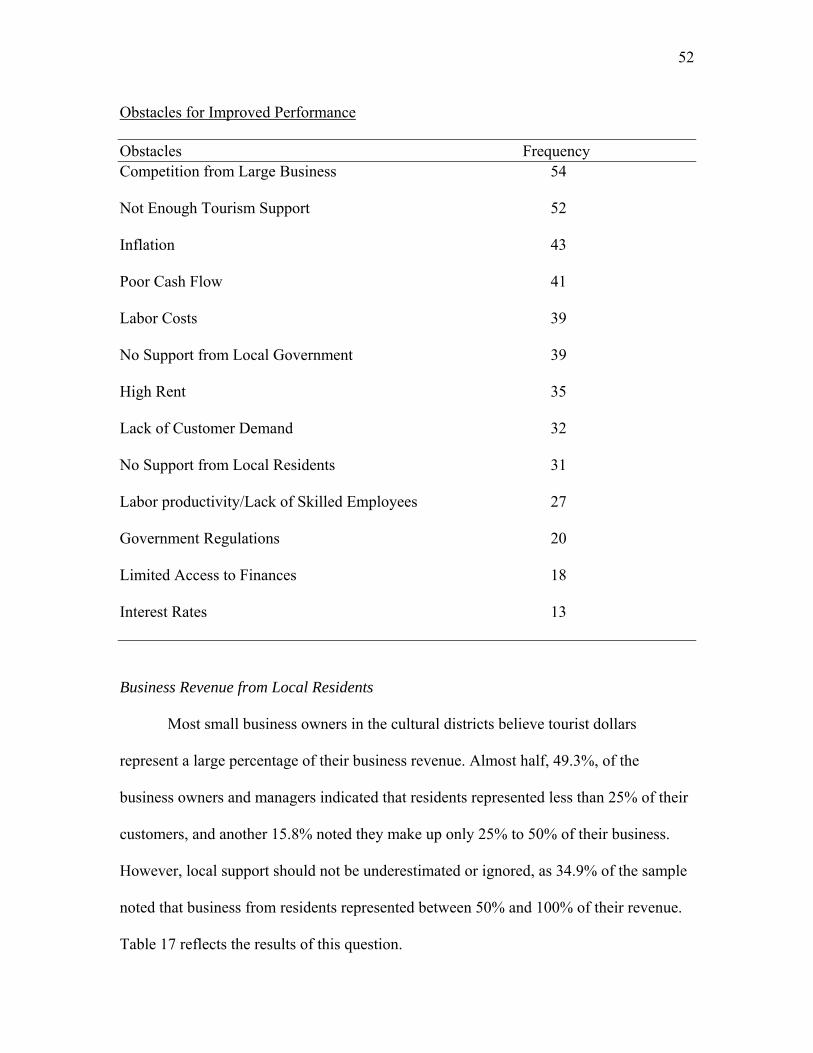
52 Obstacles for Improved Performance
Obstacles Frequency Competition from Large Business 54
Not Enough Tourism Support 52
Inflation 43
Poor Cash Flow 41
Labor Costs 39
No Support from Local Government 39
High Rent 35
Lack of Customer Demand 32
No Support from Local Residents 31
Labor productivity/Lack of Skilled Employees 27
Government Regulations 20
Limited Access to Finances 18
Interest Rates 13
Business Revenue from Local Residents
Most small business owners in the cultural districts believe tourist dollars
represent a large percentage of their business revenue. Almost half, 49.3%, of the
business owners and managers indicated that residents represented less than 25% of their
customers, and another 15.8% noted they make up only 25% to 50% of their business.
However, local support should not be underestimated or ignored, as 34.9% of the sample
noted that business from residents represented between 50% and 100% of their revenue.
Table 17 reflects the results of this question.

53 Table 17
Business Revenue from Local Residents
Years Frequency % Less than 25% 75 49.3
25-50 % 24 15.8
50-75 % 31 20.4
75-100% 22 14.5
Total 152 100.0
Total Business Revenue The results of total business revenue are reported in Table 18. Response for this
question was equally distributed over the four categories. Businesses reporting $0 to
$25,000 in business revenue characterized 15.2% of the sample, $25,000 to $75,000
characterized 29.0% of the sample, $75,000 to $150,000 characterized 22.1% of the
sample, and $150,000 to $250,000 characterized 33.8% of the sample. Small tourism
businesses reporting more than $250,000 in business revenue were removed from the
sample based on the study’s established criteria.
Table 18 Total Business Revenue

54 Revenue Dollars Frequency % $0-25,000 22 15.2
$25,000-75,000 42 29.0
$75,000-150,000 32 22.1
$150,000-250,000 49 33.7
Total 145 100.0
Business Profitability relative to Significant Competitors
As reported in Table 19, competition from larger business is one of small tourism
business’ greatest obstacles. When asked how small tourism business would rate their
business profitability relative to significant competitors, owners and managers indicated a
mean score of 2.601 (between low and moderate profitability) in 2003, an increase to
2.887 in 2004 and a moderate rating of 3.035 in 2005. The scores indicate small tourism
business owners and managers are concerned about their ability to compete with other
businesses. There is a positive trend from the years 2003 to 2005 in that businesses view
themselves as improving their profitability and ability to compete in this short time span.
Only 118 of the 152 participants were able to answer this question regarding profitability
in 2003, as many have been in business for only a year or two. This is also the reason the
sample response is lower for the 2004 and 2005 question. Some subjects simply did not
know how they measured against their competitors and chose to leave the question blank.
Table 19
Business Profitability relative to Significant Competitors

55 Year M SD N 2003 2.601 1.038 118
2004 2.887 1.012 133
2005 3.035 1.108 140 1=extremely low profitability, 2=low profitability, 3=moderate profitability, 4=high profitability and 5=extremely high profitability. Level of Business Performance Respondents were then asked to rate their level of business performance success
as measured by success in creating customer satisfaction, success in developing positive
reputation, success in introduction of new products, success in generating year-round
profits, success in creating awareness of a tourism product, and effective response to
changes in the market. Table 20 charts the level of business performance using a scale of
1-5 with 1 being extremely low performance and 5 being extremely high performance.
Many noted high performance in developing a positive reputation and in creating
customer satisfaction, 4.326 and 4.298 respectively. Due to the lack of vision and limited
understanding of financial management, many indicated that generating year-round
profits (mean score of 2.704), ability to create awareness of tourism product (mean score
of 3.262), and the development of new products (mean score of 3.340) were challenging
for some tourism businesses and impeded performance levels.
Table 20
Level of Business Performance

56 Indicator M SD N Positive Reputation 4.326 .755 144
Customer Satisfaction 4.298 .720 144
Response Market Changes 3.388 .976 144
New Products 3.340 1.071 144
Year-Round Profit 3.262 1.112 141 Creating Awareness 2.704 1.153 142 1=extremely low performance, 2=low performance, 3=moderate performance, 4=high performance and 5=extremely high performance. Number and Type of Professional, Civic, Religious, Charitable or Volunteer Organizations Previous studies have shown that group membership may or may not be a
predictor for support of tourism development (Besser, 1999; Getz & Carlsen, 2000; Jamal
& Getz, 1995; Jurowski & Brown, 2001; Litz & Stewart, 2000; Williams & Lawson,
2001). With regard to group membership, Table 21 shows the total number of
professional, civic, religious, charitable, and volunteer organizations any owner or
manager of a small tourism business participates. Categories were defined as “no group
membership,” “member of one organization,” “member of two or three organizations,” or
“member of four or more organizations.” Over 60% of all small business owners and
managers participated in two or more organizations; 40.8% participated in 2 or 3
memberships and 25% in 4 or more organizations. Conversely, 17.8% of the sample did
not participate in any type of group or member organization, and 16.4% were involved in
only one group membership.
Tables 22, 23, and 24 categorized the types of organizations and groups that
attract small tourism businesses. Indianapolis Convention and Visitors Bureau,

57 Indianapolis Downtown, Inc., and Village, Neighborhood, District Stakeholders
Association were the three most popular choices for professional, formal memberships.
Surprisingly, the Chamber of Commerce was not frequently selected from the list of
professional opportunities, even though they characteristically attract small business
owners. The Downtown Restaurant and Hospitality Association and Indiana Originals
typically appeal only to restaurants, while the Downtown Artists and Dealers Association
attract only those interested in the arts community.
Few very small tourism business owners and managers indicated interest in civic
or service organizations, whereas several specified interest in church-related
participation, sports activity and programs, and education-based programs.
Table 21
Number of Professional, Civic, Religious, Charitable or Volunteer Organizations
Years Frequency %
No group membership 27 17.8
One membership 25 16.4
2-3 memberships 62 40.8
4 or more 38 25.0
Total 152 100.0
Table 22
Professional, Formal Membership Types

58 Membership Type Frequency Convention and Visitors Bureau 49 Indy Downtown, Inc 44 Village, Neighborhood, District Stakeholders Association 39 Merchant Association or Groups 36 Downtown Restaurant and Hospitality Association 24 Chamber of Commerce 21 Indiana Originals 12 Indiana Historical Society 10 Downtown Artists and Dealers Association 8 Table 23 Civic or Service Organizations
Membership Type Frequency Junior League 4 Kiwanis 3 Rotary 2 American Red Cross 2
Lions 1
Table 24
Community or Religious Affiliated Programs

59 Membership Type Frequency Church-related Participation 45 Sport Activity or Program 36 Education-based Programs 35 Hobby-oriented Clubs 24 Mentoring 22 Involvement in Mission and Part of Industry
Small business owners offer a unique perspective to tourism development in an
area or city. However, only rarely are they asked to contribute their viewpoints as cities
are developing their strategic mission or goals and objectives. As shown below in
Table 25, only 26.2% of the sample has been contacted by a city official or local group to
provide input into development of Indianapolis’ tourism mission. Partly due to this
disconnection between small business owners and local groups, 21.4% of the sample did
not see themselves as part of the city’s tourism industry (see Table 26).
Table 25
Contacted for Assistance in Mission Development
Frequency %
Yes 37 26.2
No 104 73.8
TOTAL 140 100.0
Table 26
Part of the City’s Tourism Industry
60 Frequency %
Yes 114 78.6
No 31 21.4
TOTAL 145 100.0
Level of Support
The mean score for each tourism area is reported in Table 27. Areas to explore
include continued development of the Indiana Convention Center, new facilities for
sports teams and events, improved transportation system and roads, cultural events,
festivals and downtown events, increased tourism and marketing dollars, increased efforts
to display public art, and increased taxes to develop infrastructure. Support for improved
transportation (mean score of 1.827) and cultural events, festivals and downtown events
(mean score of 1.894) received the highest level of support, with 1 translating to strongly
support and 4 to strongly oppose. Increased taxes to support infrastructure and support for
new facilities for sports events and teams did not fair as well, reporting a mean score of
2.887 and 2.476 respectively. Due to the business type distribution, this result should
have been expected. Food and beverage sales throughout the greater Indianapolis area
were assessed a tax increase to support construction on a new sports facility for the
Indianapolis Colts. This decision greatly impacted small business owners in the restaurant
business.
The remainder of the categories reflected the overall tourism support mean score
of 2.173 translating to a “somewhat support” rating. Mean scores listed between 2.0 to
2.2 included development for expansion of the Indiana Convention Center, outdoor

61 recreation programs and activities, increased tourism and marketing dollars, and
increased efforts to display public art.
Table 27
Level of Support Development Area M SD N Transportation 1.827 1.301 151 Cultural Events 1.894 1.391 151 Tourism Dollars 2.019 1.425 151 Convention Center 2.039 1.441 151
Outdoor Programs 2.099 1.340 151
Public Art 2.152 1.436 151
Total Tourism Support 2.173 1.062 151
Sports Facilities/Teams 2.476 1.586 151
Taxes 2.887 1.288 151 1=strongly support, 2=somewhat support 3= somewhat oppose, 4= strongly oppose and 5=don’t know.
Factor Analysis
Factor analysis is used to uncover the dimensions of a set of variables, reducing a
large number of variables to a smaller number of factors for modeling purposes. There
are two types of factor analysis: exploratory factor analysis (EFA) and confirmatory
factor analysis (CFA). Where EFA attempts to describe the data set by grouping together
correlated variables, CFA is used to test theory about latent processes and determine if
the number of factors and the loadings of indicator variables on them conform to what is
expected on the basis of pre-established theory (Tabachnick & Fidell, 2001). According

62 to Kim and Mueller (1978), “a minimum requirement of confirmatory analysis is that one
hypothesize beforehand the number of factors in the model, but usually also the research
will posit expectations about which variables will load on which factors” (p. 55).
Because few researchers “collect and analyze data without an a priori idea of how
the variables are related” (Floyd & Widaman, 1995 in Costello & Osborne, 2005, p. 2)
and in this study particular patterns of relationships between the variables were
established, confirmatory factor analysis was used as the data analysis approach (Fabrigar
et al., 1999).
Principal component analysis is used to analyze the total variance, not excluding
error and unique common variance, for each observed variable. The goal of this
technique is to extract maximum variance from the data with a few components, not
discriminating between shared and unique variance, and to ensure that each additional
component accounts for less variance than the previous ones. Using PCA will determine
how many dimensions account for the most variance, while reducing the number of
predictors in multiple regression analysis. PCA is a unique mathematical solution,
producing an empirical summary of the data set (Tabachnick & Fidell, 2001).
The correlation matrix was generated and reviewed to show the strength of inter-
correlations among the variables. PCA should produce some correlation coefficients
exceeding .30 to be deemed appropriate for this type of analysis (Tabachnick & Fidell,
2001). The correlation matrix revealed several coefficients and patterns of data greater
than .30 and the researcher proceeded using PCA.
Table 28 shows the total variance explained by the PCA analysis before rotation.
An initial analysis of the data revealed the presence of eight factors, which explained
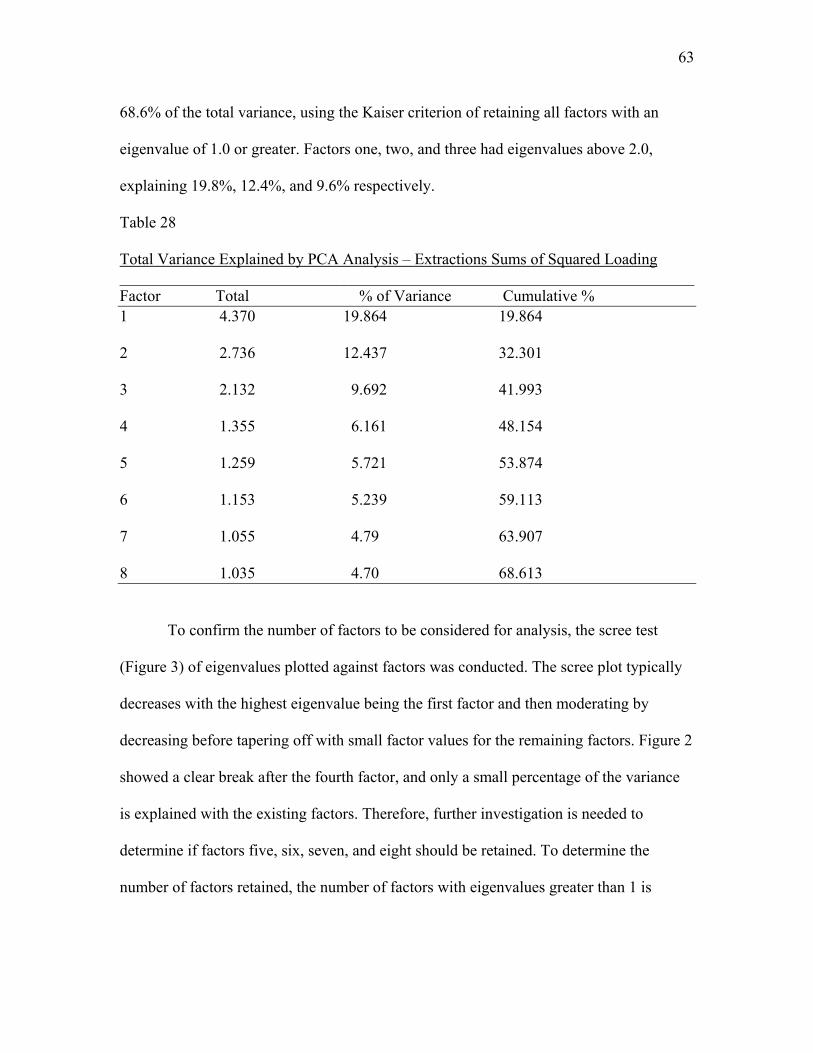
63 68.6% of the total variance, using the Kaiser criterion of retaining all factors with an
eigenvalue of 1.0 or greater. Factors one, two, and three had eigenvalues above 2.0,
explaining 19.8%, 12.4%, and 9.6% respectively.
Table 28
Total Variance Explained by PCA Analysis – Extractions Sums of Squared Loading ________________________________________________________________________ Factor Total % of Variance Cumulative % 1 4.370 19.864 19.864 2 2.736 12.437 32.301 3 2.132 9.692 41.993 4 1.355 6.161 48.154 5 1.259 5.721 53.874 6 1.153 5.239 59.113 7 1.055 4.79 63.907 8 1.035 4.70 68.613
To confirm the number of factors to be considered for analysis, the scree test
(Figure 3) of eigenvalues plotted against factors was conducted. The scree plot typically
decreases with the highest eigenvalue being the first factor and then moderating by
decreasing before tapering off with small factor values for the remaining factors. Figure 2
showed a clear break after the fourth factor, and only a small percentage of the variance
is explained with the existing factors. Therefore, further investigation is needed to
determine if factors five, six, seven, and eight should be retained. To determine the
number of factors retained, the number of factors with eigenvalues greater than 1 is

64 between the number of variables divided by 3 and by 5. In this case, the number of
factors should fall between 4 and 7.
22212019181716151413121110987654321
Component Number
5
4
3
2
1
0
Eige
nval
ue
Figure 3: Scree Plot of Eigenvalues for PCA Analysis To strengthen the argument to retain between four and seven factors, a review of
the initial component matrix was conducted. This matrix in Table 29 shows the factor
loadings for the 22 items on the eight factors identified by the Kaiser criterion. All eight
factors loaded strong, with several above the .40 mark. Notably, factors one, two, and
three had five or more items load on the factor. On the other hand, factors five, six, and
seven had only two items loading on the factor warranting further investigation after
rotation.
Table 29

65 Principal Component Analysis: Component Matrix Components
Items 1 2 3 4 5 6 7 8 BP change .471 Investment .544 -.439 Own boss .619 Lifestyle .407 .517 Enjoyment .468 .495 .418 Retirement .487 Profit .616 Awareness .461 Change .447 .568 Membership -.478 Customer Sat .650 .548 Pos Reputation .451 .609 .528 New Projects .563 .510 .532 % Tourists
Business Rev -.499 Antic. Customers -.582 .402 Antic. Revenue -.659 Trend Customers -.584 .540 Trend Revenue -.603 .432 Employ Now -.510 .589 Employ Future -.575 .439 Giveback .622 -.434 Because unrotated factors are difficult to interpret, a rotation serves to make the
output more understandable. The rotation method simply alters eigenvalues of particular
factors, more clearly differentiating the factor loadings of each variable. An oblique
rotation on the data was performed to rotate the axes to produce factor loadings that
minimize the covariance of the squared loading, allowing correlations among factors. The
oblique rotation “relaxes orthogonality in order to gain simplicity in the interpretation”
(Abdi, 2003, p. 5). Because there are theoretical grounds that the factors may be
correlated, an oblique technique was applied. The intent of Promax rotation is made to fit

66 the target matrix, producing a pattern matrix containing coefficients that represent unique
contributions.
Principal factors extraction using Promax rotation was performed on 22 items
from the survey measuring a variety of indicators of tourism development support to
provide a better interpretation of the factors’ meanings. The factor must also have an
interpretable dimension explaining the pattern of relationships among the items loading
on it. Factors considered had loading scores of .40 or above.
The rotated solution revealed strong factor loadings and a number of items on the
eight factors. Nine variables (“change in business performance,” “to do what I enjoy
while making a living,” “to provide a retirement income,” “trends in current number of
customers,” “trends in current customer revenue,” “effective responsive to changes in the
market,” “success in ongoing developing of new projects,” “amount of business revenue
generated,” “trends in future employment,” and “percentage of business revenue
generated by tourists”) were identified as complex variables, those loading on multiple
factors.
As noted above in the initial factor loading analysis, factors one, two, and three
retained more than five items loading on the component, while factors five and eight
were explained only by two items. According to Comrey and Lee (1992), factor loading
of more than .71 is considered excellent, .63 very good, .55 good, .45 fair, and .32 poor.
Each factor was individually reviewed in terms of the number of items loading on the
factor, the strength of those loadings, and if the factor had an interpretable meaning.
Table 30 shows the structure matrix, the interpretable data after Promax rotation.

67 Table 30
Principal Component Analysis: Structure Matrix Components
Items 1 2 3 4 5 6 7 8 BP change -.421 .573 Investment .674 Own boss .742 Lifestyle .700 Enjoyment .593 .585 Retirement .469 .409 Profit .587 Awareness .693 Change .713 .404 Membership -.610 Customer Sat .916 Pos Reputation New Projects .789 .925 % Tourists .433 .469
Business Rev -.436 .517 Antic. Customers .851 Antic. Revenue .860 Trend Customers .783 -.489 Trend Revenue .740 -.511 Employ Now .790 Employ Future .408 .695 Giveback .844
Labeling Factors
After reviewing the above information, five factors were retained for further
analysis. It was determined that factors six, seven, and eight did not reveal a meaningful
label; hence, they were dropped from further analysis. Tables 31-35 describe the five
factors that were used in the regression model attempting to predict support of tourism
development by small tourism businesses.
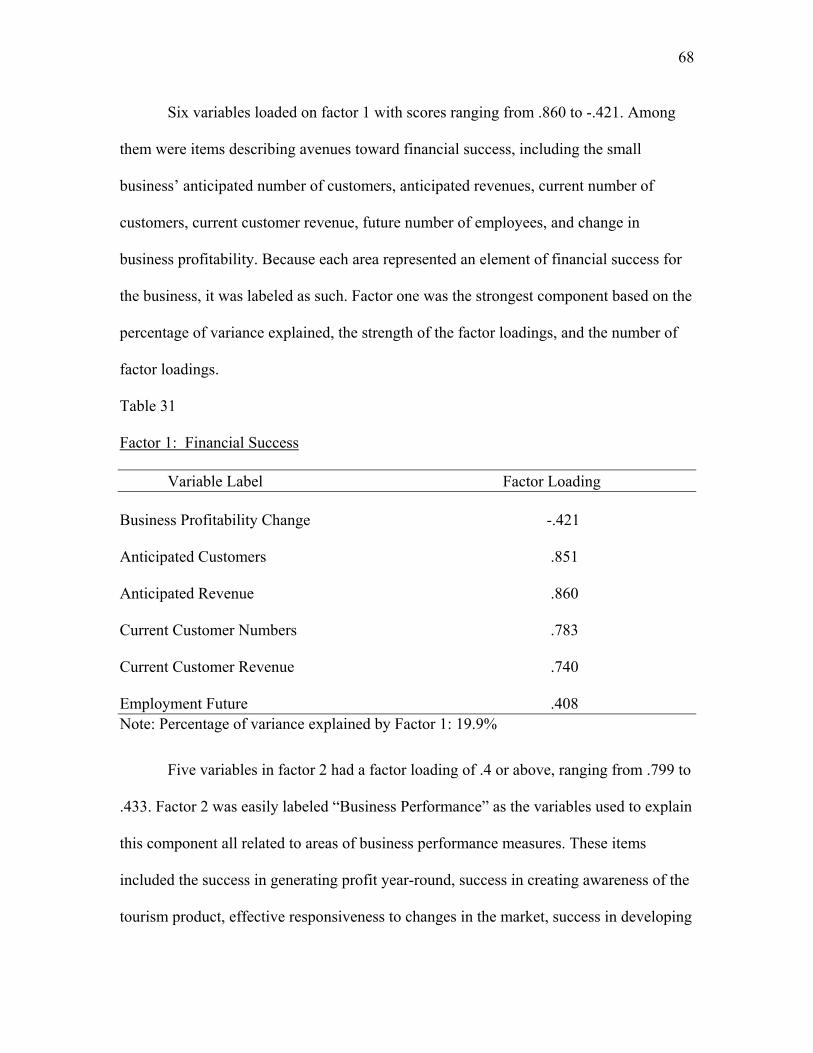
68
Six variables loaded on factor 1 with scores ranging from .860 to -.421. Among
them were items describing avenues toward financial success, including the small
business’ anticipated number of customers, anticipated revenues, current number of
customers, current customer revenue, future number of employees, and change in
business profitability. Because each area represented an element of financial success for
the business, it was labeled as such. Factor one was the strongest component based on the
percentage of variance explained, the strength of the factor loadings, and the number of
factor loadings.
Table 31 Factor 1: Financial Success Variable Label Factor Loading Business Profitability Change -.421 Anticipated Customers .851 Anticipated Revenue .860 Current Customer Numbers .783 Current Customer Revenue .740 Employment Future .408 Note: Percentage of variance explained by Factor 1: 19.9%
Five variables in factor 2 had a factor loading of .4 or above, ranging from .799 to
.433. Factor 2 was easily labeled “Business Performance” as the variables used to explain
this component all related to areas of business performance measures. These items
included the success in generating profit year-round, success in creating awareness of the
tourism product, effective responsiveness to changes in the market, success in developing
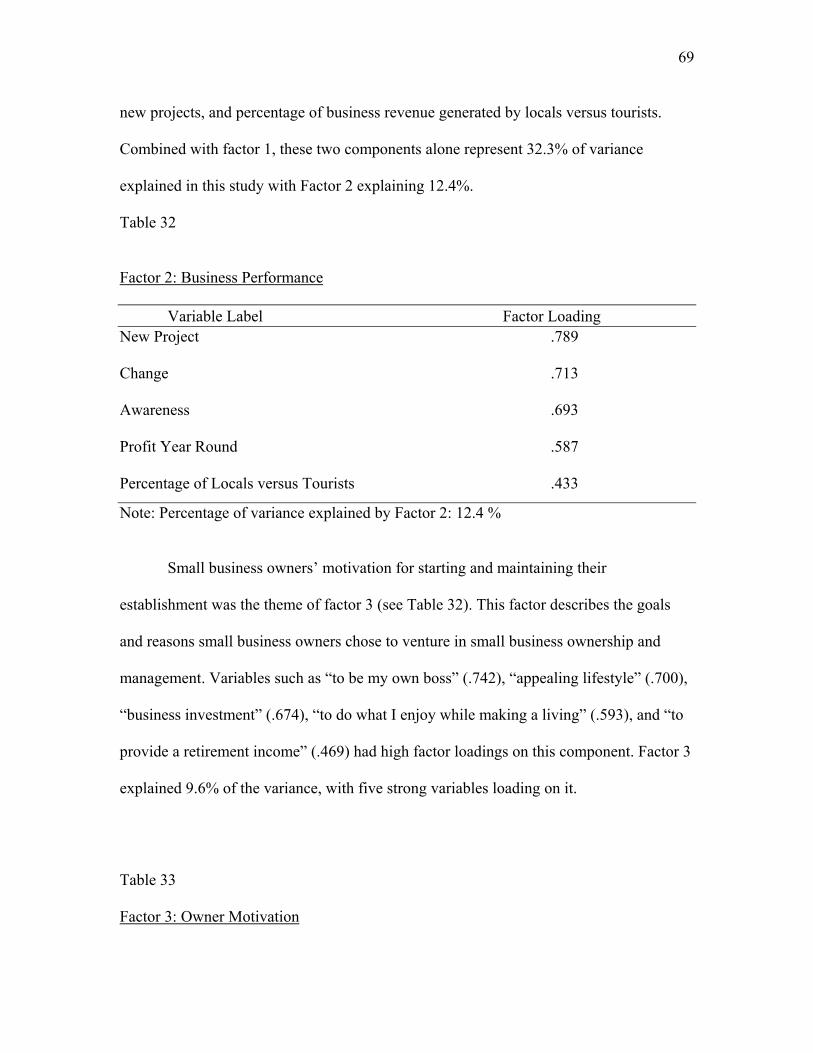
69 new projects, and percentage of business revenue generated by locals versus tourists.
Combined with factor 1, these two components alone represent 32.3% of variance
explained in this study with Factor 2 explaining 12.4%.
Table 32
Factor 2: Business Performance Variable Label Factor Loading New Project .789 Change .713 Awareness .693
Profit Year Round .587
Percentage of Locals versus Tourists .433
Note: Percentage of variance explained by Factor 2: 12.4 %
Small business owners’ motivation for starting and maintaining their
establishment was the theme of factor 3 (see Table 32). This factor describes the goals
and reasons small business owners chose to venture in small business ownership and
management. Variables such as “to be my own boss” (.742), “appealing lifestyle” (.700),
“business investment” (.674), “to do what I enjoy while making a living” (.593), and “to
provide a retirement income” (.469) had high factor loadings on this component. Factor 3
explained 9.6% of the variance, with five strong variables loading on it.
Table 33 Factor 3: Owner Motivation

70 Variable Label Factor Loading Own Boss .742 Lifestyle .700 Investment .674 Enjoyment .593 Retirement .469 Note: Percentage of variance explained by Factor 3: 9.6%
Only three items loaded on Factor 4, labeled “Perceived Self-Image;” however,
two of the variables had factor loading scores of over .9. The variables, “successful in
creating customer satisfaction” and “successful in developing a positive reputation”
reported factor scores of .925 and .916 respectively. Additionally, the item “effect
responsiveness to changes in the market” (.404) played a role in describing the factor’s
label. These items as detailed in Table 34 describe how a small business owner or
manager perceives their self-image, and these are illustrated by the three variables that
loaded on the factor.
Table 34 Factor 4: Perceived Self-Image Variable Label Factor Loading Positive Reputation .925 Customer Satisfaction .916
Change .404 Note: Percentage of variance explained by Factor 4: 6.1 %
Factor 5 was reviewed and was retained even though only two variables loaded on
the component. It was determined this was an important factor due to the strength of the

71 two items loading on it, “to give back to the community” (.844) and “to do what I enjoy
while making a living” (.585). These two variables together, representing 5.7% of the
variance explained, illustrated the values of a small business owner, and consequently the
factor was labeled “Owner Values.” Table 35 shows the factor loadings for this
component.
Table 35 Factor 5: Owner Values Variable Label Factor Loading Give back to the Community .844 Enjoyment .585 Note: Percentage of variance explained by Factor 5: 5.7 %
Summary of the Factors Retained for Multiple Regression Analysis
Five factors’ meaning labels were described in the above description and tables.
Table 36 provides a summary of factors that were used in the multiple regression
analysis.
Table 36 Factor Summary

72 Factor # of Eigen- % Variance Cumulative Variables values Explained % Financial Success 6 4.370 19.864 19.864 Business Performance 5 2.736 12.437 32.301 Owner Motivations 5 2.132 9.692 41.993 Perceived Self-Image 3 1.355 6.161 48.154 Owner Values 2 1.259 5.239 53.874
Multiple Regression Analysis
Standard multiple regression analysis was conducted using SPSS to determine
whether the level of support for tourism development by small tourism business owners
can be predicted by three categorical indicators -business activity type, business
ownership type, and business location- and five factors- financial success, business
performance, owner motivation, perceived self-image, and owner values. Standard
multiple regression is a predictive technique that allows for the selection of a meaningful
set of variables to account for maximum variance. The procedure assesses the
relationship between one or more dependent variables and a number of independent
variables, resulting in the best prediction of the dependent variable. All variables are
entered and examined at once in the model, accounting for the unique contribution of
each item (Tabachnick & Fidell, 2001).
The multiple regression model is explained by two statistical approaches: (a)
ordinary least squares and (b) maximum likelihood estimates. The main effects, or least
squares regression, equation is useful for predicting Y (dependent variable) from X1 and
X2 (independent variables). The formula, Y’ = a + b1X1+b2X2+ …..e, is the sample-based
equation where a is the least squares intercept, b1 and b2 are the estimates of the

73 population coefficients for X1 and X2, and e is a residual term (Jaccard et al., 1982). The
principle of least squares attempts to weigh the independent variables differently so as to
minimize the sum of the squared errors of prediction and optimize explanation, or R2
(Pedhazur, 1982; Lewis-Beck, 1980). The goal of this method is “to arrive at the set of B
values, called regression coefficients, for the independent variables that bring the Y
values predicted from the equation as close as possible to the Y values obtained in the
measurement” (Tabachnick & Fidell, 2001, p. 112).
Tabachnick and Fidell (2001) recommend evaluating sample size and the cases-
to-independent variables prior to running the regression equation. They recommend using
the rule of thumb if N>50 +8m (where 8 is the number of IVs) for multiple correlation
and N>104 + m for testing individual predictors. Therefore, this study had eight
predictors and a sample size of 152. This sample met the case to independent variables
requirement, and performance of multiple regression was deemed appropriate; 50 + 8(8)
= 114 cases needed for multiple correlation analysis, and 104 +8 = 112 cases for testing
multiple predictors.
Table 37 represents the correlation matrix between the dependent variable (total
tourism support) and the eight independent variables (business activity type, business
ownership type, and business location, financial success, business performance, owner
motivation, perceived self-image, and owner values). A correlation of .3 and above
denotes a relationship existing between the independent variables and the dependent
variables (Pallant, 2001). This data set showed low or no relationship between support of
tourism development and the indicator variables. The highest correlation, .269, was
recognized as a significant correlation (.001 level) between business performance (factor

74 2) and perceived self-image (factor 4). Other notable significant correlations were
between financial success and owner motivation (.220) and business ownership type and
business performance (.211).
Table 37
Correlation Matrix: Independent Variables versus Dependent Variables
Variables 1 2 3 4 5 6 7 8 9 1. Total Support Score --- .039 -.164 .056 .095 -.126 -.067 .073 -.075
2. Activity Type -.026 -.152 -.055 -.012 -.137 -.090 -.029
3. Location -.005 -.149 .043 .023 -.003 .079
4. Ownership .052 .211 -.076 .013 .187
5. Financial Success -.178 -.220 -.090 -.098
6. Business Performance .109 .269 .157
7. Motivation -.076 -.200
8. Self-Image -.124
9. Values ---
Several assumptions are necessary to meet when using multiple regression
analysis, including linearity, normality, independence, and homoscedasticity of the
residuals (Tabachnick & Fidell, 2001). The following figures and tables were used to test
the assumptions prior to proceeding with regression analysis: (a) normality probability
plot of regression standardized residuals, (b) scatterplot of residuals (regression
standardized residual versus regression standardized predicated value), and (c) tolerance
levels (1-squared multiple correlations) of the variables.
To check the normality of residuals, or the differences between the observed and
the predicted dependent variable scores, the normality probability plot was used.

75 According to Tabachnick and Fidell (2001), “The assumption of normality is that errors
of prediction are normally distributed around each and every prediction dependent
variable score” (p. 119). In other words, if the distribution is considered normal, the
points on the plot will fall along the straight line running from the bottom left of the plot
to the top right corner of the graph. If the residuals are skewed, the points will deviate
above or below the curve. As seen in Figure 4, the data set reveals a reasonably straight
diagonal line suggesting no major deviations from normality.
1.00.80.60.40.20.0
Observed Cum Prob
1.0
0.8
0.6
0.4
0.2
0.0
Expe
cted C
um P
rob
Figure 4: Normality Probability Plot of Regression Standardized Residuals
The residual scatterplot grid was also used to test the normality assumption.
Figure 5 depicts the studentized deleted residuals on the Y axis versus predicted
standardized residual value on the X axis. If the errors are normally distributed, then
about 95% of the residuals should fall between -2 and +2. This figure shows only a few
residuals outside the recommended range.
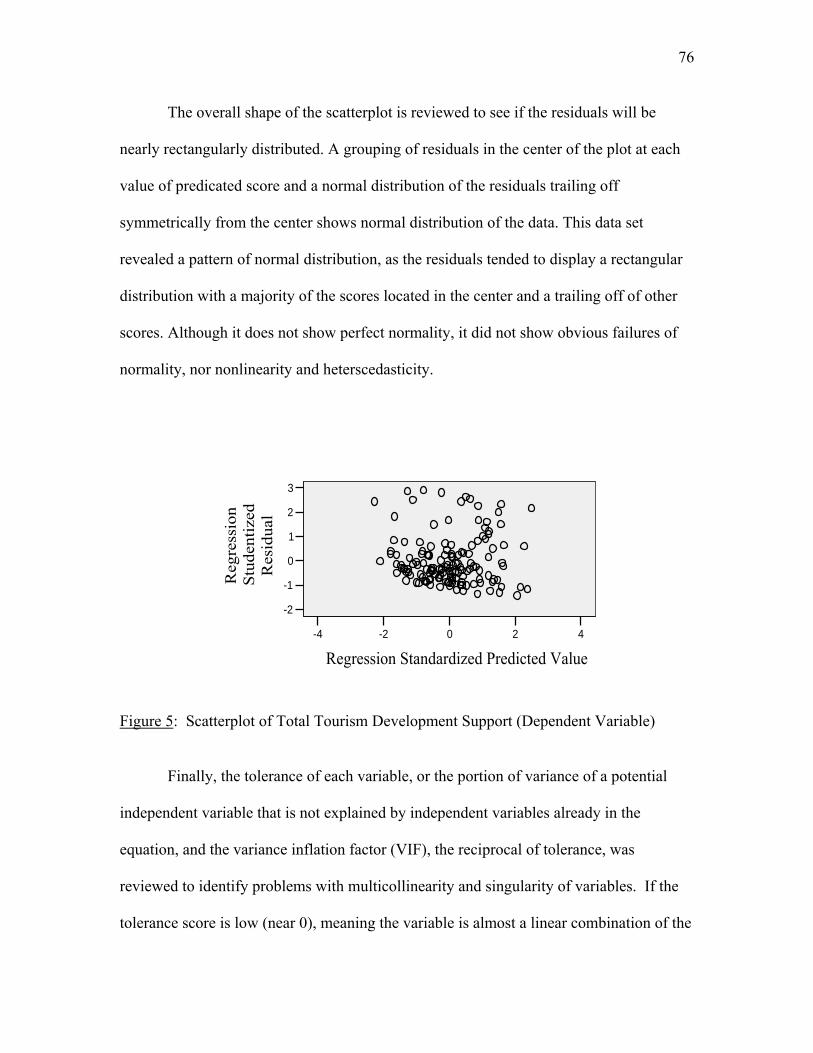
76
The overall shape of the scatterplot is reviewed to see if the residuals will be
nearly rectangularly distributed. A grouping of residuals in the center of the plot at each
value of predicated score and a normal distribution of the residuals trailing off
symmetrically from the center shows normal distribution of the data. This data set
revealed a pattern of normal distribution, as the residuals tended to display a rectangular
distribution with a majority of the scores located in the center and a trailing off of other
scores. Although it does not show perfect normality, it did not show obvious failures of
normality, nor nonlinearity and heterscedasticity.
420-2-4
Regression Standardized Predicted Value
3
2
1
0
-1
-2
Reg
ress
ion
Stud
entiz
edR
esid
ual
Figure 5: Scatterplot of Total Tourism Development Support (Dependent Variable) Finally, the tolerance of each variable, or the portion of variance of a potential
independent variable that is not explained by independent variables already in the
equation, and the variance inflation factor (VIF), the reciprocal of tolerance, was
reviewed to identify problems with multicollinearity and singularity of variables. If the
tolerance score is low (near 0), meaning the variable is almost a linear combination of the

77 other independent variables, increased multicollinearity and problems in singularity are
possible. This is not a concern if the independent variables are highly correlated (r=.9 and
above). Table 38 shows tolerance values ranging from .973 to .813 indicating no
violation of these assumptions.
Table 38
Multiple Regression Analysis of Coefficients: Collinearity Statistics
Variables Tolerance VIF Location .973 1.027
Activity Type .933 1.072
Financial Success .897 1.115
Values .883 1.133
Motivation .874 1.144
Self-Image .853 1.173
Ownership .853 1.173
Business Performance .813 1.229
Once the assumptions were reviewed and met, the standard multiple regression
model was used. In this model, all independent variables were entered into the equation at
once and evaluated on what they added to the prediction of the dependent variable
(Tabachnick & Fidell, 2001). The R-squared value (R2) shows how well a set of
independent variables predicts the dependent variable. As the R2 increases in value, so
does the percentage of explained variance in the dependent variable. In this data set, the
set of eight independent variables was entered into the model to predict the support level
of tourism development by small tourism business owners.

78 The model summary information revealed the R2 for this data set was .058. This
indicated that only 5.8% of the total support for tourism development by small tourism
business owners could be predicted by the independent variables of business activity
type, business ownership type, business location, financial success, business
performance, owner motivation, perceived self-image, and owner values. The ANOVA
table (see Table 39) was additionally reviewed for statistical significance of the predicted
equation. The f value revealed a 1.082 level, while the significance value was .379. This
data set was deemed not significant due to the alpha level not meeting the p=.05
significance level.
Table 39
Analysis of the Variance: Regression
Model Sum of Squares df Mean Square F Sig Regression 9.727 8 1.216 1.082 .379
Residual 158.383 141
Total 168.111 149 a. Predictors: (Constant), business activity type, business ownership type, business location, financial success, business performance, owner motivation, perceived self-image, and owner values b. Dependent Variable: total support of tourism development score
Lastly, the standardized coefficients, or the converted beta weights, were
examined to review which, if any, of the independent variables contributed to the
explanation of the dependent variable. Table 40 displays the standardized beta weights
for each independent variable in the data set. This analysis further showed no significance
at p=.05 between any of the independent variables and the dependent variable. The
highest beta weight was -.148 (business location) and was significant at the p=.076 level.

79 This finding further confirmed that the set of independent variables did not contribute to
the explanation of level of tourism development support.
Table 40
Multiple Regression Analysis: Significance of Beta Weights
Variables Beta Sig Activity Type .040 .640
Location -.148 .076
Ownership -.006 .947
Financial Success .050 .563
Business Performance -.129 .157
Motivation -.031 .723
Self-Image .112 .208
Values -.017 .843
Summary
This chapter outlined the results by addressing a number of topics: (a) the
response rate of the population, (b) demographic data describing a number of
characteristics of small tourism business owners and managers, (c) screening of the data,
(d) overview of factor analysis using principal component analysis and Promax rotation
method, (e) labeling and description of the five meaningful factors, (f) summary of factor
retained for multiple regression analysis, and (g) multiple regression analysis pertaining
to the predictability of the level of support for tourism development by small tourism
business owners.
Chapter 5
SUMMARY, DISCUSSION OF FINDINGS, CONCLUSIONS, IMPLICATIONS,

80
AND RECOMMENDATIONS
Summary
The problem of this study was to construct a testable model by investigating the
dimensions of small tourism businesses and to explore if these characteristics predict
support of tourism development in Indianapolis, Indiana. Based on the review of
literature, a number of variables were identified for use in the study. Each small tourism
business was examined in terms of their type of business activity, type of business
ownership, motivation of business ownership, financial success, projected growth,
business geographical location, customer base, and level of community involvement. The
importance of the study was that support for tourism development leads to increased
tourism activities and inevitably increased economic benefit to the community.
The sample for this study was drawn from small tourism business owners and
managers located in one of the six Indianapolis cultural districts (Broad Ripple Village,
Wholesale, Fountain Square/Southeast Neighborhood, Downtown Canal, Mass Avenue,
and Indiana Avenue Cultural District). For this project, a small tourism business was
defined as a business with less than 40 full-time employees, very small market share,
annual revenue less than $250,000, or limited infrastructure and assets, and was
categorized as one of the following types of establishments: (a) art galleries or studios,
(b) restaurants, (c) historic attractions, (d) museums, (e) performing/visual art centers, (f)
unique gift/souvenir shops, and (g) accommodations. A total of 152 surveys were used in
the analysis, which represented a 48.2% response rate; a total of 315 small tourism
businesses fit the sample criteria.

81
The survey was developed using question items and themes from earlier work by
notable researchers in the areas of small business, economic development, and tourism
(Bastakis et al., 2004; Besser, 1999; Friel, 1999; Getz & Carlsen, 2000; Jurowski &
Brown, 2001; Litz & Stewart, 2000; Page et al., 1999; Reichel & Haber, 2005; Reid et
al., 2004; Schrodeder, 1996; Thomas, 1997, 2000; Williams & Lawson, 2001). Variables
selected for this study were justified using previous theory and concepts presented in the
small business and tourism literature. The 35-question survey instrument was divided into
seven sections: (a) general business information, (b) business employment, (c) business
operations, (d) business marketing and advertising, (e) performance measures, (f)
community involvement, and (g) support of tourism development. The instrument
included both closed and open-ended questions, and continuous and categorical
measurement levels.
The initial analysis of the data was conducted using SPSS and produced a number
of descriptive statistics describing small tourism businesses in Indianapolis. This
information was used to better understand the nature of owners and managers of small
tourism businesses. Factor analysis procedures were conducted using principal factors
extraction with Promax rotation. The results of the factor analysis revealed the presence
of an eight factor structure with eigenvalues greater than one, of which five of the factors
were retained and used in further analysis. A multiple regression analysis was then used
to distinguish whether support of tourism development could be predicted by the small
tourism businesses’ financial success, business performance, owner motivations,
perceived self-image, owner values, business activity type, business location, and
business ownership type. The model summary information revealed the R2 for this data
82 set was .058, meaning only 5.8% of the variance of support for tourism development
could be explained by this set of independent variables.
Findings This study addressed two research questions and eight null hypotheses. To answer the
research questions and to decide whether or not to retain or reject the hypotheses,
principal component factor analysis and standard multiple regression modeling were
used. Prior to conducting the analysis, a number of interesting demographic information
was reported.
The demographic data provided insight into a number of areas used to describe
small tourism businesses. For instance, 55.5% of the respondents indicated they owned
and/or operated the small business fewer than five years, with 85.4% of small business
owners employing ten or less full-time employees. This sample indicated that “doing
what I enjoy while making a living” and “recognized a market need” were the two most
favorable responses when asked about their motivations for starting a new small tourism
business. Retirement, prestige, and unemployment were viewed as less important.
Small tourism business owners and managers were conservative, yet optimistic,
regarding their projections for future employment trends and generation of customer
revenue. In fact, 80% of the sample forecasted increases or steady growth in number of
customers, average customer spending, and overall business revenue. On the other hand,
competition from large business, lack of tourists’ support, inflation, poor cash flow, labor
costs, and no support from local government were acknowledged as obstacles to
improved performance.

83
In terms of business performance measures, many small tourism businesses
believed they were successful in developing a positive reputation and in achieving
customer satisfaction, and noted generating year-round profit, ability to create awareness
as a tourism product, and developing new products as challenges that impede
performance levels.
Group membership of small tourism business was reviewed in terms of
professional, civic, religious, charitable, and volunteer opportunities. Additionally,
respondents were asked if he/she felt a part of the Indianapolis tourism industry and to
identify groups or other individuals who have sought their opinion on future
development. Surprisingly, over 60% of all small tourism business owners and/or
managers participated in two or more organizations. However, only 26.2% of the sample
had been asked to contribute their viewpoints on Indianapolis’ strategic mission as it
relates to tourism development, leaving 21.4% of the sample feeling disconnected from
the city’s tourism industry.
Finally, the mean score of eight items was reviewed to determine the level of
support for tourism development by small tourism businesses. Support for improved
transportation and increased support for cultural events, festivals, and downtown events
received the highest mean scores; whereas, increased taxes to support infrastructure and
support for new sports facilities reported the lowest mean scores of support. An overall
mean score for support for tourism development by small tourism businesses was 2.173,
translating to a somewhat support rating.
The results of the PCA factor analysis using Promax rotation revealed the
presence of an eight factor structure with eigenvalues greater than one, of which five of

84 the factors were retained and used in further analysis. The five meaningful factors that
emerged from the data were labeled as financial success, business performance, owner
motivations, perceived self-image, and owner values. Together, they explained 53.8% of
the variance in the original 22 items. Variables with factor loadings of .40 and above
were used to interpret and label the factors.
Factor one, financial success, had six items loading on it, including anticipated
customers, anticipated revenue, current customer numbers, current customer revenue,
employment future, and business profitability change. This was the strongest of the five
factors explaining 19.9% of the variance. Business performance, factor two, represented
12.4% of the explained variance and was defined using success in generating year-round
profit, successful in creating awareness of the tourism product, effective responsiveness
to changes in the market, success in developing new projects, and percentage of business
revenue generated by locals versus tourists. These two components represented 32.3% of
the 53.8% of the variance explained. Factors three, four, and five represented the
remaining 21.5% of the variance. Owner motivation had five factor loadings, while
perceived self-image had three and owner values had only two.
These five factors and three categorical variables, business activity type, business
location, and business ownership type, were entered into the multiple regression model.
The proposed model included small tourism business community involvement and client
base, but these components did not emerge as factors and were replaced with perceived
self-image and owner values. In fact, group membership and client base only loaded on
one factor, which was deemed uninterpretable. Figure 6 represents the factors that were
entered into the modified proposed model to determine whether or not this set of

85 independent variables would predict small tourism businesses’ level of support for
tourism development.
X2
X5
X3
X6X7
X8
Z2
Z1
Y1
X4
X1
KEY Independent Variables X1= Financial Success (Factor 1) X2= Business Performance (Factor 2) X3= Owner Motivation (Factor 3) X4= Perceived Self-Image (Factor 4) X5= Owner Values (Factor 5) X6= Business Type (Categorical) X7= Business Ownership (Categorical) X8= Business Location (Categorical) Dependent Variable Y1 = Support of Tourism Development Unmeasured Variables Z1= Increased Tourism Z2 = Increased Economic Impact
Figure 6: The Modified Proposed Model
In conclusion, the model summary information revealed the R2 for this data set
was .058. This indicated that only 5.8% of the total support for tourism development by
small tourism business owners could be predicted by the independent variables of
business activity type, business ownership type, business location, financial success,
business performance, owner motivation, perceived self-image, and owner values. The
ANOVA table and the standardized coefficients, or the converted beta weights, were
examined to explore which, if any, of the independent variables contributed to the
explanation of the dependent variable. Both reviews supported the conclusion that this set

86 of independent variables did not predict the level of support of tourism development by
small tourism businesses.
Conclusions
With respect to the hypothesis used to guide the research project, the following
conclusions were drawn:
Hypothesis 1: “There are no significant relationships between small tourism
business’ involvement (membership in professional, civic, religious, charitable or
volunteer organizations) and support of tourism development” was retained. The
regression analysis revealed that the item “group membership” only loaded on one factor,
which was subsequently deemed uninterruptible. Additionally, a factor did not emerge
from the data set describing group membership as anticipated. This means that group
membership, as it relates to small tourism business owners, did not predict support of
tourism development. Therefore, the social exchange theory and conclusions posed by
Jurowski and Brown (2001) regarding group membership and support levels may not be
relevant in relation to the sample in this study.
In further exploring group membership, it should also be noted that group
membership did not correspond to the answers to “do you feel like part of the
Indianapolis tourism industry.” Therefore, some who selected they were a member of two
or more professional, formal, religious, civic, or volunteer organizations still indicated
they did not feel a part of the tourism industry, and others who felt a part of the tourism
industry did not participate or become members in any groups or organizations.
Hypothesis 2: “There are no significant relationships between small tourism
business’ motivation (such as lifestyle, enjoyment, retirement, and business investment)

87 and support of tourism development” was retained. Factor 3 in the PCA analysis revealed
a component that described the goals and reasons small business owners chose to venture
into small business ownership and management. Variables such as “to be my own boss”
(.742), “appealing lifestyle” (.700), “business investment” (.64), “to do what I enjoy
while making a living” (.593), and “to provide a retirement income” (.469) had high
factor loadings on this component. However, the regression analysis concluded that small
tourism business owners’ motivations had no predictive power with relation to support
levels of tourism development.
Hypothesis 3: “There are no significant relationships between small tourism
business’ projected growth and support of tourism development” was retained. Factor 2
in the PCA analysis was clearly labeled “Business Performance” as the variables used to
explain this component included the success in generating profit year-round, success in
creating awareness of the tourism product, effective responsiveness to changes in the
market, success in developing new projects, and percentage of business revenue
generated by locals versus tourists. While the factor was defined, the regression analysis
suggested projected business performance growth could not predict support of tourism
development by small tourism businesses.
Hypothesis 4: “There are no significant relationships between small tourism
business’ financial success and support of tourism development” was retained. Factor
analysis exposed that the strongest factor, Factor 1, explained 19.9% of the variance, and
clearly described avenues toward attaining financial success. Such item descriptors
included the small business’ anticipated number of customers, anticipated revenues,
current number of customers, current customer revenue, future number of employees, and
88 change in business profitability. The economy base theory was used as a framework for
this study, and this set of ideas demonstrated that economics and tourism development
have some connection. However, the regression analysis showed no significance in
regard to small tourism business’ financial state and the ability to predict support of
tourism development.
Hypothesis 5: “There are no significant relationships between small tourism
business’ clientele base and support of tourism development” was retained. It was found
that some small tourism business owners did not even know the percentage of revenues
brought in by tourists versus local residents. Therefore, it was no surprise that “clientele
base” did not appear as a factor and could not be used to predict support of tourism
development by small tourism businesses.
Hypothesis 6: “There are no significant relationships between small tourism
business’ activity type and support of tourism development” was retained. Small tourism
business activity was divided into eight categories: (a) art gallery or studio, (b)
restaurants, (c) historic attractions, (d) museums, (e) performing/visual arts, (f) unique
gift or souvenir shops, (g) accommodations, and (h) other (attractions not categorized as
historical, hospitality tour companies, or meeting management firms). The regression
procedure discovered business activity type does not predict support levels of tourism
development by small tourism businesses.
Hypothesis 7: “There are no significant relationships between small tourism
business’ type of ownership and support of tourism development" was retained. Small
business ownership was divided into six categories: (a) individually owned, for-profit, (b)
jointly owned, for-profit, (c) family owned, for-profit, (d) part of a chain or franchise, (e)
89 non-profit or not-for profit organization, and (f) other. It was again revealed that this
categorical factor had no predictive power in terms of predicting small tourism business
support of tourism development.
Hypothesis 8: “There are no significant relationships between small tourism
business’ location and support of tourism development” was retained. Each of the six
cultural districts (Broad Ripple Village, Fountain Square, The Canal and White River
State Park, Mass Avenue Arts and Theater District, Downtown Wholesale District, and
Indiana Avenue District) was entered into the regression model to see if this variable
could predict support of tourism development. This variable also showed no significance
in the ability to predict support levels of small tourism business owners.
Predicting small tourism business support of tourism development may continue
to be difficult. Until the Indianapolis small tourism business owners and managers begin
to understand the value and importance of tourism development to their future and its
impact on the city’s future, their support of future projects hard to foresee.
Small tourism businesses need a collaborative voice to express their distinct needs
to the community, its residents, tourists, and stakeholders. Membership in professional
associations or groups was varied amongst business owners, and due to segmented
membership, their opinions are not likely to be considered. It was reported that very few
owners and managers participate in elected offices or hold key leadership offices. This
must change; small tourism business owners must get involved in the process.
Additionally, small tourism businesses do not collaborate with each other or work
toward common goals. To overcome obstacles, they must seek out one another’s

90 strengths and work together to lend support and direction to overcome weaknesses and
secure their future success.
Implications
Even though the proposed model may not have resulted in significant findings,
this study has both theoretical and practical implications. As previously indicated in
Chapter Two, additional research based on theoretical understanding and improved data
collection is important as researchers in this area look to further investigate support of
tourism development and understand small tourism businesses. Previous researchers have
used a number of dimensions to both describe and define small tourism business owners,
and others to predict support of tourism development. This study attempted to combine
these findings and propose a new set of theoretical ideas for future research.
This study used and implemented previous theory, including elements of the
social theory (Davis, 2001), organizational typologies (Litz & Stewart, 2000), social
exchange theory (Chen, 2000; Jurowski et al., 1997), the enlightened self-interest model
of social responsibility (Besser, 1999), and the systemic model (Besser, 1999) as the
conceptual framework for the study. Because the economy theory attempts to explain the
range of problems, challenges, and strengths of small tourism business, it was used as the
framework for the study’s proposed model. While new theory cannot be derived from
these findings, this research should be used as a foundation to expand and continue work
on future theory development and theory testing in these areas.
Knowledge of what factors influence small tourism business support of tourism
development may enable stakeholders to assess the likelihood of a project prior to
committing significant amounts of time and financial resources. There are a number of

91 groups and individuals, including tourism planners, officials, and the business community
at large, who can take advantage of this study and its results. The demographic portion of
this study alone could assist those in positions to promote tourism development to better
understand, communicate, and involve small tourism business owners in their future
efforts. This stronger understanding of small tourism businesses in the Indianapolis area
could lead to a more targeted effort by all stakeholders in the area.
Reaching consensus with small business owners could be described as difficult or
impossible, as this population tends to have an individual agenda or not enough time and
resources to participate in the city’s initiatives. Tourism professionals must begin to reach
out to these small businesses and incorporate their interests into the overall direction of
tourism planning. Professional training in hospitality has typically encompassed customer
service, marketing, and planning techniques. However, these efforts must be expanded
for small tourism business to assist with financial management and cash flow, to identify
avenues of marketing that is both creative and affordable, to present awareness of the
tourism policies, and to introduce channels to become involved and voice opinions in the
tourism developmental process. To survive in this current economy, small tourism
businesses need the support of local, state, and national governments and other tourism
stakeholders.
Indianapolis has a large number of small tourism businesses that have been
operating for less than five years. These businesses need local and state government
support and resources that will allow them to survive in a chain-dominated city.
Exploring the needs and interests of small tourism businesses is imperative if the city
wants to promote a unique destination that will attract all types of visitors. Assisting in

92 the development and survival of small tourism businesses will allow Indianapolis to be
recognized as a cultural location that tourists want to explore.
Recommendations
Based on the findings and conclusions of the study, the following are
recommendations for future research in the area of small tourism business and support for
tourism development:
1. The study should be replicated using different populations. The low variance in the
study could be a reflection of the small tourism business owners in Indianapolis, Indiana.
Different results may be reported if the small tourism business owners are located in
another city, region, or country.
2. Not only should populations in different geographical areas be used, but different
categories of small tourism businesses should be explored. Potentially adding categories
that were excluded in this study, such as a number of service-related businesses (hair
salons, dry cleaners, shoe repair, etc.) may provide other perspectives. Because other
cities or regions may have different types of small tourism businesses, it may be useful to
explore the categories used in the study and look to refine the participant criteria used in
future projects.
3. Similar studies need to be conducted to further validate the instrument. Different
samples and categories of other small tourism business could be used to enhance the
reliability and validity of the instrument and strengthen the scales and variables used.
Additional research should be conducted to determine if the instrument is valid with other
types of populations.

93 4. Conducting a qualitative study is necessary to validate the instrument and further
investigate the results. A multi-method approach increases the feasibility of verifying or
validating theories. Through personal interviewing, Delphi procedures, and/or focus
groups, additional themes or factors may emerge about tourism development support.
These methods and use of triangulation procedures may also identify if the survey
instrument accurately measures and describes small tourism business owners’
perspectives. This will help in the attempt to maximize the strengths and minimize the
weaknesses in each approach. Very few respondents took advantage of the opportunity to
add personal comments in the open-ended question section; and therefore, additional in-
depth information would aid in refining the instrument and advancing theoretical ideas on
model design.
5. Other quantitative statistical methods can be used to examine the data. By adapting
the research questions, MANOVA, discriminant factor analysis, and other methods of
multiple regression (stepwise, backward, or forward) could be used. This may yield other
significant findings that could contribute to the body of knowledge.
6. Confirmatory factor analysis is a powerful research tool, and its use can yield
strong statistical evidence of the validity of a proposed model. Therefore, further
exploring whether or not the model fits the data is necessary and useful. Techniques such
as SEM, Amos, and EQS could be selected for future studies.
7. Each independent variable used in the study should continue to be investigated and
reviewed. Further examination is needed of the factors and variables (independent
variables) used in the multiple regression model in hopes of better explaining the
percentage of variance between the independent variables and dependent variable.
94 Additionally, other demographic variables such as ethnicity, race, and political party
affiliations could be examined in future projects.
8. Future investigation is needed to determine if the eight items in the support for
tourism development section, the dependent variable, represent an accurate overall
support score. By using different variables to define overall support of tourism
development, a different set of factors may emerge leading to better predictive measures
in the model.
9. It is important to note that not all small tourism businesses are alike, and the
importance of the demographics in this study cannot be ignored. By conducting
additional studies of individual segments of small tourism business, such as only
independent restaurant owners or bed and breakfast owners, different variables may be
recognized, and categorizing all small tourism business owners may not be possible.
10. Future studies should be conducted in the Indianapolis area after the major
tourism projects are complete. Views may shift both positively and negatively after small
tourism businesses see the impact of these new developments. To date, the expansion of
the Indiana Convention Center is slated for opening in 2010, and the new sports facility
for the Indianapolis Colts is planning to open in 2008. It would be interesting to follow
small tourism businesses’ perspective throughout this exciting time of tourism
development and following the opening of these facilities.
11. The academic community must involve practitioners in understanding how they
can use research results, theoretical ideas, and models in decision making and business
operations. This gap between practitioners and the research community must be narrowed
or eliminated to improve practicality of both basic and applied research efforts.

95
REFERENCES
Abdi, H. (2003). Factor rotations. In M. Lewis-Beck, A. Bryman, T. Futing (Eds.):
Encyclopedia for research methods for the social sciences. Thousand Oaks:
Sage, 978-982.
Antolovic, J. (1999). Immovable cultural monuments and tourism. In Cultural Tourism
Session Notes XII Assembly, 103-118. ICOMOCS, Mexico.
Ateljevic, I. & Doorne, S. (2000). Staying within the fence: Lifestyle entrepreneurship in
tourism. Journal of Sustainable Development, 8, 378-392.
Bastakis, C., Buhalis, D., & Butler, R. (2004). The perception of small and medium sized
tourism accommodations on the impacts of the tour operators’ power in Eastern
Mediterranean. Tourism Management, 25, 151-170.
Besser, T. (1999). Community involvement and the perception of success among small
business operators in small towns. Journal of Small Business Management, July,
16-29.
Brownlie, D. (1994). Market opportunity analysis: A DIY approach for small tourism
enterprises. Tourism Management, 15 (1), 37-45.
Buhalis, D. (October, 1993). RICIRMS as a strategic tool for small and medium tourism
enterprises. Tourism Management, 366-378.
Buhalis, D. & Cooper, C. (1992). Strategic management and marketing of small and
medium-sized tourism enterprises in the Greek Aegean islands. In R. Teare, D.
Adams, & S. Messenger (Eds). Managing projects in hospitality organizations.
London: Cassel.

96 Carter, S. (1996). Small business marketing. In M. Warner (Ed.), International
encyclopedia of business and management. London: Routledge.
Chen, J. (2001). Assessing and visualizing tourism impacts from urban residents’
perspectives. Journal of Hospitality & Tourism Research, 25 (3), 235-250.
Chen, J. (2000). An investigation of urban residents’ loyalty to tourism. Journal of
Hospitality & Tourism, 24 (1), 5-19.
Comrey, A.L. & Lee, H.B. (1992). A first course in factor analysis (2nd ed.). Hillsdale:
Erlbaum.
Copp, C. & Ivy, R. (2001). Networking trends of small tourism businesses in post-
socialist Slovakia. Journal of Small Business Management, 39 (4), 345-353.
Costello, A. & Osborne, J. (2005). Best practices in exploratory factor analysis: four
recommendations for getting the most from your analysis. Practical Assessment
Research & Evaluation, 10 (7).
Cressy, R. & Cowling, M. (1996). Small business finance. In M. Warner (Ed.),
International encyclopedia of business and management. London: Routledge.
Cultural Tourism Commission (2004). Retrieved May 16, 2005 from
www.culturalindy.org.
Curran, J. (1996). Small business strategy. In M. Warner (Ed.), International
encyclopedia of business and management. London: Routledge
Davis, J. (2001). Commentary: tourism geography and social theory – expanding the
focus. Tourism Geographies, 3, 125-134.
97 Deloitte Touche Tomatsu (1994). Small business survey 1994: New Zealand tourism
industry. Christchurch: Deloitte Touche Tomatsu Tourism and Leisure Consulting
Group.
Fabrigar, L. R., Wegener, D. T., MacCallum, R. C., & Strahan, E. J. (1999). Evaluating
the use of exploratory factor analysis in psychological research. Psychological
Methods, 3, 272-299.
Fraenkel, J. & Wallen, N. (2003). How to design and evaluate research in education (5th
ed.). Boston : McGraw Hill.
Frangialli, F. (2002) World summit on sustainable tourism development
(Johannesburg, South Africa, August 29). Received May 20, 2004 from
www.world -tourism.org/newsroom/speeches/2002/johannesburg.pdf.
Friel, M. (1999). Marketing practice in small tourism and hospitality firms. International
Journal of Tourism Research, 1, 97-109.
Fujita, M. (1991). Urban economic theory: Land use and city size. Cambridge:
Cambridge University Press.
Getz, D. & Carlsen, J. (2005). Family business in tourism: State of the art. Annals of
Tourism Research, 32 (1), 237-258.
Getz, D. & Carlsen, J. (2000). Characteristics and goals of family and owner-operated
businesses in the rural tourism and hospitality sectors. Tourism Management, 21,
547-560
Glover, R. (1998). Tourism as economic development. Retrieved May 16, 2005 from
www.economicdevelopment .net/tourism/glover_tpd_98.htm.

98 Goldblatt, J. & Nelson, K. (2001). The international dictionary of event management (2nd
ed). New York: John Wiley.
Gursoy, D., Jurowski, C. & Uysal, M. (2002). Resident attitudes: A structural
modeling approach. Annals of Tourism Research, 29 (1), 79-105.
Gunn, C. (2002). Tourism planning (4th ed.). New York: Routledge.
Hair, J., Anderson, R., Tatham, R., & Black, W. (1998). Multivariate data analysis (5th
ed.). Upper Saddle River: Prentice Hall.
Hall, C.M. & Page, S.J. (1999). The geography of tourism and recreation: Environment,
place and space. London: Routledge.
Hankinson, A. (1989). Small hotels in Britain: Investment and survival. The Cornell
Quarterly, 30 (2), 80-82.
Haywood, K., & Muller, T. (1988). The urban tourist experience: evaluating satisfaction.
Hospitality Education and Research Journal, 453- 459.
Hoover, E. (1975). An introduction to regional economics. New York: Knopt, Inc.
Ibielski, D. (1997). So what about small business productivity? National Productivity
Review, 17 (1), 1-4.
Indiana Chamber of Commerce (2004). Retrieved May 16, 2005 from
ww.imaps.indygov.org.
Indianapolis Cultural Tourism Initiative (2005). Retrieved September 15, 2006 from
www.culturalindy.org.
Ioannides, D. & Peterson, T. (2003). Tourism ‘non-entrepreneurship’ in peripheral
destinations: a case study of small and medium tourism enterprises on Bornholm,
Denmark. Tourism Geographies, 5 (4), 408-435.
99 Jaccard, J., Turrisi, R., & Wan, C. (1990). Interactive effects in multiple regression.
Newbury Park: Sage Publications.
Jamal, T. & Getz, D. (1995). Collaboration theory and community tourism planning.
Annals of Tourism Research, 22 (1), 186-204.
Jansen-Verbeke, M. (1986). Inner city tourism, resources, tourists and promoters. Annals
of Tourism Research, 13 (1), 79-100.
Jurowski, C, & Brown, D. (2001). A comparison of the views of involved versus
noninvolved citizens on quality of life and tourism development issues. Journal of
Hospitality & Tourism Research, 25, 355-370.
Jurowski, C., Uysal, M., & Williams, D. (1997). A theoretical analysis of host
community resident reactions to tourism. Journal of Travel Research, 26 (2), 3-
11.
Kim, J. & Mueller, C. W. (1978). Factor Analysis: Statistical methods and practical
issues. Thousand Oaks, CA: Sage Publications, Quantitative Applications in the
Social Sciences Series, No. 14.
Kozak, M. & Rimmington, M. (2000). Tourist satisfaction with Mallorca, Spain, as an
off-season holiday destination. Journal of Travel Research, 38, 260-269.
Kuratko, D., Goodale, J. & Hornsby, J. (2001). Quality practices for a competitive
advantage in smaller firms. Journal of Small Business Management, 39 (4), 293-
311.
Law, C. (2002). Urban tourism: The visitor economy and the growth of large cities.
London: Cromwell Press.
100 Lewis-Beck, M. (1980). Applied regression: An introduction. Beverly Hills: Sage
Publications.
Litz, R. & Stewart, A. (2000). Charity begins at home: Family firms and patterns of
community involvement. Nonprofit and Voluntary Sector Quarterly, 29 (1), 131-
148.
Mak, J. (2004). Tourism and the economy. Honolulu: University of Hawaii Press.
Masberg, B. (1998). Defining the tourist: Is it possible? Journal of Travel Research, 37,
67-70.
McHone, W. & Rungeling, B. (2000). Practical issues in measuring the impact of a
cultural tourist event in a major tourist destination. Journal of Travel
Research, 38, 299-302.
McKercher, B. & Du Cros, H. (2003). Cultural tourism: The partnership between
tourism and cultural heritage management. New York: Haworth Hospitality
Press.
Milman, A., King, B., & Pizam, A (1993). Social impacts of tourism: Host perceptions.
Annals of Tourism Research, 20 (4), 650-665.
Morrison, A. (1996). Marketing the small business. In A.V. Seaton & M. Bennett (Eds.),
Marketing tourism products: Concepts, issues, cases. London: International
Thomson Publishing.
Mutch, A. (1995). IT and small tourism enterprises: a case study of cottage-letting
agencies. Tourism Management, 16 (7), p. 533-539.

101 Olsen, M. (1991). Strategic management in the hospitality industry: A literature review.
In C. Cooper (Ed.), Progress in tourism, recreation and hospitality management,
reports. London: Belhaven Press.
Page, S.J., Forer, P. & Lawton, G.R. (1999). Small business development and tourism:
Terra incognita? Tourism Management, 20, 435-459.
Pallant, J. (2001). SPSS survival manual. Buckingham: Open University Press.
Patten, M. (2002). Understanding research methods (3rd ed.) Los Angeles: Pyrczak
Publishing.
Pedhazur, E. (1982). Multiple regression in behavioral research. New York: CBS
College Publishing.
Quinn, U., Larmour, R., & McQuillan, N. (1992). The small firm in the hospitality
industry. International Journal of Contemporary Hospitality Management, 4 (1),
11-14.
Reichel, A. & Haber, S. (2005). A three-sector comparison of the business performance
of small tourism enterprises: an exploratory study. Tourism Management, 26 (5),
681-690.
Reid, D., Mair, H. & George, W. (2004). Community tourism planning: A self-
assessment instrument. Annals of Tourism Research, 31 (3), 623-639.
Richards, G. (1996) The scope and significance of cultural tourism. In Richards, G. (Ed.),
Cultural Tourism in Europe (p. 19-46). Oxon, UK: CAB International.
Richie, J.R. & Goeldner, C. (1994). Travel, tourism and hospitality research, (2nd ed).
Canada: John Wiley & Sons, Inc.

102 Rogerson, C. (2004). Urban tourism and small tourism enterprise development in
Johannesburg: The case of township tourism. GeoJournal, 60 (3), 249-257.
Ryan, C. (2000). Tourist experiences, phenomenographic analysis, post-positivism, and
neutral network software. International Journal of Tourism Research, 2, 119-131.
Schroeder, T. (1996). The relationship of residents’ image of their state as a tourist
destination and their support of tourism. Journal of Travel Research, 34, 71-73.
Shaw, G. & Williams, A. (2004). From lifestyle consumption to lifestyle production:
changing patterns of tourism entrepreneurship, In R. Thomas (Ed), Small Firms in
Tourism: International Perspectives. Amsterdam: Elsevier, 99-113.
Shaw, G. & Williams, A. (1994). Critical issues in tourism: A geographical perspective.
Oxford: Blackwell.
Simmons, D. (1994). Community participation in tourism planning. Tourism
Management, 15 (2), 98-108.
Sirgy, M. & Su, C. (2000). Destination image, self-congruity, and travel behavior:
toward an integrative model. Journal of Travel Research, 38, 340-352.
Smeral, E. (1998). The impact of globalization on small and medium enterprises: new c
challenges for tourism policies in European countries. Tourism Management, 19,
371-380.
Smith, M. & Krannich, R. (1998). Tourism dependence and resident attitudes. Annals of
Tourism Research, 25 (4), 783-801.
Storey, D. (1994). Understanding the small business sector. London: Routledge.

103 Tabachnick, B. & Fidell, L. (2001). Using multivariate statistics (4th ed.). Needham
Heights: Allen & Bacon.
Thomas, R. (2004). Small firms in tourism: International perspectives. London: Elsevier
Ltd.
Thomas, R. (2000). Small firms in the tourism industry: some conceptual issues.
International Journal of Tourism Research, 2, 345-353.
Thomas, R. (1998). The management of small tourism and hospitality firms.
London: Cassell.
Thyne, M. & Lawson, R. (2001). Research note: Addressing tourism public policy issues
through attitude segmentation of host communities. Current Issues in Tourism, 4
(2-4), 392-400.
Tosun, C. & Jenkins, C.L. (1996). Regional planning approaches to tourism
development: the case of Turkey. Tourism Management, 17 (7), 519-531.
U.S. Bureau of the Census (2002). 2002 survey of business owners. Retrieved May 16,
2005 from www.census.gov/econ/consus02.
U.S. Bureau of the Census (2000).American fact finder. Retrieved May 16, 2005 from
www.quickfacts.census.gov.
U.S. Environmental Protection Agency (2005). QAPP requirements for research model
development and application projects. Retrieved May 16, 2005 from
www.epa.gov.
Wanhill, S. (2000). Small and medium tourism enterprises. Annals of Tourism Research,
27 (1), 132-147.
Ward, J. & Aronoff. C. (1990). To sell or not to sell. Nation’s Business, 78, 63-64.

104 Westhead, P. & Cowling, M. (1998). Family firm research: The need for a
methodological rethink. Entrepreneurship theory and practice, 23, 31-56.
Williams, J. & Lawson, R. (2001). Community issues and resident opinions of tourism.
Annals of Tourism Research, 28 (2), 269-290.
Wood, E. (2001). Marketing information systems in tourism and hospitality small-and
medium-sized enterprises: a study of internet use for market intelligence.
International Journal of Tourism Research, 3, 283-299.
World Travel and Tourism Council (2004). Tourism highlights edition 2004. Retrieved
May 16, 2005 from http://world-tourism.org.
World Tourism Organization (2005). The 2005 travel and tourism economic research.
Retrieved May 16, 2005 from http://www.wto.org.
Yamashita, S. (Ed.) (1997). Tourism and cultural development in Asia and Oceania.
Bangi, Malaysia: Penerbit Universiti Kebangsaan Malaysia.
Yoon, Y., Chen, J., & Gursoy, D. (1999) An investigation of the relationship between
tourism impacts and host communities’ characteristics. International Journal of
Tourism and Hospitality Research, 10, 29-44.
Zwick, R. (1991). Rural community values and community type: a study of attitudes
toward tourism. In proceedings: 1991 Northeastern Research Symposium,
Saratoga Springs, N.Y.

105
APPENDIX A
Human Subject Documentation of Review and Approval

106
INDIANA UNIVERSITY – BLOOMINGTON STUDY INFORMATION SHEET
The role of small business enterprise in urban tourism development:
A case study of Indianapolis
You are invited to participate in a research study. This study investigates the effects of tourism development on small business. INFORMATION Participation will consist of survey collection. Individuals will be visited at their place of business and asked to complete a questionnaire. Approximately 250 surveys will be collected for this study. BENEFITS The benefits of this study could help city administrators better understand the viewpoints of small tourism business owners and thus be better equipped to meet the needs of all constituents of the community when making decisions on tourism issues. CONFIDENTIALITY Participants will not be identified in the reports of the study. Information will be kept confidential and no reference will be make in the reporting that could link you to the study. At the conclusion of the study in November 2005, all surveys and materials will be destroyed. CONTACT If you have questions about this study or its procedures, please contact Amanda Cecil – IUPUI, 901 West New York Street, Office 258B, Indianapolis, IN 46202, 317.278.8569. If you feel you have not been treated according to the descriptions in this form, or that your rights as a participant have not been honored during the course of this project, you may contact the Human Subjects Committee, Indiana University, Carmichael Center L03, 530 Kirkwook Avenue, Bloomington, IN, 47408, 812.855.3067 or email at [email protected]. PARTICIPATION Your participation is this study is voluntary; you may decline to participate without penalty. If you decide to participate, you may withdraw from the study at any time without penalty. If you withdraw for the study, your data will be destroyed, and your contribution will not be used for research purposes.

107
APPENDIX B
Student Research/Data Collection Guidelines and Instructions
108
Student Research/Data Collection Guidelines and Instructions
Tourism, Conventions, and Event Management students will serve as research assistants for this project starting July 11 through July 25. Below are the research guidelines for the study: (1) All research assistants are required to pass the Human Subjects Protection Test before participating. An explanation of research ethics and review of the IRB tutorial will be presented to students prior to administering the test. Human Subjects Protection Test: To be eligible to receive credit for this course, students must pass the IUPUI Human Subjects Protection Test by Friday, July 1. http://www.iupui.edu/%7Eresgrad/Human%20Subjects/human-menu.htm
- Select “Protection of Human Subjects in Research Course”
The course consists of: o A Web-based, self-paced tutorial designed to meet the NIH requirements
that researchers using human subjects demonstrate the completion of education in the protection of human research participants.
o A self-administered test designed to complement the Protection of Human Subjects in Research tutorial.
(2) Research assistants will be given a complete overview of the purpose, justification, limitations, delimitations, and assumptions of the research. (3) Research assistants will be divided into teams and assigned between 25 businesses to visit. The supervisor of that area will distribute a map of the cultural distinct and the address of each location. (4) Research assistants and supervisor will select a meeting point for the cultural district team. (5) Research assistants will be given a script to introduce his/herself at the business owner location. Hello ___________________________________________________. My name is _________________________(member of the survey team). I am a student at IUPUI and we are conducting a study of tourism support and its benefits and drawback for the city of Indianapolis. We would like for you to participate so we can explore the viewpoints of small business owners or managers. It will require only about 10-15 minutes of your time. All information will be kept confidential and your participation is completely voluntary. Moreover, you can discontinue at any time during the process.

109
APPENDIX C Letter to Indianapolis Cultural District Small Business Owners or Managers

110
June 30, 2005
Indianapolis Cultural District Small Business Owner or Manager: Indianapolis is experiencing tremendous growth in tourism and is building a unique cultural reputation among residents and visitors. As city officials and leaders continue to look to the future of tourism development and expansion, it is critical to have feedback from all segments and facets of the greater Indianapolis stakeholders. During the week of July 11-15, a member of the IUPUI research team will visit your business to receive your input on the future of Indianapolis tourism development. You are invited to participate in a research study that investigates the effects of tourism development on small business. The benefits of this study could help city administrators better understand the viewpoints of small tourism business owners and thus be better equipped to meet the needs of all constituents of the community when making decisions on tourism issues. A small sample of business owners and managers are being surveyed, so your input is very important. Participants will not be identified in the reports of the study. Information will be kept confidential and no reference will be make in the reporting that could link you to the study. If you have questions regarding the project, please feel free to contact Amanda Cecil at 317.278.8569. Thank you, Amanda Cecil Indiana University Doctoral Student [email protected]

111
APPENDIX D Research Questionnaire

112
General Business Information 1. What is the primary activity of this business? (Select one) ○ Art gallery or studio ○ Independent Restaurant ○ Historic Attraction ○ Museum ○ Performing/Visual Art Center
○ Unique Gift/ Souvenir Shop ○ Accommodations ○ Other (please specify) _________________________________
2. Which Indianapolis historical district is your business located? (Select one)○ Broad Ripple ○ Wholesale ○ Fountain Square/Southeast Neighborhood
○ Downtown Canal District ○ Mass Avenue Arts District ○ Indiana Avenue Cultural District ○ I do not know
3. Is this business: (Select one) ○ individually owned, for-profit ○ jointly owned, for-profit ○ family owned, for-profit ○ part of a chain or franchise ○ non-profit or not-for profit organization ○ other (please specify) ___________________________________________________ 4. Are you (Select one): ○ the sole owner ○ the joint owner ○ the manager of the business
○ other (please specify): ________________________
Please provide the following demographic information for the small business owner:
5. Gender: ○Male ○Female 6. Age Range: ○ 18-25 ○26-35 ○36-50 ○51-65 ○66+ 7. For how many years have you owned or jointly owned THIS business? ________________________ year(s) 8. Please describe why you got started in this small tourism business. 1= not important, 2=somewhat important, 3= moderately important, 4=very important, 5=extremely important, and N/A = does not apply. To be my own boss 1 2 3 4 5 N/A Appealing lifestyle 1 2 3 4 5 N/A Business Investment 1 2 3 4 5 N/A Meeting people 1 2 3 4 5 N/A Thought it would be fun 1 2 3 4 5 N/A Recognized a market need for the business 1 2 3 4 5 N/A Started because of redundancy or unemployment 1 2 3 4 5 N/A Semi-retirement 1 2 3 4 5 N/A

113 9. How important were the following goals to you when getting started in this business? 1= not important, 2=somewhat important, 3= moderately important, 4=very important, 5=extremely important, and N/A = does not apply. To do what I enjoy while making a living 1 2 3 4 5 N/A To keep my family together 1 2 3 4 5 N/A To live in the right environment 1 2 3 4 5 N/A To support my leisure interests 1 2 3 4 5 N/A To make lots of money 1 2 3 4 5 N/A To gain prestige my operating a business 1 2 3 4 5 N/A To provide a retirement income 1 2 3 4 5 N/A To permit me to become financially independent 1 2 3 4 5 N/A Give back to the community 1 2 3 4 5 N/
Business Employment
10. How many people does this business currently employ, including the management team and family members? Full-time employees (more than 30 hours per week) ___________________ Part-time employees (less than 30 hours per week) ____________________ TOTAL number of employees ____________________________________ 11. Circle your three busiest months Jan Feb Mar Apr May June July Aug Sept Oct Nov Dec
Circle your three slowest months Jan Feb Mar Apr May June July Aug Sept Oct Nov Dec 12. How has the number of people employed in this business changed over the last 12 months and how is it likely to change over the next 12 months? (Please select one box per row) Employment over the last 12 months has: ○Increase ○Remained the Same ○Decreased ○Don’t Know Employment over the last 12 months is likely to: ○Increase ○Remained the Same ○Decreased ○Don’t Know 13. How do you normally recruit staff? (Select all that apply) ○ Word of mouth ○ Professional Associations ○ Job Centers
○ College and universities ○ Local advertisement ○ Employment Services
○ Other (please specify) ________________________

114
Business Operations 14. What have been the major trends for your business over the last 12 months? (Please select one for each row) Increased Remained the Same Decreased Don’t Know Number of customers ○ ○ ○ ○ Average spending of customers ○ ○ ○ ○ Overall business revenue ○ ○ ○ ○ 15. What performance do you anticipate from the business over the next 12 months? (Please select one for each row) Increase Remain the Same Decrease Don’t Know Number of customers ○ ○ ○ ○ Average spending of customers ○ ○ ○ ○ Overall business revenue ○ ○ ○ ○ 16. Have you invested any new capital into the business during the last 12 months?
○ Yes ○ No 17. If yes, from where did you seek the capital? (Please select all boxes that apply) ○ Outside companies ○ Outside private investors
○Bank ○Personal funds
○Finance company ○Grants
○Other (please specify) ___________________________________________ 18. Which of the following (if any) do you see as obstacles to the improved performance of this business? (Please select all that apply) ○ Inflation ○ Labor costs ○ Interest rates ○ High rent ○ Poor cash flow ○ Competition from large business ○ Labor productivity/ Lack of skilled employees
○ Lack of customer demand ○ Government regulations ○ Limited access to finances ○ No support from local government ○ No support from local residents ○ Not enough tourist support
Business Marketing and Advertising
19. Do you have a formal marketing plan for this business? (Select one) ○ Yes, a formal written plan ○ Yes, a formal unwritten plan
○ No
20. How far ahead do you currently plan your marketing activities? (Select one) ○ No plan ○ Up to 1 year ○ 1-2 years ○ 3-5 years ○ 5 years+
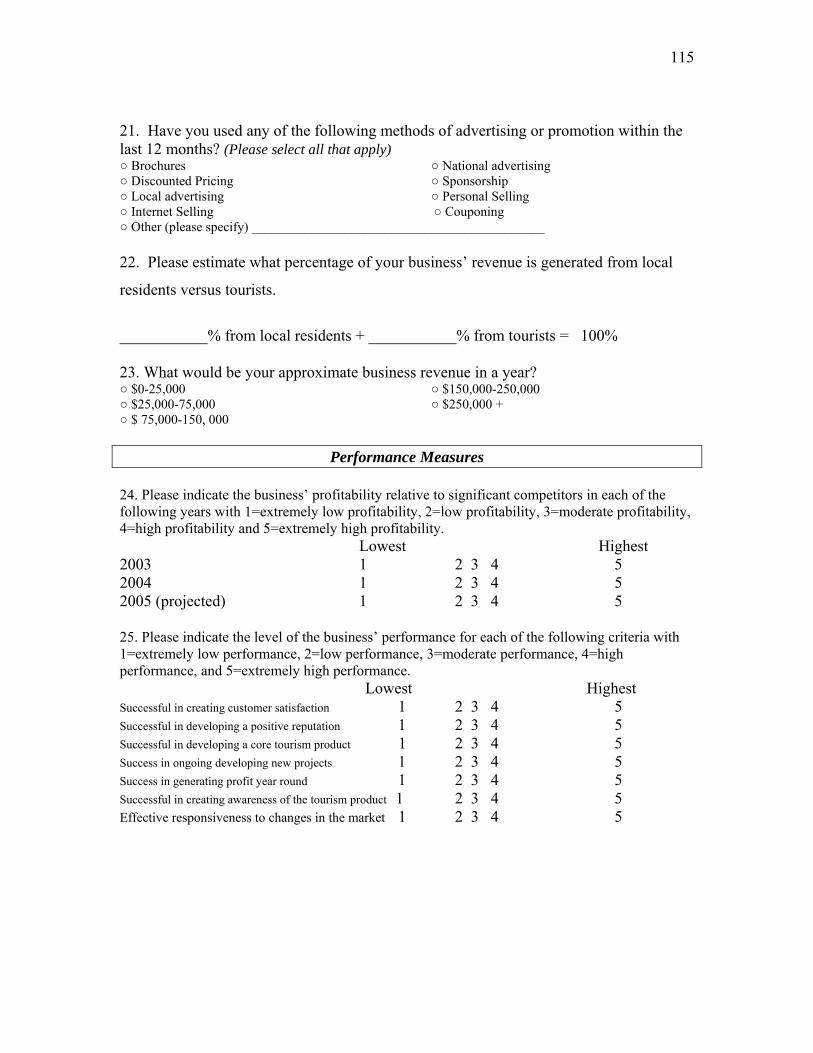
115 21. Have you used any of the following methods of advertising or promotion within the last 12 months? (Please select all that apply) ○ Brochures ○ Discounted Pricing ○ Local advertising
○ National advertising ○ Sponsorship ○ Personal Selling
○ Internet Selling ○ Couponing ○ Other (please specify) ____________________________________________ 22. Please estimate what percentage of your business’ revenue is generated from local
residents versus tourists.
___________% from local residents + ___________% from tourists = 100% 23. What would be your approximate business revenue in a year? ○ $0-25,000 ○ $25,000-75,000 ○ $ 75,000-150, 000
○ $150,000-250,000 ○ $250,000 +
Performance Measures
24. Please indicate the business’ profitability relative to significant competitors in each of the following years with 1=extremely low profitability, 2=low profitability, 3=moderate profitability, 4=high profitability and 5=extremely high profitability. Lowest Highest 2003 1 2 3 4 5 2004 1 2 3 4 5 2005 (projected) 1 2 3 4 5 25. Please indicate the level of the business’ performance for each of the following criteria with 1=extremely low performance, 2=low performance, 3=moderate performance, 4=high performance, and 5=extremely high performance. Lowest Highest Successful in creating customer satisfaction 1 2 3 4 5 Successful in developing a positive reputation 1 2 3 4 5 Successful in developing a core tourism product 1 2 3 4 5 Success in ongoing developing new projects 1 2 3 4 5 Success in generating profit year round 1 2 3 4 5 Successful in creating awareness of the tourism product 1 2 3 4 5 Effective responsiveness to changes in the market 1 2 3 4 5

116
Community Involvement 26. How many professional, civic, religious, charitable or volunteer organizations are you currently a member? ○ No group membership ○ Member of one organization ○ Member of two or three organizations ○ Member of four or more organizations 27. Are you a member of any of the following formal, professional tourism networks? (Select as many as apply) ○ Indianapolis Convention and Visitors Bureau ○ Indianapolis Downtown Inc. (IDI) ○ Downtown Restaurant and Hospitality Association ○ Village, Neighborhood, District Stakeholders Association
○ Merchant Association or Groups ○ Indiana Historical Society ○ Indiana Chamber of Commerce ○ Indiana Originals ○ Indianapolis Downtown Artists and Dealers Association
○ OTHERS ______________________________________________ 28. Are you a member of any of the following civic or service organizations? ○ Kiwanis ○ Indianapolis Junior League ○ Rotary
○ Lion’s ○ American Red Cross
○ Others _______________________________________ 29. Have you participated in community or religious affiliated programs? ○ Church-related participation ○ Sport or activity programs ○ Mentoring
○ Hobby-oriented clubs ○ Education-based programs
30. Since you have become the manager or owner, have you: Held an elected office in your community ○ Yes ○ No Held a leadership position in a local civic organization or church ○ Yes ○ No 31. Have any local groups contacted you for assistance in developing the tourism mission of Indianapolis? ○ Yes ○ No 32. If yes, what groups? ____________________________________________________ 33. Do you see your business as part of the city’s tourism industry? ○ Yes ○ No 34. What areas of tourism development do you wish you were involved in?

117 35 .How much would you support or oppose each type of tourism development for Greater Indianapolis? 1=strongly support, 2=somewhat support 3= somewhat oppose, 4= strongly oppose and 5=don’t know. Continued development of Indiana Convention Center 1 2 3 4 5 New facilities for sports events and teams 1 2 3 4 5 Improved transportation system and roads 1 2 3 4 5 Cultural events, festivals, and downtown events 1 2 3 4 5 Outdoor recreation programs and activities 1 2 3 4 5 Increased tourism and marketing dollars 1 2 3 4 5 Increased efforts to display public art 1 2 3 4 5 Increased taxes to develop infrastructure 1 2 3 4 5 OTHER COMMENTS:
THANK YOU FOR PARTICIPATING IN THIS STUDY! If you would like a copy of the results, please list your email address: ______________________________

118
APPENDIX E Amanda Cecil’s Curriculum Vita

CURRICULUM VITA Amanda Kay Cecil, MA, CMP
Home Address: 3626 Camberwood Court Indianapolis, IN 46268 Home phone: 317.297.6997
Business Address: Indiana University (IUPUI) Department of Tourism, Convention, and Event Management (TCEM) 901 West New York Street, Office 258B Indianapolis, IN 46202 Office Phone: 317.278.8569 Email Address: [email protected]
FORMAL EDUCATION Pursuit of Doctor of Philosophy, Department of Recreation and Parks Administration Emphasis on Leisure Studies and Tourism Anticipated date of graduation: Fall or Spring 2006 Indiana University, Bloomington, Indiana Master of Arts, Department of Sport Management and Administration, May 1997 The Ohio State University, Columbus, Ohio Bachelor of Science, Department of Kinesiology, May 1995 Indiana University, Bloomington, Indiana ACADEMIC WORK EXPERIENCE September 2002- Present Lecturer, Department of Tourism, Conventions and Event
Management, Indiana University – Purdue University Indianapolis (IUPUI)
Course Taught at IUPUI: TCEM 100 - Introduction to Hospitality Management TCEM 110 – College Life Orientation **TCEM 171 – Introduction to Conventions, Meetings and Exposition **TCEM 271 – Mechanics of Meeting Planning TCEM 299 – Cruise Line Management TCEM 305 - Newsletter **TCEM 310 – Special Event Planning **TCEM 319 – Sport Management and Tourism **TCEM 377 – Exhibit Marketing HPER R423 – Visitor Behavior ** Course taught both in the class room (live) and on internet (web-based distance learning)

Courses Developed: TCEM 299 – Cruise Line Management
Teaching and Research Interests: Sports Tourism Cultural Tourism Trends in Meeting and Conventions Customer Services Issues Tourism Marketing Sports Management
PROFESSIONAL ASSOCIATION & LEADERSHIP Industry Certification
Certified Meeting Professional Designation (CMP) - Received certification in 2001 from Convention Liaisons Council (CLC)
Professional Association Memberships and Committees
Professional Conference Management Association (PCMA) 2001 – Present - Serve on the Faculty Committee – 2004-2005. - Serve on Greater Midwest Chapter Student/Faculty Committee. 2004-
2005. Event hosted in Indianapolis, September 24, 2004. - Serve on the Local Organizing Committee (LOC) or 2004 PCMA Annual
Conference in Indianapolis, IN - Serve as a member of the 2004 PCMA Volunteer Committee the annual
conference recruiting over 75 students to assist at the event - Serve as faculty advisor for IUPUI’s PCMA Student Chapter - Serve as the faculty advisor for PCMA student scholarships and awards
David Lueck selected as 2004 Midwest Student Scholarship Winner
Luciane Baier selected 2004-2005 Minority Scholarship winner Megan Leek selected as 2004 “Student Planner of the Year” Megan Leek selected as the 2003 Midwest Student Scholarship
Meeting Professionals International (MPI) 1999-Present
- 2004-2006 Board of Directors – Vice President of Education - Attend monthly board and lunch meetings - Serve on Education Committee - Served on Fundraising and Sponsorship (2003)
International Association of Exhibit Managers (IAEM) 1998-2005

WORKSHOPS/ SPEAKING ENGAGEMENTS Avgoustis, S., Cecil, A., Fu, Y., & Wang, S. (March 2004). Quality of life study townhall meeting. Indianapolis, Indiana. Cecil, A. (March 2004). Using technology to teach and train. Association of Family and Consumer Science, Indianapolis, Indiana. Avgoustis, S. & Cecil, A. (November 2004). Staying informed of changes and trends: A MICE distance education program. 1st International Meetings Industry Conference: Challenges in the New Global Environment, Athens, Greece. Cecil, A. & Brunton-Guerard, N. (October 2004). Impacts of Cruise Tourism. National Recreation and Parks Administration Annual Meeting, Reno, Nevada. Avgoustis, S. & Cecil, A. (July 2004). Urban Cultural Tourism Initiative: An Investigation of an Acceptable Implementation Procedure. International Council on Hotel, Restaurant and Institutional Education (CHRIE) Annual Conference, Philadelphia, Pennsylvania. Cecil, A. & Fu, Y. (April 2004). Demographics of web-based students and their attitudes toward online courses. International Council on Hotel, Restaurant and Institutional Education, Eastern Michigan University, Ypsilanti, Michigan.
Avgoustis, S., Cecil, A., & Leek, M. (October 2003). The Use of a Delphi Study to Identify Implementation Procedures for an Urban Cultural Tourism Initiative: Case of Indianapolis. Annual South Dakota International Business Conference, Northern State University Center of Excellence, Rapid City, South Dakota. Brothers, L. & Cecil, A. (January 2003). Everything but the game. Annual Meeting, USA Soccer Presentation, Indianapolis, Indiana. Guest Speaker Invitation P212: Exercise Science (Dr. Mikesky – 2002; 2004, Dr. Kaleth- 2003, Mr. Bradley - 2004) T450: The Tourism System (Dr. Avgoustis – 2003)

PROFESSIONAL DEVELOPMENT
2005 January- Professional Conference Management Association Annual Conference, Honolulu, HA March – Great Lakes Hospitality Educators Conference, Indianapolis, IN May – Meeting Professionals International Leadership Conference, Dallas, TX June – CMP Conclave, Toronto, Canada 2004 January - Professional Conference Management Association Annual Conference, Indianapolis, IN March – Great Lakes Hospitality Educators Conference, Ypsilanti, Michigan July – International Council on Hotel, Restaurant and Institutional Education (CHRIE) Annual Conference, Philadelphia, Pennsylvania. October – National Recreation and Parks Administration Annual Meeting (NRPA). Reno, Nevada. November - 1st International Meetings Industry Conference: Challenges in the New Global Environment, Athens, Greece. 2003 January - Professional Conference Management Association Annual Conference, Anaheim, California February - American Bus Association, Indianapolis, Indiana March - Meeting Professionals International Tri-State Conference, Indianapolis, Indiana. September - International Association of Exhibit Management Leadership Conference, New York, New York. September- Travel and Tourism Research Conference CenStates, Des Moines, Iowa. October - Dakota Business Conference, Rapid City, South Dakota.
RESEARCH/ SCHOLARLY WORK Published Papers Avgoustis, S. H., Cecil, A.K., Fu, Y., & Wang, S. (2005). Exploring the relationship between cultural tourism and quality of life. Annual Conference Proceedings of Research and Academic Papers, Volume XVII, (pp. 232-241). Chicago, Illinois. Avgoustis, S. H., Cecil, A.K., Fu, Y., & Wang, S. (2005). Exploring the demographics of web-based students and their attitudes towards on-line courses. Proceedings of the 1st International Academic Conference on Hospitality and Tourism, (pp. 52-60). Montego Bay, Jamaica. Avgoustis, S. H., Cecil, A.K., Fu, Y., & Wang, S. (2005). Available city services as predicators of cultural tourism success. Proceeding of the 11th Annual South Dakota International Business Conference. Northern State University Center of Excellence. Avgoustis, S. H. & Cecil, A. (2004). Urban cultural tourism initiative: An investigation of an acceptable implementation procedure. Proceedings of the 2004 International CHRIE Conference, (pp. 1-8). Avgoustis, S. H., Cecil, A., & Leek, M. (2003). The use of a Delphi study to identify implementation procedures for an urban cultural tourism initiative: The case of Indianapolis. Proceeding of the 10th Annual South Dakota International Business Conference, (pp. 9-35). Northern State University Center of Excellence. Research supervisor for the following projects:
• Midwest Music Festival (2005) • Quality of Life Study (2004) • American Bus Association (2003) • Hoosier Horse Fair and Exposition (2003) • Indianapolis “Secret Shopper” (2003)
Textbook Contributor Pizam, A. (2005) International Encyclopedia of Hospitality Management.

AWARDS & NOMINATIONS Awarded School of Physical Education and Tourism Management 2005 Teaching Award Awarded the 2005 PCMA Gem Award Awarded 2004 Lecturer Development Grant-In-Aid ($1000) Awarded the Leisure Research Institute Grant for Research/Travel Funding ($2500) Awarded PCMA Faculty Scholarship (Expenses Paid for Conference Travel) Nominated PCMA “Educator of the Year” and for “Distinguished Service Award” Nominated 2004 PETM “Teacher’s Award” INSTITUTION INVOLVEMENT University Committees Chili for Charity School Committees Technology, 2004 Chair Academic and Student Affairs Sport Management Curriculum Departmental Committees Advisory Board, Co-Chair Golf Scholarship Event Industry Breakfast and Receptions Search and Screen Committee (Faculty)
Recruiting Events Exhibitor at MPI Tri-State Conference Exhibitor at Northwest High School Career Day 21st Century Scholars Monthly Meeting Student Organization IUPUI – PCMA Student Chapter - Advisor Advising Advise 30-50 students per semester on registration and educational issues

PROFESSIONAL EXPERIENCE 2001-2002 Director of Business Development
Event Management Solutions, Atlanta, Georgia 1998-2001 Senior Event Manager/ Meeting Planner
Host Communications, Inc., Lexington, Kentucky 1996-1998 Special Event/Sport Tourism Assistant and Graduate Intern
Columbus Convention and Visitors Bureau, Columbus, Ohio
Other relevant experiences: Special Event Manager – “Aspen Spirit of Skiing” (1997) Facility Management Coordinator - Ohio State University (1996-97)
Marketing Intern - Dartmouth College, Hanover, New Hampshire (1995-96) Special Events Intern – RCA Tennis Championships, Indianapolis, IN (1995)
VOLUNTEER AND COMMUNITY INVOLVEMENT
• Big Brothers/Big Sisters – Involved as Big Sister since 1996 to present. • Indianapolis Junior League – New member in 2004 • American Red Cross Instructor – Current certifications in CPR, AED, First Aid,
Professional Rescuer, Life Guarding and Water Safety Instruction.