amazon cloudfront's last mile testing results
TRANSCRIPT

50 Years of Growth, Innovation and Leadership
A Frost & Sullivan White Paper
Dan Rayburn, Principal, Digital Media Practice
www.frost.com
Comparing CDN Performance: Amazon CloudFront’s Last Mile Testing Results
Sponsored by Amazon Web Services

CONTENTS
Frost & Sullivan
CONTENTS
Overview ................................................................................................................................. 3
Amazon CloudFront: The AWS CDN ................................................................................. 3
AWS’s Unique Approach to Content Delivery ................................................................... 4
How Customers Benefit from Amazon CloudFront Today ................................................ 5
PBS ........................................................................................................................................ 5
Twitpic ................................................................................................................................... 5
Selecting a CDN Based on Performance ............................................................................. 6
“Backbone” Testing ............................................................................................................. 6
“Last Mile” Testing .............................................................................................................. 7
Amazon CloudFront Performance: “Last Mile” Testing Using Compuware Gomez ................................................................. 7
1MB Object Results ............................................................................................................. 8
12KB Object Results ............................................................................................................ 9
Enterprise-Level Testing—An Amazon.com Case Study.................................................... 9
Conclusion .............................................................................................................................. 11
Appendix ................................................................................................................................. 11
CONTENTS
Comparing CDN Performance: Amazon CloudFront’s Last Mile Testing Results
3Frost.com
Amazon CloudFront lowers both the technical and financial bar that’s long been required for delivering content via a CDN while improving customer experience for companies of all sizes.
OVERVIEW
Content Delivery Networks (CDNs) have been around for more than 15 years. CDNs are the key enabling technology behind successful consumer-facing sites in verticals such as media and entertainment, software download delivery, gaming and ecommerce. CDNs give content owners and publishers the ability to rapidly scale to meet increasing user demand all over the world on multiple devices and on different platforms.
This paper provides an introduction to Amazon CloudFront, the CDN from Amazon Web Services (AWS), and highlights two customers that use Amazon CloudFront for their content. The paper provides comparative performance data that shows that Amazon CloudFront is fastest among top CDNs in several latency tests and beats the average latency of other top CDNs in all tests. The paper also presents results of tests run on the Amazon.com site (which runs performance testing on several top CDNs) that shows Amazon CloudFront performance is, on average, seven percent faster than the next closest CDN and 51 percent faster than the third CDN tested.
AMAZON CLOUDFRONT: THE AWS CDN
After AWS launched its Amazon Simple Storage Service (Amazon S3) in 2006, it saw a small, but significant, number of customers using the service in a unique way. These customers would store very little content in Amazon S3, but would deliver large amounts of data. The customers were essentially using Amazon S3 as a CDN. However, Amazon S3 wasn’t built as a CDN, as its name suggests, Amazon S3 was built for durable storage. AWS interpreted this usage pattern as a sign that there was latent demand for a content delivery service with AWS characteristics—high reliability, pay-as-you-go pricing, ease of use and scale. To meet customer need for a global content distribution service, AWS introduced Amazon CloudFront in November of 2008.
Amazon CloudFront is a content delivery network that lets developers get started in minutes with a three-step process that utilizes either the web-based AWS Management Console or Amazon CloudFront’s programmable APIs. First, the customer stores their content on an origin server. While Amazon CloudFront is optimized to work with other AWS services—such as Amazon Elastic Compute Cloud (Amazon EC2), Amazon Elastic Load Balancing and Amazon S3—customers can also use a web server located outside of AWS, say in a customer’s datacenter. Next, the location of the stored content is registered with AWS. Lastly, using the specified AWS domain name or your own personalized domain name, the content is added to your website code, media player or application. When viewers access this content, the Amazon CloudFront service takes over and automatically re-directs them to the nearest edge server on Amazon’s network.
Amazon CloudFront offers benefits such as pay-as-you-go pricing, ease of use and the ability to scale up or down so that customers only pay for what they use without a long-term usage commitment. Amazon CloudFront lowers both the technical and financial bar that’s long been required for delivering content via a CDN while improving customer experience for companies of all sizes.
Frost & Sullivan
4 Frost.com
Part of the way AWS delivers savings to its customers is by
architecting Amazon CloudFront to rely on strategic locations for
their servers, rather than having points of presence everywhere.
AWS’S UNIQUE APPROACH TO CONTENT DELIVERY
Delivering cost savings to the customer without sacrificing feature development is core to Amazon’s DNA. Since AWS launched in March 2006, it has lowered prices 20 times. Amazon CloudFront takes a similar approach and has lowered pricing multiple times since introducing the CDN service. Additionally, in May of 2012, Amazon CloudFront introduced dynamic content capability, offering customers the ability to deliver personalized, dynamic web content at no additional cost.
Unlike many other CDN offerings, Amazon CloudFront does not require customers to sign a long-term or monthly usage contract. With AWS, customers simply pay for only as much or as little content as they actually deliver to end users through the service each month. While Amazon CloudFront requires no usage commitment, customers who have more predictable bandwidth usage—like highly-trafficked sites—can get lower prices by committing to certain delivery volumes in an agreement.
For enterprise companies in particular, Amazon CloudFront allows them to deliver large volumes of content with reliable performance to a global audience at a fraction of the cost of trying to deliver the content themselves using their own in-house infrastructure. Instead of a content owner having to buy their own servers, rent co-location space, buy bandwidth, enter into long-term contracts with a variety of vendors or worry about traffic spikes and delivery performance, the content owner can use Amazon CloudFront. By using Amazon CloudFront, the content owner can focus their time and resources on their core product and services, not infrastructure.
Part of the way AWS delivers savings to its customers is by architecting Amazon CloudFront to rely on strategic locations for their servers, rather than having points of presence everywhere. First generation CDNs tried to deploy as many servers as possible in as many physical locations as possible. By taking a more strategic approach to server placement, AWS is able to continually drive down its costs and pass those savings to its customers.
Amazon CloudFront has built routing logic that provides the best possible user experience by automatically delivering files to users from locations that will deliver the fastest possible download. Because Amazon CloudFront automatically responds as demand increases or decreases without any intervention, organizations don’t have to scramble to meet peak traffic spikes or expend resources estimating how many users will watch a particular video or download a particular application.

Comparing CDN Performance: Amazon CloudFront’s Last Mile Testing Results
5Frost.com
After the migration (to Amazon CloudFront), PBS Interactive reported 50 percent fewer errors in its video streaming performance than with its previous CDN provider.
HOW CUSTOMERS BENEFIT FROM AMAZON CLOUDFRONT TODAY
As of June 2012, more than 25,000 paying customers rely on Amazon’s CloudFront service for the delivery of their static, streaming and dynamic content.
PBS
One such Amazon CloudFront customer is PBS (Public Broadcasting Service), a private, non-profit corporation that offers a wide variety of educational and entertainment programming through television and online content.
PBS Interactive, the team responsible for PBS’s Internet and mobile presence, initially employed a CDN that did not fully meet their needs for delivering streamed media files. This led to periodic failures of streamed videos to start playing as well as the chance that some video streams would freeze and not restart.
Since there was no method of measuring performance degradation through PBS’s existing CDN, the PBS Interactive team had a difficult time identifying the source of these video streaming issues. To improve the system and prevent these types of issues, PBS Interactive implemented a monitoring tool that could also be used to test other CDNs, including AWS. After monitoring multiple CDNs for a few weeks, PBS Interactive—already an AWS customer—found that Amazon CloudFront had a significantly lower error rate than the incumbent CDN.
As a result, PBS Interactive migrated to Amazon CloudFront in a matter of weeks. Today, PBS Interactive is delivering more than one petabyte of video content every month through the Amazon CloudFront service. After the migration, PBS Interactive reported 50 percent fewer errors in its video streaming performance than with its previous CDN provider. The department is also able to conduct error testing more quickly on AWS than with its previous provider by analyzing Amazon CloudFront log files. PBS Interactive attributed the faster response time to Amazon CloudFront features such as invalidation, which allowed PBS Interactive to rapidly remove bad files and quickly refresh its cache.
Twitpic
While many content owners might have the need to deliver video, there are plenty of non-video-related uses for CDNs that require the same level of performance and scalability for the delivery of smaller objects like photos.
A great example of this would be Twitpic, a popular cloud-based service that allows users to easily post pictures to Twitter and other social media platforms. Today, Twitpic stores more than two billion objects with AWS, and each day Twitpic gets millions of photos uploaded to its platform. As a result of the popularity of the platform, Twitpic’s traffic continues to grow each month and the company relies on multiple AWS offerings, including Amazon CloudFront.
Without Amazon CloudFront and Amazon S3, Twitpic would not have been able to grow its business so fast over the past three years. With only eight employees, utilizing AWS enables
Frost & Sullivan
6 Frost.com
As a result of the switch from an
in-house CDN to Amazon CloudFront,
Twitpic has seen bandwidth savings
that averages $70,000 a month.
Twitpic to stay focused on its core business and drive value to end users. Without AWS, Twitpic would need to apply valuable resources toward purchasing, installing, managing, patching and updating its own systems, requiring the company—in its estimation—to hire three additional full-time systems administrators.
Twitpic started using Amazon CloudFront as its CDN in conjunction with its existing AWS environment to speed up the delivery of photos, reduce bandwidth cost and provide a better user experience for international and U.S. customers. As a result of the switch from an in-house CDN to Amazon CloudFront, Twitpic has seen bandwidth savings that average $70,000 a month.
“Every year we do a build-versus-buy analysis with our business, and each time we quickly realize that we can’t save money by bringing our CDN in-house. Trying to implement a CDN platform as cost-effectively or with the same level of performance as is offered by Amazon CloudFront simply isn’t doable,” said Steve Corona, CTO, Twitpic.
SELECTING A CDN BASED ON PERFORMANCE
When selecting a CDN, customers should consider many factors such as performance, cost, features (e.g., support for streaming or dynamic content), whether there is a long-term contract requirement, ease of use, SLA and other factors.
One of the ways CDN vendors look to distinguish their services is by providing different kinds of performance-based metrics. These metrics come from testing the speed and performance of content being delivered over the CDN for a given length of time and within a certain geographic region.
When it comes to performance testing, there are no agreed-upon standards in the market as to the best way to measure performance across a CDN. Since vendors tend to use different methodologies for testing and these tests may have certain strengths and weaknesses, it’s often very hard to do an apples-to-apples comparison amongst CDN offerings. As a result, organizations can have a hard time comparing the performance of various CDN offerings.
“Backbone” Testing
There are two quite different types of network performance measurement techniques. The test most popular amongst CDNs is called “Backbone” testing. “Backbone” tests demonstrate how fast your site loads at major Internet hubs. The test ignores the CDN’s performance from the Internet hub to the specific device a customer is using, thus the test is not measuring the true customer experience. Most CDNs use this test because it is easier to implement, takes less time and costs less money.
Of course the problem with this method, as mentioned before, is that it’s not a real-world result. Customers don’t live in datacenters, and this testing method ignores the most important element of incorporating a CDN into your IT infrastructure: improving customer experience by more rapidly delivering content to user’s devices. The other problem with testing the

Comparing CDN Performance: Amazon CloudFront’s Last Mile Testing Results
7Frost.com
For any customer or enterprise user looking to get real-world network performance results from any vendor, they should make sure to insist that the vendor’s methodology includes testing the “Last Mile” of delivering content to consumers.
performance of a network on the “Backbone” and at the data center level is that vendors can do some tricks to optimize performance results, such as strategically placing CDN servers at specific locations near known “Backbone” testing agents, thus ensuring optimal test results.
“Last Mile” Testing
The alternative type of CDN performance measurement is called “Last Mile” testing. While some may want to debate which measurement method is better, there is no question that “Last Mile” measurement of CDN performance is a much more realistic interpretation of end-user experience. “Last Mile” testing incorporates measurement of how quickly content is delivered from the CDN’s server to the consumer’s device, incorporating the last leg of connectivity services required to deliver content from an Internet service provider (ISP) to the customer. For any customer or enterprise user looking to get real-world network performance results from any vendor, they should insist that the vendor’s methodology includes testing the “Last Mile” of delivering content to consumers.
There are two different ways that you can measure results to the user’s device. The first is to use independent performance testing companies such as Compuware Gomez that can be configured to perform objective “Last Mile” testing of CDN performance. Using a third-party performance testing company is the most common way that CDN vendors measure their own latency for delivering objects to real-world users located around the globe.
A second valid method of “Last Mile” testing can be conducted by instrumenting a client application or website to collect real latency statistics from actual users or visitors. This approach is typically used by CDN customers to understand the actual performance they are getting from their CDN provider or providers.
Neither of these approaches is inherently better or worse than the other. Both provide accurate observations that precisely capture end-users’ experiences. Below, we will look at data collected by each of these two ways of measuring “Last Mile” performance.
AMAZON CLOUDFRONT PERFORMANCE: “LAST MILE” TESTING USING COMPUWARE GOMEZ
AWS uses Compuware Gomez as an independent testing company to run “Last Mile” tests that compare Amazon CloudFront’s performance to three other top-tier CDNs – Akamai, Level 3 and Limelight. Compuware Gomez collects data from more than 150,000 real consumer desktops connected to more than 2,500 local ISPs and wireless carriers around the globe. These measurements provide a view into real-world Internet conditions that companies can’t get from traditional data center testing or “Backbone” testing.
In this particular performance measurement, two object sizes were selected for comparison testing during a seven-day period – a 12KB and a 1MB object. These objects sizes were chosen because they are representative of both large and small objects that are commonly delivered on web sites or in applications. The exact same objects were used for testing the performance of each CDN.
Frost & Sullivan
8 Frost.com
For all geographies tested, Amazon
CloudFront delivered the 1MB objects to
customer devices approximately ten
percent faster than the average latency across
all tested CDNs.
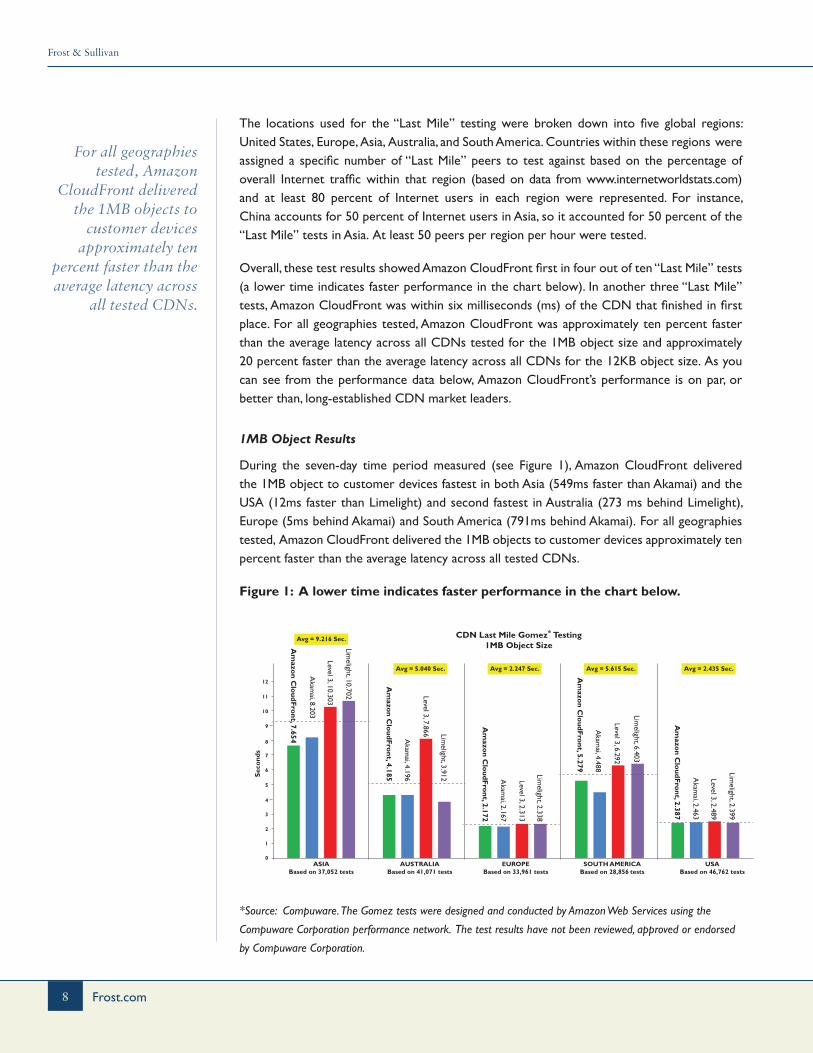
The locations used for the “Last Mile” testing were broken down into five global regions: United States, Europe, Asia, Australia, and South America. Countries within these regions were assigned a specific number of “Last Mile” peers to test against based on the percentage of overall Internet traffic within that region (based on data from www.internetworldstats.com) and at least 80 percent of Internet users in each region were represented. For instance, China accounts for 50 percent of Internet users in Asia, so it accounted for 50 percent of the “Last Mile” tests in Asia. At least 50 peers per region per hour were tested.
Overall, these test results showed Amazon CloudFront first in four out of ten “Last Mile” tests (a lower time indicates faster performance in the chart below). In another three “Last Mile” tests, Amazon CloudFront was within six milliseconds (ms) of the CDN that finished in first place. For all geographies tested, Amazon CloudFront was approximately ten percent faster than the average latency across all CDNs tested for the 1MB object size and approximately 20 percent faster than the average latency across all CDNs for the 12KB object size. As you can see from the performance data below, Amazon CloudFront’s performance is on par, or better than, long-established CDN market leaders.
1MB Object Results
During the seven-day time period measured (see Figure 1), Amazon CloudFront delivered the 1MB object to customer devices fastest in both Asia (549ms faster than Akamai) and the USA (12ms faster than Limelight) and second fastest in Australia (273 ms behind Limelight), Europe (5ms behind Akamai) and South America (791ms behind Akamai). For all geographies tested, Amazon CloudFront delivered the 1MB objects to customer devices approximately ten percent faster than the average latency across all tested CDNs.
Figure 1: A lower time indicates faster performance in the chart below.
CDN Last Mile Gomez* Testing1MB Object Size
Sec
ond
s
ASIABased on 37,052 tests
EUROPEBased on 33,961 tests
SOUTH AMERICABased on 28,856 tests
USABased on 46,762 tests
0
Avg = 9.216 Sec.
Avg = 2.247 Sec. Avg = 5.615 Sec. Avg = 2.435 Sec.
2
3
4
5
6
7
8
9
10
11
12
1
Limelight, 2.399
Level 3, 2.489
Akam
ai, 2.463
Am
azon C
loudFro
nt, 2.387
Limelight, 6.403
Level 3, 6.292
Akam
ai, 4.488
Am
azon C
loudFro
nt, 5.279
Limelight, 2.338
Level 3, 2.313
Akam
ai, 2.167
Am
azon C
loudFro
nt, 2.172
Limelight, 10.702
Level 3, 10.303
Akam
ai, 8.203
Am
azon C
loudFro
nt, 7.654
AUSTRALIABased on 41,071 tests
Avg = 5.040 Sec.
Limelight, 3.912
Level 3, 7.866
Akam
ai, 4.196
Am
azon C
loudFro
nt, 4.185
*Source: Compuware. The Gomez tests were designed and conducted by Amazon Web Services using the
Compuware Corporation performance network. The test results have not been reviewed, approved or endorsed
by Compuware Corporation.
Comparing CDN Performance: Amazon CloudFront’s Last Mile Testing Results
9Frost.com
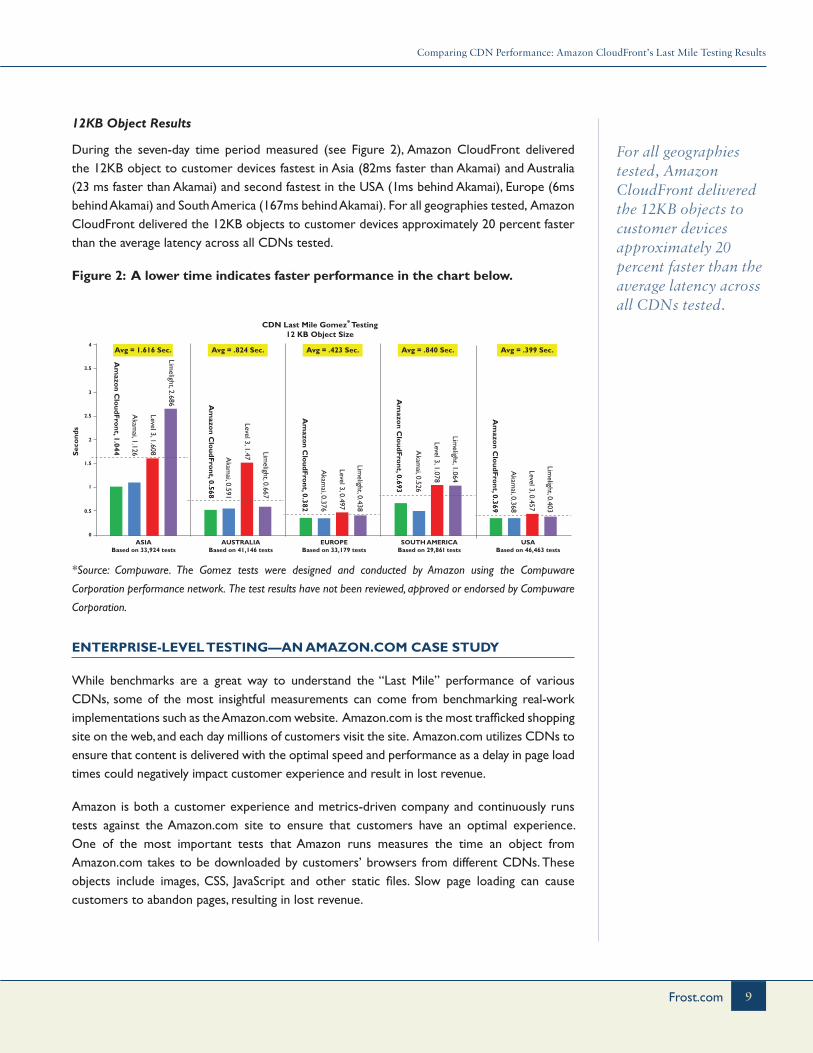
For all geographies tested, Amazon CloudFront delivered the 12KB objects to customer devices approximately 20 percent faster than the average latency across all CDNs tested.
12KB Object Results
During the seven-day time period measured (see Figure 2), Amazon CloudFront delivered the 12KB object to customer devices fastest in Asia (82ms faster than Akamai) and Australia (23 ms faster than Akamai) and second fastest in the USA (1ms behind Akamai), Europe (6ms behind Akamai) and South America (167ms behind Akamai). For all geographies tested, Amazon CloudFront delivered the 12KB objects to customer devices approximately 20 percent faster than the average latency across all CDNs tested.
Figure 2: A lower time indicates faster performance in the chart below.
CDN Last Mile Gomez* Testing12 KB Object Size
Sec
ond
s
ASIABased on 33,924 tests
EUROPEBased on 33,179 tests
SOUTH AMERICABased on 29,861 tests
USABased on 46,463 tests
0
4
3.5
3
Avg = 1.616 Sec. Avg = .423 Sec. Avg = .840 Sec. Avg = .399 Sec.
2.5
2
1.5
1
0.5
Limelight, 0.403
Level 3, 0.457
Akam
ai, 0.368
Am
azon C
loudFro
nt, 0.369
Limelight, 1.064
Level 3, 1.078
Akam
ai, 0.526
Am
azon C
loudFro
nt, 0.693
Limelight, 0.438
Level 3, 0.497
Akam
ai, 0.376
Am
azon C
loudFro
nt, 0.382
Limelight, 2.686
Level 3, 1.608
Akam
ai, 1.126
Am
azon C
loudFro
nt, 1.044
AUSTRALIABased on 41,146 tests
Avg = .824 Sec.
Limelight, 0.667
Level 3, 1.47Akam
ai, 0.591
Am
azon C
loudFro
nt, 0.568
*Source: Compuware. The Gomez tests were designed and conducted by Amazon using the Compuware
Corporation performance network. The test results have not been reviewed, approved or endorsed by Compuware
Corporation.
ENTERPRISE-LEVEL TESTING—AN AMAZON.COM CASE STUDY
While benchmarks are a great way to understand the “Last Mile” performance of various CDNs, some of the most insightful measurements can come from benchmarking real-work implementations such as the Amazon.com website. Amazon.com is the most trafficked shopping site on the web, and each day millions of customers visit the site. Amazon.com utilizes CDNs to ensure that content is delivered with the optimal speed and performance as a delay in page load times could negatively impact customer experience and result in lost revenue.
Amazon is both a customer experience and metrics-driven company and continuously runs tests against the Amazon.com site to ensure that customers have an optimal experience. One of the most important tests that Amazon runs measures the time an object from Amazon.com takes to be downloaded by customers’ browsers from different CDNs. These objects include images, CSS, JavaScript and other static files. Slow page loading can cause customers to abandon pages, resulting in lost revenue.

Frost & Sullivan
10 Frost.com
The vast majority of traffic on the
Amazon.com site is currently served by
Amazon CloudFront.
The Amazon.com team that manages content delivery developed a testing system to continuously measure how long it takes objects to be delivered to real customers’ browsers from CDNs. This system was developed to ensure that the CDNs they are using are consistently delivering at the fastest speeds.
A random sample made up of five percent of all Amazon.com pages that are viewed by customers around the world are tested continuously against multiple CDNs. This equates to millions of pages being tested, and the tests measure how long it takes objects to be delivered to real customer browsers from CDNs (similar to “Last Mile” testing or real-user experience). For each page tested, two requests are made against every CDN in order to measure CDN latency. The first request ensures that the connection between the browser and edge cache is primed, and the second request is used to measure the latency of downloading the objects from the edge cache. All CDNs are tested in the exact same manner.
The chart below (see Figure 3) shows global latency times for each of the three CDNs used by Amazon.com over a 30-day period for non-SSL traffic. The vertical axis shows the upper bound of response times for 90 percent of the requests made to the CDN. For instance, if the vertical axis shows 0.75 seconds for a CDN on a given date, it means that the CDN responded in faster than 0.75 seconds for 90 percent of requests made that day. The results show that over the period tested, Amazon CloudFront’s performance was, on average, seven percent faster than large “CDN A” and 51 percent faster than large “CDN B.”
Figure 3
www.amazon.com - Site Latency by CDN*
for Non-SSL Traffic
Sec
ond
s
CDN B
CDN A
1.2
1
0.8
0.6
0.4
0.2
3/23
3/26
3/29
4/1
4/4
4/7
4/10
4/13
4/16
4/19
4/22
0
Amazon CloudFront
CloudFront Latency CDN A Latency CDN B Latency
Amazon CloudFront is 7%faster than CDN A and 51%
faster than CDN B
*90 percent of requests made to the CDN were returned in less than this time
Amazon.com has long employed a multi-CDN strategy. While the vast majority of traffic on the Amazon.com site is currently served by Amazon CloudFront, this was not always the case. Amazon CloudFront had to win Amazon.com’s business just like any other CDN—on price and performance. In order to keep the business, Amazon CloudFront has to continue to be as fast as or faster than the other CDNs that Amazon.com has been using for many years.

Comparing CDN Performance: Amazon CloudFront’s Last Mile Testing Results
11Frost.com
Speed of delivery and performance are key principles behind Amazon’s CDN service proven by customer and third party testing, ranking Amazon CloudFront as an industry leading top-tier CDN.
CONCLUSION
For content owners looking to deliver small and large objects over the Internet, choosing the best CDN partner for their business can be challenging. With all the various options in the market, it can be difficult for customers to figure out who offers the best service in the industry.
Amazon’s CloudFront CDN service complements the Amazon Web Services platform to give customers an integrated one-stop shop that provides scale and ease of use at an affordable cost. Speed of delivery and performance are key principles behind Amazon’s CDN service, proven by customer and third-party testing, ranking Amazon CloudFront as an industry-leading top-tier CDN.
APPENDIX
Understanding CDNs
While many vendors use different network architectures, at a high-level, all CDNs essentially work the same way. CDNs place a large network of distributed servers located in multiple cities all over the world. These servers are connected to the Internet and store or connect to local copies of the customer’s content. By caching the content closest to the end user, it improves the end-user experience by decreasing the amount of time (or latency) it takes to deliver the content to the end-user’s device.
Today, many different kinds of CDN are offered in the industry for delivering everything from small objects, like images on websites, video for streaming sites, to e-commerce applications and software downloads. In fact, the market for these content delivery services is growing so fast that analyst firm Frost & Sullivan predicts the worldwide market for the delivery of content, via third-party CDNs, will grow to more than $5 billion by 2015. While the type of content can vary, as well as the application it is being used for, the central benefit of a CDN is quite often focused on improving end-user experience by more rapidly delivering content.
For video applications, this could be the time it takes the video to start up and to keep it playing smoothly. For content involving gaming, consumers need to have the best experience possible since they are using real-time applications. For large and small objects, we all want websites that load images and files as fast as possible, while allowing us to download what we need with speed and accuracy. These are some of the benefits that CDNs provide by delivering the content with better performance via their distributed network.
Over the past few years, one of the fastest growing segments of the CDN industry has been the use of CDNs to deliver live and on-demand video for content owners in enterprise markets, for the syndication of broadcast and media and entertainment-related content. But CDNs aren’t just for enterprises or those who are trying to distribute popular movies and TV shows. CDNs also play a crucial role in giving startups the ability to grow their business, providing them with the flexibility to only pay for what they use, thereby allowing the business to invest crucial capital toward delivering innovative products and services. Companies big and small from every industry vertical all use CDNs for many different kinds of applications.
877.GoFrost • [email protected]://www.frost.com
Auckland Bahrain Bangkok Beijing Bengaluru Bogotá Buenos Aires Cape Town Chennai Colombo Delhi / NCR Dhaka
Dubai Frankfurt Hong Kong Istanbul Jakarta Kolkata Kuala Lumpur London Manhattan Mexico City Miami Milan
Mumbai Moscow Oxford Paris Pune Rockville Centre San Antonio São Paulo Seoul Shanghai Shenzhen Silicon Valley
Singapore Sophia Antipolis Sydney Taipei Tel Aviv Tokyo Toronto Warsaw Washington, DC
877.GoFrost • [email protected]://www.frost.com
ABOUT AMAZON WEB SERVICES
Launched in 2006, Amazon Web Services (AWS) began exposing key infrastructure services to businesses in the form of web services — now widely known as cloud computing. The ultimate benefit of cloud computing, and AWS, is the ability to leverage a new business model and turn capital infrastructure expenses into variable costs. Businesses no longer need to plan and procure servers and other IT resources weeks or months in advance. Using AWS, businesses can take advantage of Amazon’s expertise and economies of scale to access resources when their business needs them, delivering results faster and at a lower cost. Today, Amazon Web Services provides a highly reliable, scalable, low-cost infrastructure platform in the cloud that powers hundreds of thousands of enterprise, government and startup customers businesses in 190 countries around the world. AWS offers over 28 different services, including Amazon Elastic Compute Cloud (Amazon EC2), Amazon Simple Storage Service (Amazon S3) and Amazon Relational Database Service (Amazon RDS). AWS services are available to customers from data center locations in the U.S., Brazil, Europe, Japan and Singapore.
ABOUT FROST & SULLIVAN
Frost & Sullivan, the Growth Partnership Company, works in collaboration with clients to leverage visionary innovation that addresses the global challenges and related growth opportunities that will make or break today’s market participants. For more than 50 years, we have been developing growth strategies for the global 1000, emerging businesses, the public sector and the investment community. Is your organization prepared for the next profound wave of industry convergence, disruptive technologies, increasing competitive intensity, Mega Trends, breakthrough best practices, changing customer dynamics and emerging economies? Contact Us: Start the Discussion
For information regarding permission, write: Frost & Sullivan 331 E. Evelyn Ave. Suite 100 Mountain View, CA 94041
Silicon Valley 331 E. Evelyn Ave. Suite 100 Mountain View, CA 94041 Tel 650.475.4500 Fax 650.475.1570
San Antonio 7550 West Interstate 10, Suite 400, San Antonio, Texas 78229-5616 Tel 210.348.1000 Fax 210.348.1003
London 4, Grosvenor Gardens, London SWIW ODH,UK Tel 44(0)20 7730 3438 Fax 44(0)20 7730 3343
Auckland Bahrain Bangkok Beijing Bengaluru Bogotá Buenos Aires Cape Town Chennai Colombo Delhi / NCR Dhaka
Dubai Frankfurt Hong Kong Istanbul Jakarta Kolkata Kuala Lumpur London Manhattan Melbourne Mexico City Miami
Milan Mumbai Moscow Oxford Paris Pune Rockville Centre San Antonio São Paulo Seoul Shanghai Shenzhen
Silicon Valley Singapore Sophia Antipolis Sydney Taipei Tel Aviv Tokyo Toronto Warsaw Washington, DC