ambank group results · pdf fileambank group results investors presentation 9mfy2011 results...
TRANSCRIPT

AMBANK GROUP – INVESTOR RELATIONS – PRESENTATION 9MFY2011
AMMB Holdings Berhad
Cheah Tek KuangGroup Managing Director
AmBank Group Results
Investors Presentation
9MFY2011 Results Update18 February 2011

AMBANK GROUP – INVESTOR RELATIONS – PRESENTATION 9MFY2011 1(Conventional + Islamic)
AmBank Group:
• More than 30 years of banking franchise
• Top 20 Bursa Saham listing, ranked top 170 on globalbanking index
• 3 consecutive years of record performance (FY08-FY10), on track to deliver the 4th
FY2011 Performance:
• 9MFY2011 PATMI up 34%
• FY2011 PATMI expectations circa +30%
• Staying focused on profitable growth, diversificationand sustainability
• Ratings upgraded 1-notch recently1
FY2012 onwards:
• 2011 GDP expected to slow to 5-5.5%, with ETP providingsome support
• Well positioned for growth, will continue leveraging onour customer focused business models and ANZ todifferentiate
9MFY2011 Highlights
Note : Update since H1FY2011 Investors Presentation highlighted in italics and blue1 AmBank (M) and AmInvestment Bank upgraded to BBB/A-2/Stable by S&P on 15 December 2010

AMBANK GROUP – INVESTOR RELATIONS – PRESENTATION 9MFY2011 2(Conventional + Islamic)
Contents
9MFY2011 Group Financial Performance
Strategy & Outlook
Divisional Performance
Supplementary Information
Executive Summary

AMBANK GROUP – INVESTOR RELATIONS – PRESENTATION 9MFY2011 3(Conventional + Islamic)
Maintaining earnings growth momentumP
erf
orm
an
ce
Profit after Tax & MI (PATMI)
ROE
Ris
k, C
apit
al &
Fu
nd
ing
Pro
file
RWCA
Tier 1
Gross Impaired Loans
Gro
wth Net Lending / Financing 1
Customer Deposits 2
LD Ratio 3
EPS(basic, annualised)
95.5%
N/A
67,293 mil
64,239 mil
35.4 sen
11.9%
766.9 mil
9MFY10
90.5%
3.4%
76,852 mil
69,529 mil
45.3 sen
13.9%
1,026.5 mil
9MFY11
5.0%
N/A
14.2%
8.2% 4
28.0%
2.0%
34%
Change
ROA 1.15% 1.43% 0.28%
FY09 FY10
88.7%
9.7%
15.2%
N/A
65,192 mil
57,854 mil
31.6 sen
11.7%
860.8 mil
91.5%
10.3%
15.8%
3.8%
70,776 mil
64,772 mil
34.7 sen
11.5%
1,008.6 mil
1.04% 1.13%
15.3%
9.8%
Note :1 Includes Islamic loans sold with recourse : 9MFY10 = RM365mil and 9MFY11 =RM1,582mil 2 Adjusted customer deposits includes Senior Notes RM3.39 bil, credit-linked notes RM0.17bil, loans sold with and without recourse3 Based on net loans including loans sold with recourse, over adjusted customer deposits as above4 AmBank Group’s 2-year net loans growth CAGR = 9.6%; system 2-year loans growth CAGR = 10.1%
15.1% 0.2%
9.4% 0.4%

AMBANK GROUP – INVESTOR RELATIONS – PRESENTATION 9MFY2011 4(Conventional + Islamic)
Staying focused on profitable growth, diversification and sustainability
Staying Ahead
Strong 9M results Higher revenues and lower
allowances
Good loans & customer deposits
growth
FRS139 adopted under BNM transition
arrangements since April 2010
Implemented customer segmentation
and focus across all divisions
Well diversified Divisional contributions
Sound contributions from Retail and Business Banking Divisions
Diversified portfolios yielding higher profits in Life Assurance, General Insurance and Markets
Good pipeline for Corporate & Institutional Banking and Investment Banking
Improved risk, funding, and financial disciplines
Proactive risk management
Balance sheet positioned for rising interest rates and Basel III
Implemented new FTP* and FRS disciplines
FY 2011 Priorities
FY2011 : Profitable growth, diversification & rebalancing Faster non-interest income & CASA growth Taking opportunities in growth plans
MTA : Malaysia’s Preferred Banking Group with International Connectivity Customer satisfaction Sound financial performancesWell diversified and sustainable growth
* FTP = funds transfer pricing

AMBANK GROUP – INVESTOR RELATIONS – PRESENTATION 9MFY2011 5(Conventional + Islamic)
Note :1 In-house research2 Update since H1FY2011 Investors Presentation highlighted in italics and blue
Opportunity
• Malaysian economic recovery to continue (GDP CY 2010e :7.0%1, CY 2011e : 5-5.5%1) with higher retail consumption
• 2011 looking positive but not immune to possible globalshocks
• Supportive monetary policies, continued trade surplus;domestic demand leading the way
• Economic Transformation Programme (ETP) and recentlyannounced EPP’s (entry point projects) to mitigate global riskand moderating external demand
• System lending growth may moderate in CY 2011• Anticipating OPR hike of circa 50bps in CY2011• Higher common equity & stable funding requirements
under Basel III, but with longer transition period
• Execute to strategic themes and strengthen marketpositions
• Leverage opportunities available in domestic economygrowth plans
• Better positioned for rising interest rates• Leverage ANZ’s international connectivity
2Industry :Emerging
Opportunities & Challenges
1Malaysia :
Stable Outlook
3AHB :
Leveraging Tailwinds

AMBANK GROUP – INVESTOR RELATIONS – PRESENTATION 9MFY2011
AMMB Holdings Berhad
Ashok RamamurthyDeputy Group Managing Director &
Group Chief Financial Officer
AmBank Group Results
Investors Presentation
9MFY2011 Results Update18 February 2011

AMBANK GROUP – INVESTOR RELATIONS – PRESENTATION 9MFY2011 7(Conventional + Islamic)
Contents
Executive Summary
Strategy & Outlook
Divisional Performance
9MFY2011 Group Financial Performance
Supplementary Information

AMBANK GROUP – INVESTOR RELATIONS – PRESENTATION 9MFY2011 8(Conventional + Islamic)
Strong and consistent financial performance for 9MFY2011
Business Performance
Income :
Good growth from most Divisions, 9MFY11 run-rate better than FY2010 full year
Higher trading income in 9MFY2010 due to a large gain on disposal of an underwritten bond issuance
Non interest income = 30.4% of total income
Expenses :
Salary & staffing increases, CPI & ongoing medium term investments but within CTI targets
Impairments / Allowances :
Lower individual & collective impairments (combined)
Includes PER, impairment losses & allowances for commitments & contingencies
Islamic banking contributed 17.7% to Group’s PAT, down from 30.7% due to large gain on disposal of an underwritten bond issuance in 9MFY10
9MFY10 results Positive growth in 9MFY11 Contraction in 9MFY11
Fee57%
Trading26%
Insurance
15%
Others1%
Non-Interest Income Composition
RM'mil 9MFY10 9MFY11
Net interest income 1,848.3 2,053.7 +11.1%
Fee and commission 468.8 513.0 +9.4%
Investment and trading 248.7 236.3 -5.0%
Insurance business 92.9 136.1 +46.5%
Others 11.3 12.4 +9.7%
Total Income 2,670.0 2,951.4 +10.5%
Expenses 1,089.9 1,165.9 +7.0%
PBP 1,580.0 1,785.5 +13.0%
Impairments / Allowances 512.2 345.9 -32.5%
PBT 1,067.9 1,439.6 +34.8%
PAT 791.5 1,064.7 +34.5%
PATMI 766.9 1,026.5 +34%
9MFY11 vs
9MFY10
GG
G
GG
G
G
G
G
G

AMBANK GROUP – INVESTOR RELATIONS – PRESENTATION 9MFY2011 9(Conventional + Islamic)
Retail, 44%
Business,14%CIB, 15%
Investment, 9%
Markets, 15%
Life, 5%
General,4%
Operating-6%
PATMI contribution %
Well diversified contributions
Business Performance
Retail Banking - profit growth via focus on viable segments
Business Banking - well-balanced profits with income growth and lower allowances
Investment banking – good pipeline, slower start in Q1FY11 but picked up in Q2 and Q3
CIB – higher incomes from lending and international businesses
Life Assurance and General Insurance - higher incomes from larger fund base and better efficiencies
Markets – higher contribution from Fx and Derivatives
Note 1 : Life Assurance surplus is transferred into life policy shareholders’ fund in overall Group accounts
PATMI (by division)
9MFY10 results Positive growth in 9MFY11 Contraction in 9MFY11
10%
RM'mil 9MFY10 9MFY11
Retail Banking 399.3 450.1 +12.7%
Business Banking 125.9 148.8 +18.2%
Corporate & Institutional
Banking (CIB) 124.8 153.5 +23.0%
Investment Banking 104.2 90.5 -13.1%
Markets 88.6 151.2 +70.7%
Assurance 56.7 97.8 +72.5%
Life Assurance 19.1 51.6 +>100%
General Insurance 37.6 46.2 +22.9%
Operating Segments (132.6) (65.4) +50.7%
9MFY11 vs
9MFY10

AMBANK GROUP – INVESTOR RELATIONS – PRESENTATION 9MFY2011 10(Conventional + Islamic)
3.63% 3.66%
3.44%
2.68%
2.89%
2.47%
2.83%3.04%
2.98% 2.97%
FY07 FY08 FY09 FY10 9MFY11
NIM and Cost of Funds
Cost of funds NIM
511.2
6.6 121.3
638.2 618.2
298.5
123.7
1,058.5
513.0
236.3 136.1
897.7
Fee income Trading & Investment income
Insurance business Total non-interest income
Non-Interest Income, RM'mil
FY09 FY10 9MFY11
Moderating NIM* and improving efficiency
Business Performance
* NIM up YoY, but reducing QoQ due to :
Interest in suspense being disclosed under
impairments per FRS139 requirements
Immediate benefit from BLR increases
Lagged impact of term deposit increase on cost of
funds
• Lower CTI mainly due to higher income
• Non-interest income / total income stable compared
to prior corresponding period, but higher than FY10
of 29.6%
9MFY10 results Positive growth in 9MFY11 Contraction in 9MFY11
Note :1 Net Interest Margin includes Net Financing Income from Islamic Banking business : 9MFY10 – 0.73% and 9MFY11 – 0.70%2 NIM FY07-FY10 as per reported in previous investors’ presentations3 COF FY07-FY08 based on data as disclosed in annual reports, FY09-9MFY11 based on internal data computation
% non-interest income / total incomeFY09 : 21.8% FY10 : 29.6% 9MFY11 : 30.4%
9MFY10 9MFY11
Net Interest Margin
(NIM & NFR composite) 2.92% 2.97% +0.05%
Cost-Income
(CTI) 40.8% 39.5% -1.3%
Cost-Asset
(CTA) 1.58% 1.56% -0.02%
Profit before Tax (PBT)
/ Employee (RM'mil) 0.14 0.18 30.3%
Non-interest income /
Total Income 30.8% 30.4% -0.4%
9MFY11 vs 9MFY10
GG
G
GGGGGGGGG

AMBANK GROUP – INVESTOR RELATIONS – PRESENTATION 9MFY2011 11(Conventional + Islamic)
40.2
51.658.4 62.4
67.35.3
6.3
6.88.4
9.5
FY07 FY08 FY09 FY10 9MFY11
RM'bil
Customer Deposits
CASA All other deposits
53.5 56.9 59.766.6
71.9
FY07 FY08 FY09 FY10 9MFY11
RM'bilGross Loans
Balancing loans and strong CASA / customer deposits growth
Business Performance
Loans growth targeting viable
and profitable segments
Improving funding profiles
LD ratio within acceptable levels
Note :1 Adjusted Customer Deposits : includes RM3.39 bil Senior Notes, RM0.17bil credit-linked notes, loans sold with and without recourse2 LD : net loans including loans sold with recourse / adjusted customer deposits + loans sold with and without recourse
9MFY10 results Positive growth in 9MFY11 Contraction in 9MFY11
Customer 45.5b 57.9b 65.2b 70.8b 76.9bdeposits 1
p 7.9%p 8.6%
RM'mil 9MFY10 9MFY11
Balance Sheet - Lending / Financing
Gross Loans / Financing 66,311.7 71,874.8 +8.4%
Net Loans / Financing 64,238.9 69,529.0 +8.2%
Balance Sheet - Deposits
Customer Deposits 67,292.6 76,851.6 +14.2%
LD Ratio 95.5% 90.5% -5.0%
CASA Deposits 8,227.8 9,540.2 +16.0%
CASA Proportion 12.3% 13.5% +1.2%
9MFY11 vs 9MFY10
1
2
2

AMBANK GROUP – INVESTOR RELATIONS – PRESENTATION 9MFY2011 12(Conventional + Islamic)
2.24%1.92% 1.73% 3.18%
0.97% 0.60%0.88%
0.56% 0.59% 0.69%
14.8%
17.4%
12.4%
10.4%
6.3%
4.1%2.8%
3.8% 3.6% 3.6% 3.4%
10.9%
13.8%
9.6%
6.2%
3.7%2.6%
1.5%
0%
5%
10%
15%
20%
4.28 5.78
4.60 3.18
2.02 1.50 1.01 2.54 2.47 2.56 2.41
39.3% 32.2% 36.7%
56.6%67.3%
75.1%
99.5% 89.1% 93.7% 95.5% 97.4%
-60%
-20%
20%
60%
100%
-
5.0
10.0
15.0
RM'bil
Asset quality : Benefitting from differentiated product growth strategies
Asset Quality Indicators
6.06
7.60
6.145.53
3.602.43
1.87
Net NPL Gross NPL Loan loss coverage Gross impaired loans Allowance coverage
FRS 139
FRS139 adopted under BNM transitional arrangements since April 2010
Historical figures under GP3 basis and not comparable
Continue to enhance :
Collections systems
Credit / risk tools
Risk / impaired loans management team
Allowance coverage9MFY11 / Day1 change h8.3%
Gross impaired loans9MFY11 / Day1 change i5.1%
FRS 139
Gross impaired loans %9MFY11 / Day1 change i0.4%
Gross impaired loans Loan loss chargeGross NPL ratio Net NPL ratio Net provisions charge
FY2004 FY 2005 FY 2006 FY 2007 FY 2008 FY 2009 FY2010 Day 1 Q1FY11 H1FY11 9MFY11
AMBANK GROUP – INVESTOR RELATIONS – PRESENTATION 9MFY2011 13(Conventional + Islamic)
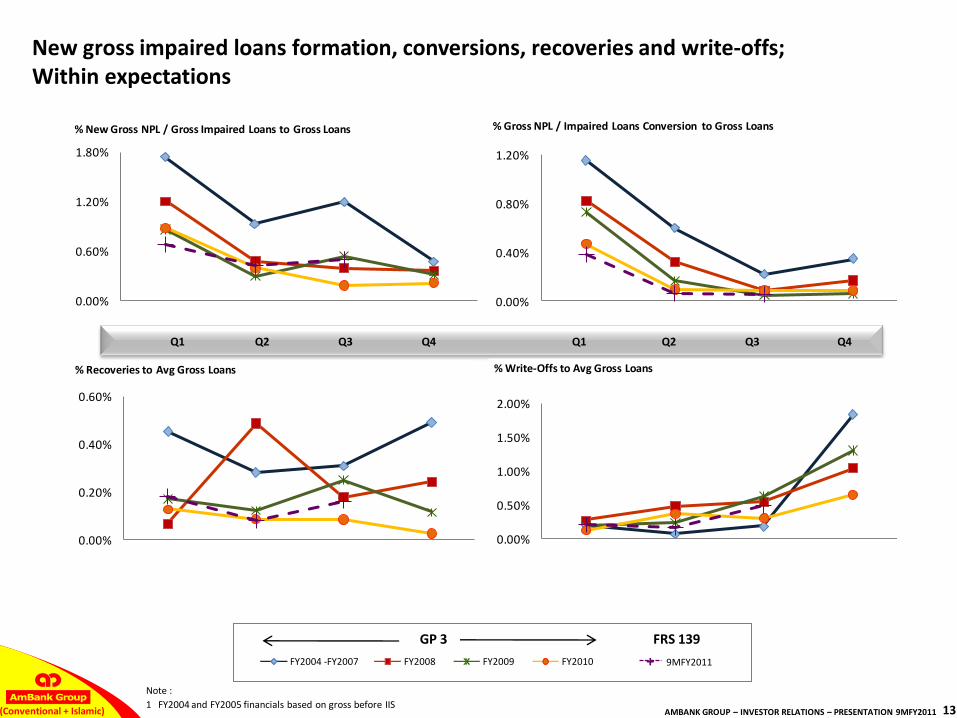
0.00%
0.40%
0.80%
1.20%
Q1 Q2 Q3 Q4
% Gross NPL / Impaired Loans Conversion to Gross Loans
0.00%
0.60%
1.20%
1.80%
Q1 Q2 Q3 Q4
% New Gross NPL / Gross Impaired Loans to Gross Loans
New gross impaired loans formation, conversions, recoveries and write-offs; Within expectations
Note :
1 FY2004 and FY2005 financials based on gross before IIS
Q1 Q2 Q3 Q4 Q1 Q2 Q3 Q4
GP 3 FRS 139
FY2004 -FY2007 FY2008 FY2009 FY2010 9MFY2011+
0.00%
0.20%
0.40%
0.60%
Q1 Q2 Q3 Q4
% Recoveries to Avg Gross Loans
0.00%
0.50%
1.00%
1.50%
2.00%
Q1 Q2 Q3 Q4
% Write-Offs to Avg Gross Loans

AMBANK GROUP – INVESTOR RELATIONS – PRESENTATION 9MFY2011 14(Conventional + Islamic)
FY08
RM'bil
Retail
Biz / Corp & others10.8 9.9
1.2
13.8
11.6
1.4
Business Banking (ex GLR)
Corporate & Institutional
Banking
Others
17.9%
12.7%
27.2%
FY08
RM'bil
Retail
Biz / Corp & others
24.4
13.6
0.9 0.9 2.0 2.5
14.0
1.02.3
Auto Financing Mortgage Credit Cards Line of Credit Co-Op Asset Financing
RM'bil Dec '10 Dec '09
3.3%
7.4%
4.9%11.0%
10.9%
0.2%
2.6
0.8
24.3
Retail : target viable and profitable segments
Biz & SME growth : stable and preferred growth sectors
CIB : project financing with government support, GLC’s & large MNC’s
Increasing composition of variable rate loans
Increasing composition of Business / Corporate loans
Portfolio rebalancing : Focus on viable segments and diversification
Gross Loan / Financing movement (gross before netting loans sold to Cagamas)
by Interest Rate Type
Loan Composition %33.9% 19.6% 1.4% 1.2% 3.7%3.1% 19.2% 16.2% 1.9%
Retail (63%) Business / Corporate (37%)
by Retail & Business / Corporate
Retail banking loans growth : 1.6%
RM'bil Mar-08 Mar-09 Mar-10 Dec-10
Retail 74% 72% 65% 63%
Biz / Corp & others 26% 28% 35% 37%
RM'bil Mar-08 Mar-09 Mar-10 Dec-10
Fixed rate :
Conventional 47% 43% 39% 36%
Islamic 15% 17% 17% 15%
62% 60% 56% 51%
Variable rate :
Conventional 38% 40% 43% 46%
Islamic 0.1% 0.3% 1.6% 3.7%
38% 40% 44% 49%
AMBANK GROUP – INVESTOR RELATIONS – PRESENTATION 9MFY2011 15(Conventional + Islamic)
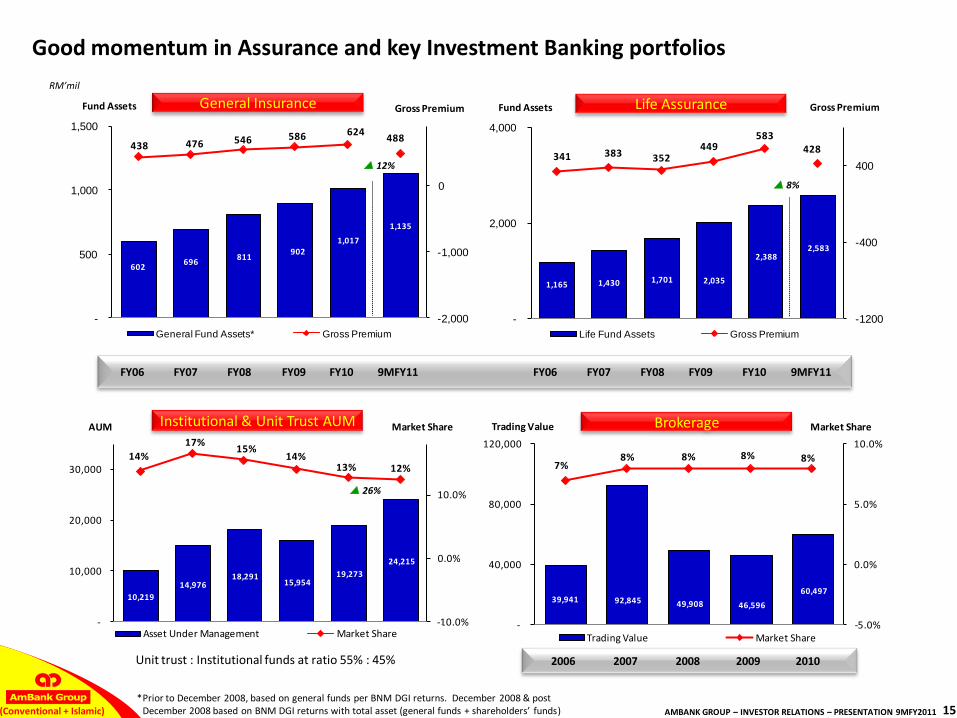
39,941 92,845 49,908 46,596
60,497
7%8% 8% 8% 8%
-5.0%
0.0%
5.0%
10.0%
-
40,000
80,000
120,000
Market ShareTrading Value
Trading Value Market Share
1,165 1,430 1,701 2,035
2,388 2,583
341 383 352 449
583 428
-1200
-400
400
-
2,000
4,000
Gross PremiumFund Assets
Life Fund Assets Gross Premium
602 696
811 902
1,017
1,135
438 476 546 586 624 488
-2,000
-1,000
0
-
500
1,000
1,500
Gross PremiumFund Assets
General Fund Assets* Gross Premium
10,219
14,976 18,291
15,954 19,273
24,215
14%
17%15%
14%13% 12%
-10.0%
0.0%
10.0%
-
10,000
20,000
30,000
Market ShareAUM
Asset Under Management Market Share
Institutional & Unit Trust AUM
p 26%
Good momentum in Assurance and key Investment Banking portfolios
FY06 FY07 FY08 FY09 FY10 9MFY11 FY06 FY07 FY08 FY09 FY10 9MFY11
General Insurance
*Prior to December 2008, based on general funds per BNM DGI returns. December 2008 & post December 2008 based on BNM DGI returns with total asset (general funds + shareholders’ funds)
RM’mil
2006 2007 2008 2009 2010
Brokerage
Life Assurance
p 8%
p 12%
Unit trust : Institutional funds at ratio 55% : 45%

AMBANK GROUP – INVESTOR RELATIONS – PRESENTATION 9MFY2011 16(Conventional + Islamic)
5.8% 7.6% 7.7% 8.1% 7.3%
6.8%8.5% 9.7% 10.3% 9.4%10.1%
14.1%15.2% 15.8% 15.1%
FY2007 FY2008 FY2009 FY2010 9MFY2011RWCA Tier 1 Ratio Common Equity Ratio
(13.3)
28.2 31.6 34.7 45.3
EPS, basicsen/share
-0.17%
1.02% 1.04% 1.13% 1.43%
ROA, %
Strong capital position and improving returns
AmBank (M) paid final dividend RM283mil (FY10) and interim dividend RM381mil (FY11) in 9MFY11 resulting in lower unappropriated profits for capital adequacy computation
Innovative T1 (AmBank (M) Berhad) :
Approved = RM500 mil
Q1FY10 issuance = RM300 mil
Q2FY10 issuance = RM185 mil
Tier 2 :
Q3FY10 : 7th tranche MTN RM98 mil, total to-date RM1.56 bil
Capital management plan :
1. Optimise capital profile & buffer
2. Increase scenario modeling
3. Streamline corporate structures
4. Develop dynamic dividend policy
5. Proactively manage Basel III requirements
FY07 FY08 FY09 FY10 9MFY11 FY07 FY08 FY09 FY10 9MFY11 FY07 FY08 FY09 FY10 9MFY11
9MFY11 / FY10 change h2.4%FY10 / FY09 change i0.2%
9MFY11 / FY10 change h0.30%FY10 / FY09 change h0.09%
9MFY11 / FY10 change h30.5%FY10 / FY09 change h9.8%
Improved ROE, ROA and EPS in 9MFY11
Capital adequacy : AHB
Tier 1 RWCA
AmBank (M) Berhad 10.1% 15.0%
AmInvestment Bank Berhad 25.1% 25.1%
AmIslamic Bank Berhad 9.1% 14.0%
Capital adequacy : by legal entity, 9MFY2011 (after proposed dividends)
Proforma 1
15.2%
9.5%
7.4%
Note :
1 Proforma including unappropriated profits of AmIslamic and AmInvestment Group

AMBANK GROUP – INVESTOR RELATIONS – PRESENTATION 9MFY2011 17(Conventional + Islamic)
Contents
Executive Summary
9MFY2011 Group Financial Performance
Divisional Performance
Strategy & Outlook
Supplementary Information

AMBANK GROUP – INVESTOR RELATIONS – PRESENTATION 9MFY2011 18(Conventional + Islamic)
*Conventional + Islamic
Medium Term Aspirations FY2011-2015
Develop a liability-led business, grow assets in targeted segments and expand wealth management
Grow diversified & profitable assets, increase liabilities, fee base business & international trade finance leveraging on ANZ
Deliver innovative and quality solutions, increase ‘share of wallet’, target high-impact and high-value clients and leverage ANZ for x-border businesses
Deliver comprehensive solutions, lead in capital markets, funds management, stock broking and enhance domestic & overseas distribution via ANZ
Leverage Friends Provident to deliver premium product & customer propositions & improve efficiencies
Leverage Insurance Australia Group to become a scale specialist in motor and niche specialist in commercial and non-motor lines
Deliver substantive, integrated and client-led business with full suite of FX, Rates, Commodities and FI offerings with ANZ collaborations
Divisional Aspirations
To become Malaysia’s Preferred Banking Group with International Connectivity• customer satisfaction
• sound financial performances
• well diversified and sustainable growth
As measured by
Retail *
Business *
Corporate & Institutional *
Investment *
Life Assurance
General Insurance
Markets *

AMBANK GROUP – INVESTOR RELATIONS – PRESENTATION 9MFY2011 19(Conventional + Islamic)
On track to meet FY2011 expectations
Retail Banking *
Business Banking *
Corp & Institutional
Banking *
Investment Banking *
Markets *
Life Assurance
General Insurance
Good CASA & deposit growth, profitable asset growth & lower credit costs Invest for medium term outcomes Good profit growth benefiting from lower impairments for FY2011
Income growth from larger asset base & growth in non-interest incomes Proactively managing existing accounts for cross-sell & transactional deposits Good profit growth underpinned by well diversified incomes for FY2011
Income growth from larger asset base & fees Increased focus on cross-selling & growing deposits Good profit growth underpinned by better quality loans for FY2011
Leverage upturn in capital markets Increasing regional biz via closer collaboration with ANZ Sound profit result for FY2011
New products, improve new biz IRR & leverage strategic partnership with Friends Provident Strong growth in profits transferred to Shareholders for FY2011
Higher contribution from new products, increase share of wallet from retail & biz customers Reasonable profit growth for FY2011
Momentum from FX & Derivatives set to increase Strong profit growth for FY2011
*Conventional + Islamic
Note : Update since H1FY2011 Investors Presentation highlighted in italics and blue
AMBANK GROUP – INVESTOR RELATIONS – PRESENTATION 9MFY2011 20(Conventional + Islamic)
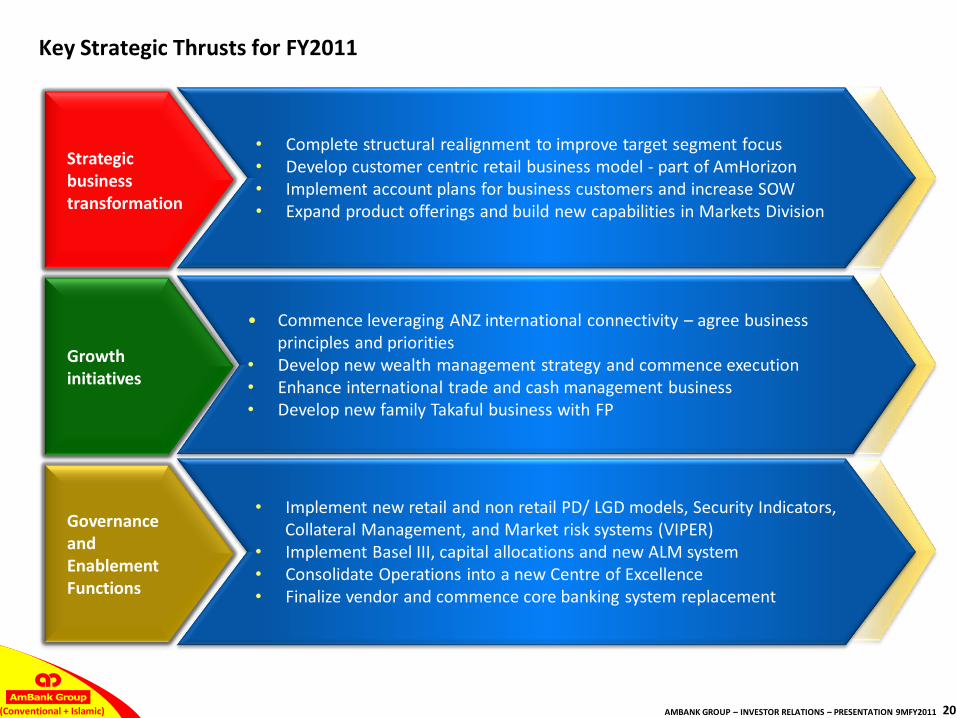
Key Strategic Thrusts for FY2011
Strategic business transformation
Growth initiatives
Governance and Enablement Functions
• Complete structural realignment to improve target segment focus• Develop customer centric retail business model - part of AmHorizon• Implement account plans for business customers and increase SOW• Expand product offerings and build new capabilities in Markets Division
• Commence leveraging ANZ international connectivity – agree business principles and priorities
• Develop new wealth management strategy and commence execution• Enhance international trade and cash management business• Develop new family Takaful business with FP
• Implement new retail and non retail PD/ LGD models, Security Indicators, Collateral Management, and Market risk systems (VIPER)
• Implement Basel III, capital allocations and new ALM system• Consolidate Operations into a new Centre of Excellence• Finalize vendor and commence core banking system replacement

AMBANK GROUP – INVESTOR RELATIONS – PRESENTATION 9MFY2011 21(Conventional + Islamic)
PATMI ~
ROE
CTI
Net NPL ratio /Gross impaired loans
Dividend:Gross
Payout
Medium Term Aspirations and estimates
# Previous guidance : 25-30%
* Adjusted for possible Basel III impacts on ACE^ Previously 12-15% sustainable profit growth
*
~ PATMI = profit after tax and minority interests
FY07 FY 08 FY 09 FY 10 9MFY 11 FY 2011 EstimateMedium Term
Aspirations (MTA)2012 - 2016
- RM282.5 mil
RM668.5
mil
RM860.8mil
RM1,008.6
mil
RM1,026.5
mil
circa 30%
#
14 – 18%
CAGR ^
- 5.8% 11.5% 11.7% 11.5% 13.9% circa 13% *FY13 onwards :
15 – 18% *
37.1% 39.6% 43.3% 42.0% 39.5% circa 40% 40 - 42%
6.2% 3.7% 2.6% 1.5% / 3.8% 3.4% circa 3.5% circa 2.5%
5.0 sen / share
(loss year)
6.0 sen / share
18.3%
8.0 sen / share
19.0%
10.5 sen / share
28.1%
H1FY11 interim
6.0 sen / share
25.8%
35 – 40% *
payout
≥ 40% *
payout

AMBANK GROUP – INVESTOR RELATIONS – PRESENTATION 9MFY2011 22(Conventional + Islamic)
Summary
1. Good 9MFY2011 performance, portfoliodiversification on track for FY2011
2. Growth momentum expected to moderate inFY2012 due to lower GDP growth (CY2011)
3. Strong foundations and clear medium termstrategies
4. International connectivity with ANZ and accessto world class “IP” and resources
5. Disciplined execution and governance requiredfor sustainable performance

AMBANK GROUP – INVESTOR RELATIONS – PRESENTATION 9MFY2011 23(Conventional + Islamic)
Executive Summary
9MFY2011 Group Financial Performance
Strategy & Outlook
Divisional Performance
Supplementary Information

AMBANK GROUP – INVESTOR RELATIONS – PRESENTATION 9MFY2011 24(Conventional + Islamic)
PATPBPExpensesIncome
Retail Banking Division : Improved asset quality main contributor to higher profits
Income performance – focusing on profitable segments and pricing for risk
Irrational pricing in selected segments
Expenses - growing footprints & channels, and upgrade in risk tools, people cost and IT systems
Lower impairments driving higher profits
9MFY2010 loans and deposits adjusted for segment realignment
Better than system CASA growth (7.1%)
Develop a liability-led business, grow assets in targeted segments and expand wealth management
Composition to Group 47.1% 46.0% 47.9% 42.3%
9MFY10 results
Positive growth in 9MFY11
Contraction in 9MFY11
RM'mil 9MFY10 9MFY11
Income 1,357.0 1,391.4 +2.5%
Expenses 520.6 536.2 +3.0%
PBP 836.4 855.2 +2.2%
Impairments / Allowances 303.3 255.0 -15.9%
PBT 533.0 600.2 +12.6%
PAT 399.3 450.1 +12.7%
Gross Loans / Financing 44,364.5 45,062.2 +1.6%
Net Loans / Financing 42,784.5 43,837.5 +2.5%
Gross Impaired Loans - 1,384.1 -
Customer Deposits 29,327.2 33,207.5 +13.2%
CASA Deposits 6,526.3 7,332.8 +12.4%
ROA 1.23% 1.35% +0.12%
CTI 38.4% 38.5% +0.1%
Allowance Coverage - 88.5% -
9MFY11 vs 9MFY10
G
3.07%
G

AMBANK GROUP – INVESTOR RELATIONS – PRESENTATION 9MFY2011 25(Conventional + Islamic)
PATPBPExpensesIncome
Business Banking Division : Good income growth partly offset by higher impairments
Income growth - lending to stable sectors, trade and transactional
Cost increase – mainly from expansion in relationship team
9MFY2010 loans and deposits adjusted for segment realignment
Strong CASA growth, leveraging on better relationship building and new products
Grow diversified & profitable assets, increase liabilities, fee base business & international trade finance leveraging on ANZ
Composition to Group12.4% 6.6% 16.2% 14.0%
9MFY10 results
Positive growth in 9MFY11
Contraction in 9MFY11
9MFY11 RM'mil 9MFY10 9MFY11 9MFY10
Income 273.5 366.1 +33.9%
Expenses 65.5 76.4 +16.6%
PBP 208.0 289.6 +39.2%
Impairments / Allowances 40.1 91.6 +128.4%
PBT 167.9 198.1 +18.0%
PAT 125.9 148.8 +18.2%
Gross Loans / Financing 10,819.7 13,762.1 +27.2%
Net Loans / Financing 10,586.7 13,570.7 +28.2%
Gross Impaired Loans - 222.6 -
Customer Deposits 7,488.9 6,759.5 -9.7%
CASA Deposits 1,230.8 1,792.8 +45.7%
ROA 1.71% 1.60% -0.11%
CTI 24.0% 20.9% -3.1%
Allowance Coverage - 86.0% -
Term Loan & Revolving Credit 6,621.5 8,419.8 +27.2%
Trade Finance 3,115.4 3,245.8 +4.2%
1.62%
G
G

AMBANK GROUP – INVESTOR RELATIONS – PRESENTATION 9MFY2011 26(Conventional + Islamic)
PATPBPExpensesIncome
Corporate & Institutional Banking Division : Good income growth and lower impairments
Diversified loans portfolio – good support for income growth
Higher contribution from international business
Impairments benefitted from bad debts recovered and lower collective impairment
9MFY2010 loans adjusted for segment realignment
Note : 1 Singapore Stock Exchange2 Jakarta Stock Exchange3 AmFraser International Pte Ltd4 PT AmCapital Indonesia
* Services include : large corporate lending, large corporate deposits, financial institutions group, offshore banking, international business, private equity, REITs and loan syndication
Deliver innovative and quality solutions, increase ‘share of wallet’, target high-impact and high-value clients and leverage ANZ for x-border businesses
Composition to Group9.4% 6.0% 11.6% 14.4%
9MFY10 results
Positive growth in 9MFY11
Contraction in 9MFY11
RM'mil 9MFY10 9MFY11
Income 249.2 278.4 +11.7%
Expenses 61.8 70.4 +13.9%
PBP 187.3 208.0 +11.1%
Impairments / Allowances 23.9 8.4 -64.9%
PBT 163.4 199.6 +22.2%
PAT 124.8 153.5 +23.0%
CTI 24.8% 25.3% +0.5%
Net Loans / Financing 9,706.3 11,519.3 +18.7%
Ave Assets Management 992.2 1,010.7 +1.9%
Ave Volume / Contract Traded (RM'mil/month)
S'pore SE 162,394.7 162,516.5 +0.1%
Jakarta SE 64,089.2 73,016.6 +13.9%
AmFIPL 1,994.6 1,768.0 -11.4%
PTAMCI 564.5 585.2 +3.7%
Market Share as at:
AmFIPL 1.3% 1.1% -0.2%
PTAMCI 0.9% 0.8% -0.1%
9MFY11 vs 9MFY10
G
G
G
G
G
1
2
3
4
G
3
4

AMBANK GROUP – INVESTOR RELATIONS – PRESENTATION 9MFY2011 27(Conventional + Islamic)
PATPBPExpensesIncome
Investment Banking Division : Subdued debt market but other businesses have done well
Higher income in 9MFY10 partly due to a one-time gain on disposal of a bond holding
Good contributions from asset management and corporate finance
Note :1 Including AmInvestment Management, AmInvestment
Services, AmIslamic Funds Management & private banking
Deliver comprehensive solutions, lead in capital markets, funds management, stock broking and enhance domestic & overseas distribution via ANZ
Composition to Group8.7% 11.5% 6.9% 8.5%
9MFY10 results
Positive growth in 9MFY11
Contraction in 9MFY11
RM'mil 9MFY10 9MFY11
Income 259.7 256.7 -1.2%
Expenses 116.0 134.2 +15.7%
PBP 143.7 122.6 -14.7%
Impairments / Allowances 4.1 1.1 -73.2%
PBT 139.6 121.5 -13.0%
PAT 104.2 90.5 -13.1%
CTI 44.7% 52.3% +7.5%
Ave Assets Management 19,981.9 24,823.8 +24.2%
Ave Volume / Contract Traded (RM'mil/month)
Bursa M'sia 55,572.6 67,280.2 +21.1%
Future KL index 335.8 347.1 +3.3%
IB Broking 4,254.6 5,290.4 +24.3%
AmFuture 66.2 79.6 +20.2%
Market Share as at:
IB Broking 7.7% 7.8% +0.1%
AmFuture 20.1% 23.1% +3.0%
9MFY11 vs 9MFY10
G
G
G
G
1

AMBANK GROUP – INVESTOR RELATIONS – PRESENTATION 9MFY2011 28(Conventional + Islamic)
PATPBPExpensesIncome
Markets : Income diversification and good momentum
Higher income from FX & derivatives and fixed income
Expenses reflect continuous investment in FX, rates, derivatives & commodities establishment
Lower AFS impairment
Deliver substantive, integrated and client-led business with full-suite of FX, Rates, Commodities and FI offerings with ANZ collaborations
Composition to Group8.6% 4.2% 11.5% 14.2%
9MFY10 results
Positive growth in 9MFY11
Contraction in 9MFY11
RM'mil 9MFY10 9MFY11
Income 190.3 254.6 +33.8%
Expenses 34.1 48.6 +42.5%
PBP 156.2 206.0 +31.9%
Impairments / Allowances 34.2 4.7 -86.3%
PBT 122.0 201.2 +64.9%
PAT 88.6 151.2 +70.7%
CTI 17.9% 19.1% +1.2%
PAT : Fx and Derivatives 8.0 35.0 +>100%
Total Group:
Financial assets HFT 2,048.8 7,100.2 +>100%
Financial investments
AFS 7,792.6 7,123.2 -8.6%
Financial investments
HTM 574.8 183.7 -68.0%
9MFY11 vs 9MFY10
GGG
G
G
G
GGG
G
G

AMBANK GROUP – INVESTOR RELATIONS – PRESENTATION 9MFY2011 29(Conventional + Islamic)
PATIncome
Life Assurance : Stronger contribution to Shareholders, sound capital adequacy
Higher income - larger fund assets, from enhanced agency network, product bundling and cross selling
Increase in CAR due to reduction in total capital requirement from MGS curve movement (reducing interest rate risk and liability capital charges)
Marginal decline in gross written premium from lower margin single premium businesses
Change in definition of ROE computation where 9MFY11 is based on higher total value of new business of each product
Leverage Friends Provident to deliver premium product & customer propositions & improve efficiencies
Composition to Group2.1% 4.8%
* Life assurance shareholders’ fund accounts
9MFY10 results
Positive growth in 9MFY11
Contraction in 9MFY11
RM'mil 9MFY10 9MFY11
Net Income 27.6 61.9 +>100.0%
PAT 19.1 51.6 +>100.0%
Life Assurance
fund assets 2,300.3 2,582.9 +12.3%
CAR ratio 181.0% 237.7% +56.7%
Gross written
premium 441.5 427.6 -3.1%
ROE 28.0% 63.4% +>100.0%
9MFY11 vs
9MFY10
GG
G
G
G
G
G
G

AMBANK GROUP – INVESTOR RELATIONS – PRESENTATION 9MFY2011 30(Conventional + Islamic)
PATPBPExpensesIncome
General Insurance : Higher income and improved efficiencies
Higher income - larger gross written premium, from enhanced up- and cross-selling, and established distribution network
Higher tax impact in 9MFY2011 due to late audit adjustment in respect of FY2010, for transfer of deferred tax assets to life assurance
Leverage Insurance Australia Group to become a scale specialist in motor and niche specialist in commercial and non-motor lines
Composition to Group4.3% 5.4% 3.6% 4.3%
9MFY10 results
Positive growth in 9MFY11
Contraction in 9MFY11
RM'mil 9MFY10 9MFY11
Income 101.3 128.1 +26.5%
Expenses 57.1 63.1 +10.5%
PBP 44.2 65.0 +47.1%
Impairments / Allowances (0.2) (1.4) ->100.0%
PBT 44.5 66.4 +51.2%
PAT 37.6 46.2 +22.9%
CTI 56.4% 49.3% -7.1%
General Insurance fund
assets982.2 1,135.3 +15.6%
Claim ratio 71.2% 69.2% -2.0%
Management expense
/ earned premium 15.0% 14.3% -0.7%
ROE 21.4% 19.4% -2.0%
9MFY11 vs 9MFY10
GG
G
G
G
GGGG
GGG
GGG

AMBANK GROUP – INVESTOR RELATIONS – PRESENTATION 9MFY2011 31(Conventional + Islamic)
PATPBPExpensesIncome
Group Operating Segments
Higher income from :
Shareholders fund, Corporate & Shared Services
- consolidation adjustments
Lower income from Loan Rehab units
- recovery rate as scheduled
Composition to Group 7.3% 20.2% -1.2% -2.5%
Defining the journey to a Customer Service Delivery Channel
9MFY10 results
Positive growth in 9MFY11
Contraction in 9MFY11
RM'mil 9MFY10 9MFY11
Income 211.4 214.2 +1.3%
Expenses 232.7 235.8 +1.3%
PBP (21.2) (21.6) -1.9%
Impairments / Allowances 106.8 (13.5) ->100.0%
PBT (128.1) (8.1) +93.7%
PAT (108.1) (27.1) +74.9%
PATMI (132.6) (65.4) +50.7%
9MFY11 vs 9MFY10
G
G

AMBANK GROUP – INVESTOR RELATIONS – PRESENTATION 9MFY2011 32(Conventional + Islamic)
PATPBPExpensesIncome
Islamic Banking : Higher collective impairments
Underlying branding position remains strong and expected to provide growth support
* Results incorporated under respective business divisions
To become the Islamic Bank of choice and ensure a high degree of value for our customers, employees & stakeholders
Composition to Group
9MFY10 results
Positive growth in 9MFY11
Contraction in 9MFY11
19.8% 18.3% 20.8% 17.7%
RM'mil 9MFY10 9MFY11
Income 581.5 585.0 +0.6%
Expenses 191.3 212.9 +11.3%
PBP 390.2 372.2 -4.6%
Impairments / Allowances 58.4 124.9 +>100%
PBT 331.8 247.3 -25.5%
PAT 243.2 188.4 -22.5%
Net Financing 11,991.7 12,683.1 +5.8%
Gross Impaired Financing - 279.6 -
Customer Deposits 12,715.6 12,924.1 +1.6%
CASA Deposits 2,078.4 2,327.2 +12.0%
ROA 2.15% 1.45% -0.70%
CTI 32.9% 36.4% 3.5%
Allowance Coverage - 151.5% -
9MFY11 vs 9MFY10
G
1.90%

AMBANK GROUP – INVESTOR RELATIONS – PRESENTATION 9MFY2011 33(Conventional + Islamic)
Contents
Executive Summary
9MFY2011 Group Financial Performance
Strategy & Outlook
Divisional Performance
Supplementary Information

AMBANK GROUP – INVESTOR RELATIONS – PRESENTATION 9MFY2011 34(Conventional + Islamic)
Oil & Gas• Exxon Mobil• Shell Malaysia• Dialog Group, deepwater petroleum terminal• Malaysia Nuclear Power Corporation
> RM 10.0 bil investment5.1 bil5.0 bil
-
•Enhance Tapis oil recovery, Telok gas development•1,650 jobs during facility building & construction•5,000 jobs; 5mil cubic metres storage terminal•Study feasibility of nuclear energy, 11-12 years
Electrical & Electronics• AUO Sunpower 2.2 bil •4,069 jobs by 2012, high-efficiency solar cells
Wholesale & Retail• Mines Wellness City, Country Heights Group 3.0 bil •11,000 jobs in 10 years, integrated health resort
Greater KL• Guocoland, Damansara City 2• Mass Rapid Transit• Talent Corporation
1.9 bil36.6 bil (3 lines, excl land)
-
•2 office & 1 retail block, 1 hotel, 1 serviced apartment•130,000 jobs, support public transport share to 50%•New government agency to fill 3.3 mil NKEA positions
Tourism• Teluk Datai Development Plan• YTL, Pulau Gaya development
1.0 bil75.0 mil
•Develop 300 acres land in Langkawi•World-class hillside-seafront villa, rainforest theme
Agriculture• Pasir Raja high-value herbal plantation - •285 jobs, cultivate 7 types of high demand herbs
Education• Skills Malaysia 2011 - •Showcase opportunities post-SPM
Communications Content & Infrastructure• Select TV, Hospitality IPTV 30.0 mil •Advanced entertainment distribution to hotels
Healthcare• Universiti Malaya Health Metropolis• Hovid Objective Pharmaceutical Excellent
1.25 bil (excl land)-
•10,400 jobs, premier medical hub•Collaboration with Sanofi-Aventis to develop drugs
Business Services• MyTelehaus Sdn Bhd• CSF Group• Teliti Datacentres
671.6 mil total250.0 mil
21.6 mil400.0 mil
•Malaysia as world-class data centre hub
Economic Transformation Programme : in overdrive with 19 projects worth RM67 bil
Day 100 announcement : 11 January 2011
19 projectsacross
10 NKEA’s
1
2
3
4
5
6
7
8
9
10
Note :NKEA = National Key Economic ActivitiesSource : media, AmResearch, www.pemandu.gov.my/etp
Banking sector positives :
Loans growth - working capital & bridging financing Private debt market boost, higher PDS issuances Benefit to interest & non-interest income growth
35,000 new job creation in total
RM67 bil investmentsin total

AMBANK GROUP – INVESTOR RELATIONS – PRESENTATION 9MFY2011 35(Conventional + Islamic)
102.3 165.9 268.2
473.7
741.8
104.9 184.6
289.6
504.1
793.6
Savings Current Account CASA Fixed Deposits Core Deposits
Industry Deposits by Type Dec '09 Dec '10
11.3% 8.0%2.6% 6.4% 7.0%
121.9 210.1 26.4 37.2
395.6 387.9
783.5
132.3 237.8
30.1 42.3
442.5 441.1
883.6
Purchase of Transport Vehicles
Purchase of Residential Properties
Credit Cards + LOC Personal Use Retail Loans Business & Corporate Loans
Total Loans
Industry Loans Growth by Purpose Dec '09 Dec '10
13.2% 14.2% 13.5% 11.9%8.5% 13.7% 12.8%
Industry Growth : Loans by Sector, Deposits by Type
RM’bil
Source : BNM
AmBank Group’sgrowth : +1.2% +5.4% -3.7% -23.8% +0.3% +22.4% +8.4%
Industry Loans Growth by Purpose
Industry Deposits Growth by Type
AmBank Group’sgrowth : +8.4% +22.6% +16.0% +5.1% +6.5%
Industry growth
Industry growth
15.0%
26.9%
3.4%4.8%
49.9%
Industry Loans Composition
Purchase of Transport Vehicles Purchase of Residential Properties Credit Cards + LOC Personal Use Business & Corporate Loans
13.2%
23.3%
63.5%
Industry Deposits Composition
Savings
Current Account
Fixed Deposits

AMBANK GROUP – INVESTOR RELATIONS – PRESENTATION 9MFY2011 36(Conventional + Islamic)
25.3
11.4
1.8 3.1 3.6 2.5 1.4 0.0 1.6
10.7 5.1
25.5
12.1
4.51.8
14.4
6.2
Purchase of Transport Vehicles
Purchase of Residential Properties
Credit Cards Personal Use Purchase of Non-Residential Properties
Purchase of Securities
Fixed Assets Consumer Durables
Construction Working Capital Other purpose
AmBank Group Loans Growth by Economic Purpose Dec-09 Dec-10
1.7 2.4 2.3 1.2 0.0
1.2% 5.4% -3.7% 23.8% 23.8% -7.1% -14.8% -15.0% 13.4% 34.7% 22.5%
121.9
210.1
26.4 37.2 74.1
34.6 0.1 19.0
209.5
41.8
132.3
237.8
30.1 42.3
90.7
37.9 21.6
226.7
55.1
Purchase of Transport Vehicles
Purchase of Residential Properties
Credit Cards Personal Use Purchase of Non-Residential Properties
Purchase of Securities
Fixed Assets Consumer Durables
Construction Working Capital Other purpose
Industry Loans Growth by Economic Purpose Dec-09 Dec-10
8.9 8.8
8.5% 13.2% 14.2% 13.5% 22.5% 9.4% 1.4% -6.8% 13.6% 8.2% 31.8%
0.1
Loans by Economic Purpose : AMMB vis-à-vis Industry
composition : 35.5% 16.7% 2.4% 3.3% 6.2% 3.2% 1.6% 0.0% 2.4% 20.0% 8.6%
RM’bil
Source : BNM, internal reports
composition : 15.0% 26.9% 3.4% 4.8% 10.3% 4.3% 1.0% 0.0% 2.4% 25.7% 6.2%
RM’bil
AmBank Group Loans Growth by Economic Purpose
Industry Loans Growth by Economic Purpose

AMBANK GROUP – INVESTOR RELATIONS – PRESENTATION 9MFY2011 37(Conventional + Islamic)
Competitive Positioning : Sound size and market position in key businesses (as at end 2010)
Investment Banking
Business Banking
Life Assurance
Islamic Banking
Corporate & Institutional Banking
# 2
# 4[9.7%]
# 5[6.5%]
# 9
# 5[7.3%]
Life
# 3 auto financier [20.8%]
# 8 in housing loans (incl foreign banks) [ 4.9%]
# 7 in credit cards (incl foreign banks) [ 5.7%]
# 5 in no. of branches & # 4 in no. of ATM’s
Nationwide network - 4 regional business & 12 commercial centres
Lead in cash management, trade and SME financing
# 2 in M&A league [33.3%]
# 3 in Debt League [18.9%]
# 3 in Malaysian RM Islamic bonds [12.5%]
# 3 in brokerage turnover [ 7.8%]
# 4 in funds under management [12.5%]
# 4 in Malaysia Loans mandated arranger [ 8.5%]
Award-winning equity house, private bank, asset management company & Islamic asset management house
Focus - GLC’s, MNC’s and financial institution groups (FIG’s)
Niche international businesses - Singapore, Indonesia & Brunei
Other businesses - REITs and private equity
# 9 in life assurance new biz premiums [ 4.4%]
Strategic partner - Friends Provident
BNM approval for rights to establish Takaful company
Syariah based banking products and services
# 2 in Islamic credit cards [28.5%]
Retail Banking
Note :[ ] denotes market share
General Insurance # 7 # 7 in general ins new biz premiums [ 5.1%]
# 3 in motor ins new biz premiums [ 8.6%]
Strategic partner – IAG

AMBANK GROUP – INVESTOR RELATIONS – PRESENTATION 9MFY2011 38(Conventional + Islamic)
Competitive positioning :Shareholding structure
No. 15 (Malaysia –market capitalisation) & 161 (global – 1,000 banks by market capitalisation) :
RM21.19 billion, Bursa SahamMalaysia (1)
US$6.93 billion, Bloomberg (2)
1 Apr 2010 : 100% equity in AmInvestmentBank Bhd transferred to AHB from AmInvestment Group Bhd
The due diligence to acquire the general insurance business of a local insurance company has been mutually discontinued
As at 31 December 2010
Foreign shareholding excluding ANZ :
Mar 09 : 28.4% Mar 10 : 27.1% Dec 10 : 32.1%
100% 70%*100%
100%
AmInvestmentBank Berhad
16.8% 11.8% 47.6%
Employees Provident Fund Board
AMMB Holdings Bhd
Amcorp Group Bhd
Other shareholders
AmBank (M) Berhad
AmIslamicBank Bhd
^ Insurance Australia Group Ltd –49%
ANZ Funds Pty Ltd #
23.8%
AMFB Holdings Bhd
100%
51%^
AMAB Holdings Sdn Bhd
100%
AmG Insurance Berhad
AmLife Insurance Berhad
* Friends Provident Fund PLC –30%
Source :1 Starbiz dated 3 January 20112 Bloomberg Global 1,000 banks by Market Capitalization as at 3 January 2011
# ANZ Funds Pty Ltd : a wholly owned subsidiary of Australia and New Zealand Banking Group Limited (“ANZ”)
AmInvestmentGroup Berhad
100%

AMBANK GROUP – INVESTOR RELATIONS – PRESENTATION 9MFY2011 39(Conventional + Islamic)
Competitive positioning :Strategic partnership with global partner, ANZ
Super regional strategic intent
Launched Dec 2007
Asia Pacific growth focus : Retail, Wealth, Commercial,
Institutional
Director
Dr. Robert John
Edgar
BoardDirector
Alex Thursby
Senior
Management
Deputy Group MD & Group CFO
Ashok Ramamurthy
Chief Risk Officer
Andrew Kerr
Head, Retail Sales & Distribution
Brad GravellManagement
Head, Group Risk Models
Glenn Saunders
Head, Market Risk
Jonathan Manifold
Head, Systems Accounting
Ignatius Lim
Chief Operations Officer
Ross Neil Foden
Director
Mark Whelan
Head, FX & Derivatives
Peter Trumper
ANZ has provided key resources and support
ANZ’s Regional Aspiration :
Create a leading Super Regional bank
Global quality, regional focus
( ) – number of branches & representative offices in each country
AmBank Group 1 of 5 key partnerships that is expanding ANZ’s organic agenda
AHB’s market cap increased 56.4% in 2008/2010
Partnerships model, ANZ adds value :
leadership & management
product development
technical expertise
2-way customer flows
ANZ is committed to AmBank Group’s long-term success and aspirations
1 – 2 years Restore Drive Asia profit
2 – 5 years Outperform In-fill M&A in Asia (core geography)
5+ years TRANSFORM
Head, Transaction Banking (Trade &
Cash)
Tan Chin AunNote : as at June 2010

AMBANK GROUP – INVESTOR RELATIONS – PRESENTATION 9MFY2011 40(Conventional + Islamic)
Strategic Business Transformation : Good Progress
12 months (FY 2008)
24 months
(FY 2009)
36 months (FY 2010)
• Set Group’s vision & aspirations
• Agreed Group’s transformation strategy, agenda and targets
• Realigned auto financing business towards profitable growth
• Improved asset quality
• Realigned growth towards profitable and viable segments only
• Realigned Markets Fixed Income business model
• Reset Mortgage business strategy and action plans
• Consolidated Group balance sheet activities within commercial bank
• Split composite insurance license to General and Life
• Created deposits as a profit centre
• Realigned customer ownerships and focus across all business Divisions
• Proactively strengthened capital and liquidity management
• Repositioned balance sheet for rising interest rates
Strategic Business
Transformation
High Priority
Growth Initiatives
Governance &
Enablement
Functions
AMBANK GROUP – INVESTOR RELATIONS – PRESENTATION 9MFY2011 41(Conventional + Islamic)
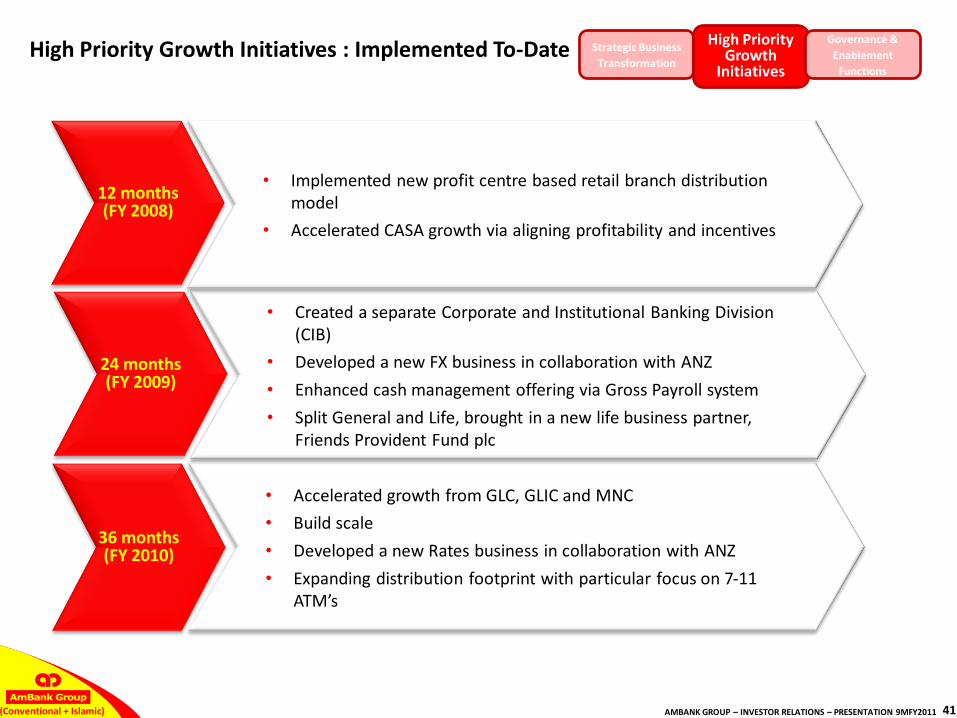
High Priority Growth Initiatives : Implemented To-Date
• Accelerated growth from GLC, GLIC and MNC
• Build scale
• Developed a new Rates business in collaboration with ANZ
• Expanding distribution footprint with particular focus on 7-11 ATM’s
• Created a separate Corporate and Institutional Banking Division (CIB)
• Developed a new FX business in collaboration with ANZ
• Enhanced cash management offering via Gross Payroll system
• Split General and Life, brought in a new life business partner, Friends Provident Fund plc
• Implemented new profit centre based retail branch distribution model
• Accelerated CASA growth via aligning profitability and incentives
12 months (FY 2008)
24 months (FY 2009)
36 months (FY 2010)
Strategic Business
Transformation
High Priority Growth
Initiatives
Governance &
Enablement
Functions

AMBANK GROUP – INVESTOR RELATIONS – PRESENTATION 9MFY2011 42(Conventional + Islamic)
Governance and Enablement Functions Streamlined :Supports Better Decision Making
• Privatised AmInvestment Bank
• Consolidated some Group support into Centres of Excellence
• Consolidated / simplified governance committee structures across entities
• Delivered line of business budgets and performance reporting
• Created a Group PMO to prioritise and manage key strategic initiatives
• Established Advance Risk Recognition Program (ARRP)
• Strengthened risk disciplines via Group Risk Appetite Frameworks
• Separated ALCO, capital and balance sheet management from Markets
• Delivered Peer Bank relative performance benchmarks
• Implemented short and long term incentives aligned to performance via MTA
• Delivered 8 new generation retail scorecards and new market risk models
• Commenced PD, LGD & EAD models for retail and non-retail, non-retail security indicators
• Implemented a new FTP system aligned to balance sheet strategies
• Developed leadership bench-strength and succession planning
• Implemented Operational Risk Incident Reporting system and Basel II capital calculator
12 months (FY 2008)
24 months (FY 2009)
36 months (FY 2010)
Strategic Business
Transformation
High Priority
Growth Initiatives
Governance and
Enablement Functions

AMBANK GROUP – INVESTOR RELATIONS – PRESENTATION 9MFY2011 43(Conventional + Islamic)
Strategic partnership with global partner, ANZ
Competitive positioning : continues to strengthen
Sound size and market position in key business
segments
1
2
3
4
5
6
Well diversified universal bank & # 4 largest banking group (market capitalization) # 4 retail bank, # 5 business and CIB lending Top 2 investment bank, #5 Islamic banking, #7 general insurance Strong customer-focus, lead in
customer satisfaction
Segmentation focus and positioning strategies & differentiating through products & services
Large retail and corporate client base provides high cross-selling potential
Award-winning products and services
Improving “Top of Mind” brand recall
Expanding distribution footprint (branch network –190), #4 largest ATM network (804), 402 ATMs @ 7/11 and 143 EBC’s
eChannels : internet banking, mobile banking and 24 hours call centre
Pioneer in weekend banking concept
~7,500 sales agents, direct sales teams, marketing & personal bankers, financial services and insurance agents
Strategic partnership with ANZ (since May 07), 1 of 10 AA rated global banks Leveraging ANZ : strengthen strategy formulation, financial management, risk
management, distribution channel management, deposits strategy and product development
Strong key shareholders, common aspirations
AIGB privatisation & internal business restructuring completed
Insurance biz partnership (2009)
Improvement in stock valuation & upgrades in credit ratings
Experienced management team with key ANZappointments
Industry experts, international and domestic best practices
Performance based culture, all levels
Strengtheningcompetitive positioning

AMBANK GROUP – INVESTOR RELATIONS – PRESENTATION 9MFY2011 44(Conventional + Islamic)
Wide market reach and multiple distribution channels
Source : Company websites of peer banks / MEPS informationNote : Peer groups as at December 2010; AmBank as at latest practicable date
Total #
ATM’s at 7 Eleven 402
Electronic Banking Centers (EBC) 143
Assurance offices 74
AmInvestment offices 15
Number of Branches#5
Number of ATMs2,848
2,066
1,058 804486 344 277 171
Maybank CIMB RHB AmBank PBB HLB EON Alliance
#4
381 369 249 242 190 185 140 104 91
Maybank CIMB Public RHB AmBank HLB EON Alliance Affin
Strategic initiatives , expanding distribution footprints
Increased customer satisfaction via integrated & seamless channels model Expand branch network & SSM footprint Further build & improve sales & service capabilities
Aspirations
Branch Banking
189 branches, 5 in progress
Expand electronic banking centre (EBC) at 90% of branches, and maintain position as the no. 1 provider of ATMs at 7-Eleven
Maximize outbound sales productivity via award winning contact centre
Expand revenue streams via add-ons (interbank loan, bill payment, full-suite prepaid top-up)
Enhance experience via innovative mobile & internet banking
E- Channels & Contact Centre (incl. Internet & Mobile Banking)
Wealth Management
Tapping affluent segment - Priority banking setup Multi-campaigns / product launches for different segments Increase sales efficiency through introduction of WM System Reorganize WM Structure to increase sales productivity & efficiencies Growing FOS via Mobile Sales Force (MSF) & additional Wealth Specialists (WS)
To complete product suite offering (E-FD, Debit Card, Foreign Currency Account, loyalty points)
Develop segment based solutions (Small Biz Solution, Life Stage segment solutions) Mobilising and optimising sales channels through branch engagement, incentive
schemes and introduction of Biz Relationship Managers Accelerate payroll acquisition though AmBank@ Work Leveraging relationship and alliances by cross-selling deposit products to other line-
of-business customer base
Deposit & Customer Solutions

AMBANK GROUP – INVESTOR RELATIONS – PRESENTATION 9MFY2011 45(Conventional + Islamic)
0
2
4
6
8
2007 2008 2009 2010
BBB-
BBB
BBB+
BB+
BBB-/A3/Stable
BBB-/A3/Stable
BBB/A3/Stable
BBB-/A3/Positive
0
2
4
6
8
2007 2008 2009 2010
0
2
4
6
8
2007 2008 2009 2010
0
2
4
6
8
2007 2008 2009 2010
0
2
4
6
8
2 0 0 7 2 0 0 8 2 0 0 9 2 0 1 0
A1
AA3
AA2
A2
A2/P1/Stable
A1/P1/Stable
AA3/P1/Stable
BBB-
BBB
BBB+
BB+
BBB-/F3/Stable
BBB-/F3/Positive BBB-/F3/
Stable
BBB-
BBB
BBB+
BB+
BBB-/A-3/Stable
BBB-/A-3/Stable
BBB-/A-3/Positive
Baa2
Baa1
A3
Baa3
Baa2/P-3/D-Stable
Baa2/P-3/D-Stable
Baa2/P-3/D-Stable
AA3/P1/Stable
BBB/F3/Stable
BBB/A-2/Stable
Baa2/P-3/DStable
0
2
4
6
8
2007 2008 2009 2010
A1
AA3
AA2
A2
AA3/P1/Stable
AA3/P1/Stable
AA3/P1/Stable
AA3/P1/Stable
0
2
4
6
8
2007 2008 2009 2010
BBB-
BBB
BBB+
BB+
BB+/B/Stable
BBB-/F3/StableBB+/B/
Positive
BBB/F3/Stable
0
2
4
6
8
2007 2008 2009 2010
BBB
BBB+
BB+
BBB-BB+/B/Stable
BB+/B/Stable
BBB-/A-3/Positive
BBB/A-2/Stable
0
2
4
6
8
2007 2008 2009 2010
AA-
AA
AA+
A+
AA-/MARC-1/Stable
AA-/MARC-1/Stable
AA-/MARC-1/Stable
AA-/MARC-1/Positive
Ratings upgraded
AmBank (M) Berhad AmInvestment Bank Berhad
AmIslamic Bank Berhad
0
2
4
6
8
2007 2008 2009 2010
A1
AA3
AA2
A2
AA3/P1/Stable
AA3/P1/StableA1/P1/
StableA2/P1/Stable
RAM
Fitch
S&P
Moody’s
RAM
MARC
S&P
Fitch
RAM
reflected system outlook
negative outlook issued in July 2009 but moved up to stable in December 2009
CI
*
Note * : Based on report dated 21 Jan 2011

AMBANK GROUP – INVESTOR RELATIONS – PRESENTATION 9MFY2011 46(Conventional + Islamic)
20.0%
40.0%
60.0%
80.0%
100.0%
120.0%
140.0%
160.0%
180.0%
May-07 Jul-07 Sep-07 Nov-07 Jan-08 Mar-08 May-08 Jul-08 Sep-08 Nov-08 Jan-09 Mar-09 May-09 Jul-09 Sep-09 Nov-09 Jan-10 Mar-10 May-10 Jul-10 Sep-10 Nov-10
Date
MBB PBB CIMB RHBC AMMB HLFG KLCI Index
Banking sector share price movement / Target price and recommendations
RM’mil 9MFY2011
Share Capital 3,014.2
Reserves 6,948.6
Shareholders’ Equity 9,962.8
Less: Intangible Assets (1,829.2)
NTA 8,133.6
NTA Per Ordinary Share (RM) 2.70
Net Asset Per Ordinary Share (RM)
3.31
Market Price (RM) 7.03
Price to Book, PBV [NTA / Net Asset]
2.12 / 2.60
EPS (sen) – basic, annualised 45.3
Price to earnings, PE 15.52
Dividend (gross sen / share)H1FY11 Interim
6 sen / share
p/q index change at close of 30 December 10 vs 18 May 07
(strategic partnership with ANZ)
30 December 1018 May 07 (strategic partnership with ANZ)
Banking Sector Share Price Movement
Index Movement (May 07 = 100)
Source : Bloomberg
As at 30 December 2010
100% base index
RHBC p + 84.7% (RM8.72)
AMMB p + 79.6% (RM7.03)
CIMB p + 42.9% (RM8.50)
PBB p + 37.3% (RM13.02)
HLFG p + 30.7% (RM8.89)
KLCI Index p + 11.9% (1,518.91)
MBB q – 5.4% (RM8.50)
Index change market price close of 30 December 10 vs. 24 December 10 Buy/Outperform/Overweight/AddP/EPS : EPS annualized Oct 09- Sept 10 P/BV : BV as at 30 September 10
Notes: TP: target price CP: weekly average closing price
Sell/Underperform/Fully valued/Reduce/Underweight
Hold / Neutral / Market perform
Target Price and Recommendations

AMBANK GROUP – INVESTOR RELATIONS – PRESENTATION 9MFY2011 47(Conventional + Islamic)
Glossary / Disclaimer of warranty and limitation of liability
Reported PerformanceReported performance refers to the financial performance as reported in the audited financial statements and disclosed to the market
One OffsOne offs comprise those impacts on financial performance that arise from changes to :
• accounting and provisioning policies (eg 5 and 7 year rules)• differences between economic and accounting hedges• prior period catch ups (eg backdated salary costs)• strategic investments and divestments (eg ANZ partnership), and • tax and regulatory regimes (eg deferred tax asset write off due to reduction in corporate tax rates)
Underlying PerformanceUnderlying performance refers to the financial performance adjusted for one off impacts as above
Business DivisionsBusiness divisions
• comprise AmBank Group’s core operating businesses that generate profits from direct customer transactions and interactions• have relatively more stable income streams, incur the bulk of the costs and typically have a lower risk profile• in most instances have market shares and growth metrics that can be measured and benchmarked externally
Operating SegmentsOperating segments
• have more volatile and lumpy income streams, with the former a direct function of risk appetite • include
• income and expenses associated with shareholder funds, loan rehabilitation and legacy businesses, plus• costs associated with corporate, shared services and governance functions currently not charged back to the business units
The information provided is believed to be correct at the time of presentation. AMMB Holdings Berhad or AMMB Holdings or “AHB” or its affiliates do not make any representation or warranty, express or implied, as to the adequacy, accuracy, completeness or fairness of any such information and opinion contained and shall not be liable for any consequences of any reliance thereon. Neither AMMB Holdings nor its affiliates are acting as your financial advisor or agent. The individual is responsible to make your own independent assessment of the information herein and should not treat such content as advice relating to legal, accounting, and taxation or investment matters and should consult your own advisers.
Forward looking statements are based upon the current beliefs and expectations of the AMMB Holdings and are subject to signif icant risks and uncertainties. Actual results may differ from those set forth in the forward looking statements. AMMB Holdings does not undertake to update the forward looking statements to reflect impact of circumstances or events that may arise after the date of this presentation.
The information in the presentation is not and should not be construed as an offer or recommendation to buy or sell securitie s. Neither does this presentation purport to contain all the information that a prospective investor may require. Because it is not possible for AMMB Holdings or its affiliates to have r egard to the investment objectives, financial situation and particular needs of each individual who reads the information contained thus the information presented may not be appropriate for all pe rsons.
The information contained is not allowed to be reproduced, redistributed, transmitted or passed on, directly or indirectly, to any other person or published electronically or via print, in whole or in part, for any purpose.
The term "AMMB Holdings" and “AmBank Group” denotes all Group companies within the AMMB Holdings Group and this Disclaimer of Warranty and Limitation of Liability policy applies to the financial institutions under AMMB Holdings.
Disclaimer of Warranty and Limitation of Liability

AMBANK GROUP – INVESTOR RELATIONS – PRESENTATION 9MFY2011
The material in this presentation is general background information about AmBank Group’s activities current at the date of the presentation. It is information given in summary form and does not purport to be complete. It is not intended to be relied upon as advice to investors or potential investors and does not take into account the investment objectives, financial situation or needs of any particular investor.
These should be considered, with or without professional advice when deciding if an investment is appropriate.
For further information, visit :
www.ambankgroup.com
or contact
Ganesh Kumar Nadarajah
Head, Group Investor Relations
Tel : +603 2036 1435 Fax : +603 2031 7384 e-mail : [email protected] or+6012 2974799 [email protected]