american asian/ indian/alaska pacific total native men ... native men women ... black hispanic white...
TRANSCRIPT

Summary of Degrees Granted by Race/Ethnicity and Gender: Percentages
Hispanic WhiteBlack
Asian/
Pacific
Islander
American
Indian/Alaska
NativeTotal Men Women
N % % % % % % %
2016-2017
173 0.0 19.7 23.1 40.5 16.8 77.5 22.5Certificate
17,372 0.4 16.6 35.6 29.1 18.3 61.2 38.8Associate
24,456 0.3 23.1 23.7 22.5 30.4 60.8 39.2Baccalaureate
7,905 0.2 17.0 14.4 17.2 51.3 68.5 31.5Master's
741 0.3 12.6 17.1 16.3 53.7 69.0 31.0Advanced Certificate
95 0.0 14.7 16.8 7.4 61.1 66.3 33.7JD
270 0.4 13.0 9.3 9.6 67.8 50.0 50.0Master of Philosophy
521 0.0 14.0 9.2 7.3 69.5 59.1 40.9Doctoral
62.3 37.7 30.5 26.0 23.6 19.7 0.3 51,533TOTAL UNIVERSITY
12/22/2017Report: DEGR_0013 CUNY Office of Institutional Research and Assessment

Summary of Degrees Granted by Race/Ethnicity and Gender: Percentages
Hispanic WhiteBlack
Asian/
Pacific
Islander
American
Indian/Alaska
NativeTotal Men Women
N % % % % % % %
2015-2016
212 0.5 17.9 25.0 42.5 14.2 74.1 25.9Certificate
16,345 0.3 15.5 33.3 30.7 20.2 61.2 38.8Associate
23,709 0.2 22.5 22.8 21.8 32.8 61.9 38.1Baccalaureate
7,991 0.2 16.2 15.0 17.2 51.4 68.6 31.4Master's
856 0.1 9.0 17.6 13.9 59.3 76.6 23.4Advanced Certificate
104 0.0 8.7 16.3 11.5 63.5 60.6 39.4JD
261 0.4 15.3 9.6 7.3 67.4 52.9 47.1Master of Philosophy
544 0.0 13.6 9.9 6.8 69.7 56.4 43.6Doctoral
62.9 37.1 32.7 24.7 23.6 18.8 0.2 50,022TOTAL UNIVERSITY
12/22/2017Report: DEGR_0013 CUNY Office of Institutional Research and Assessment

Summary of Degrees Granted by Race/Ethnicity and Gender: Percentages
Hispanic WhiteBlack
Asian/
Pacific
Islander
American
Indian/Alaska
NativeTotal Men Women
N % % % % % % %
2014-2015
333 0.6 15.3 22.2 40.2 21.6 71.2 28.8Certificate
15,478 0.3 16.1 33.3 30.6 19.8 60.9 39.1Associate
22,736 0.2 21.9 21.7 23.4 32.9 60.8 39.2Baccalaureate
8,022 0.2 15.0 12.9 17.5 54.5 67.9 32.1Master's
654 0.0 10.2 17.9 13.1 58.7 69.4 30.6Advanced Certificate
111 0.0 13.5 20.7 7.2 58.6 68.5 31.5JD
291 0.0 15.1 7.6 7.2 70.1 60.5 39.5Master of Philosophy
500 0.0 17.0 7.2 7.4 68.4 58.6 41.4Doctoral
62.2 37.8 33.2 23.7 24.4 18.5 0.3 48,125TOTAL UNIVERSITY
12/22/2017Report: DEGR_0013 CUNY Office of Institutional Research and Assessment

Summary of Degrees Granted by Race/Ethnicity and Gender: Percentages
Hispanic WhiteBlack
Asian/
Pacific
Islander
American
Indian/Alaska
NativeTotal Men Women
N % % % % % % %
2013-2014
275 0.7 23.3 23.6 32.7 19.6 75.3 24.7Certificate
14,589 0.3 16.4 32.1 30.5 20.8 60.7 39.3Associate
22,498 0.2 21.4 22.0 22.0 34.4 61.2 38.8Baccalaureate
8,589 0.3 13.7 13.7 16.5 55.8 68.5 31.5Master's
690 0.1 9.4 16.2 14.5 59.7 73.3 26.7Advanced Certificate
150 0.0 16.7 11.3 6.7 65.3 58.0 42.0JD
440 0.0 12.7 10.2 7.5 69.5 55.5 44.5Master of Philosophy
545 0.2 13.4 6.8 4.8 74.9 60.7 39.3Doctoral
62.5 37.5 35.2 23.2 23.1 18.2 0.2 47,776TOTAL UNIVERSITY
12/22/2017Report: DEGR_0013 CUNY Office of Institutional Research and Assessment

Summary of Degrees Granted by Race/Ethnicity and Gender: Percentages
Hispanic WhiteBlack
Asian/
Pacific
Islander
American
Indian/Alaska
NativeTotal Men Women
N % % % % % % %
2012-2013
268 0.4 20.9 20.9 28.7 29.1 70.9 29.1Certificate
13,886 0.3 16.1 31.7 30.6 21.4 61.4 38.6Associate
21,790 0.1 20.5 20.8 22.5 36.1 61.3 38.7Baccalaureate
8,809 0.3 13.1 13.1 16.2 57.2 68.6 31.4Master's
711 0.1 12.2 13.2 14.9 59.5 77.2 22.8Advanced Certificate
141 0.7 12.8 10.6 9.9 66.0 70.2 29.8JD
304 0.0 18.8 9.2 8.2 63.8 53.3 46.7Master of Philosophy
520 0.2 16.0 9.0 5.6 69.2 57.1 42.9Doctoral
63.0 37.0 36.7 22.3 23.3 17.5 0.2 46,429TOTAL UNIVERSITY
12/22/2017Report: DEGR_0013 CUNY Office of Institutional Research and Assessment
Summary of Degrees Granted by Race/Ethnicity and Gender: Percentages
Hispanic WhiteBlack
Asian/
Pacific
Islander
American
Indian/Alaska
NativeTotal Men Women
N % % % % % % %
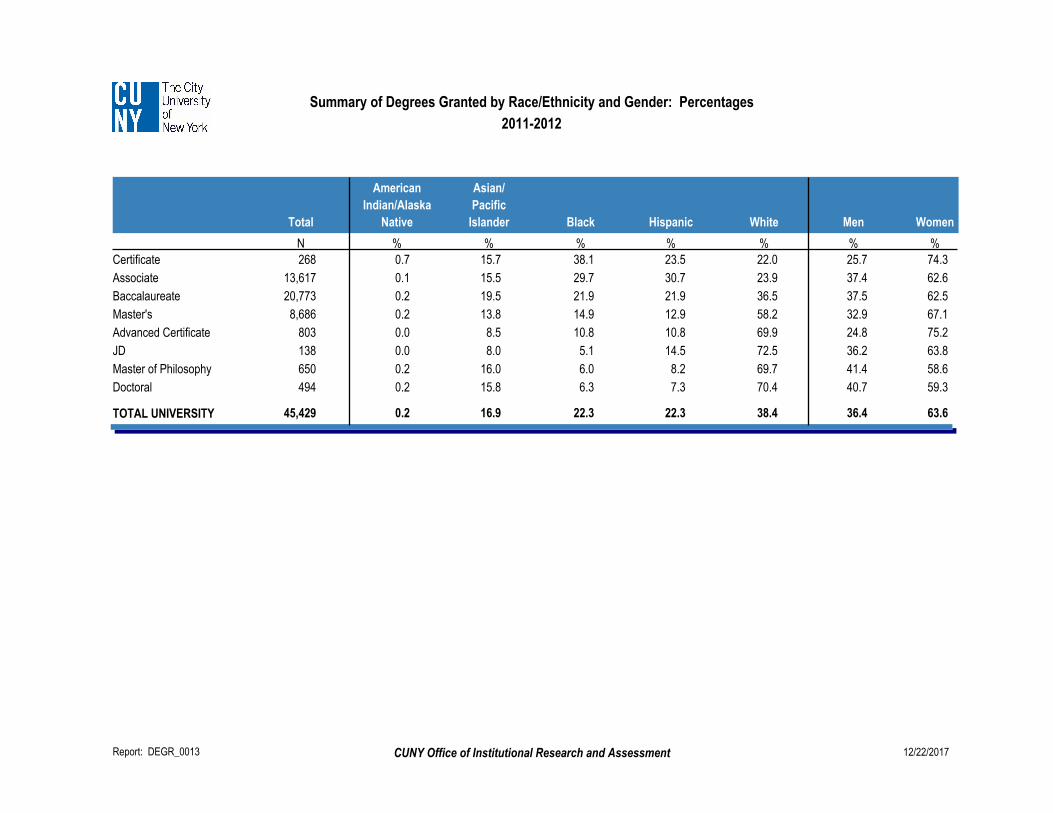
2011-2012
268 0.7 15.7 23.5 38.1 22.0 74.3 25.7Certificate
13,617 0.1 15.5 30.7 29.7 23.9 62.6 37.4Associate
20,773 0.2 19.5 21.9 21.9 36.5 62.5 37.5Baccalaureate
8,686 0.2 13.8 12.9 14.9 58.2 67.1 32.9Master's
803 0.0 8.5 10.8 10.8 69.9 75.2 24.8Advanced Certificate
138 0.0 8.0 14.5 5.1 72.5 63.8 36.2JD
650 0.2 16.0 8.2 6.0 69.7 58.6 41.4Master of Philosophy
494 0.2 15.8 7.3 6.3 70.4 59.3 40.7Doctoral
63.6 36.4 38.4 22.3 22.3 16.9 0.2 45,429TOTAL UNIVERSITY
12/22/2017Report: DEGR_0013 CUNY Office of Institutional Research and Assessment

Summary of Degrees Granted by Race/Ethnicity and Gender: Percentages
Hispanic WhiteBlack
Asian/
Pacific
Islander
American
Indian/Alaska
NativeTotal Men Women
N % % % % % % %
2010-2011
309 0.0 17.5 21.4 38.5 22.7 76.7 23.3Certificate
13,693 0.2 16.0 28.4 31.7 23.7 61.5 38.5Associate
20,072 0.1 18.3 20.1 23.5 38.0 62.5 37.5Baccalaureate
8,757 0.1 12.2 11.1 15.4 61.2 68.4 31.6Master's
773 0.0 6.0 7.5 9.7 76.8 75.2 24.8Advanced Certificate
111 0.0 11.7 10.8 6.3 71.2 58.6 41.4JD
281 0.0 15.7 8.5 7.1 68.7 61.6 38.4Master of Philosophy
489 0.0 11.0 7.0 6.1 75.9 57.5 42.5Doctoral
63.6 36.4 39.4 20.5 24.0 16.0 0.1 44,485TOTAL UNIVERSITY
12/22/2017Report: DEGR_0013 CUNY Office of Institutional Research and Assessment

Summary of Degrees Granted by Race/Ethnicity and Gender: Percentages
Hispanic WhiteBlack
Asian/
Pacific
Islander
American
Indian/Alaska
NativeTotal Men Women
N % % % % % % %
2009-2010
352 0.3 23.0 21.6 37.8 17.3 79.8 20.2Certificate
11,203 0.2 16.6 27.7 31.5 24.0 62.5 37.5Associate
18,453 0.1 18.8 21.5 22.9 36.7 62.4 37.6Baccalaureate
8,125 0.1 12.4 11.7 16.3 59.5 68.7 31.3Master's
635 0.2 8.3 9.8 10.7 71.0 72.6 27.4Advanced Certificate
126 0.0 15.1 11.9 7.9 65.1 65.9 34.1JD
285 0.4 13.3 7.0 6.3 73.0 56.1 43.9Master of Philosophy
408 0.0 15.7 6.9 7.1 70.3 57.4 42.6Doctoral
64.0 36.0 38.8 20.8 23.6 16.6 0.1 39,587TOTAL UNIVERSITY
12/22/2017Report: DEGR_0013 CUNY Office of Institutional Research and Assessment

Summary of Degrees Granted by Race/Ethnicity and Gender: Percentages
Hispanic WhiteBlack
Asian/
Pacific
Islander
American
Indian/Alaska
NativeTotal Men Women
N % % % % % % %
2008-2009
281 0.7 15.3 24.9 43.4 15.7 79.0 21.0Certificate
10,503 0.2 15.7 26.8 32.2 25.2 64.0 36.0Associate
17,893 0.2 19.0 20.3 22.7 37.8 62.4 37.6Baccalaureate
7,600 0.1 12.4 10.5 17.0 59.9 67.5 32.5Master's
310 0.0 1.3 12.6 17.7 68.4 70.6 29.4Advanced Certificate
121 0.0 18.2 5.0 5.8 71.1 62.0 38.0JD
267 0.4 16.5 7.1 6.4 69.7 55.1 44.9Master of Philosophy
410 0.5 12.7 5.6 5.1 76.1 54.1 45.9Doctoral
64.0 36.0 39.6 19.8 23.9 16.5 0.2 37,385TOTAL UNIVERSITY
12/22/2017Report: DEGR_0013 CUNY Office of Institutional Research and Assessment

Summary of Degrees Granted by Race/Ethnicity and Gender: Percentages
Hispanic WhiteBlack
Asian/
Pacific
Islander
American
Indian/Alaska
NativeTotal Men Women
N % % % % % % %
2007-2008
350 0.0 17.7 19.4 45.7 17.1 78.0 22.0Certificate
9,991 0.2 15.6 25.1 32.9 26.2 64.7 35.3Associate
17,059 0.2 17.4 18.8 25.8 37.9 63.9 36.1Baccalaureate
7,547 0.1 11.5 10.1 16.8 61.5 68.0 32.0Master's
377 0.3 2.7 13.8 20.2 63.1 73.2 26.8Advanced Certificate
132 0.0 17.4 7.6 9.8 65.2 70.5 29.5JD
249 0.0 18.1 4.8 10.0 67.1 51.8 48.2Master of Philosophy
358 0.0 15.9 7.3 8.7 68.2 58.4 41.6Doctoral
65.1 34.9 40.2 18.4 25.7 15.5 0.2 36,063TOTAL UNIVERSITY
12/22/2017Report: DEGR_0013 CUNY Office of Institutional Research and Assessment

Summary of Degrees Granted by Race/Ethnicity and Gender: Percentages
Hispanic WhiteBlack
Asian/
Pacific
Islander
American
Indian/Alaska
NativeTotal Men Women
N % % % % % % %
2006-2007
267 0.0 16.5 16.1 45.3 22.1 74.2 25.8Certificate
9,909 0.1 14.2 26.4 34.0 25.4 65.5 34.5Associate
15,959 0.2 16.4 19.6 26.2 37.6 64.1 35.9Baccalaureate
7,574 0.2 11.7 10.4 17.3 60.4 68.2 31.8Master's
403 0.0 2.5 12.7 28.8 56.1 74.7 25.3Advanced Certificate
123 0.0 18.7 13.8 8.1 59.3 68.3 31.7JD
207 0.0 12.1 9.2 6.8 72.0 54.6 45.4Master of Philosophy
303 0.0 11.9 5.3 9.2 73.6 53.1 46.9Doctoral
65.4 34.6 39.8 19.2 26.3 14.5 0.2 34,745TOTAL UNIVERSITY
12/22/2017Report: DEGR_0013 CUNY Office of Institutional Research and Assessment

Summary of Degrees Granted by Race/Ethnicity and Gender: Percentages
Hispanic WhiteBlack
Asian/
Pacific
Islander
American
Indian/Alaska
NativeTotal Men Women
N % % % % % % %
2005-2006
153 0.0 15.7 24.8 43.1 16.3 71.9 28.1Certificate
9,563 0.1 14.4 25.6 33.6 26.2 65.5 34.5Associate
15,487 0.1 16.6 19.6 26.1 37.6 65.9 34.1Baccalaureate
7,202 0.2 11.6 10.7 17.9 59.7 67.6 32.4Master's
416 0.0 3.8 10.6 21.9 63.7 75.5 24.5Advanced Certificate
131 0.8 9.2 11.5 12.2 66.4 64.1 35.9JD
179 0.6 13.4 10.6 8.4 67.0 53.6 46.4Master of Philosophy
330 0.0 13.6 4.2 6.7 75.5 50.9 49.1Doctoral
66.1 33.9 40.0 19.1 26.2 14.7 0.1 33,461TOTAL UNIVERSITY
12/22/2017Report: DEGR_0013 CUNY Office of Institutional Research and Assessment

Summary of Degrees Granted by Race/Ethnicity and Gender: Percentages
Hispanic WhiteBlack
Asian/
Pacific
Islander
American
Indian/Alaska
NativeTotal Men Women
N % % % % % % %
2004-2005
143 0.0 14.0 22.4 42.7 21.0 72.0 28.0Certificate
9,639 0.1 13.7 26.1 34.7 25.5 66.4 33.6Associate
15,349 0.1 16.4 19.0 27.1 37.4 65.1 34.9Baccalaureate
6,944 0.1 11.8 10.6 17.6 59.9 69.0 31.0Master's
364 0.5 2.2 11.3 19.0 67.0 76.6 23.4Advanced Certificate
144 0.7 11.8 9.7 13.2 64.6 68.1 31.9JD
155 0.0 22.6 7.7 5.8 63.9 48.4 51.6Master of Philosophy
298 0.0 16.4 6.7 6.4 70.5 53.4 46.6Doctoral
66.3 33.7 39.4 19.0 26.9 14.5 0.1 33,036TOTAL UNIVERSITY
12/22/2017Report: DEGR_0013 CUNY Office of Institutional Research and Assessment

Summary of Degrees Granted by Race/Ethnicity and Gender: Percentages
Hispanic WhiteBlack
Asian/
Pacific
Islander
American
Indian/Alaska
NativeTotal Men Women
N % % % % % % %
2003-2004
128 0.0 11.7 21.9 44.5 21.9 67.2 32.8Certificate
8,629 0.2 14.0 25.5 35.1 25.3 65.9 34.1Associate
14,037 0.2 16.4 18.8 26.7 37.9 65.3 34.7Baccalaureate
7,095 0.1 13.2 9.9 18.0 58.8 68.9 31.1Master's
383 0.0 1.8 10.2 23.5 64.5 72.8 27.2Advanced Certificate
139 0.7 14.4 18.0 12.9 54.0 66.9 33.1JD
178 0.0 24.7 4.5 7.3 63.5 56.7 43.3Master of Philosophy
298 0.0 11.4 6.0 9.1 73.5 54.4 45.6Doctoral
66.2 33.8 40.0 18.3 26.7 14.8 0.2 30,887TOTAL UNIVERSITY
12/22/2017Report: DEGR_0013 CUNY Office of Institutional Research and Assessment

Summary of Degrees Granted by Race/Ethnicity and Gender: Percentages
Hispanic WhiteBlack
Asian/
Pacific
Islander
American
Indian/Alaska
NativeTotal Men Women
N % % % % % % %
2002-2003
132 0.0 6.1 34.8 39.4 19.7 75.0 25.0Certificate
8,851 0.2 13.2 27.0 35.2 24.4 65.8 34.2Associate
14,607 0.2 15.3 19.6 28.3 36.7 65.1 34.9Baccalaureate
6,401 0.2 13.9 10.7 17.1 58.0 69.8 30.2Master's
375 0.3 2.4 6.4 24.5 66.4 72.3 27.7Advanced Certificate
131 0.8 11.5 10.7 19.8 57.3 58.8 41.2JD
194 0.5 20.6 7.2 10.8 60.8 56.2 43.8Master of Philosophy
272 0.4 12.5 5.5 5.1 76.5 50.7 49.3Doctoral
66.2 33.8 38.5 19.5 27.6 14.2 0.2 30,963TOTAL UNIVERSITY
12/22/2017Report: DEGR_0013 CUNY Office of Institutional Research and Assessment

Summary of Degrees Granted by Race/Ethnicity and Gender: Percentages
Hispanic WhiteBlack
Asian/
Pacific
Islander
American
Indian/Alaska
NativeTotal Men Women
N % % % % % % %
2001-2002
165 0.0 6.1 21.8 48.5 23.6 73.9 26.1Certificate
8,142 0.1 13.7 26.9 35.0 24.3 66.9 33.1Associate
14,185 0.1 15.2 19.2 28.6 36.8 64.7 35.3Baccalaureate
5,897 0.1 14.0 11.2 17.8 56.9 69.6 30.4Master's
292 0.3 2.7 6.8 25.7 64.4 71.6 28.4Advanced Certificate
127 0.8 13.4 11.0 21.3 53.5 54.3 45.7JD
161 0.0 15.5 7.5 9.3 67.7 54.0 46.0Master of Philosophy
271 0.7 17.0 5.9 6.3 70.1 54.2 45.8Doctoral
66.2 33.8 38.1 19.4 27.9 14.4 0.1 29,240TOTAL UNIVERSITY
12/22/2017Report: DEGR_0013 CUNY Office of Institutional Research and Assessment

Summary of Degrees Granted by Race/Ethnicity and Gender: Percentages
Hispanic WhiteBlack
Asian/
Pacific
Islander
American
Indian/Alaska
NativeTotal Men Women
N % % % % % % %
2000-2001
128 0.0 8.6 21.1 57.8 12.5 78.1 21.9Certificate
8,502 0.2 12.7 26.9 37.0 23.1 66.1 33.9Associate
13,592 0.2 14.2 19.9 28.7 37.0 65.2 34.8Baccalaureate
5,903 0.3 14.6 11.5 17.3 56.3 68.7 31.3Master's
281 0.0 1.8 7.1 22.1 69.0 76.5 23.5Advanced Certificate
96 0.0 13.5 16.7 15.6 54.2 66.7 33.3JD
179 0.6 17.3 3.9 6.1 72.1 52.5 47.5Master of Philosophy
250 0.0 12.8 7.2 6.8 73.2 50.0 50.0Doctoral
66.1 33.9 37.6 19.9 28.5 13.7 0.2 28,931TOTAL UNIVERSITY
12/22/2017Report: DEGR_0013 CUNY Office of Institutional Research and Assessment

Summary of Degrees Granted by Race/Ethnicity and Gender: Percentages
Hispanic WhiteBlack
Asian/
Pacific
Islander
American
Indian/Alaska
NativeTotal Men Women
N % % % % % % %
1999-2000
171 0.6 6.4 13.5 67.8 11.7 75.4 24.6Certificate
8,421 0.1 10.8 27.5 39.3 22.3 68.2 31.8Associate
13,331 0.1 14.1 18.4 28.8 38.5 65.1 34.9Baccalaureate
5,331 0.2 14.0 11.2 15.7 58.9 69.2 30.8Master's
263 0.4 3.8 10.3 20.9 64.6 76.0 24.0Advanced Certificate
130 1.5 14.6 10.0 15.4 58.5 63.8 36.2JD
152 0.0 24.3 9.2 7.9 58.6 48.7 51.3Master of Philosophy
280 0.4 14.6 4.3 5.7 75.0 47.5 52.5Doctoral
66.7 33.3 38.2 19.4 29.2 13.0 0.2 28,079TOTAL UNIVERSITY
12/22/2017Report: DEGR_0013 CUNY Office of Institutional Research and Assessment

Summary of Degrees Granted by Race/Ethnicity and Gender: Percentages
Hispanic WhiteBlack
Asian/
Pacific
Islander
American
Indian/Alaska
NativeTotal Men Women
N % % % % % % %
1998-1999
173 0.0 8.1 16.8 49.7 25.4 76.3 23.7Certificate
9,128 0.1 11.0 27.4 38.2 23.3 67.4 32.6Associate
13,301 0.2 13.9 18.5 29.0 38.4 64.6 35.4Baccalaureate
5,352 0.2 13.8 11.1 18.0 56.9 66.7 33.3Master's
309 0.0 1.6 8.4 22.7 67.3 71.2 28.8Advanced Certificate
120 0.0 11.7 10.0 22.5 55.8 64.2 35.8JD
158 0.0 24.7 5.7 7.6 62.0 49.4 50.6Master of Philosophy
277 0.0 14.4 7.9 7.2 70.4 49.1 50.9Doctoral
65.8 34.2 37.8 19.6 29.6 12.9 0.2 28,818TOTAL UNIVERSITY
12/22/2017Report: DEGR_0013 CUNY Office of Institutional Research and Assessment

Summary of Degrees Granted by Race/Ethnicity and Gender: Percentages
Hispanic WhiteBlack
Asian/
Pacific
Islander
American
Indian/Alaska
NativeTotal Men Women
N % % % % % % %
1997-1998
220 0.0 7.7 21.4 49.1 21.8 78.2 21.8Certificate
8,995 0.2 10.6 26.0 39.6 23.6 68.7 31.3Associate
13,105 0.2 14.4 18.8 28.1 38.6 64.1 35.9Baccalaureate
5,243 0.3 13.6 11.6 16.1 58.4 68.5 31.5Master's
309 0.6 1.9 9.4 25.6 62.5 76.7 23.3Advanced Certificate
137 0.7 6.6 10.2 11.7 70.8 58.4 41.6JD
279 0.0 20.1 7.2 3.9 68.8 52.0 48.0Master of Philosophy
333 0.6 19.8 6.0 4.8 68.8 48.9 51.1Doctoral
66.2 33.8 38.5 19.3 29.1 12.9 0.2 28,621TOTAL UNIVERSITY
12/22/2017Report: DEGR_0013 CUNY Office of Institutional Research and Assessment

Summary of Degrees Granted by Race/Ethnicity and Gender: Percentages
Hispanic WhiteBlack
Asian/
Pacific
Islander
American
Indian/Alaska
NativeTotal Men Women
N % % % % % % %
1996-1997
259 0.8 5.8 13.9 56.4 23.2 85.3 14.7Certificate
9,305 0.1 10.0 25.7 38.0 26.1 68.5 31.5Associate
13,607 0.1 14.8 18.2 28.1 38.8 62.5 37.5Baccalaureate
5,279 0.2 15.0 11.9 16.9 56.0 68.0 32.0Master's
287 0.0 2.4 10.5 24.7 62.4 79.1 20.9Advanced Certificate
146 0.0 8.2 5.5 19.2 67.1 63.7 36.3JD
260 0.8 31.9 4.6 3.8 58.8 50.8 49.2Master of Philosophy
310 0.0 25.5 4.8 7.4 62.3 51.0 49.0Doctoral
65.5 34.5 38.5 19.0 29.0 13.3 0.1 29,453TOTAL UNIVERSITY
12/22/2017Report: DEGR_0013 CUNY Office of Institutional Research and Assessment

Summary of Degrees Granted by Race/Ethnicity and Gender: Percentages
Hispanic WhiteBlack
Asian/
Pacific
Islander
American
Indian/Alaska
NativeTotal Men Women
N % % % % % % %
1995-1996
240 0.0 4.2 12.9 50.4 32.5 80.0 20.0Certificate
8,614 0.2 10.0 25.7 37.6 26.5 67.2 32.8Associate
12,448 0.2 15.2 17.9 27.0 39.7 61.2 38.8Baccalaureate
5,606 0.1 14.1 12.6 16.9 56.3 66.6 33.4Master's
297 0.3 3.4 7.1 21.5 67.7 70.7 29.3Advanced Certificate
144 0.7 3.5 9.0 20.8 66.0 45.8 54.2JD
195 0.5 26.7 9.7 6.2 56.9 48.2 51.8Master of Philosophy
302 0.0 21.9 5.6 2.6 69.9 49.3 50.7Doctoral
64.1 35.9 39.8 18.9 28.0 13.2 0.2 27,846TOTAL UNIVERSITY
12/22/2017Report: DEGR_0013 CUNY Office of Institutional Research and Assessment

Summary of Degrees Granted by Race/Ethnicity and Gender: Percentages
Hispanic WhiteBlack
Asian/
Pacific
Islander
American
Indian/Alaska
NativeTotal Men Women
N % % % % % % %
1994-1995
263 0.4 9.1 25.9 28.1 36.5 77.9 22.1Certificate
8,193 0.1 10.0 25.7 36.3 27.9 66.1 33.9Associate
12,141 0.3 14.4 16.6 28.3 40.4 61.9 38.1Baccalaureate
5,440 0.1 15.3 11.0 19.3 54.2 65.2 34.8Master's
366 0.5 4.1 9.6 30.3 55.5 75.1 24.9Advanced Certificate
137 0.7 7.3 8.8 10.9 72.3 56.9 43.1JD
181 0.6 25.4 5.5 4.4 64.1 55.2 44.8Master of Philosophy
294 0.0 25.2 4.1 4.1 66.7 43.2 56.8Doctoral
63.9 36.1 40.2 18.0 28.4 13.2 0.2 27,015TOTAL UNIVERSITY
12/22/2017Report: DEGR_0013 CUNY Office of Institutional Research and Assessment

Summary of Degrees Granted by Race/Ethnicity and Gender: Percentages
Hispanic WhiteBlack
Asian/
Pacific
Islander
American
Indian/Alaska
NativeTotal Men Women
N % % % % % % %
1993-1994
153 0.0 5.9 23.5 20.9 49.7 73.9 26.1Certificate
8,156 0.2 9.5 25.3 35.9 29.1 65.8 34.2Associate
11,751 0.2 14.5 15.3 27.0 43.0 61.1 38.9Baccalaureate
5,154 0.2 15.5 9.9 15.7 58.8 63.7 36.3Master's
348 0.0 3.2 6.9 22.1 67.8 74.1 25.9Advanced Certificate
142 0.7 4.9 7.0 13.4 73.9 51.4 48.6JD
175 0.0 28.6 5.7 6.3 59.4 56.6 43.4Master of Philosophy
286 0.0 27.6 6.6 4.2 61.5 40.9 59.1Doctoral
63.0 37.0 42.6 17.1 27.0 13.1 0.2 26,165TOTAL UNIVERSITY
12/22/2017Report: DEGR_0013 CUNY Office of Institutional Research and Assessment