american crystal sugar company · pdf fileamerican crystal sugar company is a world-class...
TRANSCRIPT

101 North Third Street, Moorhead, Minnesota 56560 www.crystalsugar.com
American Crystal Sugar Company2 0 0 6 A n n u a l R e p o r t
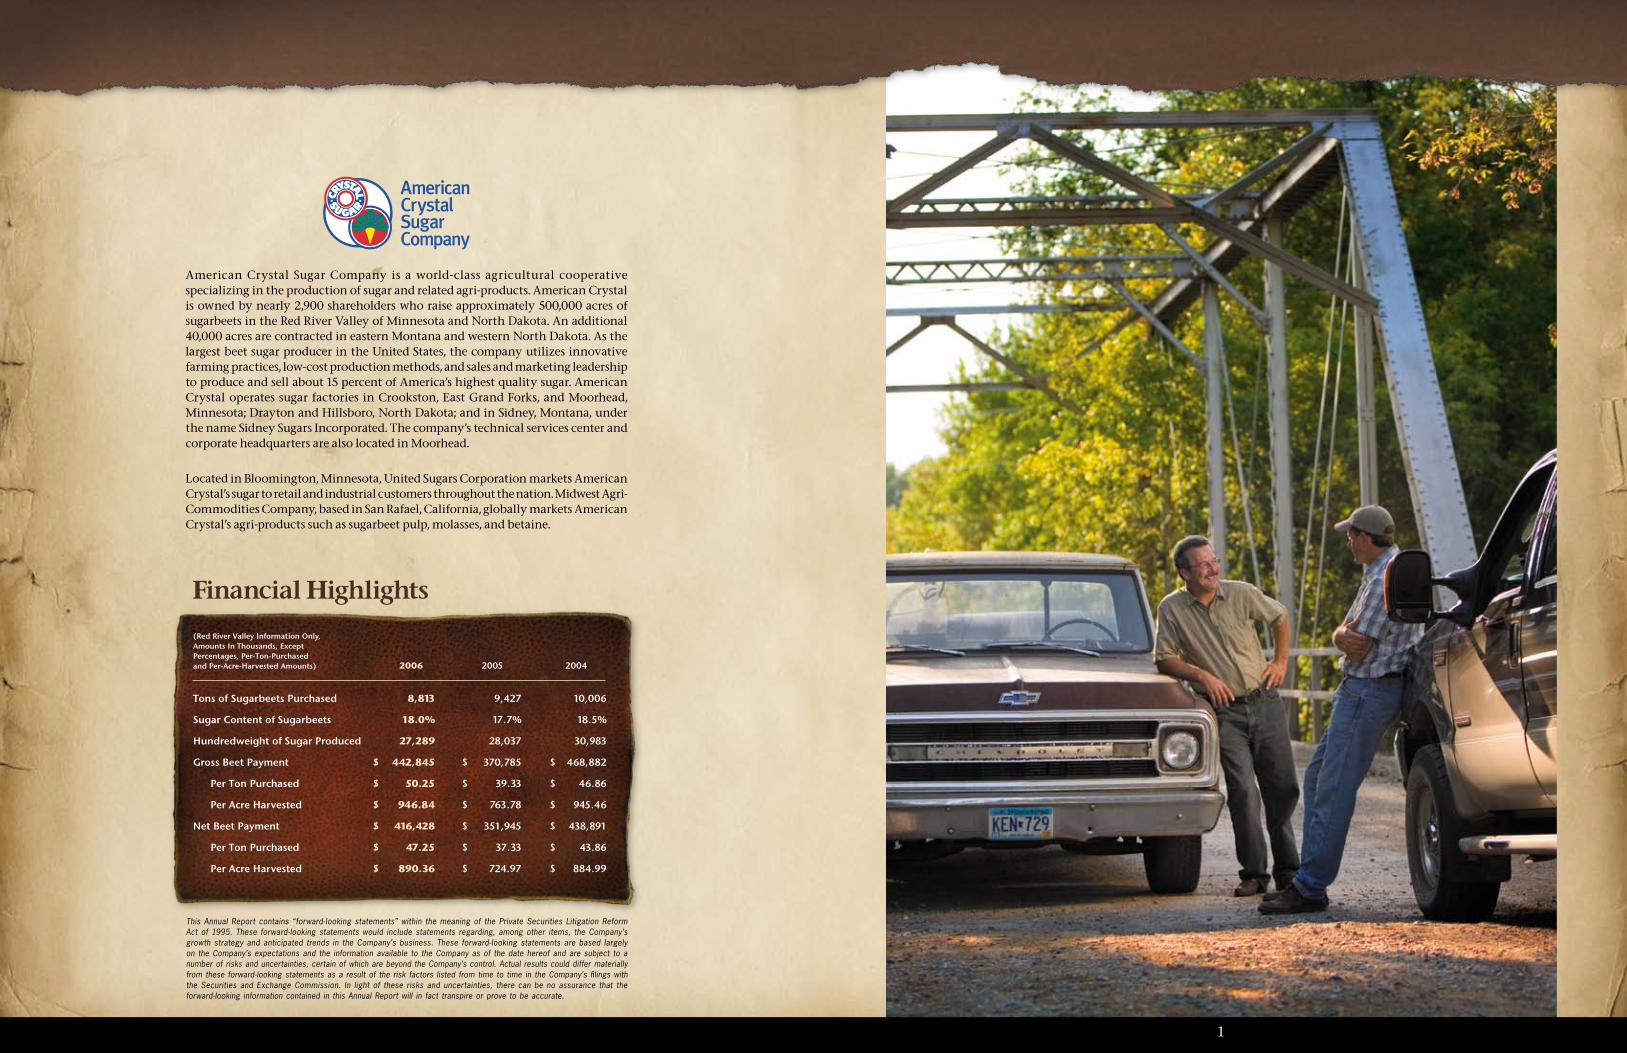
American Crystal Sugar Company is a world-class agricultural cooperative specializing in the production of sugar and related agri-products. American Crystal is owned by nearly 2,900 shareholders who raise approximately 500,000 acres of sugarbeets in the Red River Valley of Minnesota and North Dakota. An additional 40,000 acres are contracted in eastern Montana and western North Dakota. As the largest beet sugar producer in the United States, the company utilizes innovative farming practices, low-cost production methods, and sales and marketing leadership to produce and sell about 15 percent of America’s highest quality sugar. American Crystal operates sugar factories in Crookston, East Grand Forks, and Moorhead, Minnesota; Drayton and Hillsboro, North Dakota; and in Sidney, Montana, under the name Sidney Sugars Incorporated. The company’s technical services center and corporate headquarters are also located in Moorhead.
Located in Bloomington, Minnesota, United Sugars Corporation markets American Crystal’s sugar to retail and industrial customers throughout the nation. Midwest Agri-Commodities Company, based in San Rafael, California, globally markets American Crystal’s agri-products such as sugarbeet pulp, molasses, and betaine.
1
(Red River Valley Information Only, Amounts In Thousands, Except Percentages, Per-Ton-Purchased and Per-Acre-Harvested Amounts) 2006 2005 2004
Tons of Sugarbeets Purchased 8,813 9,427 10,006
Sugar Content of Sugarbeets 18.0% 17.7% 18.5%
Hundredweight of Sugar Produced 27,289 28,037 30,983
Gross Beet Payment $ 442,845 $ 370,785 $ 468,882
Per Ton Purchased $ 50.25 $ 39.33 $ 46.86
Per Acre Harvested $ 946.84 $ 763.78 $ 945.46
Net Beet Payment $ 416,428 $ 351,945 $ 438,891
Per Ton Purchased $ 47.25 $ 37.33 $ 43.86
Per Acre Harvested $ 890.36 $ 724.97 $ 884.99
Financial Highlights
This Annual Report contains “forward-looking statements” within the meaning of the Private Securities Litigation Reform Act of 1995. These forward-looking statements would include statements regarding, among other items, the Company’s growth strategy and anticipated trends in the Company’s business. These forward-looking statements are based largely on the Company’s expectations and the information available to the Company as of the date hereof and are subject to a number of risks and uncertainties, certain of which are beyond the Company’s control. Actual results could differ materially from these forward-looking statements as a result of the risk factors listed from time to time in the Company’s filings with the Securities and Exchange Commission. In light of these risks and uncertainties, there can be no assurance that the forward-looking information contained in this Annual Report will in fact transpire or prove to be accurate.
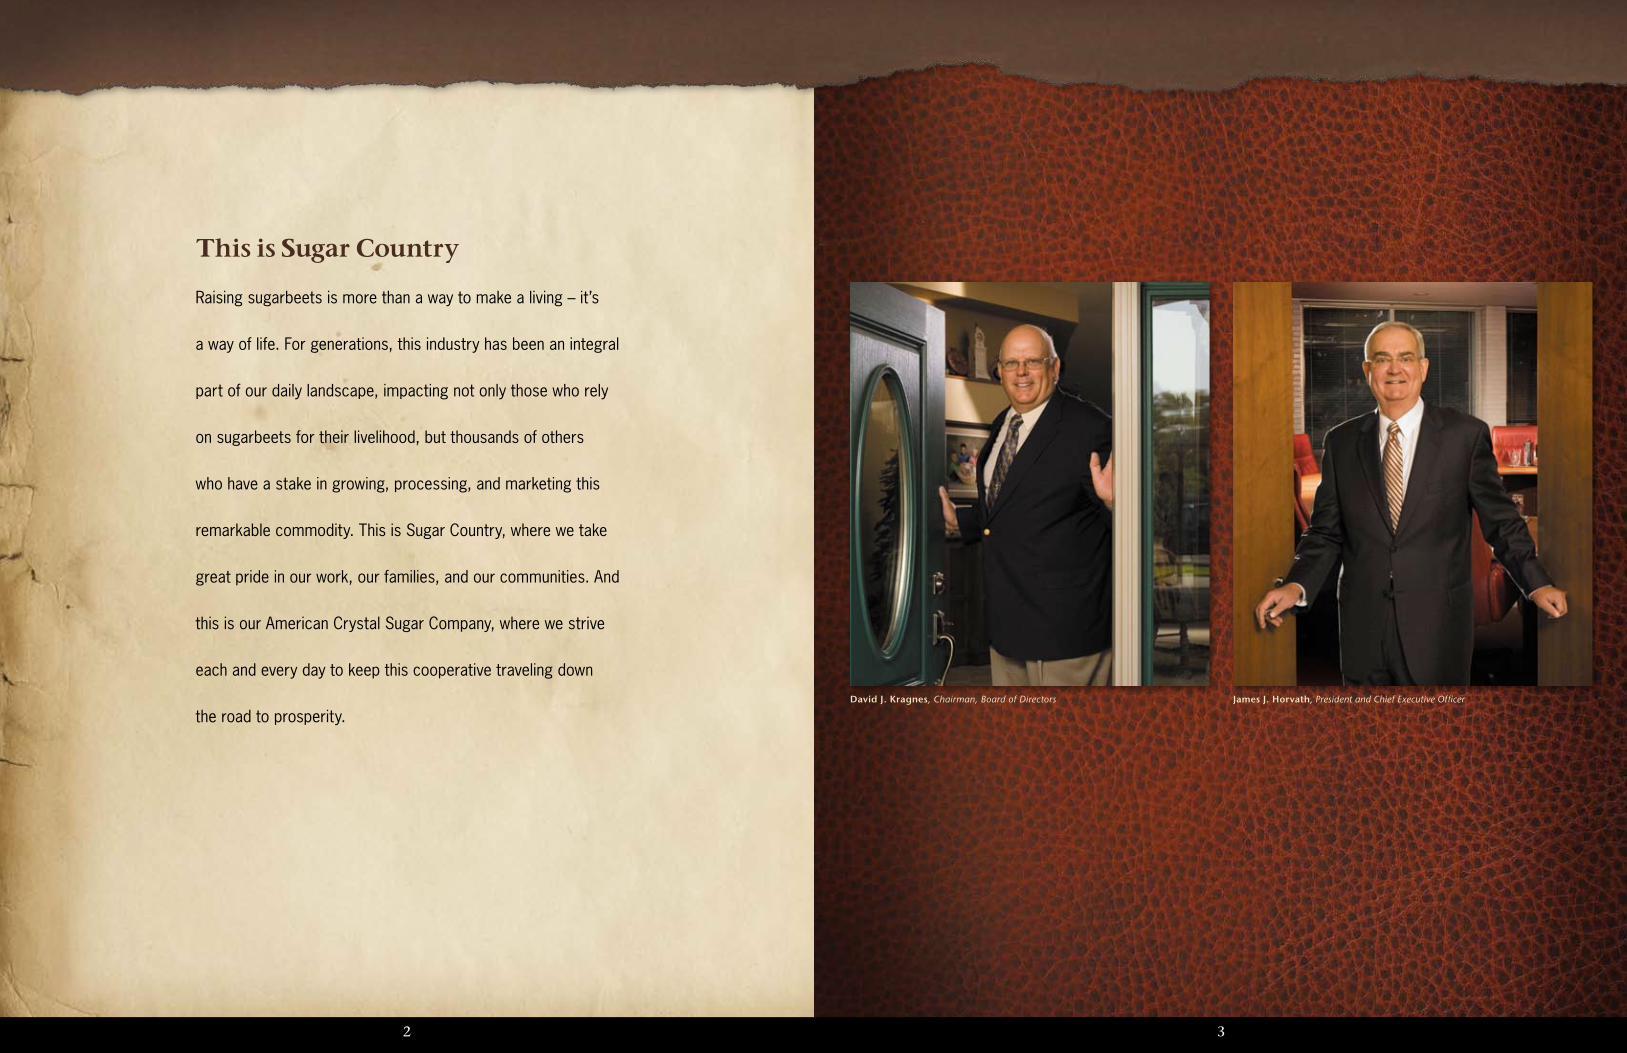
David J. Kragnes, Chairman, Board of Directors James J. Horvath, President and Chief Executive Officer
This is Sugar Country
Raising sugarbeets is more than a way to make a living – it’s
a way of life. For generations, this industry has been an integral
part of our daily landscape, impacting not only those who rely
on sugarbeets for their livelihood, but thousands of others
who have a stake in growing, processing, and marketing this
remarkable commodity. This is Sugar Country, where we take
great pride in our work, our families, and our communities. And
this is our American Crystal Sugar Company, where we strive
each and every day to keep this cooperative traveling down
the road to prosperity.
32

Robust PerformanceAmerican Crystal Sugar Company had a strong year in 2006. Forward actions in many segments of our business combined to push earnings beyond initial expectations.
During the past year, fiscal 2006, American Crystal delivered a gross beet payment of $50.25 per ton to shareholders. This is the second highest per ton payment in our cooperative’s history and 28 percent higher than fiscal 2005 results. Factoring in yield averages of 18.8 tons per acre and 18 percent sugar content, our shareholders received revenue of $947 on a per acre basis, an increase of 24 percent over fiscal 2005 results.
Product MarketsThe brightest spot in this performance was a sugar market
trading at the highest levels in the past 25 years, driven by tight supplies brought about by weather-strained
sugarbeet and sugarcane crops, and expanding demand for our sucrose products.
Regardless of market conditions, United Sugars Corporation recognizes customers are the core of our business, and continues to act responsibly with delivery, diligence, and dedication. Likewise, Midwest Agri-Commodities Company enhanced its customer-driven focus by finding new ways to compete in an ever-changing global feed products marketplace. These performances serve to reinforce our reputations as suppliers of choice to customers.
Contributing FactorsAmerican Crystal’s agriculture and operations departments skillfully overcame numerous obstacles during the year. Agriculturally, we were challenged by a wet growing season, flooded fields, and a muddy harvest. Our shareholders and ag staff persevered to harvest, receive, and store 8.8 million tons of sugarbeets. From there, our factories expertly processed the crop into 27 million hundredweight of first-rate sugar and 649,000 tons of high-grade by-products.
5
Our progress continues in the financial and strategic management of our organization. Prudent administration of our balance sheet edged our debt-to-equity ratio lower from .69:1 in fiscal 2005 to .62:1 at the end of fiscal 2006. This disciplined approach provides us with the financial strength to continue bettering our business. Our current five-year strategic plan contemplates several major projects aimed at enhancing energy usage, expanding processing throughput, and furthering our environmental commitment.
Mission of ValueAmerican Crystal’s Board of Directors and management team are working to set a course to differentiate our organization. The opportunity and responsibility that drives our decision-making process is found in our mission statement: “to simultaneously maximize shareholder returns and customer satisfaction.”
Composing the Red River Valley’s countryside
is a mosaic of farm fields. A great many
are rooted with sugarbeets. It’s a crop that
founded the nation’s largest beet
sugar cooperative – a successful
cooperative linking people, places,
products, and customers for
33 years running.

The 2005 CropThroughout the Red River Valley the growing season started on a positive note with 97 percent of our 500,000 acres planted by May 10. Bright prospects for the 2005 crop quickly dimmed as excessive rains hit the area in June, particularly in the Drayton factory district. July through September temperatures turned warm, which contributed to the growth of the waterlogged beets. Harvest was marked by wet conditions for the second consecutive year. However, an unusually late first freeze allowed the sugar content of the crop to increase throughout harvest. Ultimately, the crop
76
year was diminished by the loss of 32,000 acres to flooded fields and root rot.
The beets were piled with the third highest dirt tare level in the past ten years, creating storage as well as factory processing concerns. While temperatures throughout the storage campaign were generally above average, cold weather periods in December and February, along with our multi-faceted storage approach, proved valuable in preserving the quality of the 2005 crop.
Operational OutcomesCollaboration between our agriculture and operations groups led to an average beet slicing rate of 36,126 tons per day at our factories. This mark was our best ever, surpassing the fiscal 2003 record by 653 tons per day. Average extraction and cossette purities set five-year highs of 83.6 percent and 89.7 percent, respectively, over the 224-day beet processing campaign.
However you gauge performance – growing the
crop, storing beets, making sugar, or serving
customers – progress toward future goals can
only be charted by examining past results.
The most notable processing downtime event occurred at Drayton when the riverbank slumped, causing the pumphouse to shift toward the river, cutting off the factory’s supply of cooling water. This incident also caused a related issue with the boiler. Even with prompt response repairs, seven days of lost slice were attributed to this event.
Safety and QualityWe’ve implemented a new safety mantra across our facilities. It states, “No job is so important that a person cannot take time to do it safely.” This is part of our focus to make American Crystal factories among the safest places to work. In fiscal 2006, they did become safer as our lost-time incident rate improved by 60 percent over the previous year and registered the lowest level of the past five years. Sadly, in early fiscal 2007, a fatal incident occurred in our Moorhead packaging and warehousing area. The facility previously had 1,078 days without a lost-time injury.
To ensure we’re building on our tradition of customer satisfaction, we keep a detailed account of our quality and delivery achievements. For the sixth consecutive year, 2006 data reflected improved results as we decreased the number of customer complaints to historic lows.
Sidney Sugars IncorporatedAchievements at Sidney Sugars continue to impress. During fiscal 2006 the factory produced 2.4 million hundredweight of sugar and 68,000 tons of by-products. Sidney Sugars finished the campaign with a slice rate above projections at 6,408 tons per day. In addition, for the third year in a row, the factory set a new record for daily sugar production, raising the bar to 18,805 hundredweight. More benchmarks were set as the facility recorded 408 days without a lost-time injury and completed the fiscal year without a customer complaint.
Aligned ObjectivesOur performance was solid across the breadth of our core business activities in 2006. Throughout the year we faced challenges, demands, and issues. But, as a team, we never lost sight of our ability to transform obstacles into new achievements: a job well done by all.

American Crystal can never stand still if we
intend to maintain our leadership position. This
year strategic discussions led us down the path
of how we could compete better and how we
can best get there.
Workforce VisionTop-rated businesses thrive with talented, passionate people. Through our Workforce Vision initiative, we’re evolving into a more competitive organization. It’s an effort that involves new thinking, shifting structures, and advanced training. While change is never easy, empowering people with the ability to make a difference is central to succeeding tomorrow and throughout coming decades.
Investment AgendaA full schedule of capital projects was set in motion during the summer of 2006. At Hillsboro, sugar end upgrades, along with an expansion to increase the daily slice rate by 500 tons to 9,000 tons per day, were completed. At East Grand Forks, we installed an entirely new pulp pressing station, overhauled the beet washing system, and are preparing to add a betaine extraction system to our molasses desugarization facility. Betaine is a highly marketable poultry feed product.
On the agriculture front, we extended piling surfaces at four piling sites and expanded deep freeze storage capacity at five sites to improve our capability to receive and store beets.
Looking forward to fiscal 2007, we’ve ordered two new pilers which should be ready for the 2007 crop harvest. At East Grand Forks, we’ve commissioned the construction and installation of a steam dryer to lower our pulp drying costs.
8
The 2006 CropMother Nature appears to have smiled on the 2006 sugarbeet crop. In February of 2006, American Crystal’s Board authorized an overplant of 2 percent of stock acres for a total of 508,000 acres. The crop was planted in a timely fashion. The majority of these acres were seeded with new high yielding, disease resistant varieties. Despite drought-like conditions throughout the early summer growing season, the sugarbeet crop thrived by utilizing stored soil moisture until rains returned in August and September. Good growing conditions continued into October, resulting in exceptional yield and quality for the 2006 crop.
Farm BillAs debate on the 2007 Farm Bill progresses, American Crystal
continues to work with allies to unify our voice in this discussion. The pervading belief is the 2002 Farm Bill
works well for the majority of agriculture, including the sugar sector. We are actively communicating
this to key lawmakers while promoting a
continuation of the sugar program. We are also working with a broader agriculture coalition to urge Congress to keep in place a fair domestic farm program that stabilizes the farm sector and recognizes the threats from unfair foreign competition.
Keeping It RealEvery shareholder, employee, and partner had a hand in American Crystal’s progress during the past year. We should take great pride in this collaborative effort. Together, we can, and do, accomplish amazing things.
This is Sugar Country – where the people and places are as real as the product itself.
David J. Kragnes Chairman, Board of Directors
James J. Horvath President and Chief Executive Officer
9

American Crystal Sugar CompanyBoard of Directors and Senior Management
The natural resources of the Red River Valley
are astounding. The fertile farmland, adequate
precipitation, warm summers, and frigid winters
are environmental assets of the region. Adding
to this harmony are the plentiful rivers and
bridges that connect people to other places.
In similar ways, while our Board of Directors
and management team come from different
areas and backgrounds, they are connected to
a unified vision of making American Crystal the
strongest sugar company possible.
1 110
David Kragnes, Chairman
Richard Borgen, Director
Michael Astrup, Vice Chairman
Curtis Haugen, Director
John Gudajtes, Director
Brian Erickson, Director
EAST GRAND FORKS FACTORy DISTRICT
MOORHEAD FACTORy DISTRICT
Ronald Reitmeier, Director
Lonn Kiel, Director
Jim Ross, Director
CROOKSTON FACTORy DISTRICT
William “Buzz” Baldwin, Director
Neil Widner, Director
Robert Green, Director
DRAyTON FACTORy DISTRICT
David Berg, Vice President – Operations and Chief Operations Officer
Daniel Mott, Secretary and General Counsel
Brian Ingulsrud, Vice President – Administration
SENIOR MANAGEMENT
James Horvath, President and Chief Executive Officer
Thomas Astrup, Vice President – AgricultureJoseph Talley, Vice President – Finance and Chief Financial Officer
Francis Kritzberger, Director
Jeff McInnes, Director
John Brainard, Director
HILLSBORO FACTORy DISTRICT

1212 13
The Audit Committee of the Board of Directors meets with the independent auditors and management periodically to review their respective activities and to provide oversight to the Company’s accounting policies, internal controls and the financial reporting process. The independent auditors have free access to the Board of Directors and its Audit Committee, with or without management present, to discuss the scope and results of their audits and the adequacy of the system of internal controls.
James J. Horvath, President and Chief Executive Officer
Joseph J. Talley, Vice President - Finance and Chief Financial Officer
The management of American Crystal Sugar Company is responsible for the preparation, integrity and fair presentation of the accompanying consolidated financial statements and related information contained in this Annual Report. Where necessary, the Company makes informed judgments and estimates of the outcomes of events and transactions, with due consideration given to materiality. The financial information appearing throughout this Annual Report is consistent with that in the consolidated financial statements. In management’s opinion, the consolidated financial statements present fairly the financial position, results of operations and cash flows of the Company in conformity with accounting principles generally accepted in the United States of America.
The Company has established an environment that fosters strong controls and has designed a system of internal controls to ensure, within reasonable limits, that assets are safeguarded, that transactions are properly recorded and executed in accordance with management’s authorization, and that the accounting records provide a solid foundation from which to prepare the consolidated financial statements. Although no system of internal controls can detect and prevent all errors or irregularities, we believe that the established system provides an acceptable balance between benefits to be gained and their related costs.
The Company’s consolidated financial statements have been audited in accordance with standards of the Public Company Accounting Oversight Board (United States) by Eide Bailly LLP, independent auditors. The independent auditors were given unrestricted access to all financial records and related data. As part of their audit of the consolidated financial statements, the Company’s independent auditors review and assess the effectiveness of selected internal accounting controls to establish a basis for reliance thereon in determining the nature, timing and extent of audit tests to be applied.
Management’s Report on the Consolidated Financial Statements Management’s Discussion of Operations
The harvest of the sugarbeet crop grown during 2005 and processed during fiscal 2006 produced a total of 9.6 million tons of sugarbeets, or 19.0 tons of sugarbeets per acre from 507,000 acres. This represents a decrease in total tons harvested of 5.8 percent compared to the 2004 crop. The sugar content of the 2005 crop was 18.0 percent as compared to the 17.8 percent sugar content of the 2004 crop. The Company produced a total of 29.7 million hundredweight of sugar from the 2005 crop, a decrease of 2.6 percent compared to the 2004 crop. While the Company experienced lower production volumes for most of its products this fiscal year as compared to the previous fiscal year, the average selling prices for most of these products increased due to supply and demand factors. Net Proceeds from Member and Non-Member Business for fiscal 2006 were 19.2 percent higher than in fiscal 2005. This increase is primarily the result of the increase in average selling prices being partially offset by lower production volumes, higher processing costs and selling expenses.
Revenue for the year ended August 31, 2006, was $1.0 billion, an increase of $40.2 million from 2005. The table below reflects the percentage changes in product revenue, prices and volumes for the year ended August 31, 2006 as compared to the previous year.
Rental revenue on the ProGold operating lease was $25.1 million and $26.1 million for the years ended August 31, 2006 and 2005, respectively.
Cost of sales for the year ended August 31, 2006, exclusive of payments to members for sugarbeets, decreased $35.9 million as compared to fiscal 2005. The change in the net realizable value of product inventories impacted the cost of sales favorably by $33.0 million. The costs associated with sugar purchased to meet customer needs decreased by $12.5 million due to the earlier campaign start-up this year. The cost recognized associated with the non-member sugarbeets increased $4.7 million or 13.1 percent for the year ended August 31, 2006 when compared to last year. This
increase was primarily due to higher sugar net selling prices and more sugarbeets harvested this year at Sidney Sugars Incorporated. Direct processing costs for sugar and pulp increased 6.9 percent. The increase is due to higher prices related to energy products and major supplies partially offset by harvesting and processing 5.8 percent fewer sugarbeets than last year. Fixed and committed expenses increased 2.1 percent reflecting general cost increases.
Selling, general and administrative expenses increased $7.5 million from 2005. Selling expenses increased $6.3 million primarily due to higher freight, warehousing and packaging costs. General and Administrative expenses increased $1.2 million due to general cost increases.
Lower average long-term debt borrowing levels partially offset by higher average short-term interest rates resulted in interest expense, net, remaining relatively level between the fiscal years ended August 31, 2006 and 2005.
Non-member business activities resulted in a gain of $2.2 million in 2006, as compared to a gain of $2.5 million in 2005. The gain in both years was due primarily to activities related to Sidney Sugars.
Payments to members for sugarbeets, net of unit retains declared, increased by $64.5 million from $351.9 million in 2005 to $416.4 million in 2006. This was primarily due to the increased net selling prices for sugar and agri-products in 2006.
Product Revenue Selling Price Volume
Sugar 4.5% 10.9% -5.8%
Pulp 7.0% 3.9% 3.0%
Molasses -18.2% 22.4% -33.2%
CSB 3.0% 19.6% -13.9%
Betaine 4.6% 19.8% -12.7%

14 15
Report of Independent Registered Public Accounting Firm
To the Audit Committee of American Crystal Sugar CompanyMoorhead, Minnesota
We have audited the accompanying consolidated balance sheets of American Crystal Sugar Company and Subsidiaries as of August 31, 2006 and 2005, and the related consolidated statements of operations, changes in members’ investments and comprehensive income, and cash flows for the years ended August 31, 2006, 2005, and 2004. These consolidated financial statements are the responsibility of the Company’s management. Our responsibility is to express an opinion on these consolidated financial statements based on our audits.
We conducted our audits in accordance with standards of the Public Company Accounting Oversight Board (United States). Those standards require that we plan and perform the audit to obtain reasonable assurance about whether the financial statements are free of material misstatement. An audit includes consideration of internal controls over financial reporting as a basis for designing audit procedures that are appropriate in the circumstances, but not for the purpose of expressing an opinion on the effectiveness of the Company’s internal control over financial reporting. Accordingly, we do not express such an opinion. An audit also includes examining, on a test basis, evidence supporting the amounts and disclosures in the financial statements, assessing the accounting principles used and significant estimates made by management, as well as evaluating the overall financial statement presentation. We believe that our audits provide a reasonable basis for our opinion.
In our opinion, the consolidated financial statements referred to above present fairly, in all material respects, the financial position of American Crystal Sugar Company and Subsidiaries as of August 31, 2006 and 2005, and the results of their operations and their cash flows for the years ended August 31, 2006, 2005, and 2004, in conformity with accounting principles generally accepted in the United States of America.
Eide Bailly LLP Sioux Falls, South Dakota October 11, 2006
For the Years Ended August 31 (In Thousands) 2006 2005 2004
Net Revenue $ 1,005,716 $ 965,474 $ 1,033,088
Cost of Sales 328,767 364,687 337,988
Gross Proceeds 676,949 600,787 695,100
Selling, General and Administrative Expenses 211,188 203,663 200,314 Operating Proceeds 465,761 397,124 494,786
Other Income (Expense): Interest Income 397 529 169 Interest Expense, Net (19,096) (19,1 70) (20,149) Other, Net 4,283 201 2,097
Total Other Expense (14,416) (18,440) (17,883)
Proceeds Before Minority Interest and Income Tax Expense 451,345 378,684 476,903
Minority Interest (4,567) (4,169) (3,593)
Income Tax Expense (1,687) (1,255) (188)
Net Proceeds Resulting from Member and Non-Member Business $ 445,091 $ 373,260 $ 473, 122
Distributions of Net Proceeds: Credited to Members’ Investments: Non-Member Business Income $ 2,246 $ 2,475 $ 4,240 Unit Retains Declared to Members 26,417 18,840 29,991
Net Credit to Members’ Investments 28,663 21,315 34,231 Payments to Members for Sugarbeets, Net of Unit Retains Declared 416,428 351,945 438,891
Total $ 445,091 $ 373,260 $ 473,122
The Accompanying Notes are an Integral Part of These Consolidated Financial Statements.
Consolidated Statements of Operations

16 17
AssetsAugust 31 (In Thousands) 2006 2005
Current Assets:
Cash and Cash Equivalents $ 345 $ 337
Receivables:
Trade 78,242 39,752
Members 3,383 3,683
Other 4,036 3,490
Advances to Related Parties 4,737 15,108
Inventories 174,761 122,627
Prepaid Expenses 4,390 5,582
Total Current Assets 269,894 190,579
Property and Equipment:
Land 55,808 53,728
Buildings 102,986 96,816
Equipment 799,175 767,698
Construction in Progress 11,754 14,345
Less Accumulated Depreciation (637,583) (602,727)
Net Property and Equipment 332,140 329,860
Net Property and Equipment Held for Lease 140,041 150,892
Other Assets:
Investments in CoBank, ACB 13,138 16,716
Investments in Marketing Cooperatives 5,638 6,060
Investments in Crystech, LLC 15,399 15,376
Prepaid Pension Expense 45,425 43,789
Other Assets 18,322 20,752
Total Other Assets 97,922 102,693
Total Assets $ 839,997 $ 774,024
The Accompanying Notes are an Integral Part of These Consolidated Financial Statements.
Consolidated Balance Sheets
Liabilities and Members’ InvestmentsAugust 31 (In Thousands) 2006 2005
Current Liabilities: Short-Term Debt $ 5,300 $ 30,685 Current Maturities of Long-Term Debt 20,962 20,947 Accounts Payable 27,120 27,165 Advances Due to Related Parties 7,033 8,031 Other Current Liabilities 27,617 22,803 Amounts Due Growers 123,648 33,434
Total Current Liabilities 211,680 143,065
Long-Term Debt, Net of Current Maturities 200,037 216,842
Accrued Employee Benefits 40,987 37,990
Other Liabilities 7,938 8,897
Total Liabilities 460,642 406,794
Commitments and Contingencies
Minority Interest in ProGold Limited Liability Company 56,099 51,532
Members’ Investments: Preferred Stock 38,2 75 38,275 Common Stock 29 29 Additional Paid-In Capital 152,261 152,261 Unit Retains 153,961 148,972 Equity Retention 2,694 2,703 Accumulated Other Comprehensive Income (Loss) (500) (832) Retained Earnings (Accumulated Deficit) (23,464) (25,710)
Total Members’ Investments 323,256 315,698
Total Liabilities and Members’ Investments $ 839,997 $ 774,024
The Accompanying Notes are an Integral Part of These Consolidated Financial Statements.
Consolidated Balance Sheets

18 19
Accumulated Retained Annual Preferred Common Additional Equity Other Comprehensive Earnings Comprehensive For the Years Ended August 31 (In Thousands) Stock Stock Paid-In Capital Unit Retains Retention Income (Loss) (Accumulated Deficit) Total Income (Loss) Balance, August 31, 2003 $ 38,275 $ 30 $ 148,238 $ 125,409 $ 2,719 $ (11,900) $ (32,425) $ 270,346
Non-Member Business Income — — — — — — 4,240 4,240 $ 4,240 Pension Liability Adjustment — — — — — 11,524 — 11,524 11,524 Unit Retains Withheld from Members — — — 29,991 — — — 29,991 — Payments of Unit Retains and Equity Retention to Members — — — (16,686) (11) — — (16,697) — Stock Issued, Net — (1) 4,023 — — — — 4,022 —
Balance, August 31, 2004 38,275 29 152,261 138,714 2,708 (376) (28,185) 303,426 $ 15,764 Non-Member Business Income — — — — — — 2,475 2,475 $ 2,475 Pension Liability Adjustment — — — — — (456) — (456) (456) Unit Retains Withheld from Members — — — 18,840 — — — 18,840 — Payments of Unit Retains and Equity Retention to Members — — — (8,582) (5) — — (8,587) — Stock Issued, Net — — — — — — — — —
Balance, August 31, 2005 38,275 29 152,261 148,972 2,703 (832) (25,710) 315,698 $ 2,019 Non-Member Business Income — — — — — — 2,246 2,246 $ 2,246 Pension Liability Adjustment — — — — — 332 — 332 332 Unit Retains Withheld from Members — — — 26,417 — — — 26,417 — Payments of Unit Retains and Equity Retention to Members — — — (21,428) (9) — — (21,437) — Stock Issued, Net — — — — — — — — —
Balance, August 31, 2006 $ 38,275 $ 29 $ 152,261 $ 153,961 $ 2,694 $ (500) $ (23,464) $ 323,256 $ 2,578
The Accompanying Notes are an Integral Part of These Consolidated Financial Statements.
Consolidated Statements of Changes in Members’ Investments and Comprehensive Income
20 21
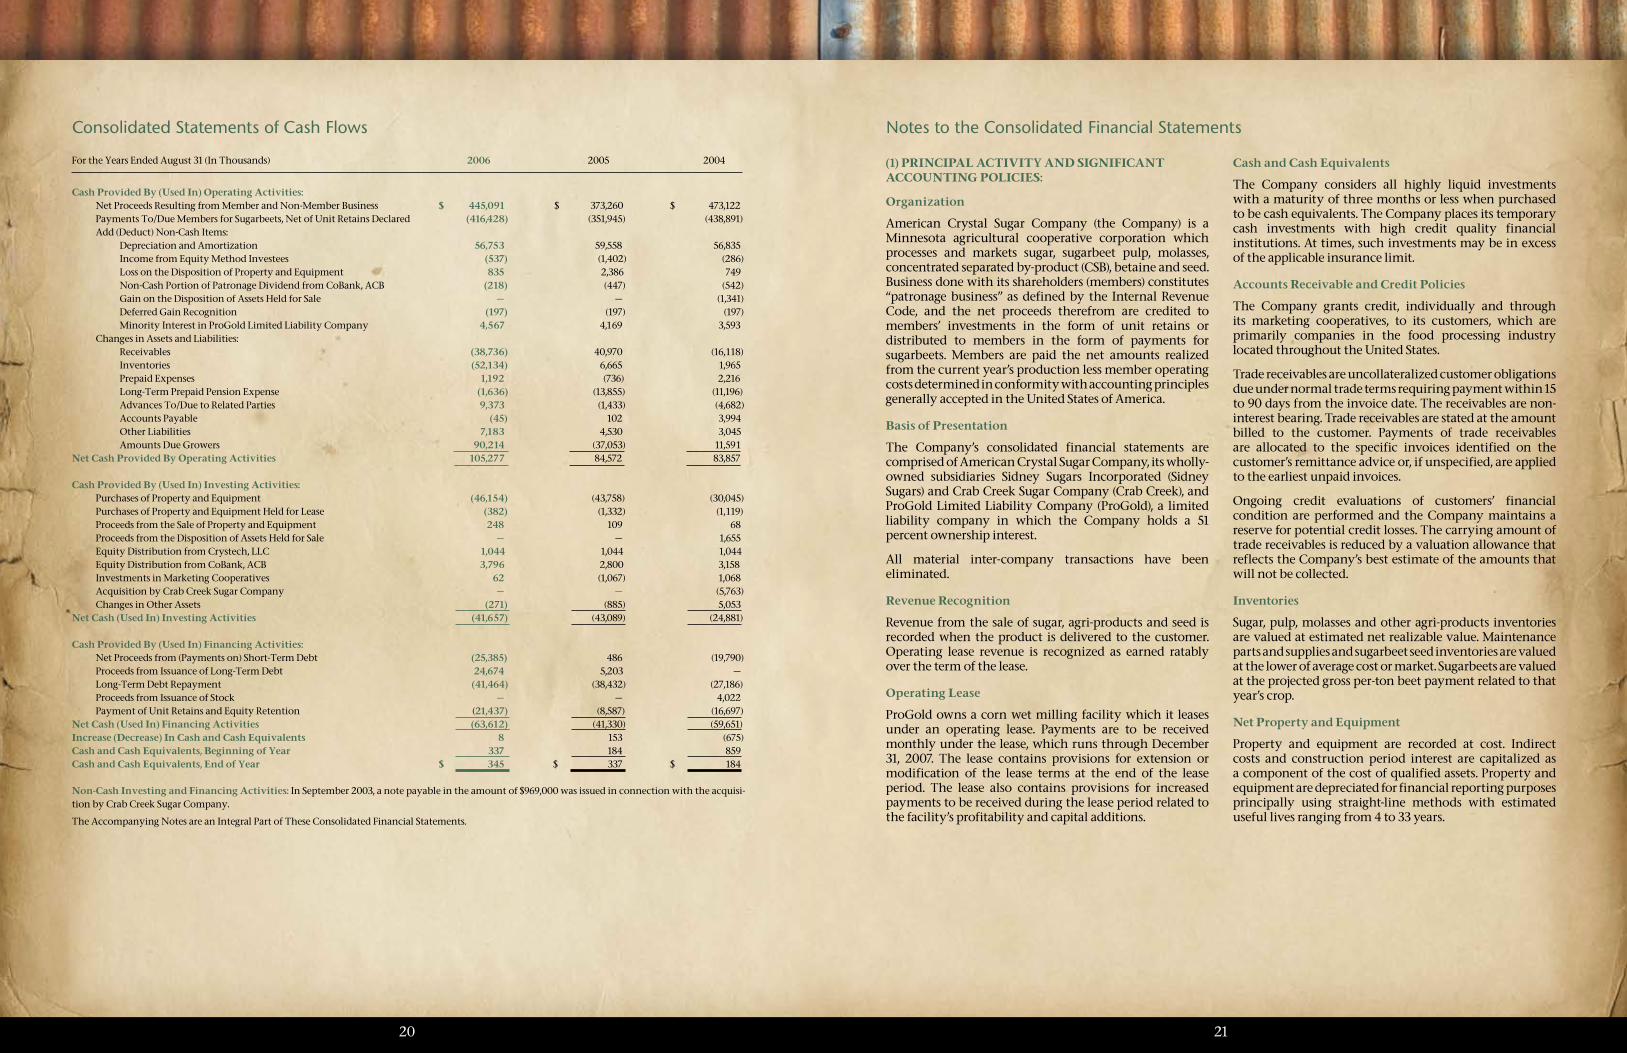
For the Years Ended August 31 (In Thousands) 2006 2005 2004
Cash Provided By (Used In) Operating Activities: Net Proceeds Resulting from Member and Non-Member Business $ 445,091 $ 373,260 $ 473,122 Payments To/Due Members for Sugarbeets, Net of Unit Retains Declared (416,428) (351,945) (438,891) Add (Deduct) Non-Cash Items: Depreciation and Amortization 56,753 59,558 56,835 Income from Equity Method Investees (537) (1,402) (286) Loss on the Disposition of Property and Equipment 835 2,386 749 Non-Cash Portion of Patronage Dividend from CoBank, ACB (218) (447) (542) Gain on the Disposition of Assets Held for Sale — — (1,341) Deferred Gain Recognition (197) (197) (197) Minority Interest in ProGold Limited Liability Company 4,567 4,169 3,593 Changes in Assets and Liabilities: Receivables (38,736) 40,970 (16,118) Inventories (52,134) 6,665 1,965 Prepaid Expenses 1,192 (736) 2,216 Long-Term Prepaid Pension Expense (1,636) (13,855) (11,196) Advances To/Due to Related Parties 9,373 (1,433) (4,682) Accounts Payable (45) 102 3,994 Other Liabilities 7,183 4,530 3,045 Amounts Due Growers 90,214 (37,053) 11,591Net Cash Provided By Operating Activities 105,277 84,572 83,857
Cash Provided By (Used In) Investing Activities: Purchases of Property and Equipment (46,154) (43,758) (30,045) Purchases of Property and Equipment Held for Lease (382) (1,332) (1,119) Proceeds from the Sale of Property and Equipment 248 109 68 Proceeds from the Disposition of Assets Held for Sale — — 1,655 Equity Distribution from Crystech, LLC 1,044 1,044 1,044 Equity Distribution from CoBank, ACB 3,796 2,800 3,158 Investments in Marketing Cooperatives 62 (1,067) 1,068 Acquisition by Crab Creek Sugar Company — — (5,763) Changes in Other Assets (271) (885) 5,053Net Cash (Used In) Investing Activities (41,657) (43,089) (24,881)
Cash Provided By (Used In) Financing Activities: Net Proceeds from (Payments on) Short-Term Debt (25,385) 486 (19,790) Proceeds from Issuance of Long-Term Debt 24,674 5,203 — Long-Term Debt Repayment (41,464) (38,432) (27,186) Proceeds from Issuance of Stock — — 4,022 Payment of Unit Retains and Equity Retention (21,437) (8,587) (16,697)Net Cash (Used In) Financing Activities (63,612) (41,330) (59,651)Increase (Decrease) In Cash and Cash Equivalents 8 153 (675)Cash and Cash Equivalents, Beginning of Year 337 184 859Cash and Cash Equivalents, End of Year $ 345 $ 337 $ 184
Non-Cash Investing and Financing Activities: In September 2003, a note payable in the amount of $969,000 was issued in connection with the acquisi-tion by Crab Creek Sugar Company.
The Accompanying Notes are an Integral Part of These Consolidated Financial Statements.
Consolidated Statements of Cash Flows
(1) PRINCIPAL ACTIVITY AND SIGNIFICANT ACCOUNTING POLICIES:
Organization
American Crystal Sugar Company (the Company) is a Minnesota agricultural cooperative corporation which processes and markets sugar, sugarbeet pulp, molasses, concentrated separated by-product (CSB), betaine and seed. Business done with its shareholders (members) constitutes “patronage business” as defined by the Internal Revenue Code, and the net proceeds therefrom are credited to members’ investments in the form of unit retains or distributed to members in the form of payments for sugarbeets. Members are paid the net amounts realized from the current year’s production less member operating costs determined in conformity with accounting principles generally accepted in the United States of America.
Basis of Presentation
The Company’s consolidated financial statements are comprised of American Crystal Sugar Company, its wholly-owned subsidiaries Sidney Sugars Incorporated (Sidney Sugars) and Crab Creek Sugar Company (Crab Creek), and ProGold Limited Liability Company (ProGold), a limited liability company in which the Company holds a 51 percent ownership interest.
All material inter-company transactions have been eliminated.
Revenue Recognition
Revenue from the sale of sugar, agri-products and seed is recorded when the product is delivered to the customer. Operating lease revenue is recognized as earned ratably over the term of the lease.
Operating Lease
ProGold owns a corn wet milling facility which it leases under an operating lease. Payments are to be received monthly under the lease, which runs through December 31, 2007. The lease contains provisions for extension or modification of the lease terms at the end of the lease period. The lease also contains provisions for increased payments to be received during the lease period related to the facility’s profitability and capital additions.
Notes to the Consolidated Financial Statements
Cash and Cash Equivalents
The Company considers all highly liquid investments with a maturity of three months or less when purchased to be cash equivalents. The Company places its temporary cash investments with high credit quality financial institutions. At times, such investments may be in excess of the applicable insurance limit.
Accounts Receivable and Credit Policies
The Company grants credit, individually and through its marketing cooperatives, to its customers, which are primarily companies in the food processing industry located throughout the United States.
Trade receivables are uncollateralized customer obligations due under normal trade terms requiring payment within 15 to 90 days from the invoice date. The receivables are non-interest bearing. Trade receivables are stated at the amount billed to the customer. Payments of trade receivables are allocated to the specific invoices identified on the customer’s remittance advice or, if unspecified, are applied to the earliest unpaid invoices.
Ongoing credit evaluations of customers’ financial condition are performed and the Company maintains a reserve for potential credit losses. The carrying amount of trade receivables is reduced by a valuation allowance that reflects the Company’s best estimate of the amounts that will not be collected.
Inventories
Sugar, pulp, molasses and other agri-products inventories are valued at estimated net realizable value. Maintenance parts and supplies and sugarbeet seed inventories are valued at the lower of average cost or market. Sugarbeets are valued at the projected gross per-ton beet payment related to that year’s crop.
Net Property and Equipment
Property and equipment are recorded at cost. Indirect costs and construction period interest are capitalized as a component of the cost of qualified assets. Property and equipment are depreciated for financial reporting purposes principally using straight-line methods with estimated useful lives ranging from 4 to 33 years.
22 23
Net Property and Equipment Held for Lease
Net property and equipment held for lease are stated at cost. Depreciation on assets placed in service is provided using the straight-line method over the estimated useful lives of the individual assets, ranging from 5 to 40 years.
Impairment of Long Lived Assets
The Company reviews its long lived assets for impairment whenever events indicate that the carrying amount of the asset may not be recoverable. An impairment loss is recorded when the sum of the future cash flows is less than the carrying amount of the asset. An impairment loss is measured as the amount by which the carrying amount of the asset exceeds its fair value. There were no impairment losses incurred during the year.
Related Parties
The following organizations are considered related parties for financial reporting purposes: United Sugars Corporation (United); Midwest Agri-Commodities Company (Midwest); and Crystech, LLC (Crystech).
Investments
Investments in CoBank, ACB are stated at cost plus unredeemed patronage refunds received in the form of capital stock. Investments in marketing cooperatives and Crystech are accounted for using the equity method.
Members’ Investments
Preferred and Common Stock - The ownership of common and preferred stock is restricted to a “farm operator” as defined by the bylaws of the Company. Each shareholder may own only one share of common stock and is entitled to one vote in the affairs of the Company. Each shareholder is required to grow a specified number of acres of sugarbeets in proportion to the shares of preferred stock owned. The preferred shares are non-voting. All transfers of stock must be approved by the Company’s Board of Directors and any shareholder desiring to sell stock must first offer it to the Company for repurchase at its par value. The Company has never exercised this repurchase option for preferred stock. The bylaws do not allow dividends to be paid on either the common or preferred stock.
Unit Retains - The bylaws authorize the Company’s Board of Directors to require additional direct capital investments by members in the form of a variable unit retain per ton of up to a maximum of 10 percent of the weighted average gross per ton beet payment. All refunds and retirements of unit retains must be approved by the Board of Directors.
Equity Retention – The Payment-In-Kind (PIK) Certificate Purchase Agreement authorizes the Company to require additional direct capital investments by members participating in the PIK program. The amount of the equity contribution is calculated per hundredweight of PIK certificates and is approximately equivalent (on a Company-wide average basis) to the unit retain declared by the Company on the corresponding year’s sugarbeet crop. All refunds and retirements of equity retains must be approved by the Board of Directors.
Accumulated Other Comprehensive Income (Loss) - Accumulated Other Comprehensive Income (Loss) represents the cumulative net increase (decrease) in equity related to the recording of the minimum pension liability adjustment. Consistent with the Company’s treatment of income taxes related to member-source income and expenses, accumulated other comprehensive income (loss) does not include any adjustment for income taxes.
Retained Earnings (Accumulated Deficit) - Retained earnings represents the cumulative net income (loss) resulting from non-member business and, for years prior to 1996, the difference between member income as determined for financial reporting purposes and for federal income tax reporting purposes.
Deferred Costs and Product Values
All costs incurred prior to the beginning of the Company’s fiscal year that relate to receiving and processing the subsequent year’s sugarbeet crop are deferred. Similarly, the net realizable values of products produced prior to the beginning of the Company’s fiscal year that relate to the subsequent year’s sugarbeet crop are deferred. The net result of these deferred costs and product values as of August 31, 2006 of $2.9 million has been recorded in the Company’s balance sheet in “Other Current Liabilities.” There were no deferred costs or deferred product values as of August 31, 2005 or 2004.
Recently Issued Accounting Pronouncements
The Financial Accounting Standards Board (FASB) has recently issued Statement No. 157, Fair Value Measurements. This Statement defines fair value, establishes a framework for measuring fair value in generally accepted accounting principles (GAAP), and expands disclosures about fair value measurements. This statement becomes effective for the Company in the first quarter of fiscal 2009. The Company does not expect that the adoption of this statement will have a material effect on the Company’s financial statements.
The Financial Accounting Standards Board has also recently issued Statement No. 158, Employers’ Accounting for Defined Benefit Pension and Other Postretirement Plans—an amendment of FASB Statements No. 87, 88, 106, and 132(R). This Statement will require the Company to recognize the overfunded or underfunded status of a defined benefit postretirement plan as an asset or liability in its statement of financial position and to recognize changes in that funded status in the year in which the changes occur through comprehensive income. This requirement becomes effective for the Company as of August 31, 2007. This Statement will also require the Company to measure the funded status of a plan as of the date of its year-end statement of financial position. This requirement becomes effective for the Company as of August 31, 2009. The Company expects that the adoption of this statement will have a material impact on Prepaid Pension Expense and Accumulated Other Comprehensive Income/Loss on the Company’s Consolidated Balance Sheet.
The Financial Accounting Standards Board has also recently issued Interpretation No. 48, Accounting for Uncertainty in Income Taxes—an interpretation of FASB Statement No. 109. This Interpretation clarifies the accounting for uncertainty in income taxes recognized in the financial statements in accordance with FASB Statement No. 109, Accounting for Income Taxes. This interpretation becomes effective for the Company in the first quarter of fiscal 2008. The Company does not expect that the adoption of this interpretation will have a material effect on the Company’s financial statements.
Interest Expense, Net
The Company earns patronage dividends from CoBank, ACB based on the Company’s share of the net income earned by CoBank, ACB. These patronage dividends are applied against interest expense.
Income Taxes
The Company is a non-exempt cooperative for federal income tax purposes. As such, the Company is subject to corporate income taxes on its net income from non-member sources. The provision for income taxes relates to the results of operations from non-member business, state income taxes and certain other permanent differences between financial and income tax reporting. The Company also has various temporary differences between financial and income tax reporting, most notable of which is depreciation.
Deferred tax assets, less any applicable valuation allowance, and deferred tax liabilities are included in the financial statements at currently enacted income tax rates applicable to the period in which the deferred tax assets and liabilities are expected to be realized or settled.
Accounting Estimates
The preparation of the financial statements in conformity with accounting principles generally accepted in the United States of America requires management to make estimates and assumptions that affect the reported amounts of assets and liabilities at the date of the financial statements and the reported amounts of revenues and expenses during the reporting period. Actual results could differ from those estimates.
Business Risk
The financial results of the Company’s operations may be directly and materially affected by many factors, including prevailing prices of sugar and agri-products, the Company’s ability to market its sugar competitively, the weather, government programs and regulations, and costs and expenses.
Shipping and Handling Costs
The costs incurred for the shipping and handling of products sold are classified in the financial statements as a selling expense on the Statements of Operations. Shipping and handling costs were $130.6 million, $127.4 million and $129.1 million for the years ended August 31, 2006, 2005 and 2004, respectively.

24 25
(2) RECEIVABLES:
There were two customers attributable to the Company that accounted for 13 percent and 16 percent, respectively, of the Company’s total receivables as of August 31, 2006. There was no single customer attributable to the Company that accounted for 10 percent or more of the Company’s total receivables as of August 31, 2005 or that accounted for 10 percent or more of the revenues of the Company for the years ended August 31, 2006, 2005 or 2004.
(3) INVENTORIES:
The major components of inventories as of August 31, 2006 and 2005 are as follows:
(In Thousands) 2006 2005
Refined Sugar, Pulp, Molasses, Other Agri-Products and Sugarbeet Seed $ 134,211 $ 96,647
Unprocessed Sugarbeets 8,721 —Maintenance Parts and Supplies 31,829 25,980Total Inventories $ 174,761 $ 122,627
(4) NET PROPERTY AND EQUIPMENT:
Indirect costs capitalized were $1.1 million, $1.0 million and $1.1 million in 2006, 2005 and 2004, respectively. Construction period interest capitalized was $ .8 million, $ .6 million and $ .3 million in 2006, 2005 and 2004, respectively. Depreciation expense was $42.9 million, $41.9 million and $41.6 million in 2006, 2005 and 2004, respectively. The Company had outstanding commitments totaling $12.4 million as of August 31, 2006, for equipment and construction contracts related to various capital projects.
(5) NET PROPERTY AND EQUIPMENT HELD FOR LEASE:
ProGold owns a corn wet-milling facility that it leases under an operating lease which runs through December 31, 2007. Under the terms of the operating lease, the lessee manages all aspects of the operations of the ProGold corn wet-milling facility.
Net Property and Equipment Held for Lease are stated at cost, net of accumulated depreciation. The components of Net Property and Equipment Held for Lease as of August 31, 2006 and 2005 are shown below:
(In Thousands) 2006 2005
Land and Land Improvements $ 7,937 $ 7,905Buildings 41,193 41,055Equipment 200,485 200,151Construction in Progress 160 503Less Accumulated Depreciation (109,734) (98,722)Net Property and Equipment
Held for Lease $ 140,041 $ 150,892
Future minimum payments to be received under the lease are as follows:
Fiscal year ending August 31, (In Thousands)
2007 $ 23,4522008 8,093Total $ 31,545
(6) INVESTMENTS IN MARKETING COOPERATIVES:
The Company has a 65 percent ownership interest and a 33 1/3 percent voting interest in United. The investment is accounted for using the equity method. All sugar products produced are sold by United as an agent for the Company. The amount of sales and related costs to be recognized by each owner of United is allocated based on its pro rata share of sugar production for the year. The owners provide United with cash advances on an ongoing basis for operating and marketing expenses incurred by United. The Company had outstanding advances to United of $4.3 million and $14.6 million as of August 31, 2006 and 2005, respectively. The Company provides administrative services for United and is reimbursed for costs incurred. The Company was reimbursed $1.2 million, $1.1 million and $1.0 million for services provided during 2006, 2005 and 2004, respectively.
The Company has a 53 percent ownership interest and a 25 percent voting interest in Midwest. The investment is accounted for using the equity method. Substantially all sugarbeet pulp, molasses and other agri-products produced are sold by Midwest as an agent for the Company. The amount of sales and related costs to be recognized by each owner of Midwest is allocated based on its pro rata share of production for each product for the year. The owners provide Midwest with cash advances on an ongoing basis for operating and marketing expenses incurred by Midwest. The Company had outstanding advances from Midwest of $2.7 million and $4.1 million as of August 31, 2006 and 2005, respectively. The Company provides administrative services for Midwest and is reimbursed for costs incurred. The Company was reimbursed $121,000, $95,000 and $71,000 for services provided during 2006, 2005 and 2004, respectively. The owners of Midwest are guarantors of the short-term line of credit Midwest has with CoBank, ACB. As of August 31, 2006, Midwest had outstanding short-term debt with CoBank, ACB of $3.6 million, of which $2.1 million was guaranteed by the Company.
(7) CRYSTECH, LLC:
Crystech is a special purpose entity that operates a molasses desugarization facility at the Company’s Hillsboro, North Dakota, sugar factory together with certain sugar processing equipment located at the Hillsboro, North Dakota, and Moorhead, Minnesota, sugar factories. The Company controls 50 percent of Crystech and accounts for its investment using the equity method.
As of August 31, (In Thousands) 2006 2005
Current Assets $ 4,348 $ 3,933Long-Term Assets 18,665 31,267Total Assets $ 23,013 $ 35,200 Current Liabilities $ 6,143 $ 9,216Long-Term Liabilities — 9,214 Total Liabilities 6,143 18,430Members’ Equity 16,870 16,770Total Liabilities and
Members’ Equity $ 23,013 $ 35,200
For the Years Ended August 31,(In Thousands) 2006 2005 2004
Revenue $ 20,582 $ 21,186 $ 21,261Operating Expenses 18,006 17,727 16,91 1Other Expenses 1,432 2,315 3,206Net Income $ 1,144$ 1,144 $ 1,144
The Company has a tolling services agreement with Crystech whereby the Company pays for tolling services for processing sugarbeet molasses delivered to Crystech with title and risk of loss throughout the process maintained by the Company. The tolling agreement expires in 2012 and is subject to early termination by the Company in the event that specified plant performance is not maintained.
On a cumulative basis, the Company receives an annual allocation of Crystech’s net income equal to 7.5 percent of the initial value of the Preferred Equity contribution by the Company or approximately $1.0 million. The Company had outstanding payables to Crystech of approximately $4.3 million and $3.9 million as of August 31, 2006 and 2005, respectively, related to the tolling services agreement. Following is summary financial information for Crystech:
(8) LONG-TERM AND SHORT-TERM DEBT:
The long-term debt outstanding as of August 31, 2006 and 2005 is summarized below:
(In Thousands) 2006 2005
Term Loans from CoBank, ACB, due in varying amounts through 2011, interest at fixed rates of 5.35% to 8.57%, with senior lien on substantially all non-current assets $ 116,276 $ 128,793
Term Loans from Insurance Companies, due in varying amounts from 2010 through 2028, interest at fixed rates of 4.78% to 7.42%, with senior lien on substantially all non-current assets 60,000 62,857
Pollution Control and Industrial Development Revenue Bonds, due in varying amounts through 2020 interest at fixed rates of 5.0% to 5.40% and a varying rate of 3.40% to 3.51% as of August 31, 2006, substantially secured by letters of credit 42,323 42,939
Term Loan from the Bank of North Dakota, due in equal amounts through 2009, interest at fixed rates of 3.30%, unsecured 2,400 3,200
Total Long-Term Debt 220,999 237,789
Less Current Maturities (20,962) (20,947)
Long-Term Debt, Net of Current Maturities $ 200 ,037 $ 216,842
26 27
(9) OPERATING LEASES:
The Company is party to operating leases for such items as rail cars, product storage tanks, computer hardware and vehicles. Cargill, Incorporated has assumed responsibility for the payments on a rail car lease for the duration of the operating lease with ProGold, described in Note 1. After the lease with Cargill, Incorporated expires, responsibility for the rail car lease payments reverts back to ProGold. Operating lease expense was $1.6 million, $1.4 million and $1.4 million for years ended August 31, 2006, 2005 and 2004, respectively. Future minimum payments under these obligations are as follows:
Fiscal year ending August 31, (In Thousands)
2007 $ 2,1012008 4,2812009 5, 71 72010 5,6842011 5,677Thereafter 35,015Total $ 58,475
(10) EMPLOYEE BENEFIT PLANS:
Company-Sponsored Defined Benefit Pension and Other Post-Retirement Benefit Plans
Substantially all employees who meet eligibility requirements of age and length of service are covered by a Company-sponsored retirement plan. As of August 31, 2006, the pension plans were funded as required by the funding standards set forth by the Employee Retirement Income Security Act (ERISA). The Company also has non-qualified supplemental executive retirement plans for certain employees.
The following schedule reflects the percentage of pension plan assets by asset class as of the latest measurement date, May 31, 2006:
Percentage of Pension Plan Assets by Asset Class as of May 31, 2006
Asset Class Target Range Actual Allocation
Large U.S. Stocks 20.0%–40.0% 29.5%Small U.S. Stocks 1 7.5% –27.5% 25.6% Non-U.S. Stocks 1 7.5% –27.5% 24.2% U.S. Bonds 15.0%–35.0% 20.5% Cash 0.0%–5.0% 0.2%
Minimum annual principal payments for the next five years are as follows:
(In Thousands)
2007 $ 20,962 2008 $ 52,960 2009 $ 20,992 2010 $ 18,789 2011 $ 34,668
The Company has a long-term debt line of credit with CoBank, ACB of $236.4 million, of which $116.3 million in loans and $52.1 million in long-term letters of credit were outstanding as of August 31, 2006. The unused long-term line of credit as of August 31, 2006 was $68.0 million.
The short-term debt outstanding as of August 31, 2006 and 2005 is summarized below:
(In Thousands) 2006 2005
Commercial Paper, at a fixed interest rate of 5.47%, due 9/1/06 $ 5,300 $ 30,685
During the year ended August 31, 2006, the Company borrowed from CoBank, ACB, and issued commercial paper to meet its short-term borrowing requirements. As of August 31, 2006, the Company had available short-term lines of credit totaling $301.0 million, of which $5.3 million in commercial paper and $5.8 million in short-term letters of credit were outstanding. The unused short-term line of credit as of August 31, 2006 was $289.9 million.
Maximum borrowings, average borrowing levels and average interest rates for short-term debt for the years ended August 31, 2006 and 2005, follow:
(In Thousands, Except Interest Rates) 2006 2005
Maximum Borrowings $ 216,055 $ 197,077Average Borrowing Levels $ 118,553 $ 112,560Average Interest Rates 5.16% 3.18%
The terms of the loan agreements contain prepayment penalties along with certain covenants related to, among other matters, the: level of working capital; ratio of term liabilities to members’ investments; current ratio; level of term debt to net funds generated; and investment in CoBank, ACB stock in amounts prescribed by the bank. Substantially all non-current assets are pledged to the senior lenders to provide security to support the Company’s seasonal and long-term financing. As of August 31, 2006, the Company was in compliance with the terms of the loan agreements.
Interest paid, net of amounts capitalized, was $19.6 million, $20.0 million and $21.1 million for the years ended August 31, 2006, 2005 and 2004, respectively.
The Investment Committee has the responsibility of managing the operations and administration of American Crystal Sugar Company’s retirement plans and trust. The Investment Committee has an investment policy for the pension plan assets that establishes target asset allocations as shown above. The Investment Committee is committed to diversification to reduce the risk of large losses. To that end, the Investment Committee has adopted policies requiring that each asset class will be diversified and equity exposure will be limited to 85% of the total portfolio value. The stated goal is for each component of the plan to earn a rate of return greater than its corresponding benchmark. Progress of the plan against its return objectives will be measured over a full market cycle.
To develop the expected long-term rate of return on assets assumption, the Company considered the historical returns and the future expectations for returns for each asset class, as well as, the target asset allocation of the pension portfolio. This resulted in the selection of the 8.25% long-term rate of return on assets assumption.
The development of the discount rate was based on a bond matching model whereby a hypothetical portfolio of bonds with an “AA” or better rating by a nationally recognized debt rating agency was constructed to match the expected benefit payments under the Company’s pension plans through the year 2035. The reinvestment rate for benefit cash flow occurring after 2035 was discounted back to the year 2035 at a rate consistent with the yields on long-term zero-coupon bonds. The resulting present value was treated as additional benefit cash flow for the year 2035 and consistently applied as any other benefit cash flow during the bond matching process.
The following schedules provide the components of the Net Periodic Pension and Post-Retirement Costs for the years ended August 31, 2006, 2005 and 2004:
Components of Net Periodic Pension Cost
(In Thousands) 2006 2005 2004
Service Cost $ 4,222 $ 3,383 $ 2,772Interest Cost 7,185 7,075 6,017Expected Return on Plan Assets (9,856) (8,062) (5,960)Multiple Employer Adjustment (69) (348) (342)Amortization of Net Transition Assets — (21) (124)Amortization of Prior Service Costs 1,126 1,428 544Amortization of Net Loss 2,992 2,197 1 ,999Net Periodic Pension Cost $ 5,600 $ 5,652 $ 4,906
Components of Net Periodic Post-Retirement Cost
(In Thousands) 2006 2005 2004
Service Cost $ 1,411 $ 1 ,099 $ 1 ,223Interest Cost 2,088 2,172 1,924Amortization of Net Loss 387 287 498Net Periodic Post-Retirement Cost $ 3,886 $ 3,558 $ 3 ,645
The following schedule reflects the expected pension and post-retirement benefit payments during each of the next five years and the aggregate for the following five years:
Expected Benefit Payments(In Thousands) Pension Post-Retirement
2007 $ 4,576 $ 680 2008 8,172 884 2009 5,239 1,055 2010 5,676 1,315 2011 6,192 1,614 2012-2016 40,431 12,243 Total $ 70,286 $ 17,791
The Company expects to contribute approximately $4.0 million to the pension plans and $680,000 to the post-retirement plans during the next fiscal year.
The Company has a medical plan and a Medicare supplement plan which are available to union retirees and certain non-union retirees. The costs of these plans are shared by the Company and plan participants. The Company’s post-retirement plan for certain non-union employees currently coordinates with Medicare’s medical coverage and provides tiered prescription drug coverage. The Company has determined that this plan is actuarially equivalent to Medicare Part D and therefore qualifies for the Federal subsidy provision in the Medicare Prescription Drug, Improvement, and Modernization Act of 2003. This provision allows the Company to take a tax deduction for 28 percent of the dollars spent providing prescription drug coverage beginning in calendar year 2006. In accordance with FASB Staff Position (FSP) FAS-106-2, the Company recognized a reduction in the accumulated post-retirement benefit obligation in fiscal 2005 of approximately $4.6 million due to the effect of the subsidy.

28 29
For measurement purposes, a 10.0 percent annual rate of increase in the per capita cost of covered healthcare benefits for participants under age 65 was assumed for 2007. The rate is assumed to decline to 5.0 percent over the next five years. For participants age 65 and older, an 11.0 percent annual rate of increase in the per capita cost of covered healthcare benefits was assumed for 2007. The rate is assumed to decline to 6.0 percent over the next five years.
Assumed healthcare trends can have a significant effect on the amounts reported for healthcare plans. A one percent change in the assumed healthcare trend rates would have the following effects:
(In Thousands) 1% Increase 1% Decrease
Effect on total service and interest cost components of net periodic post-retirement benefit costs $ 643 $ (513)Effect on the accumulated post-retirement benefit obligation $ 3,978 $ (3,357)
The following schedules set forth a reconciliation of the changes in the plans’ benefit obligation and fair value of assets for the years ending August 31, 2006 and 2005 and a statement of the funded status and amounts recognized in the Balance Sheets as of August 31, 2006 and 2005:
Pension Post-Retirement(In Thousands) 2006 2005 2006 2005
Change in Benefit Obligation Obligation at the Beginning of the Year $ 130,647 $ 96,936 $ 37,660 $ 32,152Service Cost 4,222 3,383 1,41 1 1,099Interest Cost 7,185 7,075 2,088 2,172Plan Amendments — 8,164 — —Plan Participant Contributions — — 508 626Medicare Part D Subsidy — — 34 —Actuarial (Gain) Loss (15,454) 19,196 (10,821) 2,997Benefits Paid (4,187) (4,107) (1,450) (1,386)Obligation at the End of the Year $ 122,413 $ 130,647 $ 29,430 $ 37,660
Change in Plan AssetsFair Value at the Beginning of the Year $ 121,553 $ 98,107 $ — $ —Actual Return on Plan Assets 15,939 8,730 — —Plan Participant Contributions — — 508 626Medicare Part D Subsidy — — 34 —Employer Contributions 5,292 18,823 908 760Benefits Paid (4,187) (4,107) (1,450) (1,386)Fair Value at the End of the Year $ 138,597 $ 121,553 $ — $ —
Funded StatusFunded Status as of August 31, $ 16,184 $ (9,094) $ (29,430) $ (37,660)Unrecognized Actuarial (Gain) Loss 18,289 42,812 (1,818) 9,390Unrecognized Prior Service Cost 8,178 9,304 — —Adjustment for Multiple Employer Plan — (6) — —Net Amount Recognized $ 42,651 $ 43,016 $ (31,248) $ (28,270)
Amounts Recognized in the Balance SheetsPrepaid Pension Cost $ 48,773 $ 48,262 $ — $ —Accrued Benefit Liability (6,622) (6,078) (31,248) (28,270)Accumulated Other Comprehensive Loss 500 832 — — Net Amount Recognized $ 42,651 $ 43,016 $ (31,248) $ (28,270)
Change in Additional Minimum Liability (for the current year)(In Thousands) 2006
Other Comprehensive Loss $ (332)Accrued Pension Liability Decrease $ 332
The assumptions used in the measurement of the Company’s benefit obligations are shown below:
Weighted Average Assumptions as of August 31, Pension Post-Retirement 2006 2005 2006 2005Discount Rate 6.62% 5.61% 6.62% 5.61% Expected Return on Plan Assets 8.25% 8.25% N/A N/ARate of Compensation Increase
(Non-Union Plan Only) 3.5% 3.5% N/A N/A
(11) MEMBERS’ INVESTMENTS:
The following schedule details the Preferred Stock and Common Stock as of August 31, 2006, 2005 and 2004:
Par Shares Shares Issued Value Authorized & OutstandingPreferred Stock:
August 31, 2006 $76.77 600,000 498,570August 31, 2005 $76.77 600,000 498,570August 31, 2004 $76.77 600,000 498,570
Common Stock: August 31, 2006 $10.00 4,000 2,874August 31, 2005 $10.00 4,000 2,904August 31, 2004 $10.00 4,000 2,873
1999 Long-Term Incentive Plan
During 2005, the granting of additional contract rights under the 1999 Long-Term Incentive Plan (1999 Plan) was discontinued with the adoption of the 2005 Long-Term Incentive Plan (2005 Plan). All vested contract rights as of December 31, 2004, remained in the 1999 Plan while all unvested contract rights were transferred to the 2005 Plan. The value of the contract rights remaining in the 1999 Plan is related to the value of preferred shares of the Company as determined by the Board of Directors. As of August 31, 2006, there were 455.07 vested contract rights remaining in the 1999 Plan. At August 31, 2006, the Board of Directors increased the value of these contract rights from $1,800 to $1,900 per contract right.
2005 Long-Term Incentive Plan
The 2005 Long-Term Incentive Plan provides deferred compensation to certain key executives of the Company. The plan creates financial incentives that are based upon contract rights which are available to the executive under the terms of the plan, the value of which is related to the value of preferred shares of the Company as determined by the Board of Directors. During 2006, 12.63 vested contract rights were exercised at a stated value of $1,800 per contract right. In 2006, 306.05 contract rights were granted at a stated value of $1,900 per contract right. At August 31, 2006, the Board of Directors increased the value of the 659.92 contract rights previously granted from $1,800 to $1,900 per contract right. As of August 31, 2006, there were 965.97 contract rights issued and outstanding at a stated value of $1,900 per contract right, of which 473.01 were vested.
Defined Contribution Plans
The Company has qualified 401(k) plans for all eligible employees. The plans provide for immediate vesting of benefits. Participants may contribute a percentage of their gross earnings each pay period as provided in the participation agreement. The Company matches the non-union and eligible union year-round participants’ contributions up to 4 percent and 2 percent, respectively, of their gross earnings. The Company’s contributions to these plans totaled $1.8 million, $1.7 million and $1.6 million for the years ended August 31, 2006, 2005 and 2004, respectively.

30 31
(12) SEGMENT REPORTING:
The Company has identified two reportable segments: Sugar and Leasing. The sugar segment is engaged primarily in the production and marketing of sugar from sugarbeets. It also sells agri-products and sugarbeet seed. The leasing segment is engaged in the leasing of a corn wet milling plant used in the production of high-fructose corn syrup. The segments are managed separately. There are no inter-segment sales. The leasing segment has a major customer that accounts for all of that segment’s revenue.
Summarized financial information concerning the Company’s reportable segments is shown below:
(In Thousands) For the Year Ended August 31, 2006
Sugar Leasing ConsolidatedNet Revenue from
External Customers $ 980,615 $ 25,101 $ 1,005,716Gross Proceeds $ 663,909 $ 13,040 $ 676,949Depreciation and
Amortization $ 45,637 $ 11,116 $ 56,753Interest Income $ 357 $ 40 $ 397Interest Expense $ 15,565 $ 3,531 $ 19,096Income from Equity
Method Investees $ 537 $ — $ 537Other Income/(Expense), Net $ 3,216 $ (115) $ 3,101Net Proceeds $ 440,337 $ 4,754 $ 445,091Capital Expenditures $ 46,154 $ 382 $ 46,536
(In Thousands) For the Year Ended August 31, 2005
Sugar Leasing ConsolidatedNet Revenue from
External Customers $ 939,424 $ 26,050 $ 965,474Gross Proceeds $ 586,754 $ 14,033 $ 600,787Depreciation and
Amortization $ 48,486 $ 11,072 $ 59,558Interest Income $ 512 $ 17 $ 529Interest Expense $ 13,982 $ 5,188 $ 19,170Income from Equity
Method Investees $ 1,402 $ — $ 1,402Other Income/(Expense), Net $ (863) $ (11) $ (874)Net Proceeds $ 368,920 $ 4,340 $ 373,260Capital Expenditures $ 43,758 $ 1,332 $ 45,090
(In Thousands) For the Year Ended August 31, 2004
Sugar Leasing ConsolidatedNet Revenue from
External Customers $ 1,007,251 $ 25,837 $ 1,033,088Gross Proceeds $ 681,234 $ 13,866 $ 695,100Depreciation and
Amortization $ 45,809 $ 11,026 $ 56,835Interest Income $ 163 $ 6 $ 169Interest Expense $ 13,822 $ 6,327 $ 20,149Income from Equity
Method Investees $ 286 $ — $ 286Other Income/(Expense), Net $ 1,104 $ (109) $ 995Net Proceeds $ 469,383 $ 3,739 $ 473,122Capital Expenditures $ 30,045 $ 1,119 $ 31,164
(In Thousands) As of August 31, 2006
Sugar Leasing ConsolidatedProperty and Equipment, Net $ 332,140 $ — $ 332,140Assets Held for Lease, Net $ — $ 140,041 $ 140,041Segment Assets $ 690,638 $ 149,359 $ 839,997
(In Thousands) As of August 31, 2005
Sugar Leasing ConsolidatedProperty and Equipment, Net $ 329,859 $ 1 $ 329,860Assets Held for Lease, Net $ — $ 150,892 $ 150,892Segment Assets $ 611,964 $ 162,060 $ 774,024
(13) FAIR VALUE OF FINANCIAL INSTRUMENTS:
The fair value of financial instruments is generally defined as the amount at which the instrument could be exchanged in a current transaction between willing parties, other than in a forced liquidation sale. Quoted market prices are generally not available for the Company’s financial instruments. Fair values are based on judgments regarding anticipated cash flows, future expected loss experience, current economic conditions, risk characteristics of various financial instruments and other factors. These estimates involve uncertainties and matters of judgment, and therefore, cannot be determined with precision. Changes in assumptions could significantly affect the estimates.
Long-Term Debt - Based upon current borrowing rates with similar maturities, the fair value of the long-term debt is approximately $229.0 million in comparison to the carrying value of $221.0 million.
Investments in CoBank, ACB, Investments in Marketing Cooperatives, and Investments in Crystech, LLC - The Company believes it is not practical to estimate the fair value of these investments without incurring excessive costs because there is no established market for these securities and equity interests, and it is inappropriate to estimate future cash flows which are largely dependent on future earnings of these organizations.
(14) INCOME TAXES:
Total income tax payments were $290,000; $336,000; and $70,000 for the years ended August 31, 2006, 2005 and 2004, respectively.
As of August 31, 2006, the Company had accumulated approximately $24.5 million of net operating loss carry-forwards for income tax reporting purposes. The net operating loss carry-forwards expire in the years 2012 through 2023. The Company’s net deferred tax liability included in Other Liabilities on the Company’s Balance Sheets as of August 31, 2006 and 2005 is reflected below:
(In Thousands) 2006 2005
Deferred Tax Assets related to non-patronage source temporary differences $ 15,000 $ 14,600
Deferred Tax Liability related to non-patronage source temporary differences 19,200 17,800
Net Deferred Tax Liability $ 4,200 $ 3,200
Income tax expense for the years ended August 31, 2006, 2005 and 2004 is as follows:
(In Thousands) 2006 2005 2004Current Income Taxes $ 687 $ 355 $ 88Deferred Income Taxes 1,000 900 100Total Income Tax Expense $ 1,687 $ 1,255 $ 188
A reconciliation of the Company’s effective tax rates for the years ended August 31, 2006, 2005 and 2004 is shown below:
2006 2005 2004Federal tax expense
at statutory rate 35.0% 35.0% 35.0%State tax expense
at statutory rate 6.0% 6.0% 6.0%Payments to members (40.7)% (40.5)% (41.2)%Other, net — (0.2)% 0.3%Effective tax rate 0.3% 0.3% 0.1%
(15) ENVIRONMENTAL MATTERS:
The Company is subject to extensive federal and state environmental laws and regulations with respect to water and air quality, solid waste disposal and odor and noise control. The Company conducts an ongoing compliance program designed to meet these environmental laws and regulations. The Company believes that it is in substantial compliance with applicable environmental laws and regulations. From time to time, however, the Company may be involved in investigations or determinations regarding non-material matters that may arise.
The Company’s East Grand Forks, Minnesota factory has recently experienced hydrogen sulfide emissions from its water treatment ponds that have exceeded permissible limits. The Company is working with the Minnesota Pollution Control Agency and is aggressively addressing the situation. While the Company may be assessed penalties and/or fines related to this occurrence, as of the date of this report none have been assessed. Any potential penalties and/or fines are not expected to be material to the Company. Capital expenditures will be required to prevent future occurrences of the emissions. The Company’s fiscal 2007 budget includes capital expenditures of approximately $4.0 million at the East Grand Forks factory to address this situation. The amount and timing of any additional capital expenditures that may be required is not currently known.
In addition to the amount discussed above for the East Grand Forks factory, the Company’s fiscal 2007 budget also includes capital expenditures of approximately $1.0 million for environmentally related projects at the Company’s other factory locations.
(16) LEGAL MATTERS:
As of the date of this report, four administrative proceedings have been brought against the United States Department of Agriculture (USDA) seeking reversal of prior decisions regarding the determination and transfer of sugar marketing allocations made by the USDA. While the Company was not a party to any of these administrative proceedings, it was, solely or in coordination with other sugar processors, an intervenor in those administrative proceedings. As of the date of this report, each of the proceedings has completed the administrative process and the decisions by the chief judicial officer of the USDA in each were such that the Company would not experience a reduction in its marketing allocations. Any decision made by the chief judicial officer of the USDA can be further appealed in federal court. An appeal of one of the decisions was subsequently filed by another company. If the decision by the chief judicial officer of the USDA in this case is overturned, it could result in the Company experiencing a reduction in marketing allocations equal to the loss of approximately 25,000 acres in future crop years assuming no other related factors were to change.

32 33
For the Years Ended August 31
(In Thousands, Except Per-Ton-Purchased and Per-Acre-Harvested Amounts) (Not Covered by Report of Independent Registered Public Accounting Firm) 2006 2005 2004 2003 2002 2001 2000 1999 1998 1997
Net Proceeds $ 445,091 $ 373,260 $ 473,122 $ 361,902 $ 398,588 $ 389,039 $ 358,373 $ 369,681 $ 313,007 $ 373,649 PIK Payment, including Equity Retention — — — — (23,497) (28,067) — — — — Non-Member (Income) Loss (2,246) (2,475) (4,240) (5,799) 733 1,884 1,879 494 9,679 18,074
Member Gross Beet Payment 442,845 370,785 468,882 356,103 375,824 362,856 360,252 370,175 322,686 391,723 Unit Retains (26,417) (18,840) (29,991) (17,486) (24,154) (19,239) (1 9,299) (21,332) (8,545) (16,611)
Member Net Beet Payment $ 416,428 $ 351,945 $ 438,891 $ 338,617 $ 351,670 $ 343,617 $ 340,953 $ 348,843 $ 314,141 $ 375,112
Per Ton Purchased:
Net Proceeds $ 50.50 $ 39.59 $ 47.29 $ 41.36 $ 49.47 $ 40.42 $ 37. 11 $ 34.62 $ 36.60 $ 44.95 PIK Payment, including Equity Retention — — — — (2.92) (2.92) — — — — Non-Member (Income) Loss (0.25) (0.26) (0.43) (0.66) 0.09 0.20 0.20 0.05 1.1 3 2.17
Member Gross Beet Payment 50.25 39.33 46.86 40. 70 46.64 37.70 37.31 34.67 37.73 47.12 Unit Retains (3.00) (2.00) (3.00) (2.00) (3.00) (2.00) (2.00) (2.00) (1.00) (2.00)
Member Net Beet Payment $ 47.25 $ 37.33 $ 43.86 $ 38.70 $ 43.64 $ 35.70 $ 35.31 $ 32.67 $ 36.73 $ 45.12
Member Tons Harvested 8,813 9,427 10,006 8,749 8,058 9,626 9,657 10,679 8,553 8,313
Member Gross Beet Payment Per Acre Harvested $ 946.84 $ 763.78 $ 945.46 $ 711.06 $ 829.48 $ 820.68 $ 740.84 $ 769.01 $ 699.05 $ 854.1 1
Member Net Beet Payment Per Acre Harvested $ 890.36 $ 724.97 $ 884.99 $ 676. 15 $ 776. 1 7 $ 777.1 7 $ 701.15 $ 724.69 $ 680.62 $ 817.80
Distribution of Net Proceeds
0
$190
$380
$570
$760
$950
06050403020100999897$0
$10
$20
$30
$40
$50
06050403020100999897 0
$100
$200
$300
$400
$500
06050403020100999897
Gross Beet Payment Per Average Acre (DOLLARS per acre)
Gross Beet Payment(MILLIONS of dollars)
Gross Beet Payment Per Average Ton (DOLLARS per ton)
0
$90
$180
$270
$360
$450
060504030201009998970
$180
$360
$540
$720
$900
06050403020100999897
0
$10
$20
$30
$40
$50
06050403020100999897
Net Beet Payment(MILLIONS of dollars)
Net Beet Payment Per Average Acre (DOLLARS per acre)
Net Beet Payment Per Average Ton (DOLLARS per ton)

3534 35
For the Years Ended August 31
(In Thousands, Except Ratios, Per-Acre-Harvested and Percentage Amounts) (Not Covered by Report of Independent Registered Public Accounting Firm) 2006 2005 2004 2003 2002 2001 2000 1999 1998 1997
Net Revenue $ 1,005,716 $ 965,474 $ 1,033,088 $ 829,246 $ 775,288 $ 866,362 $ 731,432 $ 843,968 $ 676,625 $ 677,004 Total Assets $ 839,997 $ 774,024 $ 822,155 $ 809,751 $ 622,693 $ 641,445 $ 739,719 $ 667,824 $ 648,1 1 8 $ 581,504 Members’ Investments $ 323,256 $ 315,698 $ 303,426 $ 270,346 $ 268,667 $ 255,660 $ 249,330 $ 241,286 $ 224,843 $ 175,928 Long-Term Debt, Net of Current Maturities $ 200,037 $ 216,842 $ 250,086 $ 286,922 $ 182,371 $ 201,416 $ 230,905 $ 233,135 $ 194,695 $ 186,800 Ratio of Debt to Equity .62:1 .69:1 .82:1 1.06:1 .68:1 .79:1 .93:1 .97:1 .87:1 1.06:1 Interest Expense, Net $ 19,096 $ 19,170 $ 20, 149 $ 16,871 $ 14,578 $ 19,973 $ 22,645 $ 21,960 $ 14,390 $ 18,321 Property and Equipment Additions, Net of Retirements $ 45,453 $ 42,595 $ 30,347 $ 46,578 $ 15,281 $ 21,851 $ 42,088 $ 58,693 $ 98,992 $ 69,542 Depreciation and Amortization $ 56,753 $ 59,558 $ 56,835 $ 48,354 $ 40,389 $ 40,427 $ 37,562 $ 34,334 $ 26,870 $ 24,188 Working Capital $ 58,214 $ 4 7,514 $ 58,673 $ 49,572 $ 58,282 $ 45,341 $ 53,613 $ 56,733 $ 30,357 $ 45,652
Red River Valley Statistics — Member Business
Acres Harvested 468 485 496 501 453 442 486 481 462 459 Tons Purchased 8,813 9,427 10,006 8,749 8,058 9,626 9,657 10,679 8,553 8, 31 3 Tons Purchased per Acre Harvested 18.8 19.4 20.2 17.5 17.8 21.8 19.9 22.2 18.5 18.1 Sugar Content of Sugarbeets 18.0% 1 7.7% 18.5% 17.0% 18.0% 17.8% 17.4% 17.7% 17.6% 17.3% Sugar Hundredweight Produced 27,289 28,037 30,983 24,527 25,395 29,034 26,646 25,453 21,528 22,465 PIK Sugar Receipts — — — — 1,177 1,561 — — — — Sold, Including Purchased Sugar (A) 27,257 28,929 30,994 24,991 26,806 32,445 24,756 27,552 21,735 20,579 Pulp Tons Produced 448 4 71 508 429 407 475 464 482 431 438 Sold 461 449 499 428 440 436 460 564 432 396 Molasses Tons Produced 26 22 100 89 54 91 184 362 248 252 Sold 24 48 98 76 42 90 189 397 219 222 CSB Tons Produced 154 1 56 165 166 151 183 136 77 92 85 Sold 150 1 74 167 149 154 175 154 81 77 78 Betaine Tons Produced 21 21 8 2 — — — — — — Sold 20 23 4 1 — — — — — —
(A) Purchased Sugar Hundredweight Sold 41 480 33 465 288 3 230 798 901 869
Selected Financial Data and Certain Statistics
$80
$120
$160
$200
$240
$280
060504030201009998970.25
0.50
0.75
1.00
1.25
1.50
$50
$100
$150
$200
$250
$300
06050403020100999897
$175
$350
$525
$700
$875
$1050
06050403020100999897
Long-Term Debt and Debt/Equity (MILLIONS of dollars)
Net Revenue(MILLIONS of dollars)
Members’ Investments(MILLIONS of dollars)
060504030201009998970
4%
8%
12%
16%
20%
0
5
10
15
20
25
06050403020100999897$0
$20
$40
$60
$80
$100
06050403020100999897
Tons Purchased Per Acre Harvested (TONS per acre)
Sugar Content of Sugarbeets (PERCENT)
Property and Equipment Additions, Net of Retirements (MILLIONS of dollars)

36
Marketing
Midwest Agri-Commodities Company Headquarters 999 Fifth Avenue, Suite 500 San Rafael, CA 94901 (415) 259-2720
James Eichenberger President
Darryl Salter Vice President – North American Operations
United Sugars Corporation Headquarters 7401 Metro Blvd., Suite 350 Edina, MN 55439 (952) 896-0131
John Doxsie President
Mike Kerber Vice President – Sales and Marketing – Consumer
Catherine Maruska Vice President – Operations
Dirk Swart Vice President – Sales and Marketing – Industrial
Paul Wengronowitz Vice President – Finance
Business Information
Executive Personnel
James J. Horvath President and Chief Executive Officer
Thomas S. Astrup Vice President – Agriculture
David A. Berg Vice President – Operations and Chief Operations Officer
Brian F. Ingulsrud Vice President – Administration
Joseph J. Talley Vice President – Finance and Chief Financial Officer
Daniel C. Mott Secretary and General Counsel
Kevin S. Price Director – Government Affairs
Samuel S. M. Wai Treasurer Assistant Secretary
Mark P. Kalvoda Corporate Controller Assistant Treasurer Assistant Secretary
Mark L. Lembke Assistant Treasurer Assistant Secretary
David L. Malmskog Assistant Treasurer Assistant Secretary
Ronald K. Peterson Assistant Treasurer Assistant Secretary
Lisa M. Maloy Assistant Secretary
Annual Meeting
The 2006 Annual Meeting of the members will be held December 7, 2006, at the Holiday Inn, Fargo, N.D.
Auditors
Eide Bailly LLP Sioux Falls, S.D.
Legal Counsel
Fredrikson & Byron PA Minneapolis, MN
Shareholder Information
The Treasury Department can help members with non-receipt of beet payments, transferring shares, changes of address and similar matters. For assistance, contact:
Mary Schmit Stockholder Accounting Supervisor (218) 236-4323
Financial Information
For information regarding American Crystal business operations or financial reports, shareholders should contact:
Joseph J. Talley Vice President – Finance and Chief Financial Officer (218) 236-4391
News Media Inquiries
News media representatives and others needing information about American Crystal corporate activities should contact:
Jeff Schweitzer Public Relations Manager (218) 236-4492
Business Locations and Operating Facilities
Corporate Headquarters 101 North Third Street Moorhead, MN 56560 (218) 236-4400
Beet Seed Division 1700 North 11th Street Moorhead, MN 56560 (218) 236-4788
Crookston Factory P.O. Box 600 Crookston, MN 56716
David Walden Director, Factory Operations (218) 281-0142
Jerry Christenson Agronomy Manager (218) 281-0107
James Eichenberger President Midwest Agri-Commodities Company
John Doxsie President United Sugars Corporation
Drayton Factory P.O. Box 190 Drayton, ND 58225
Ron Koester Factory Manager (701) 454-3230
Doug Rains Agronomy Manager (701) 454-3238
East Grand Forks Factory P.O. Box 357 East Grand Forks, MN 56721
Bob Aune Factory Manager (218) 773-5124
Jerry Christenson Agronomy Manager (218) 281-0107
Hillsboro Factory Rt.2, Box 42 Hillsboro, ND 58045
Lloyd Kennedy Factory Manager (701) 436-3111
Tom Newcomb Agronomy Manager (701) 436-3120
Moorhead Factory 2500 North 11th Street Moorhead, MN 56560
Steve Rosenau Factory Manager (218) 291-5431
Tom Newcomb Agronomy Manager (701) 436-3120
Sidney Factory 35140 Cty. Rd. 125 Sidney, MT 59270 (406) 433-3301
Joseph J. Talley Chief Operating Officer
Steve Sing General Manager
Russ Fullmer Agricultural Manager