american political challenges larryernst2004).pdf · 2005-06-27 · chesapeake bay blues science,...
TRANSCRIPT

AMERICAN POLITICAL CHALLENGES Larry J. Sabato
Series Editor
The American political process is in trouble. Although we witnessed a movement toward specific electoral reforms in the aftermath of the 2000 election debacle, the health of our political system is still at risk. Recent events have altered the political landscape and posed new chal- lenges, and reforms are much needed and wanted by the American pub- lic. Diligence is required, however, in examining carefully the intended and unintended consequences of reforms as we look toward the 2004 elections and beyond.
Series Editor Larry J. Sabato of the University of Virginia Center for Poli- tics is a leading political scientist and commentator who has clear ideas about what needs to change to improve the quality of our democracy. For this series, he taps leading political authors to write cogent diagnoses and prescriptions for improving both politics and government. New and forth- coming books in the series are short, to the point, easy to understand (if difficult to implement against the political grain). They take a stand and show how to overcome obstacles to change. Authors are known for their clear writing style as well as for their political acumen,
Titles in the Series
Chesapeake Bay Blues Science, Politics, and the Struggle to Save the Bay
Howard R. Ernst
Forthcoming
The Presidential Nominating Process A Place for Us?
Rhodes Cook
The Pursuit of Happiness in Times of War Carl M. Cannon
CHESAPEAKE BAY BLUES
SCIENCE, POLITICS, AND THE STRUGGLE TO SAVE THE BAY
H O W A R D R . E R N S T
R O W M A N & LITTLEFIELD PUBLISHERS, INC. Lanham Boulder New York Oxford

CHAPTER 3
aquatic animals reintroduced nutrients into the Bay, allowing the Bay’s nutrient loads to be used and reused in an efficient manner. In time, nu- trients that entered the Bay from its shores and tributaries were flushed out of the system by outgoing tides, only to be replaced by fresh loads of nutrients-completing the natural cycle and maintaining a healthy balance.’
In its natural state, the system worked remarkably well. The Bay used the available nutrients efficiently, supplying an essential resource to the food chain. With human development, however, the natural process of nutrient enrichment has been severely altered. The scientific term for an increased rate of organic matter supplied to an ecosystem is eu- trophication.2 Today, nutrients (most importantly, phosphorus and ni- trogen) enter the Bay in massive quantities as the by-products of agri- cultural production (Le., fertilizers and animal waste), sewage plants, storm-water runoff, septic tanks, and combustion engine^.^ Recent stud- ies estimate that around 287 million pounds of nitrogen and 20 million pounds of phosphorus are introduced to the Bay each year, the vast ma- jority of which is the direct result of human a~t iv i ty .~ It has been esti- mated that nutrient levels are currently seven times higher than they were prior to human de~elopment .~
There are three general classifications of nutrients-point source nutrients, nonpoint source nutrients, and atmospheric nutrients. Point source nutrients enter the Bay through a specific identifiable location, such as a pipe leaving a sewage treatment facilitya6 Roughly a quarter of the Bay’s nutrients enter the Bay from point sources; most of these nutri- ents enter from the nearly 300 major sewage treatment plants in the wa- tershed. Nonpoint source nutrients enter the Bay from all other ground sources, including agricultural runoff and septic tank seepage. Over half of the human-produced nitrogen and phosphorus entering the Bay ar- rives from nonpoint sources, with agricultural runoff being the chief cul- prit (see figures 3.1 and 3.2) . The remaining nutrients enter the Bay as at- mospheric fallout (Le., air pollution) caused by the region’s ever-growing number of cars, lawn mowers, boats, and power plants.
These externalities (Le., unwanted by-products of human activity) overfertilize the Bay’s phytoplankton, causing massive algae blooms in the spring and summer. The algae blooms cloud the water, depriving aquatic grasses and other living resources of life-supporting sunlight. Moreover, when the phytoplankton dies, it falls to the bottom of the Bay and decomposes, a process that consumes considerable amounts of
54
Nutrient Reduction Efforts in the Bay Watershed
Atmospheric I 9%
Figure 3.1. Sources of Phosphorus Pollution to the Bay, 1996. Source: Chesapeake Bay Program ( 1 9 9 9 ~ 24).
dissolved oxygen, further reducing the life-supporting ability of the Bay. In scientific terms, extreme cases of oxygen depletion are referred to as artoxia (Le., the nearly complete depletion of dissolved oxygen in water) and hypoxia (dissolved oxygen concentrations lower than required by indigenous organisms).’ Horton and Eichbaum (1991, 18) explain the environmental consequences of anoxia: “The bottom line is that mas- sive regions of the Bay may become as devoid of oxygen as the surface of the moon. Large portions of the Bay, which still look clean and vital
I AtmosDheric
Nonpoint Source 57%
Figure 3.2. Source: Chesapeake Bay Program ( 1 9 9 9 ~ 24).
Sources of Nitrogen Pollution to the Bay, 1996.
55

CHAPTER 3
to the eye of a boater sailing across them, may in fact be as hostile to fish and crabs as a sandy desert.” The long-term consequence and the ultimate irony of the situation is that overfertilization depletes the Bay of its ability to support life, leaving much of the Bay a barren wasteland (see figure 3.3 for the oxygen requirements for several Bay species).8
Not only can oxygen depletion leave large areas of the Bay lifeless, but rapid declines in oxygen levels can also lead to massive fish kills in once vibrant areas. While it is difficult to estimate how much aquatic life has been lost to oxygen depletion in recent years, the Maryland De- partment of the Environment estimates that over 200,000 fish were lost to oxygen depletion in 1999 alone. In the summer of 2001, floating dead fish, the telltale sign of an oxygen-related fish kill, were widely re- ported in the areas of the Bay including Herring Bay, Magothy River, and the Severn River. While oxygen-related fish kills have occurred in the Bay for many years, Harley Speir, head of the biological monitoring and analysis program for the Maryland Department of Natural Re- sources Fisheries Service, believes, “This [low oxygen levels] is not get- ting any better, and we’re going to have to struggle -Nith the problem.”
Beyond the harmful effects of oxygen depletion and reduced sun- light, scientists have linked nutrient loading to toxic algae blooms that also threaten the Bay’s aquatic resource^.^ Scientists have identified nutrient-saturated water as a prime factor promoting toxic algae blooms. The Bay’s most widely reported toxic bloom occurred in 1997. That year, Pfiesteria, a toxic microorganism, led to the death of tens of thousands of fish in the Bay. Since 1997, increased monitoring has revealed a regular occurrence of Pfiesteria and other dangerous al- gae forms in the Bay, though the widespread fish kills reported in 1997 have not reoccurred.’O More recently, a strain of the “mahogany tide,” a form of algae common in the Bay, was found to be capable of pro- ducing a toxin that can contaminate shellfish. Moreover, unknown va- rieties of algae, with unknown environmental and health conse- quences, have also been found in recent studies.”
Toxic algae has also been linked to human illness. A 1998 study (Grattan et al.) found significant cognitive deficits (Le., memory loss and difficulty learning) in humans who were exposed to Pfiesteriu. The issue began to attract attention during the summer of 1997 when Dr. Ritchie Shoemaker, a physician practicing on the Eastern Shore of Maryland, began treating patients for symptoms attributed to Pfiesteriu exposure. The symptoms included headaches, flu-like muscle aches, trouble with
5 6
itxiped Bass: 5-6
7
White Perch 5
Hard Clam: 5
Blue Crab: 3
Smt: 2
Worms: 1
Figure 3.3. Dissolved Oxygen Criteria: Milligrams of Oxygen per Liter of Water Source: Blankenship (2001a).
5 7

1' 3
CHAPTER 3
memory, and dime-sized lesions on patients' lower extremities.12 While the impact of Pfiesteria on humans is now believed to be temporary, the long-term impact of Pfiesteria toxins on the human brain is simply un- known. Another algae, Chattonella verruculosa, which produces the same toxin that has sickened people in the Gulf of Mexico, has also been found in low levels in Maryland waters. Moreover, blue-green al- gae, a species that can kill domestic animals if consumed, bloomed in 2001 on the Potomac and Sassafras Rivers. As recently as the winter of 2002, an oyster ban was placed on large portions of the Potomac after a toxic algae (Dinophysis acuminatu) was found to have contaminated shellfish in that area. The prevalence and increased awareness of these toxic algae blooms has made nutrient reduction not only an environ- mental concern, but also a persistent public safety issue for residents of the Bay area and consumers of Chesapeake Bay shellfish.
THE DIFFICULn OF ACHIEVING NUTRIENT REDUCTIONS
The deleterious consequences of nutrient loading have long been recog- nized as the single greatest threat to the long-term health of the Chesa- peake Bay. As early as 1972, when Tropical Storm Agnes inundated the Bay with massive nutrient loads, the scientific community began to vo- calize its concern regarding the long-term dangers of nutrient loading. Some have argued that this event led to a paradigm shift within the sci- entific community and later the general public-causing people to aban- don the prevailing view of the Bay as an extension of the sea and instead to see the Bay as a distinct ecosystem that is dominated by the influences of its ~ a t e r s h e d . ' ~ Given that the land-to-water ratio for the Chesa- peake Bay is larger than any other body of water on the planet, it is not surprising that land use practices throughout the watershed greatly in- fluence water quality in the Bay.14
The EPA's early assessment of the Bay, completed in the early 1980s, confirmed the growing concern among scientists that the Bay was being severely altered by nutrient loading. Moreover, from its in- ception in 1983, the Chesapeake Bay Program acknowledged nutrient loading as the Bay's primary health problem and has made reducing this environmental threat its chief restoration objective for nearly two decade~. '~ The aim of reducing nutrient pollutants was the driving force behind the Second Bay Agreement (1987) and has helped to focus the
58
Nutrient Reduction Efforts in the Bay Watershed
restoration effort throughout the 1990s. In the Second Bay Agreement, the Chesapeake Bay Program and its restoration partners set the ambi- tious goal of reducing the level of controllable nutrients entering the Bay by 40 percent of the 1985 levels by the year 2000 (discussed in detail later).
The Chesapeake Bay Program has pursued a multipronged man- agement strategy that reflects the multiple sources of nutrients entering the Bay. The appendix outlines the major events and programs that have influenced nutrient management in the Bay watershed in recent years, as well as several of the factors that have worked against the nutrient re- duction effort. The table is divided into two columns: the column on the left lists major initiatives implemented with nutrient reduction as a pri- mary goal, and the column on the right lists the circumstances that have complicated the task of nutrient reduction. The table reveals the com- plexity and difficulty of meaningfully addressing this long-term envi- ronmental problem.
The most obvious factor working against nutrient reduction ef- forts is that the number of people residing in the Bay watershed has steadily grown over the last century and is likely to substantially in- crease in future years. Conservative estimates predict the population in the area will reach eighteen million by 2020, a doubling in the area's population since the early 1950s.16 Moreover, the amount of energy in- dividuals consume in their homes, the number of cars they operate, the number of miles they drive, and the amount of land that is developed for residential and consumer use have each increased at even higher rates than population growth. Add to this the intensification of farming practices, increased sewage loads, and aging storm water systems, and the difficulty of nutrient management starts to come into focus.
Each of these factors complicates nutrient management efforts. For example, it is estimated that each new resident of the watershed adds to the area 1,300 pounds of solid waste per year, which, depending on how it is treated, may substantially affect nutrient loads entering the Bay." Currently, 1.5 billion gallons of treated sewage flows into the Bay each day.18 More vehicles on the road and increased production by utility companies lead to additional nitrogen oxide in the atmosphere and, consequently, more nitrogen entering the Bay. The development of the land removes natural buffers and allows nutrient-rich runoff to enter the Bay through storm water systems more quickly and in higher concen- trations than would occur from undeveloped land. The intensification
5 9
CHAPTER 3
of farm practices leads to the production of massive amounts of animal waste, mostly from poultry, dairy, and hog farms, as well as nutrient loading from fertilizers. These agricultural by-products, much of which come from states that do not border the Bay, enter as runoff and sub- stantially impact nutrient levels.
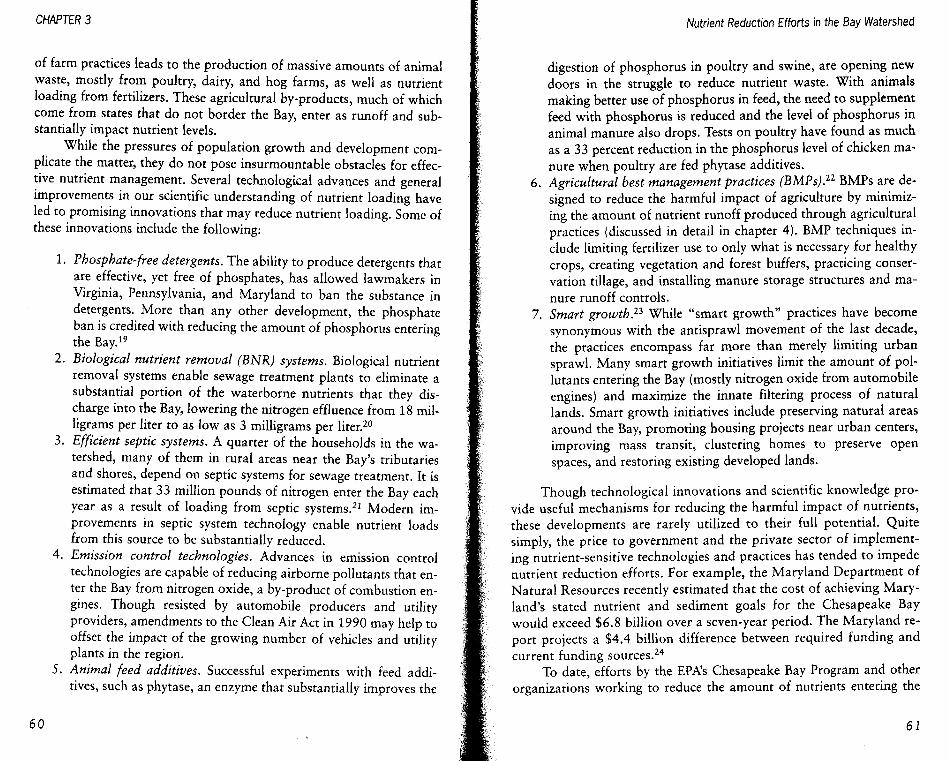
While the pressures of population growth and development com- plicate the matter, they do not pose insurmountable obstacles for effec- tive nutrient management. Several technological advances and general improvements in our scientific understanding of nutrient loading have led to promising innovations that may reduce nutrient loading. Some of these innovations include the following:
1. Phosphate-free detergents. The ability to produce detergents that are effective, yet free of phosphates, has allowed lawmakers in Virginia, Pennsylvania, and Maryland to ban the substance in detergents. More than any other development, the phosphate ban is credited with reducing the amount of phosphorus entering the Bay.lY
2. Biological nutrient removal (BNR) systems. Biological nutrient removal systems enable sewage treatment plants to eliminate a substantial portion of the waterborne nutrients that they dis- charge into the Bay, lowering the nitrogen effluence from 18 mil- ligrams per liter to as low as 3 milligrams per liter.20
3 . Efficient septic systems. A quarter of the households in the wa- tershed, many of them in rural areas near the Bay’s tributaries and shores, depend on septic systems for sewage treatment. It is estimated that 33 million pounds of nitrogen enter the Bay each year as a result of loading from septic systems.2’ Modern im- provements in septic system technology enable nutrient loads from this source to be substantially reduced.
4. Emission control technologies. Advances in emission control technologies are capable of reducing airborne pollutants that en- ter the Bay from nitrogen oxide, a by-product of combustion en- gines. Though resisted by automobile producers and utility providers, amendments to the Clean Air Act in 1990 may help to offset the impact of the growing number of vehicles and utility plants in the region.
5. Animal feed additives. Successful experiments with feed addi- tives, such as phytase, an enzyme that substantially improves the
Nutrient Reduction Efforts in the Bay Watershed
digestion of phosphorus in poultry and swine, are opening new doors in the struggle to reduce nutrient waste. With animals making better use of phosphorus in feed, the need to supplement feed with phosphorus is reduced and the level of phosphorus in animal manure also drops. Tests on poultry have found as much as a 33 percent reduction in the phosphorus level of chicken ma- nure when poultry are fed phytase additives.
6. Agricultural best management practices (BMPs).22 BMPs are de- signed to reduce the harmful impact of agriculture by minimiz- ing the amount of nutrient runoff produced through agricultural practices (discussed in detail in chapter 4). BMP techniques in- clude limiting fertilizer use to only what is necessary for healthy crops, creating vegetation and forest buffers, practicing conser- vation tillage, and installing manure storage structures and ma-
7. nure runoff controls. Smart growth.23 While “smart growth” practices have become synonymous with the antisprawl movement of the last decade, the practices encompass far more than merely limiting urban sprawl. Many smart growth initiatives limit the amount of pol- lutants entering the Bay (mostly nitrogen oxide from automobile engines) and maximize the innate filtering process of natural lands. Smart growth initiatives include preserving natural areas around the Bay, promoting housing projects near urban centers, improving mass transit, clustering homes to preserve open spaces, and restoring existing developed lands.
Though technological innovations and scientific knowledge pro- vide useful mechanisms for reducing the harmful impact of nutrients, these developments are rarely utilized to their full potential. Quite simply, the price to government and the private sector of implement- ing nutrient-sensitive technologies and practices has tended to impede nutrient reduction efforts. For example, the Maryland Department of Natural Resources recently estimated that the cost of achieving Mary- land’s stated nutrient and sediment goals for the Chesapeake Bay would exceed $6.8 billion over a seven-year period. The Maryland re- port projects a $4.4 billion difference between required funding and current funding sources.24
To date, efforts by the EPA’s Chesapeake Bay Program and other organizations working to reduce the amount of nutrients entering the

1
CHAPTER 3
Bay have led to mixed results. The attempt to limit nutrient loading from point sources has been moderately successful. Nutrient reductions in these areas have primarily resulted from the Bay states adopting phosphate detergent bans between 1985 and 1990. By removing phos- phorus from detergents, lawmakers were able to substantially reduce the amount of phosphorus entering wastewater treatment plants and, consequently, reduce the amount of phosphorus flowing from these plants into the Bay. Additional gains have resulted from some sewage treatment plants, 65 out of the 288 major treatment plants, implement- ing biological nutrient removal (BNR) technologies. Unlike previous sewage treatment practices that concentrated primarily on removing or- ganic content from wastewater, BNR technologies enable sewage treat- ment plants to reduce nutrients, in addition to organic matter.
While BNR technologies hold a great deal of promise for the Bay, reducing nitrogen effluence from roughly 18 milligrams per liter to as low as 3 milligrams per liter, the cost of these upgrades has made sewage treatment facilities slow to adopt biological nutrient re- moval systems. Among the sewage treatment facilities that imple- mented BNR technologies in the region, not one facility implements the most advanced technologies that reduce nitrogen effluence to the lowest possible level-that is, 3 milligrams per liter. Typical BNR sys- tems in the Bay result in nitrogen effluence levels of about 6 mil- ligrams per liter, twice as high as what the best technology can pro- vide.2s The Bay states have derived even fewer results from advances in septic system technology, which can also substantially reduce the amount of nutrients that enter the Bay as a consequence of human waste. The increased cost of efficient septic systems and the fact that not one of the Bay states requires the implementation of efficient sys- tems has resulted in very few homeowners voluntarily adopting this technology.
Addressing nonpoint sources of nutrients, in general, has proved to be even more difficult than tackling point sources. The intensification of farming practices; the widespread use of fertilizers for residential use; the loss to development of natural buffers and wetlands; the paving of roads and urban areas; the increased number of cars on the road; and the substantial political clout that developers, realtors, car manufactur- ers, utility companies, and agricultural interests possess in the Bay states make achieving meaningful reductions from nonpoint sources of nutri- ents particularly difficult. While technologies exist to address each of
6 2
Nutrient Reduction Efforts in the Bay Watershed
these sources of nutrients, implementation often comes with a heavy price to government and the general public.
One of the most promising ways to reduce nonpoint source nutri- ent loading comes from agricultural best management practices (BMPs). The basic logic behind the practices is fairly straightforward. They aim to produce environmental gains by reducing the amount of nutrient-rich fertilizers applied to crops to the absolute minimum that is necessary to produce healthy crops. Moreover, they limit the amount of nutrients that leave agricultural areas by creating vegetation and forest buffers, using conservation tillage, and installing manure storage structures and manure runoff controls. Chapter 4 explores the political forces that tend to work against this and other nutrient-wise public policies.
THE SCORECARD: MEASURING NUTRIENT REDUCTION “SUCCESS”
Accurately estimating trends in the amount of nutrients entering the Chesapeake Bay poses immense challenges to researchers and resource managers. Nutrients enter the Bay from countless sources throughout the 64,000-square-mile area that comprises the Bay’s watershed and the 418,000-square-mile area that makes up the Bay’s “air shed.”26 The size of the area and the number of sources contributing nutrients to the Bay make monitoring based on the direct observation of nutrient inputs im- possible. Consequently, researchers rely on two different measuring techniques: (1) monitoring based on samples collected from the Bay’s tributaries and mainstem and (2) estimates derived from computer mod- els to approximate the amount of nutrients entering the Bay.
Beyond the sheer size of the region, the artificial distinction be- tween the “controllable” and “noncontrollable” nutrients that the Chesapeake Bay Program made between 1987 and 2000 significantly complicated calculating nutrient loads. Ostensibly, nutrient managers made this distinction so that the restoration program would be evalu- ated based on factors that are within human control. The basic idea is that it would be unreasonable to assess nutrient reduction efforts based on factors that are beyond human influence. Consequently, the Bay Pro- gram has relied heavily on computer models that estimate the amount of nutrients entering the Bay, excluding nutrients that come from un- controllable sources. Nutrients that enter the Bay naturally from forests,
6 3
1 CHAPTER 3
nutrients that enter the Bay from the atmosphere, and nutrients derived from states that are not signatories of the Bay Agreement (i.e., West Vir- ginia, New York, and Delaware) were classified as un~ont ro l lab le .~~
While the desire to distinguish between controllable and uncontrol- lable nutrient sources is understandable, adopting this approach raises several controversies. Most important, the 1987 task force that arrived at the 40 percent nutrient reduction goal for restoring the Chesapeake Bay’s water quality did not distinguish between controllable and uncontrollable sources of nutrients. That task force estimated that a 40 percent reduction in the total amount of nutrients entering the Bay was the minimum re- duction necessary to bring about the desired improvements to the Bay’s living resources. Based on the findings of the task force, the 1987 Bay Agreement also made no distinction between controllable and uncontrol- lable nutrients, setting as its primary goal to “achieve by the year 2000 at least a 40 percent reduction of nitrogen and phosphorus entering the main stem of the Chesapeake Bay.” Despite the call for at least a 40 percent re- duction of all the nitrogen and phosphorus polluting the Bay, the Chesa- peake Bay Program and its restoration partners interpreted the 1987 goal as merely reducing 40 percent of “controllable” nutrients.28 As a conse- quence, had reduction efforts been “successful,” they would have only re- duced the amount of nitrogen entering the Bay by about 25 percent and the amount of phosphorus by 22 percent and would have failed to achieve the desired environmental impact.29
It should also be noted that many of the factors identified by the Bay Program as uncontrollable between years 1987 and 2000 are in fact well within human control. For example, nitrogen loading from the at- mosphere, which was until recently classified as an uncontrollable nu- trient source by the Chesapeake Bay Program, a nutrient source known to account for roughly a quarter of the nitrogen entering the Bay, is pri- marily the result of controllable human activities (i.e., a by-product of combustion engines).30 Similarly, it has been misleading to classify nu- trients entering from states that are nonsignatories of the Bay Agree- ment as uncontrollable. While nutrient loading from these states might be less controlled than from states that have signed the agreement, they are no less controllable in a scientific sense and their effects are no less deleterious to the Bay.
Another consequence of distinguishing between controllable and uncontrollable nutrients is that it has led to the heavy reliance on com- puter models (statistically derived estimations), rather than direct mon-
t B
6 4
Nutrient Reduction Efforts in the Bay Watershed
itoring to assess the success of restoration programs. The computer models can be thought of as a complex accounting system in which the 64,000-square-mile watershed is broken down into smaller subwater- sheds. Each of the smaller watersheds is then further broken down into land usage types (e.g., forested, urban, pasture, cropland, residential land, and so Computer models estimate the amount of nutrients entering the Bay by combining land usage data from across the water- shed with estimations of the amount of nutrients that typically come from each land usage type.32 The models have appeal to Bay managers because they allow for predictions of how a change in land use (e.g., placing a certain amount of agricultural land under BMPs) might reduce nutrient loading to the Bay. Models also allow for noncontrollable nu- trient sources to be removed from consideration.
Several problems are associated with relying extensively on computer-based estimations rather than monitoring. At the very least, the numerous assumptions built into the computer models may limit the validity of the findings,33 That is, each assumption within the model carries with it a degree of uncertainty (i.e., error), regardless of the sophistication of the model. When layer upon layer of as- sumptions are built into highly complex statistical models, even small errors can substantially alter the findings. The practice is as prob- lematic as trying to predict weather conditions or economic condi- tions a year in advance. While our understanding of these issues might lead to computer models that give us some insights into future conditions, the complexity of these phenomena assure that computer estimations never fully capture the processes. The combined result of applying several layers of assumptions is that at the end of the day a computer model may only roughly measure the concept in question.
Environmental scientists have begun to grow wary of the Bay Pro- gram’s heavy reliance on computer modeling. President of the Univer- sity of Maryland Center for Environmental Science, Dr. Don Boesch, ex- plains that the Bay Program’s models “have been relatively isolated from the kind of ongoing scientific criticism and evaluation that could make them more effective.” Boesch and other scientists have argued that modeling and monitoring are most valuable when they are well inte- grated. He argues, “One of the problems with the Chesapeake Bay Pro- gram is that they have not been [integrated]. The environment is so complex you need to make observations, and you need to be prepared by surprises and learn from them.”34
6 5

CHAPTER 3 I
The ultimate threat of distinguishing between controllable and noncontrollable nutrients and relying on computer estimations rather than direct monitoring is that it can lead to misleading findings. Mike Hirshfield, vice president of resource protection at the Chesapeake Bay Foundation from 1996 to 2001, has expressed concern that the opti- mistic assumptions built into the Chesapeake Bay Program’s computer models have substantially overestimated the amount of nutrients being reduced from nonpoint sources.3s Dr. Tom Simpson (2002), the chair of the Bay Program’s Nutrient Subcommittee, acknowledges that the mod- els “assume complete implementation and perfect maintenance” of nu- trient control practices, virtually guaranteeing that the models overesti- mate nutrient reduction efforts.
Reliance on models allowed the Bay Program to report from 1997 through early 2000 that the Bay states were on track to achieve the 40 percent reduction goal set in 1987 for phosphorus and that they were close to meeting the goal for nitrogen, a claim that was echoed through- out the media.36 This encouraging news led many people to incorrectly assume that approximately 40 percent less nutrients were entering the Bay in the year 2000 than entered the Bay in 1985. Since approximately half of the Bay’s nitrogen and phosphorus had been deemed uncontrol- lable, the actual reduction in nutrients entering the Bay was far less than 40 percent. In fact, the Bay Program now concedes that it failed to achieve even its modified reduction goals for controllable nutrients. By its own computer estimates, the Bay Program fell 2.3 million pounds per year short of its goal for controllable phosphorus and 24 million pounds per year shy of its controllable nitrogen goal.37
The U.S. Geological Survey (USGS) of nutrient trends for the Chesapeake Bay (198S-1999), trends that are based on direct monitor- ing rather than computer estimates, reveals even less optimistic findings than those presented by the Bay Program. The U.S. Geological Survey analyzes nutrient trends from thirty-one locations throughout the Bay watershed and reports trends for both total nitrogen and total phos- phorus. The USGS study found that between 1985 and 1999 there was no significant reduction in the total nitrogen and total phosphorus loads at the majority of the thirty-one sites tested. For nitrogen, there was no significant change at 27 of the sites, while 2 sites measured a significant decrease,38 and 2 sites measured a significant increase.39 For phospho- rus, there was no significant change at 25 of the 31 sites, with signifi- cant reductions at 5 sites,40 and a significant increase at 1 site.41
6”
i
Nutrient Reduction Efforts in the Bay Watershed
It is important to note that stream flow rates, which are known to be positively related to nutrient did not generally experience upward trends at most of the monitored USGS sites during this period- only 4 of the 31 sights had significant flow increases from 1985 to 1999, with only 1 of the sites recording a significant increase in its nutrient load as well as a significant increase in flow rate.43 Therefore, the gen- eral lack of nutrient reductions and the increases in nutrient loads at the identified sites cannot be explained away as the consequence of natu- rally occurring increases in river flows over this period of time, since for the most part there were no significant upward trends in river flows be- tween 1985 and 1999.44 Dr. Hirshfield (2002) explains, “If there was a significant increase in flow, then you would definitely have to take that into account. If there is just a lot of noise in the flow, then for the nu- trient to be reduced to an amount that might actually make a difference in the Bay, it ought to be able to overcome that noise.”
Given the difficulties of estimating nutrient loading in the Bay and its tributaries, it is worthwhile to explore alternative means for assess- ing trends in the Bay’s nutrient loads. Karlsen et al. (2000) published an innovative study that helps illuminate the historical effects of nutrient loads in the Bay. Karlsen and his colleagues used biological records taken from sediment cores in the Bay to track the effects of oxygen de- pletion, one of the most harmful consequences of nutrient loading. From the core samples, they found evidence that oxygen depletion spiked during the 1970s and has not substantially declined since this pe- r i ~ d . ~ ~ Similar sediment core studies (Cooper and Brush 1991; Cooper 1995) add further weight to the argument that nutrient loading trends, at least the deleterious effects from nutrient loading, has not signifi- cantly changed in recent years. Moreover, the abundance of underwater grasses, the living resource that first led researchers to question the long- term effects of nutrient loading in the Bay, has not rebounded in recent years, as would be expected if water quality had improved throughout the Bay.46
CONCLUSION
While the exact level of nutrient loading in the Chesapeake Bay can be de- bated indefinitely, the fact remains that the overall effort to improve the water quality of the Bay, so as to achieve a corresponding improvement in
6 7

CHAPTER 3
the abundance of the Bay’s living resources, has not succee6ed. Nutrient re- duction efforts remain a means to an unrealized end-the improvement of the life-supporting ability of the Bay. This chapter suggests that scientific research has clearly identified the problem and has produced innovations that could reduce the problem if more fully implemented, The issue today does not represent a scientific problem, but a political problem. That is, how to persuade industry leaders, policymakers, and average citizens to adopt difficult and potentially costly public policy choices so that the Bay may in fact improve. The following chapter of this study investigates the political forces that work to constrain environmental success.

CHAPTER 4
consumption of oysters contaminated by human wastea2 Typhoid out- breaks in Chicago, New York, and Washington during thewinter of 1924, which killed 150 people, further increased public concerns over the long-term consequences of flushing untreated waste into bodies of water like the Chesapeake Bay.3
More than a century has passed since scientists began reporting the human health and environmental dangers associated with human waste, and the Bay is perhaps further from solving its nutrient management problems today than it was a century Major headlines in 2002 tell of massive sewage leaks and spills in the Baltimore area (i.e., Jones Falls, Gwynns Falls, and Herring Run) and along tributaries of the Potomac, resulting in the release of over five million gallons of untreated waste into the Bay and its t r ibutar ie~.~ As many of the area’s major sewage treatment systems grow outdated and inefficient, these sewage spills have become regular occurrences in many parts of the watershed.
Today, nutrient management entails far more than simply treating human waste in a manner that does not foul the water and cause human illness, though these issues remain pressing concerns. Modern nutrient management entails nothing less than changing the way we live our lives, the way we develop the land, and the basic manner in which we interact with our surroundings. Modern nutrient management is multi- faceted and includes diverse considerations such as enforcing phosphate detergent bans, applying biological nutrient removal technology to sewage treatment, updating septic systems, increasing emission control technologies for cars and utility companies, developing animal waste en- zyme technologies, curbing urban growth, promoting public trans- portation, improving storm water runoff systems, protecting natural forest buffers, and implementing agricultural best management prac- tices (BMPs).~ It is a massive, high-stakes undertaking that will, more than any other factor, determine the environmental health of the Chesa- peake Bay and its tributaries in the years to come.
In this limited study, a comprehensive exploration of the politics of nutrient reduction, with its multiple facets, is impractical. Instead, this chapter focuses on the politics of controlling one key aspect of nutrient pollution-that is, the politics of environmental regulations for agricul- tural production. The study gives special attention to the agricultural policies of Maryland and Pennsylvania, since these two states are widely considered leaders in agricultural nutrient management among the Bay states. Exploring nutrient management through the study’s theoretical
The Political Fight for Nutrient Management Policy
lens reveals how economic considerations, the nation’s fragmented po- litical structure, interest group competition, and focusing events play important roles in the politics of agricultural management.
AGRICULTURAL NUTRIENT LOADING
The harm of agricultural pollutants to the Chesapeake Bay has been well established. The Environmental Protection Agency’s original seven- year study of the Chesapeake Bay ecosystem concluded that nonpoint source nutrient loading, much of which has been linked to agricultural production, was among the chief factors responsible for the Bay’s dete- r i ~ r a t i o n . ~ More recent studies have reinforced this finding, estimating that nonpoint sources of nutrients contribute as much as 68 percent of the phosphorus and 77 percent of the nitrogen entering the Bay.8 While nonpoint sources of nutrients enter the Bay in numerous ways, not just from agriculture, agricultural runoff from cropland, pastureland, and animal waste has been identified as the single largest source of these pol- lutants. The Chesapeake Bay Program estimates that 58 percent of the nonpoint source nitrogen and 82 percent of the nonpoint source phos- phorus that pollutes the Bay are the by-products of agriculture produc- t i ~ n . ~ This level of nutrient loading is even more remarkable consider- ing that agricultural land comprises only 29 percent of the Chesapeake Bay drainage basin.1°
Farm production, absent of menacing pipes and unsightly smoke- stacks, has been described as the Bay’s silent killer. Behind its bucolic veil, modern farming practices utilize immense quantities of fertilizer and produce massive amounts of animal waste, doing more harm to the Chesapeake Bay than any other factor. In some of the watershed’s most beautiful areas, such as Pennsylvania’s Lancaster County, Virginia’s Shenandoah Valley, and Maryland’s Eastern Shore, large animal opera- tions produce enormous amounts of nutrients that pollute the Bay. One study estimated that Lancaster County alone produces as much as 5 mil- lion tons (i.e., 10 billion pounds) of animal waste per year.ll These agri- culturally intense areas, with their relatively small human populations, produce as much biological waste from their livestock as humans pro- duce in midsized cities.
Unlike human waste, however, there are no sewage treatment plants to control and mitigate the environmental impact of poultry,
7 1

CHAPTER 4
dairy, and swine production. Animal manure has traditionally been ap- plied to cropland as a natural fertilizer, returning to the soil essential nu- trients that are removed with each harvest. As animal production has in- tensified and cropland has been lost to development, the amount of natural fertilizer produced from animal production has come to surpass the fertilizer needs of many areas in the watershed. The region’s animal waste surplus creates a strong incentive for farmers to overfertilize their crops. Since fertilizer needs are linked to weather conditions that cannot be accurately predicted, the precise fertilizer requirements of a crop are uncertain. With fertilizer costs relatively low, the natural tendency is to overestimate the fertilizer needs of a crop and, consequently, to overfer- tilize fields. The excess nutrients that result from overfertilization even- tually find their way to the Bay either as cropland runoff or through groundwater.
Nutrient loading from agriculture poses a daunting challenge to the Chesapeake Bay restoration effort. It has been estimated that agri- cultural waste is responsible for more of the Bay’s phosphorus and ni- trogen load than the combined nutrient loads from urban runoff, all point sources, septic systems, and the atmosphere-contributing more than 110 million pounds of nitrogen and 9 million pounds of phospho- rus to the Bay per year. In comparison, the estimated annual nutrient load from all point sources, industrial sources and sewage treatment plants included, is about 60 million pounds of nitrogen and 4.4 million pounds of phosphorus.12 It is now clear that unless the problem of agri- cultural waste is adequately addressed, the overall effort to restore the Bay is unlikely to succeed.
While the amount of pollution produced from modern agricultural practices is considerable, it is by no means uncontrollable. Table 4.1 outlines several innovative agricultural best management practices (BMPs) that could, if fully implemented, substantially reduce the nega- tive impact of agricultural production. The logic behind each of these practices is fairly straightforward. Each of the agricultural BMPs is de- signed to reduce the negative impact of agricultural runoff by either lim- iting the amount of nutrients that are applied to agricultural lands (e.g., fertilizer management practices) or by creating storage, buffering, and filtering systems that minimize the amount of nutrients that move from agricultural land to the Chesapeake Bay and its tributaries. Another ap- proach that is being explored is the use of animal waste as fuel for the production of electricity, which could potentially eliminate large quan-
72
The Political Fight for Nutrient Management Policy
tities of nutrients, provide the region with a renewable energy source, and help to correct fertilizer prices.
In a 1995 report, the Chesapeake Bay Program estimated that imple- menting environmentally wise farm management practices could eliminate 38 million pounds of nitrogen from entering the Bay each year.13 A more ecent analysis completed by the Chesapeake Bay Program estimated that lly implementing environmentally sound agricultural management prac-
ices could remove as much as 100 million pounds of nitrogen from enter- g the Bay per year.14 In other words, agricultural BMPs could reduce ore than a third of the annual nonpoint source nitrogen entering the Bay
and would have the equivalent impact of eliminating the Bay’s entire point source nutrient load. lS Given the amount of nutrients entering the Bay as
Table 4.1. Common Agricultural Best Management Practices (BMPs)
Maintain a strip of forests along rivers and streams to filter nutrients.
Maintain a strip of grass along rivers and streams to filter nutrients.
Plant small grain plants without fertilizer in September and early October on land otherwise fallow. The practice reduces nitrate leaching and erosion.
Seed crops directly into vegetation cover or crop residue so as to minimize soil disturbance, erosion, and nutrient loss to surrounding bodies of water.
Tilling soil perpendicular to the slope of the land or creating terraces so as to reduce soil and nutrient loss.
Implement plans that manage the amount, timing, and placement of fertilizer and animal waste on crops.
Remove from production lands that are highly susceptible to erosion due to geographic conditions.
Restrict livestock access to streams and rivers by fencing or creating water troughs away from streams to limit nutrient loading associated with livestock waste.
Implement systems for handling and storing waste generated by confined animals (Le., livestock and poultry), such as storage lagoons, ponds, or tanks.
rtilizer Management Plans
etirement of Erodible Land
tream Protection with Fencing
mal Waste Systems
ources: Reproduced by author from Maryland Nutrient Cap Workgroup (2001, 20) and EPA (1988b,
7 3

CHAPTER 4
a consequence of agricultural production and the sizeable reductions that agricultural BMPs promise, many of the Bay’s strongest advocates have been fighting for agricultural reforms for over two decades.
Unfortunately, there remains a wide gap between the potential benefits and the realized benefits from agricultural reform. For example, while there are nearly twelve million acres of cropland and pastureland in the Chesapeake basin,16 agricultural management plans have only been developed for 35 percent of the Bay’s agricultural land,17 and the plans have been fully implemented for an even smaller portion of the Bay’s agricultural land. The Chesapeake Bay Program estimates that nearly 70 percent of the Bay’s agricultural nitrogen load could be elim- inated through best management practices, though generous estimates put the annual nitrogen reduction from agriculture sources since 1985 at about 23 percent.’* Policymakers throughout the watershed have re- lied heavily on voluntary educational programs and limited financial in- ducements to persuade farmers to adopt Bay-friendly farming practices. While this approach has led to the voluntary adoption of some envi- ronmentally wise agricultural practices, it has failed to bring about the far-reaching nutrient reductions that agricultural BMPs promise and that are necessary for the restoration of the Chesapeake Bay.
The question remains, given the known environmental problems associated with agricultural runoff and the known benefits that could be achieved by more fully implementing environmentally friendly farming techniques, why does agricultural production throughout the watershed remain a relatively unregulated industry that adds more pollutants to the Chesapeake Bay than any other source? To address this issue we must investigate the political forces that have led to the existing agri- cultural regulations, or in this case, lack of enforceable regulations. The following section outlines the fight for agricultural regulations in Penn- sylvania and Maryland. The chapter concludes by exploring the issue through the study’s theoretical lens.
POLITICAL BACKGROUND: THE FIGHT FOR ENFORCEABLE AGRICULTURAL REGULATIONS
IN MARYLAND AND PENNSYLVANIA
Recognizing the negative impact of modern agricultural practices, the Chesapeake Bay Commission’s first annual report, in 1981, “attrib-
7 4
The Political Fight for Nutrient Management P o k y
ed most of the [Bay’s] nitrogen from agricultural runoff” (D-13). kewise, when the EPA released the results of its seven-year study of e Chesapeake Bay in 1983, it specifically identified agricultural
as a primary factor responsible for the Bay’s decline. Neither was particularly surprising to the scientific community, which
come to recognize the environmental hazards associated with odern agricultural practices, Section 208 of the Clean Water Act,
sed in the early 1970s, recognized the impact of agriculture and re- red all states to identify sources of nutrient pollutants, including icultural sources, and to develop strategies for addressing these
Even with the Clean Water Act’s federal requirements for states develop Section 208 plans and an extensive body of scientific evi- nce suggesting that nutrient waste from agriculture has caused se-
ous harm to the Bay, Maryland and other Bay states have resisted ningful agricultural nutrient restrictions and have
ad relied on educational outreach programs and underfunded rnment cost-share programs to entice farmers to voluntarily
pt nutrient management practices.20 By the early 1980s, both Vir- a and Maryland had Section 208 plans on the books, but neither
ate required nutrient management plans for agricultural producers, d neither state allocated substantial funding for environmental st-sharing programs or other agricultural programs intended to
Maryland took the early lead in pushing for environmentally wise agricultural practices in 1987 when the state’s governor, William Schae- fer, and state’s secretary of agriculture, Wayne Cawley, set the ambitious goals of having all Maryland farmers voluntarily develop management plans within a decade and for every farm within a priority area to adopt plans within five years.22 That same year, the governors of Maryland, Virginia, Pennsylvania, the mayor of the District of Columbia, the head of the EPA, and the director of the Chesapeake Bay Commission signed the 1987 Chesapeake Bay Agreement that set the even more ambitious goal of reducing by at least 40 percent the controllable nutrients enter- ing the Bay by 2000. The general assumption that guided this Agree- ment and that fueled much of the Bay restoration effort since the early 1980s was that research, moral suasion, and education, combined with modest government support, would be sufficient to bring about the de- sired outcomes.
75

CHAPTER 4 The Political Fight for Nutrient Management Policy
Unfortunately, without mandatory nutrient regulations in ssage of the 1993 legislation did not end the debate regarding for agriculture and sufficient funding for technical assistance and ory agriculture management plans for Pennsylvania’s agricul- share programs, the goals outlined in the various agreements have dustry. Republicans regained control of the General Assembly sistently come up short.23 As early as 1985, the Chesapeake Bay Co e governor’s office in 1994 and were able to delay the promul- mission publicly questioned whether voluntary agricultural progra of agricultural regulations until 1997, two years after the dead- alone could succeed in bringing about the desired large-scale red established by the 1993 law. Not only were farming interests able in nonpoint source nutrients needed for Bay r e ~ t o r a t i o n . ~ ~ By 1 tall implementation of the law, they were able to greatly influence Chesapeake Bay Non-Point Source Program Evaluation Panel regulations that eventually emerged. The regulations that were is- a broad-based independent panel convened by the EPA, concluded tha ed in 1997 only applied to high-density animal operatlons that com- the Bay Program’s nutrient reduction goals were unlikely to be me ise somewhere between 5 and 10 percent of Pennsylvania farms and through voluntary nonpoint source programs. The panel conclude ided loopholes that further weakened the law. Farm organizations that the states and federal government should “augment voluntary pro diluted the regulations to the point that former supporters of the grams with increased use of regulatory authority for the reduction o 3 legislation, groups like the Chesapeake Bay Foundation, were nutrient loadings” (7). That same year, a select committee convened rced to publicly criticize the regulations and to question whether the Governor Bob Casey of Pennsylvania concluded that regulatory m as interpreted by the commission, would help to meaningfully con- sures were necessary for agriculture if the state was to meet its nutrien Pennsylvania’s decade- management goals.25 These sentiments were reinforced in 1991 whe ng push for the implementation of mandatory nutrient management the Chesapeake Bay Commission reported that the amount of nitroge ans for its farming community has yet to be realized for the majority in the main stem of the Chesapeake Bay, much of which was com from agriculture, had actually increased by 2 percent since 1985. In 1992, Maryland State Senator Gerald Winegrad, a strong advo- nally, in 1991, the Chesapeake Bay Commission publicly endor cate for the Bay, introduced legislation to the Maryland General As- mandatory agricultural regulation as one means of addressing nutrient sembly that would have required Maryland farmers to implement best loading. management practices by no later than 2000. Facing even stronger op-
After two years of internal debate and an extensive analysis by position within the farming community than was the case in Pennsylva- Governor Casey’s select committee, Pennsylvania became the first Bay nia, the legislative push to move to mandatory farm management plans state to introduce legislation mandating agricultural management plans in Maryland was defeated in the 1992, 1993, and 1994 legislative ses- for its farmers (House Bill 496) during its 1991-1992 legislative ses- sions. Had it not been for the 1997 Pfiesteriu outbreak that shocked the
With strong opposition from farm organizations, agribusinesses, state into action, mandatory BMP legislation may not have been con- and Republicans who controlled the state senate at the time, the legisla- sidered again in Maryland. tion was killed during the 1991-1992 session. After Democrats took Following the Pfiesteriu outbreak, the 1998 Maryland legisla- control of the Pennsylvania Senate in 1992, establishing control of both tive assembly managed to produce a bill that melded an industry- chambers, a compromise version of the legislation was passed in 1993 friendly bill, introduced by Ron Guns, the conservative chairman of (House Bill 100) that called on the state Conservation Commission, the House Environmental Matters Committee,28 with a stronger en- guided by a Nutrient Management Advisory Board, to draft agricultural vironmental bill supported by Governor Parris Glendening and State management regulations within two years (by 1995). The law also Senator Brian Frosh. The law that emerged was widely touted as the called for farmers to develop nutrient management plans within one most comprehensive agricultural nutrient management legislation in year of the regulations (by 1996) and for farm operations to implement the country. The 1998 Water Quality Improvement Act gave Mary- nutrient plans, with state assistance, within three years of submitting land farmers until the end of 2001 to develop mandatory nitrogen plans (by 1999). management plans and required that they comply with the plans by
7 6 7 7
rol agricultural nutrient loads from the

CHAPTER 4 The Political f ight for Nutrient Management Policy
the end of 2002. Unlike the Pennsylvania law, which applied to on1 a small number of large farm operations, the Maryland law applie to all but the smallest farm operations in the law established sizeable penalties for noncompliance that would applied following a warning period.
it, has had little impact on farm management practices. At the begi of 2002, some thirty years after passage of the federal Clean Water fifteen years after Maryland Governor Schaefer set his goal for co vation plans, three years after the Maryland General Assembly its much-touted Water Quality Improvement Act, and after the d for nitrogen management plans had come and gone, data from t Maryland Department of Agriculture showed that only 20 percent o Maryland’s 1.7 million acres of farmland were under nutrient ment plans. Only 2,152 of the more than 7,000 farm operations in Maryland had submitted nutrient management plans. Nearly three thousand farm operations had filed delay forms, and the remainder of farm operations had not filed any of the required forms. Quite simply, the majority of farm operations had either ignored the law or grown frustrated with Maryland’s agricultural bureaucracy, which remains in- adequate to meet its growing responsibilities. The fight for meaningful agricultural reform continues.
Moreover, t
Unfortunately, the Maryland law, like the Pennsylvania law befo
CONOMIC PRIMACY AND AGRICULTURAL POLICY FOR THE BAY
or the three signatory states of the Bay Agreements, Maryland, Virginia, ylvania, the agricultural industry remains a powerful economic
ENVIRONMENTAL THEORY TOWARD A DEEPER UNDERSTANDING OF THE AGRICULTURAL REGULATION FIGHT
In both Maryland and Pennsylvania, well-intentioned advocates, from within and outside of government, have worked hard to pass agricul- tural regulations for the Bay. Even with a scientific consensus regard- ing the impact of agriculture and with the general public strongly sup- porting policy for the Bay, neither state has come close to successfully addressing its agricultural problems. The following analysis helps to explain why agricultural reform has proved to be such a difficult po- litical problem. Here we apply the study’s theory (figure 4.1) and see how economic factors, interest group opposition, and intergovernmen- tal competition can coalesce to stifle agricultural regulation, and how events within the policy cycle create fleeting opportunities for policy in-
o make Pennsylvania the fourth largest milk-producing state in tion. Agriculture production and its related industries form a
7 9

CHAPTER 4 The Political Fight for Nutrient Management Policy
For the agricultural industry, nutrient management regulations a first and foremost a financial issue. While some advocates of agric tural reform suggest that environmentally sensitive agricultural pra tices might be achieved at little or no expense to agribusiness, the re1 tance within the farming industry to voluntarily adopt such practi suggests that the farming community does not generally agree. A stu completed by Penn State researchers in the late 1980s supports this lief, estimating that fully adopting the environmental management pr tices of the day would likely cost a typical dairy farm 20 percent of income.32 A more recent study conducted by the Environmental Pr tion Agency’s Chesapeake Bay Program in 1995 estimated that it w likely cost around $372 million for agriculture to implement nonp source nutrient controls across the watershed.33
These relatively low estimates do not generally represent one-ti expenses. Many of the costs of environmentally friendly farm practic such as low tillage, cover crops, and fertilizer reductions, accrue ann ally. Likewise, other controls, like farm plans and animal waste co trols, must be updated on a regular basis. And promising new a proaches that were not considered in earlier studies, such as “yie reserve” practices that provide insurance to farmers who reduce fert izer application and “manure-to-power’’ programs that turn ani waste into electricity, could substantially increase the annual cost agricultural controls.
The economic impact of agricultural nutrient controls complica the politics of nutrient reduction, forcing state officials to weigh the p tential benefits of environmental reforms against the known cost of su measures. As discussed earlier, the regulatory approach, which puts t financial burden directly on the agricultural industry, has political1 been the most difficult course of action. This approach calls on politic actors, many representing rural areas and almost all having agricultural interests among their constituents, to place financial burdens on what might be the leading industry and primary employer in their district Aware of the potential political fallout from such action, none of t Bay states have effectively pursued this course of action.
The alternative approach is to provide financial inducements farmers to voluntarily adopt nutrient reduction controls. While e state has been willing to commit modest amounts of public funds to courage environmentally sensitive agricultural practices, and the fa ing community has generally proved willing to implement such
if given sufficient funding, none of the Bay states have been able ster sufficient resources to bring about the widespread implemen- of nutrient controls called for under the Bay Agreements through
ncial inducements alone. In the fiercely competitive world of budgetary politics, funding
cultural programs has a political cost of its own, though perhaps a r cost than pursuing agricultural regulations. Pursuing financial in- ments requires elected officials to appropriate limited public funds ricultural producers-many of which are major corporations or ctors of major corporations. Since the available funds are limited, bsidy inevitably comes at the expense of other government ser-
which are often deemed more essential than agricultural subsidies. over, it is not surprising that during periods of economic down- , which are often felt deepest at the state level, states tend to cut k money allocated to agricultural programs in order to protect more ular government programs.
THE INTEREST GROUP IMBALANCE AND AGRICULTURAL POLICY FOR THE BAY
interest group imbalance between the groups that represent the agri- ural industry and environmental groups is clearly evident in the Bay . As Olson and others would predict (see chapter 2), the Chesa-
e Bay Foundation and the other pro-environment groups in the area, their broad environmental agenda and pursuit of public goods, sim-
cannot compete with the political machinery that comprises the business lobby in the Bay states. The area’s agricultural interests are ented by a large network of well-financed interest groups, which are
ively involved in every aspect of the political process. Chief among these groups is the American Farm Bureau, which has
wn from its modest beginnings in 1919 into a massive organization t boasts the membership of over five million members nationwide.
Farm Bureau maintains a team of registered lobbyists at the federal 1, as well as an active lobbying presence in its state affiliates, includ- each of the Bay states. The Maryland Farm Bureau alone has a full- government relations staff comparable to the entire lobbying arm of
Chesapeake Bay Foundation, which represents a broad spectrum of ironmental issues across six states and within the federal government.
81 P ?

The Political Fight for Nutrient Management Policy
resents one aspect of the interest group imbalance between agricultural and environmental groups. The agricultural industry as a whole also employs a larger number of professional lobbyists and spends more on public relations efforts than environmental groups in the area. The Maryland Farm Bureau alone reported spending more than $64,000 in lobbying expenses in the year 2000.37 All told, the agricultural indus- try’s large population base, robust financial backing, and willingness to engage in the political process combine to make it a powerful political
While there exists a substantial disparity between agricultural and environmental groups, these figures do not suggest that environmental groups are entirely excluded from the debate over agricultural reform. On the contrary, environmental groups actively testify at public hear- ings and before the various general assemblies, often at rates greater than their industry counterparts. Moreover, they engage in traditional lobbying activities such as coalition building, grassroots mobilization, education of elected officials, and assistance of environmentally friendly fficials. Nevertheless, its political naiveti? and reluctance to actively articipate in electoral politics ensures that the environmental commu- ity enters the process as an outsider, trying to achieve through the
strength of its argument what industry advocates have already gained hrough more aggressive techniques.
CHAPTER 4
Unlike the Chesapeake Bay Foundation, the Maryland, Virginia, an Pennsylvania Farm Bureaus each operate active political action commit tees (PACs), which make financial contributions to political candidates The Virginia Farm Bureau also publicly endorses political candidates, level of political activity that the Chesapeake Bay Foundation and man other environmental groups have avoided.
Beyond the farm bureaus, there are a host of industry-sp groups that fight to protect farmers from costly environmental re tions. In Maryland alone, more than a dozen agricultural associ have come together to create a formidable coalition that has dubb self “The Coalition to Improve Nutrient Management.” Mem groups in this coalition include Maryland Farm Bureau, Mary1 Grain Producers Association, Maryland Pork Producers Associat Delmarva Poultry Industry, Maryland Nursery and Landscape Associa tion, Maryland State Grange, Maryland Dairy Industry Association, As sociation of Soil Conservation Districts, Delaware-Maryland Agribusi- ness Association, Maryland Cattlemen’s Association, and Marylan Sheep Breeders A~socia t ion .~~ Beyond the efforts of the coalition, man of these groups maintain government relations staffs of their own an contribute to political campaigns through political action committee further augmenting the influence of the agricultural industry.
An important political force within the agricultural commun that is often overlooked is the influence of individual farming famili Unlike typical family farmers who generally shun politics, the farmin dynasties behind major agricultural operations such as the Tyson F Perdue Farms, and Allen Family Foods are often active political at the state and local levels. For example, a single agricultural fami
e Bay’s agricultural industry has long benefited from the competitive Perdue family, spent more in one recent election cycle in SUPP
rces that are fostered by the nation’s fragmented political structure. At Maryland candidates than the combined spending of all environ e state level, competition to attract and satisfy agricultural giants, groups across the three key Bay states during the same period.3s ch as Tyson and Perdue, causes states to think twice before enacting lies like Perdue offer sizeable aggregate contributions by dividin rient regulations that may repel these powerful interests. Large poul- contributions among multiple family members and contributing t~ s
producers and processors maintain operations in several states and era1 candidates. These families can also exert influence on the politi e not tied by necessity to a particular state or region, allowing them process in less public ways, such as hosting fund-raisers for polit’ choose areas that provide a pro-industry climate and to move from candidates or making contributions to industry associations.
eas where regulations become too costly. Companies like Tyson Foods According to the National Institute on Money in State Pol (2OO2), agricultural interests in Maryland, Pennsylvania, and Virgi ract out local farmers to produce the bulk of its chickens, rather
operating its own livestock operations. Tyson supplies the animals outspent environmental groups in recent elections $910,000 feed and relies on local farmers to provide the necessary labor and $7,000.36 Moreover, it is important to note that the disparity only r
8 2 8 3
DIVIDED GOVERNMENT AND AGRICULTURAL POLICY FOR THE BAY

CHAPTER 4 The Political Fight for Nutrient Management Policy
an mandatory regulations. It was not until a decade later, in a political ate that had grown considerably less friendly for environmental regu-
nd after the voluntary approach had proved ineffective at produc- spread agricultural changes, that the political push for mandatory
cultural regulations began to take shape. By this time the restoration rt had moved into its “post-problem stage,” a realm defined by lower
pectations and sporadic public attention, where periodic events, not ughtful planning, tend to fuel environmental public policy.
It was precisely such a focusing event that enabled advocates for farm ulations to temporarily gain the upper hand and win passage of manda-
riculture regulations for the state of Maryland in 1998. As discussed an area of intense agricultural production along Maryland’s East-
hore experienced widespread fish kills that attracted intense media at- n in 1997. On August 6 and again on August 26, 1997, two sub-
ntial fish kills were reported in the Pocomoke area, the latest in a series 11s that had been reported throughout the summer. Crews from Mary- s Department of Natural Resources and Department of the Environ-
ent collected samples at the sites and concluded that the kills were related toxic levels of Pfiesterza, an algae form associated with nutrient-polluted
rs. A number of factors combined to heighten media attention and concern: (1) Pfiesteria was a new problem for the Bay that had never been addressed by resource managers; (2) the crisis affected impor-
commercial industries (Le., the commercial fishing industry, restaurant stry, and tourist industry); and (3) the problem raised human health erns for which there were no clear answers.
1997 outbreak sparked Maryland governor, Parris Glenden- 11 a Governors Summit in September 1997, bringing together eaders from the six Bay states to discuss the crisis and to plan
nated course of action. Following the summit, Governor Glen- established his Blue Ribbon Pfiesteria Commission, chaired by Maryland Governor Harry Hughes, a long-time champion of en- ental policy in Maryland. This committee was tasked with study- issue and presenting recommendations to Governor Glendening
ovember of that year. A Technical Advisory Committee was also ed to help determine the cause of the fish kills and to suggest a sci- cally grounded plan to address the problem. Donald Boesch, pres- and professor at University of Maryland’s Center for Environ-
a1 Science, was appointed to head Glendening’s Technical Advisory
facilities. This arrangement greatly reduces the corporation’s capital costs and makes its operations mobile should the need to move arise.
The pressure to protect agricultural interests is often felt the strongest at the local level where agriculture has the ability to dominate a region’s economy and politics. Examples of agriculturally intense ar- eas are spread throughout the watershed, but are particularly prevalent in areas along Maryland’s Eastern Shore, Virginia’s Shenandoah Valley, and the areas around Lancaster County, Pennsylvania. Agriculture d inates the political and economic life of such places as Caroline CO on the Delmarva Peninsula of Maryland’s Eastern Shore, where over percent of the county’s land is used for agricultural production and agri- culture is one of the chief sources of jobs for the county’s thirty thou- sand residents. Likewise, agricultural interests are powerful in such places as Rockingham County, Virginia, where agriculture-related in- dustries annually provide the county with more than $400 million in cash receipts.38 Perhaps the most agriculturally intense area in the wa- tershed is Lancaster County, Pennsylvania. This county leads the state in the production of cattle, chickens, and hogs, supporting nearly six thousand farms on more than 400,000
It is important to note that in many of these agriculturally intense ar- eas, such as Rockingham and Lancaster Counties, the Bay is a distant con- cern. These counties, like dozens of other agriculturally intense counties are “upstream” areas that possess no Bay frontage of their own to protect but are nevertheless in the Bay watershed. The expectation that local offi cials will actively seek or aggressively enforce environmental restrictions on agricultural production in these areas is simply unrealistic.
THE POLICY CYCLE, FOCUSING EVENTS, AND POLITICAL LEADERS: MAKING THE MOST OF
LIMITED OPPORTUNITIES FOR AGRICULTURAL REFORM
Had the move to impose agricultural restrictions happened in the ear 1980s, when hopes were high and conditions ripe for environmental act in the Bay states, perhaps greater gains would have been achieved than been the case. During the early period in the restoration effort, the peri that Downs describes as the “alarmed discovery and euphoric enthusia stage” (see chapter 2), the Bay’s advocates chose a more cautious cou for agricultural policy, pushing for voluntary agricultural reform rathe
85

CHAPTER 4
Lacking sufficient evidence to establish a direct connection be- tween Pfiesteria and agricultural runoff with scientific certainty, Dr. Boesch and his committee were initially reluctant to attribute the out- break to agricultural practices. Former Governor Hughes, aware of the importance of achieving a scientific consensus, prodded Boesch and his committee to report whatever consensus was possible. The report that emerged from the technical committee acknowledged that while there were many possible explanations for the Pfiesteria outbreak that caused the Pocomoke fish kills, nonpoint source nutrients from agriculture pro- duction was most likely the primary culprit and should receive the most attention. Hughes and his committee were able to make use of the sci- entific report to build a case for increased control of agricultural pro- duction. Governor Glendening in turn approved $2 million in emer- gency funding to pay farmers to plant cover crops and began to push for legislation that would require Maryland farmers to develop and imple- ment nutrient management plans within a given period of time. The leg- islation that passed in the closing hours of the 1998 legislative session was the Water Quality Improvement Act of 1998. In many respects, the legislation was nearly identical to the agricultural regulations that Maryland State Senator Gerald Winegrad had unsuccessfully pushed for six years earlier in a different political context.
CONCLUSION
Proponents of agricultural reform are forced to traverse a difficult po- litical terrain. It is a political landscape in which economic concerns, in- terest group pressure, and intergovernmental competition combine to create impressive obstacles for environmental policy innovation. For over two decades, these forces have worked against environmental ad- vocates, scientific evidence, and the concerns of the general public. The obstacles to reform have left the governmental process unwilling, or per- haps incapable, of producing policies that adequately address the Bay’s primary environmental hazard-agricultural pollution. The process has failed to produce enforceable regulations or to provide adequate fund- ing to induce agricultural change. The politics of political expediency has moved forward slowly, producing a trickle of suboptimum agricul- tural policies that have failed to generate substantial environmental im- provements.
? -
Part Ill
THE BLUE CRAB AND BAY POLITICS