amg advanced metallurgical group n.v. houlihan …€¦ · amg advanced metallurgical group n.v....
TRANSCRIPT

AMG ADVANCED METALLURGICAL GROUP N.V.
HOULIHAN LOKEY PRESENTATION, May 17, 2018
1

C A U T I O N A RY N O T E
THIS DOCUMENT IS STRICTLY CONFIDENTIAL AND IS BEING PROVIDED TO YOU SOLELY FOR YOUR INFORMATION BY AMG ADVANCED METALLURGICAL GROUP
N.V. (THE “COMPANY”) AND MAY NOT BE REPRODUCED IN ANY FORM OR FURTHER DISTRIBUTED TO ANY OTHER PERSON OR PUBLISHED, IN WHOLE OR IN PART,
FOR ANY PURPOSE. FAILURE TO COMPLY WITH THIS RESTRICTION MAY CONSTITUTE A VIOLATION OF APPLICABLE SECURITIES LAWS.
This presentation does not constitute or form part of, and should not be construed as, an offer to sell or issue or the solicitation of an offer to buy or acquire securities of the Company
or any of its subsidiaries nor should it or any part of it, nor the fact of its distribution, form the basis of, or be relied on in connection with, any contract or commitment whatsoever.
This presentation has been prepared by, and is the sole responsibility of, the Company. This document, any presentation made in conjunction herewith and any accompanying
materials are for information only and are not a prospectus, offering circular or admission document. This presentation does not form a part of, and should not be construed as, an
offer, invitation or solicitation to subscribe for or purchase, or dispose of any of the securities of the companies mentioned in this presentation. These materials do not constitute an
offer of securities for sale in the United States or an invitation or an offer to the public or form of application to subscribe for securities. Neither this presentation nor anything
contained herein shall form the basis of, or be relied on in connection with, any offer or commitment whatsoever. The information contained in this presentation has not been
independently verified. No representation or warranty, express or implied, is made as to, and no reliance should be placed on, the fairness, accuracy or completeness of the
information or the opinions contained herein. The Company and its advisors are under no obligation to update or keep current the information contained in this presentation. To the
extent allowed by law, none of the Company or its affiliates, advisors or representatives accept any liability whatsoever (in negligence or otherwise) for any loss howsoever arising
from any use of this presentation or its contents or otherwise arising in connection with the presentation.
Certain statements in this presentation constitute forward-looking statements, including statements regarding the Company's financial position, business strategy, plans and
objectives of management for future operations. These statements, which contain the words "believe,” “expect,” “anticipate,” “intends,” “estimate,” “forecast,” “project,” “will,” “may,”
“should” and similar expressions, reflect the beliefs and expectations of the management board of directors of the Company and are subject to risks and uncertainties that may cause
actual results to differ materially. These risks and uncertainties include, among other factors, the achievement of the anticipated levels of profitability, growth, cost and synergy of the
Company’s recent acquisitions, the timely development and acceptance of new products, the impact of competitive pricing, the ability to obtain necessary regulatory approvals, and
the impact of general business and global economic conditions. These and other factors could adversely affect the outcome and financial effects of the plans and events described
herein.
Neither the Company, nor any of its respective agents, employees or advisors intend or have any duty or obligation to supplement, amend, update or revise any of the forward-
looking statements contained in this presentation.
The information and opinions contained in this document are provided as at the date of this presentation and are subject to change without notice.
This document has not been approved by any competent regulatory or supervisory authority.
2

G L O B A L T R E N D S
C O 2 e m i s s i o n r e d u c t i o n ,
p o p u l a t i o n g r o w t h ,
i n c r e a s i n g a f f l u e n c e ,
a n d e n e r g y e f f i c i e n c y
D E M A N D
I n n o v a t i v e n e w p r o d u c t s
t h a t a r e l i g h t e r ,
s t r o n g e r , a n d r e s i s t a n t t o
h i g h e r t e m p e r a t u r e s
S U P P L Y
A M G s o u r c e s , p r o c e s s e s ,
a n d s u p p l i e s t h e c r i t i c a l
m a t e r i a l s t h a t t h e m a r k e t
d e m a n d s
AMG IS A
CRITICAL
MATERIALS
COMPANY
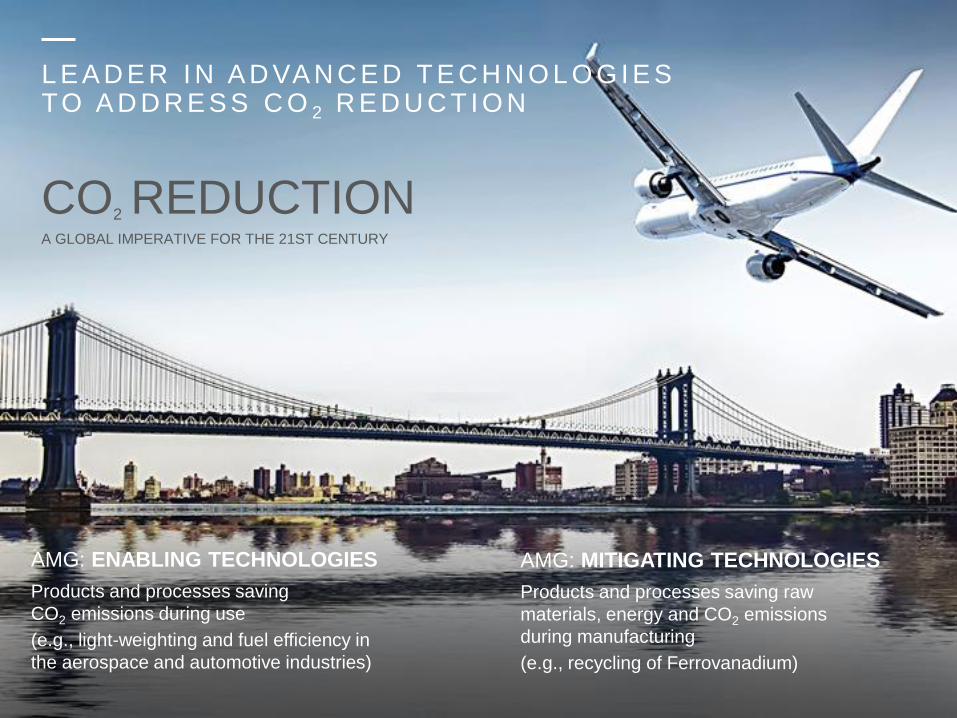
L E A D E R I N A D VA N C E D T E C H N O L O G I E S TO A D D R E S S C O 2 R E D U C T I O N
AMG: MITIGATING TECHNOLOGIES
Products and processes saving raw
materials, energy and CO2 emissions
during manufacturing
(e.g., recycling of Ferrovanadium)
AMG: ENABLING TECHNOLOGIES
Products and processes saving
CO2 emissions during use
(e.g., light-weighting and fuel efficiency in
the aerospace and automotive industries)
A GLOBAL IMPERATIVE FOR THE 21ST CENTURY
CO2 REDUCTION
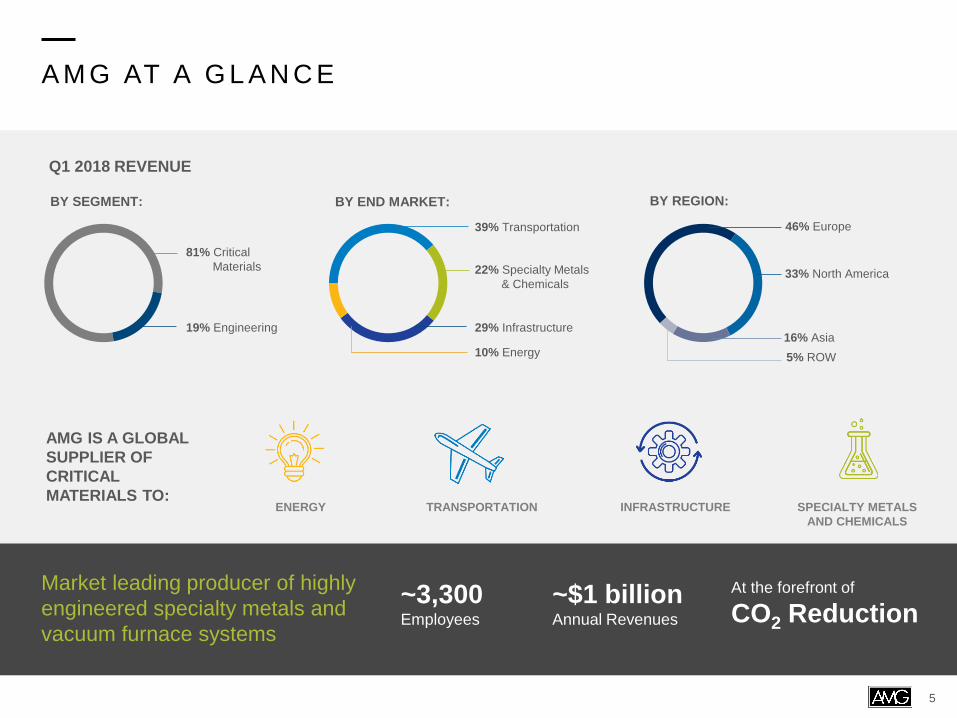
A M G AT A G L A N C E
AMG IS A GLOBAL
SUPPLIER OF
CRITICAL
MATERIALS TO:
Q1 2018 REVENUE
TRANSPORTATIONENERGY INFRASTRUCTURE SPECIALTY METALS
AND CHEMICALS
BY END MARKET: BY REGION:BY SEGMENT:
46% Europe
33% North America
16% Asia
5% ROW
19% Engineering
81% Critical
Materials
29% Infrastructure
22% Specialty Metals
& Chemicals
39% Transportation
10% Energy
Market leading producer of highly
engineered specialty metals and
vacuum furnace systems
~3,300Employees
~$1 billionAnnual Revenues
At the forefront of
CO2 Reduction
5
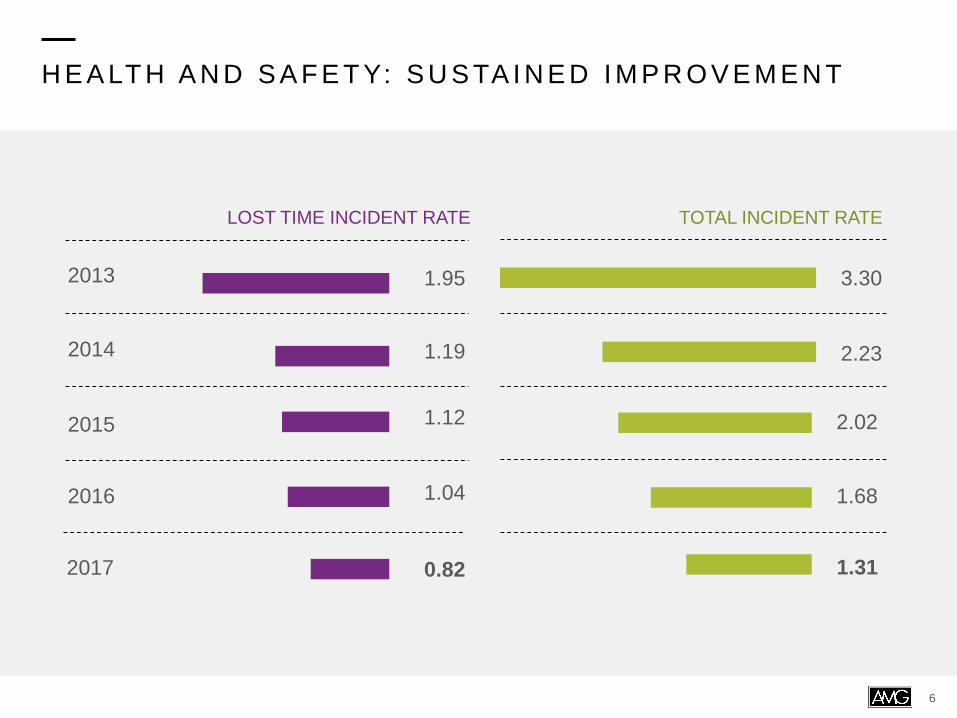
H E A LT H A N D S A F E T Y: S U S TA I N E D I M P R O V E M E N T
LOST TIME INCIDENT RATE
0.82
1.04
1.12
1.19
1.95
TOTAL INCIDENT RATE
2017
2016
2015
2014
2013
1.31
1.68
2.02
2.23
3.30
6
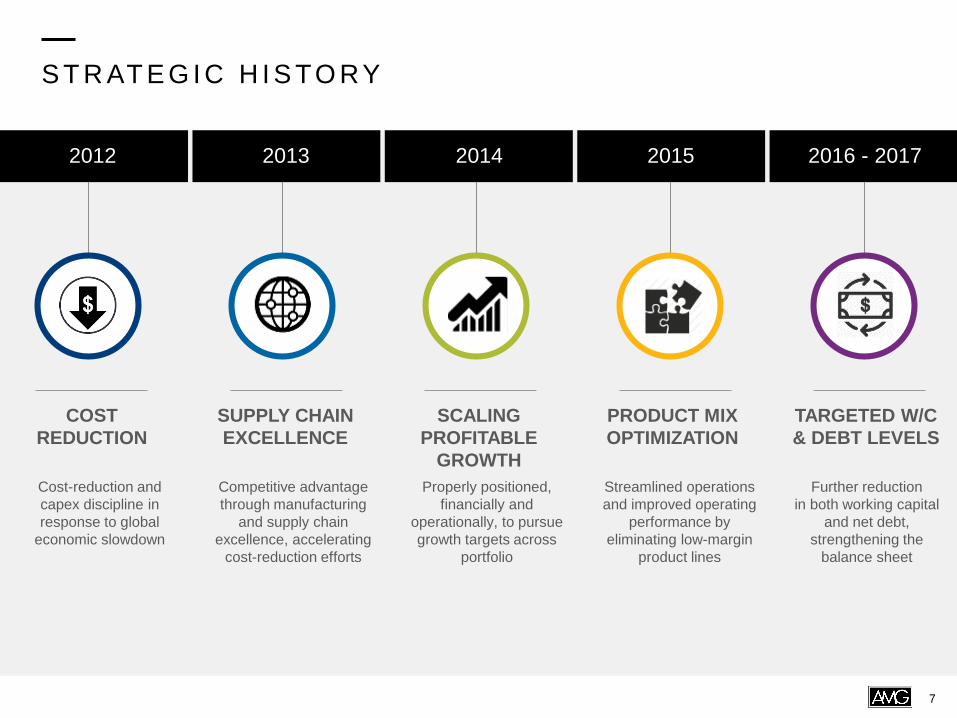
S T R AT E G I C H I S TO RY
COST
REDUCTION
SUPPLY CHAIN
EXCELLENCE
SCALING
PROFITABLE
GROWTH
PRODUCT MIX
OPTIMIZATION
TARGETED W/C
& DEBT LEVELS
Cost-reduction and
capex discipline in
response to global
economic slowdown
Competitive advantage
through manufacturing
and supply chain
excellence, accelerating
cost-reduction efforts
Properly positioned,
financially and
operationally, to pursue
growth targets across
portfolio
Streamlined operations
and improved operating
performance by
eliminating low-margin
product lines
Further reduction
in both working capital
and net debt,
strengthening the
balance sheet
2012 2013 2014 2015 2016 - 2017
7
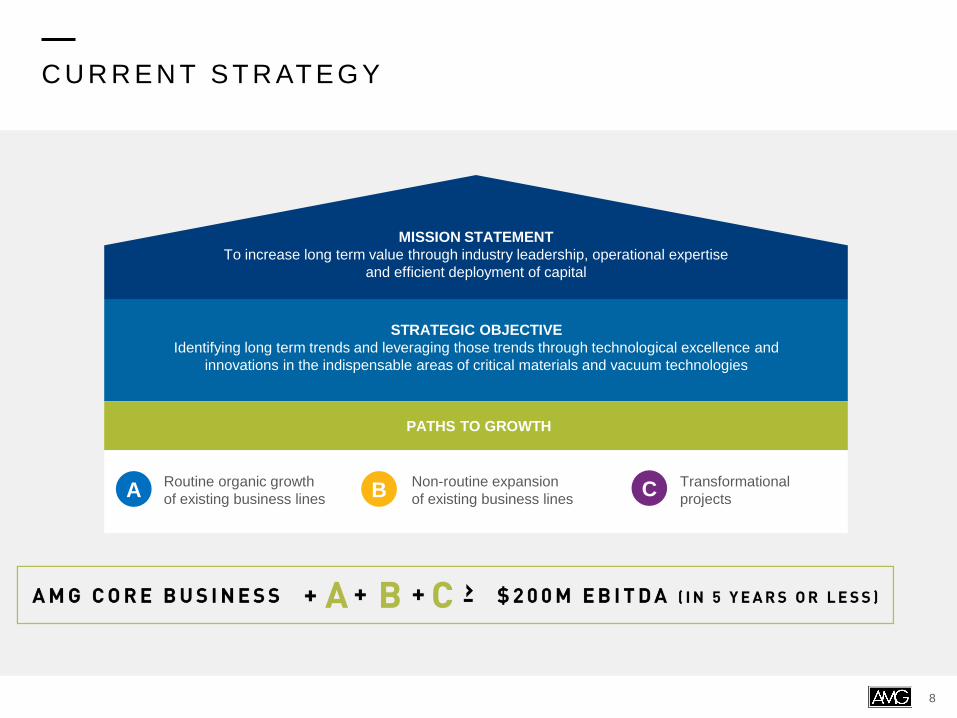
MISSION STATEMENT
To increase long term value through industry leadership, operational expertise
and efficient deployment of capital
STRATEGIC OBJECTIVE
Identifying long term trends and leveraging those trends through technological excellence and
innovations in the indispensable areas of critical materials and vacuum technologies
PATHS TO GROWTH
Routine organic growth
of existing business lines
Non-routine expansion
of existing business lines
Transformational
projectsA B C
C U R R E N T S T R AT E G Y
8
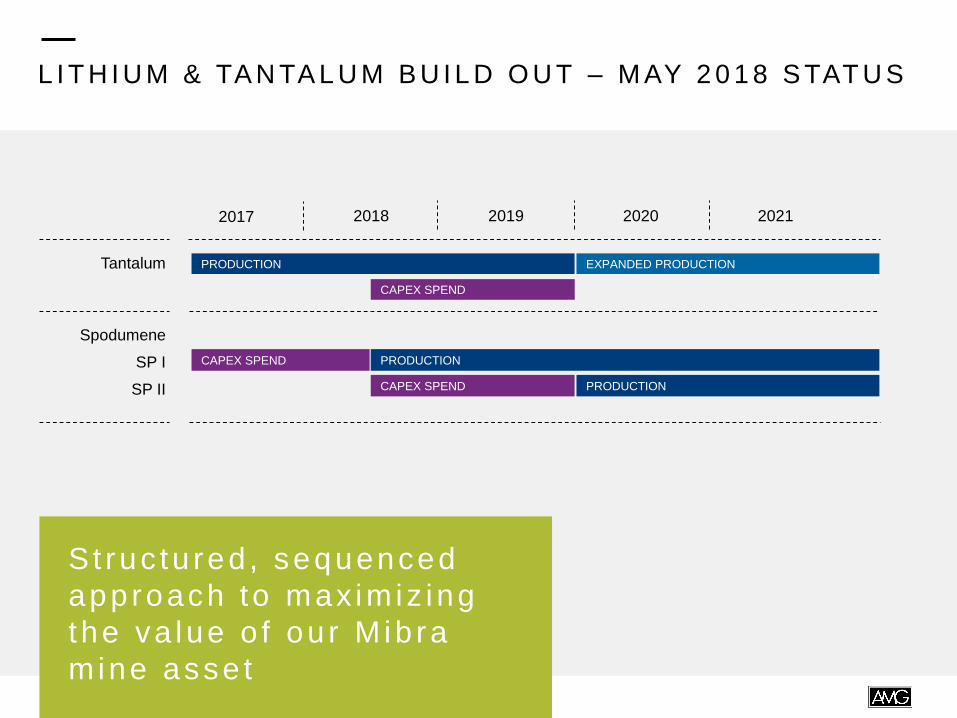
L I T H I U M & TA N TA L U M B U I L D O U T – M AY 2 0 1 8 S TAT U S
St ruc tu red , sequenced
approach to max im iz ing
the va lue o f ou r M ib ra
m ine asse t
2017 2018
Tantalum
Spodumene
SP I
SP II
PRODUCTION
CAPEX SPEND
EXPANDED PRODUCTION
CAPEX SPEND
CAPEX SPEND
PRODUCTION
202120202019
PRODUCTION

L I T H I U M P R O J E C T P H A S E S
Construction of a lithium
concentrate plant to produce
90,000 mt of spodumene per
year
Approved capex: $50M
Start-up has commenced
Construction of second
lithium concentrate plant,
resulting in capacity
expansion from 90,000 mt
to 180,000 mt per year
Approved capex: $110M*
Construction of lithium
chemical plants for the
downstream conversion
of lithium concentrate into
lithium carbonate
PHASE I & PHASE II PHASE III
LITHIUM CONCENTRATE PRODUCTIONLITHIUM CHEMICAL
PRODUCTION
LITHIUM CONCENTRATE
PLANT I
LITHIUM CONCENTRATE
PLANT II
LITHIUM CHEMICAL
PLANTS
*Phase II capex includes investments related to the expansion of existing tantalum operations in
addition to the development and expansion of the existing mining infrastructure

O P E R AT I N G C O S T S F O R S P O D U M E N E P R O D U C T I O N
0
50
100
150
200
250
300
Talison - Greenbushes(Australia)
Pilbara - Pilgangoora(Australia)
Altura - Pilgangoora(Australia)
Galaxy ResourcesMt. Cattlin (Australia)
Process MineralsMt. Marion (Australia)
AMG
($134/mt)
Operating costs for spodumene production, 2017($/mt)
Sources: Roskill, AMG management estimatesNotes: AMG is by-product from tantalum/feldspar production; Pilbara and Galaxy includes credits from tantalite production
Market price:
~$1,000/mt
At current market prices, AMG’s lithium concentrate projects (Spodumene I & II) would
generate annual incremental EBITDA of ~$130M at $1,000/mt
11
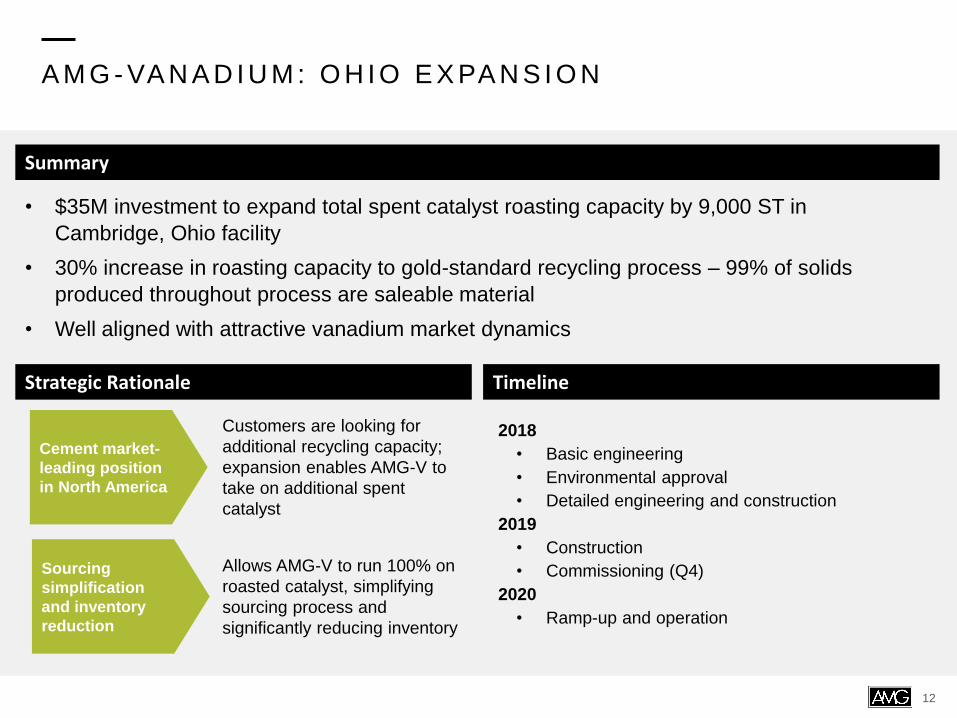
A M G - VA N A D I U M : O H I O E X PA N S I O N
Timeline
Cement market-
leading position
in North America
Sourcing
simplification
and inventory
reduction
Strategic Rationale
2018
• Basic engineering
• Environmental approval
• Detailed engineering and construction
2019
• Construction
• Commissioning (Q4)
2020
• Ramp-up and operation
Summary
• $35M investment to expand total spent catalyst roasting capacity by 9,000 ST in
Cambridge, Ohio facility
• 30% increase in roasting capacity to gold-standard recycling process – 99% of solids
produced throughout process are saleable material
• Well aligned with attractive vanadium market dynamics
Customers are looking for
additional recycling capacity;
expansion enables AMG-V to
take on additional spent
catalyst
Allows AMG-V to run 100% on
roasted catalyst, simplifying
sourcing process and
significantly reducing inventory
12

A M G VA N A D I U M : G O I N G G L O B A L
Par tne rsh ip be tween two marke t
l eade rs to deve lop a sus ta inab le
' c rad le - to -g rave ' so lu t i on fo r ca ta l ys t
supp ly and rec lamat ion
+
13

VA N A D I U M : I N V E N TO RY V S F E - V P R I C E
Slight under-supply position is forecasted to continue for the next several years,
driving down global inventories to near-record lows
14
$0
$5
$10
$15
$20
$25
$30
$35
$40
0.0
1.0
2.0
3.0
4.0
5.0
6.0
7.0
8.0
9.0
2003 2004 2005 2006 2007 2008 2009 2010 2011 2012 2013 2014 2015 2016 2017 2018 2019 2020 2021 2022 2023 2024 2025
Ryan’s Notes Fe-V Price
Vanadium Inventory
Van
ad
ium
In
ven
tory
(Mo
nth
s o
f C
on
su
mp
tio
n)
Fe-V
Pri
ce (
US
$/p
ou
nd
Fe
-V)
Source for Fe-V price: CRU Ryan’s Notes – average monthly US FeV 80% V Mid
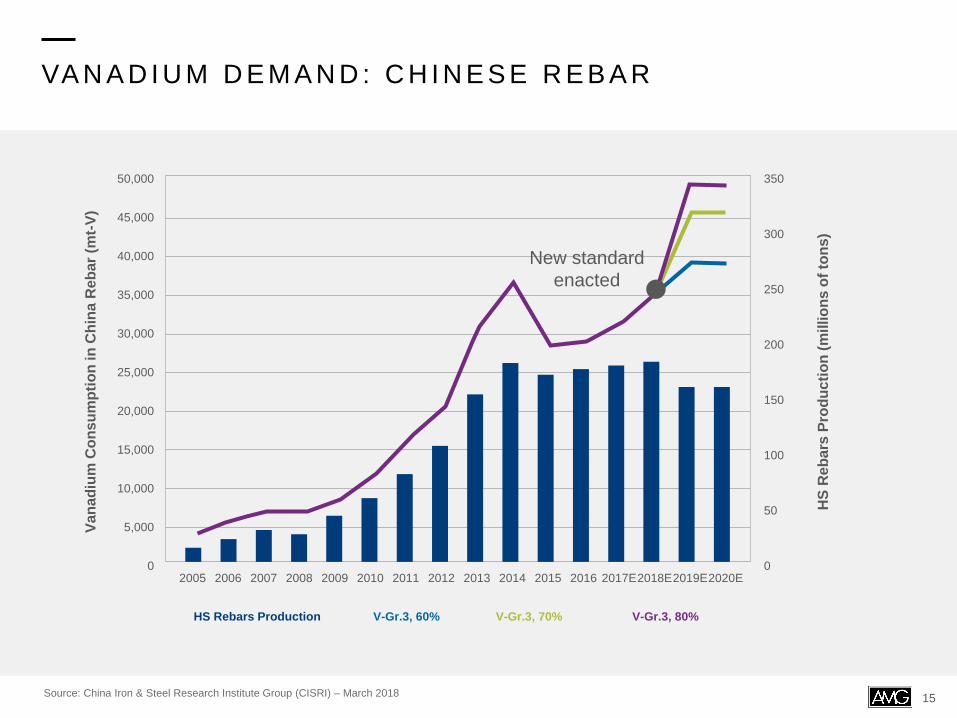
VA N A D I U M D E M A N D : C H I N E S E R E B A R
Source: China Iron & Steel Research Institute Group (CISRI) – March 2018
New standard
enacted
50,000
40,000
35,000
30,000
25,000
20,000
15,000
10,000
5,000
0
45,000
350
250
200
150
100
50
0
300
2005 2006 2007 2008 2009 2010 2011 2012 2013 2020E2019E2018E2017E201620152014
Va
na
diu
m C
on
su
mp
tio
n in
Ch
ina
Reb
ar
(mt-
V)
HS
Reb
ars
Pro
du
cti
on
(m
illio
ns o
f to
ns)
HS Rebars Production V-Gr.3, 60% V-Gr.3, 70% V-Gr.3, 80%
15

F E R R O VA N A D I U M : 5 - Y E A R P R I C E T R E N D
$0
$5
$10
$15
$20
$25
$30
$35
Fe
rro
va
na
diu
m (
$ p
er
lb)
Ferrovanadium
16Source: CRU Ryan’s Notes – average monthly US FeV 80% V Mid
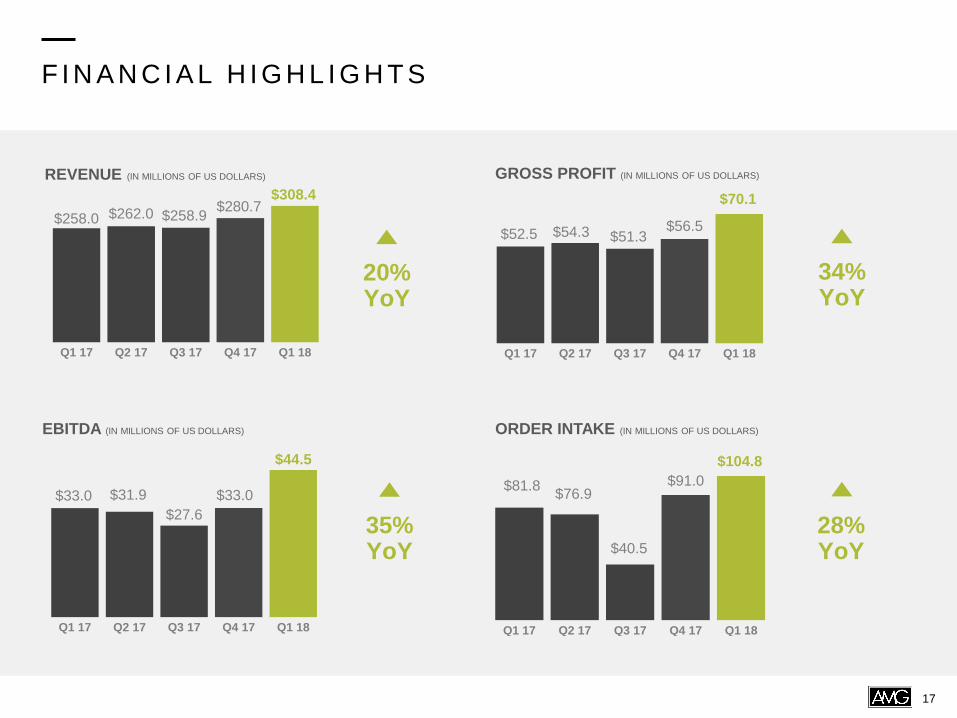
F I N A N C I A L H I G H L I G H T S
17
$33.0 $31.9
$27.6
$33.0
$44.5
Q1 17 Q2 17 Q3 17 Q4 17 Q1 18
$258.0 $262.0 $258.9$280.7
$308.4
Q1 17 Q2 17 Q3 17 Q4 17 Q1 18
$52.5 $54.3 $51.3$56.5
$70.1
Q1 17 Q2 17 Q3 17 Q4 17 Q1 18
REVENUE (IN MILLIONS OF US DOLLARS)
$81.8$76.9
$40.5
$91.0
$104.8
Q1 17 Q2 17 Q3 17 Q4 17 Q1 18
GROSS PROFIT (IN MILLIONS OF US DOLLARS)
ORDER INTAKE (IN MILLIONS OF US DOLLARS)EBITDA (IN MILLIONS OF US DOLLARS)
20%YoY
35% YoY
28%YoY
34%YoY
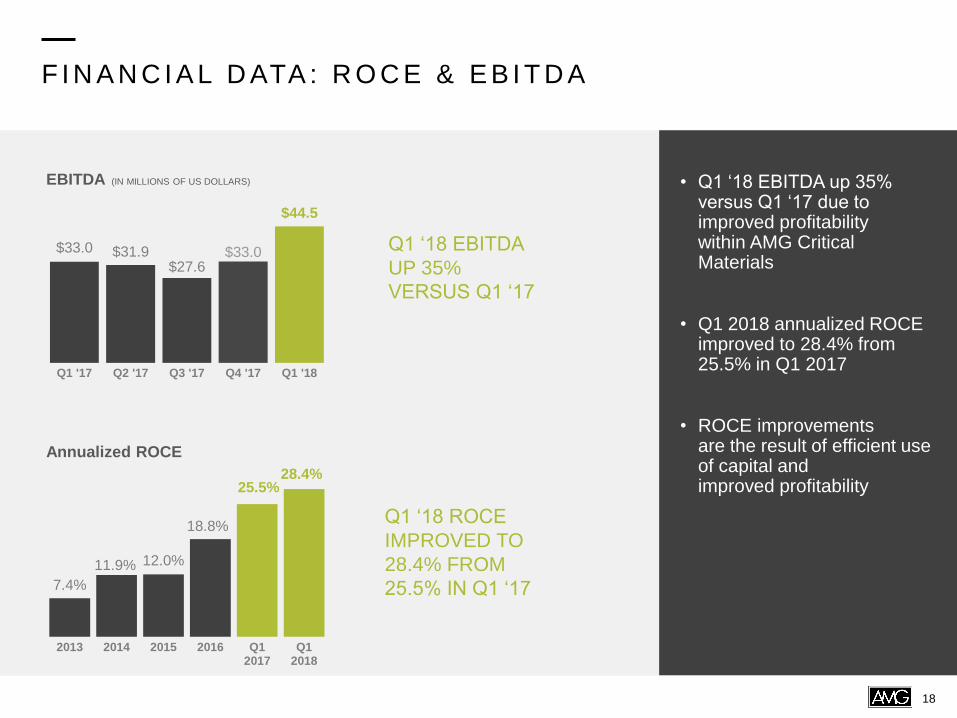
F I N A N C I A L D ATA : R O C E & E B I T D A
• Q1 ‘18 EBITDA up 35% versus Q1 ‘17 due to improved profitability within AMG Critical Materials
• Q1 2018 annualized ROCE improved to 28.4% from 25.5% in Q1 2017
• ROCE improvements are the result of efficient use of capital and improved profitability
Annualized ROCE
EBITDA (IN MILLIONS OF US DOLLARS)
$33.0 $31.9 $27.6
$33.0
$44.5
Q1 '17 Q2 '17 Q3 '17 Q4 '17 Q1 '18
Q1 ‘18 ROCE
IMPROVED TO
28.4% FROM
25.5% IN Q1 ‘17
Q1 ‘18 EBITDA
UP 35%
VERSUS Q1 ‘17
7.4%
11.9% 12.0%
18.8%
25.5%28.4%
2013 2014 2015 2016 Q12017
Q12018
18
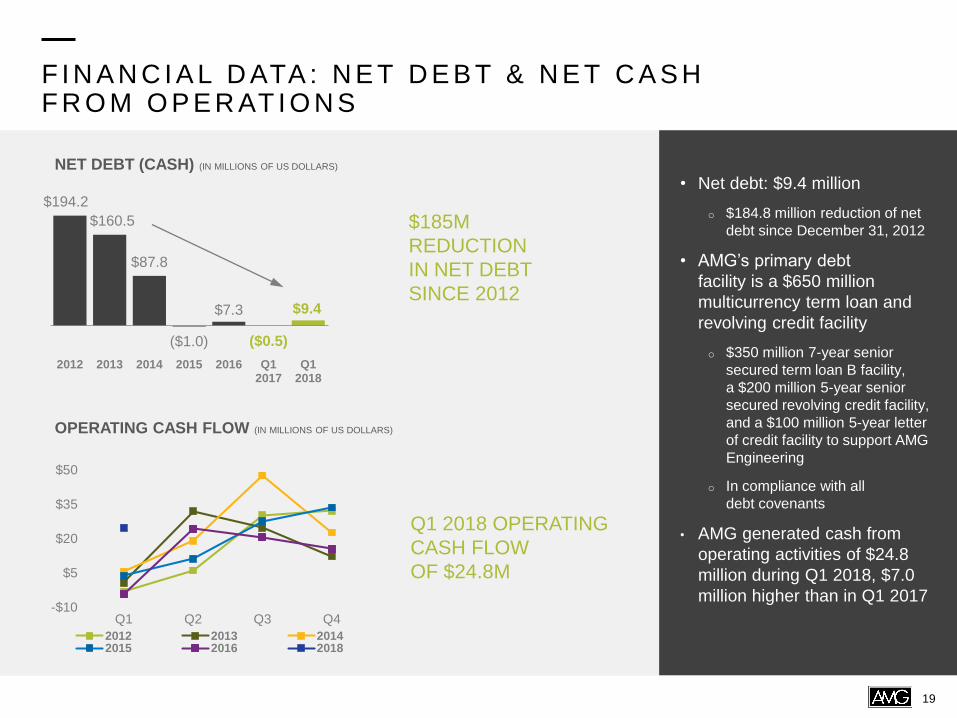
F I N A N C I A L D ATA : N E T D E B T & N E T C A S H F R O M O P E R AT I O N S
• Net debt: $9.4 million
o $184.8 million reduction of net
debt since December 31, 2012
• AMG’s primary debt
facility is a $650 million
multicurrency term loan and
revolving credit facility
o $350 million 7-year senior
secured term loan B facility,
a $200 million 5-year senior
secured revolving credit facility,
and a $100 million 5-year letter
of credit facility to support AMG
Engineering
o In compliance with all
debt covenants
• AMG generated cash from
operating activities of $24.8
million during Q1 2018, $7.0
million higher than in Q1 2017
$194.2
$160.5
$87.8
($1.0)
$7.3
($0.5)
$9.4
2012 2013 2014 2015 2016 Q12017
Q12018
-$10
$5
$20
$35
$50
Q1 Q2 Q3 Q4
2012 2013 20142015 2016 2018
NET DEBT (CASH) (IN MILLIONS OF US DOLLARS)
OPERATING CASH FLOW (IN MILLIONS OF US DOLLARS)
$185M
REDUCTION
IN NET DEBT
SINCE 2012
Q1 2018 OPERATING
CASH FLOW
OF $24.8M
19

A M G C R I T I C A L M AT E R I A L S
• Q1 2018 revenue of $248.4 million was 28% higher than Q1 2017
• EBITDA increased by $11.4 million over Q1 2017 to $37.1 million in Q1 2018, driven primarily by higher vanadium and silicon metal prices, improved product mix and strong sales volumes
• Capital expenditures increased to $22.0 million in Q1 2018 vs. $9.5 million in Q1 2017
• The largest expansion capital project was AMG’s lithium project in Brazil
$194.5 $202.6 $203.4 $214.0
$248.4
$25.7 $23.9 $23.5 $26.9
$37.1
Q1 2017 Q2 2017 Q3 2017 Q4 2017 Q1 2018
Revenue EBITDA
$9.5
$16.9
$21.6
$26.9
$22.0
Q1 2017 Q2 2017 Q3 2017 Q4 2017 Q1 2018
REVENUE & EBITDA (IN MILLIONS OF US DOLLARS)
CAPITAL EXPENDITURES (IN MILLIONS OF US DOLLARS)
Q1 2018 EBITDA
INCREASED BY
$11.4M OVER Q1 2017
INCREASE OF $12.5M
IN Q1 ‘18 VS. Q1 ’17
DUE TO LITHIUM
PROJECT
20

A M G C R I T I C A L M AT E R I A L S – Q U A RT E R LY R E V E N U E D R I V E R S
• AMG Critical Materials
revenue in the first quarter
increased by $53.8 million, or
28%, to $248.4 million
• This was driven by improved
vanadium, silicon, aluminum,
antimony, graphite and
titanium prices, and higher
sales volumes of vanadium,
aluminum, chrome, graphite,
tantalum and titanium
products
• Lower tantalum sales prices
were partially offset by higher
sales volumes
KEY PRODUCTQ1 ‘18 REV
($M)
Q1 ‘17 REV($M)
VOLUME PRICE
FeV & FeNiMo $55.2 $27.0
Al Master Alloys
& Powders$51.1 $43.4
Chromium Metal $26.0 $21.3
Tantalum & Niobium $13.0 $19.6
Titanium Alloys
& Coatings$30.1 $22.5
Antimony $28.2 $25.4
Graphite $20.1 $14.9
Silicon Metal $24.7 $20.5
21

C R I T I C A L M AT E R I A L S P R I C E S : H I S TO R I C A L P R I C I N G
22
• Metal prices are measured
on a scale of 0 to 10, with 0
and 10 representing the
minimum and maximum
average quarterly prices
occurring since the end of
2005
• The positions demonstrate
the current price level of
each metal with respect to
their various historical price
points since the end of 2005
AMG’s relevant
prices have started
to move out of the
bottom quartiles
6.0
2.8
1.2
7.7
3.64.0
8.7
7.9
6.6
8.6
5.1
3.7
3.1
1.4
0.5
1.9
3.2 3.2
0.0
5.4
3.0
6.8
0.7
3.7
0
2.5
5
7.5
10
Sc
ale
Metals
Mar 2018 Position Mar 2017 Position
Highest
Price
Lowest
Price
Note: Metal Positions are measured on a scale of 0 to 10, with 0 being the minimum price and 10 being the maximum price. They are calculated
using the formula [(Dec ‘05 ending value – min. monthly avg) / (max. monthly avg – min. monthly avg) *10] where maximum and minimum
monthly averages are measured over the period 31 Dec ‘05 through 31 Mar ’18; graphite prices are per Benchmark Minerals, showing five year
historical data.
Cr Mo Ni FeV Ti Al C Si Ta SbNbLi
[unchanged]

A M G E N G I N E E R I N G
• EBITDA increased by
$0.1 million in Q1 2018
versus Q1 2017
• Revenue in the quarter was
adversely impacted by
timing effects, namely early
stage engineering work
underway on a number of
large orders received in
recent months
• Order backlog of $255.8
million as of March 31,
2018, a 24% increase
compared to December 31,
2017
• Signed $104.8 million in
new orders during Q1 2018,
a 1.74x book to bill ratio
$63.5 $59.4
$55.6
$66.7 $60.1
$7.3 $8.0
$4.1
$6.1 $7.4
Q1 2017 Q2 2017 Q3 2017 Q4 2017 Q1 2018
Revenue EBITDA
$81.8$76.9
$40.5
$91.0
$104.8
Q1 2017 Q2 2017 Q3 2017 Q4 2017 Q1 2018
REVENUE & EBITDA (IN MILLIONS OF US DOLLARS)
ORDER INTAKE (IN MILLIONS OF US DOLLARS)
REVENUE DECLINED
BY 5% VS. Q1 2017
DUE TO TIMING
EFFECTS
BOOK TO BILL RATIO
OF 1.74X IN Q1 2018
23
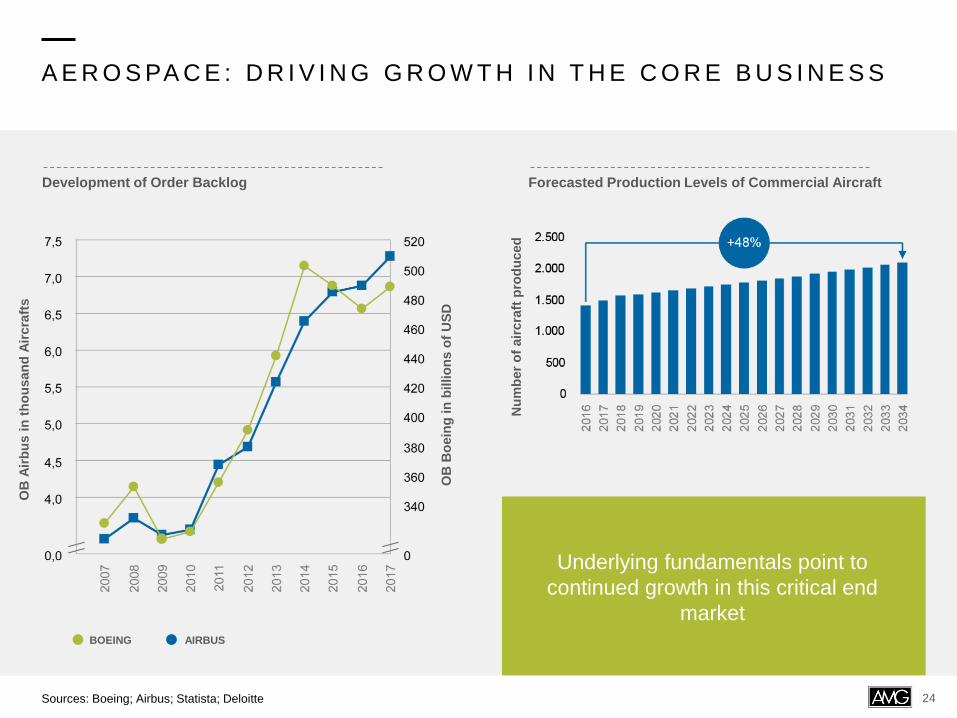
A E R O S PA C E : D R I V I N G G R O W T H I N T H E C O R E B U S I N E S S
Underlying fundamentals point to
continued growth in this critical end
market
Sources: Boeing; Airbus; Statista; Deloitte
Development of Order Backlog Forecasted Production Levels of Commercial Aircraft
Nu
mb
er
of
air
cra
ft p
rod
uc
ed
OB
Air
bu
s i
n t
ho
usan
d A
ircra
fts
OB
Bo
ein
g i
n b
illio
ns
of
US
D
BOEING AIRBUS
24
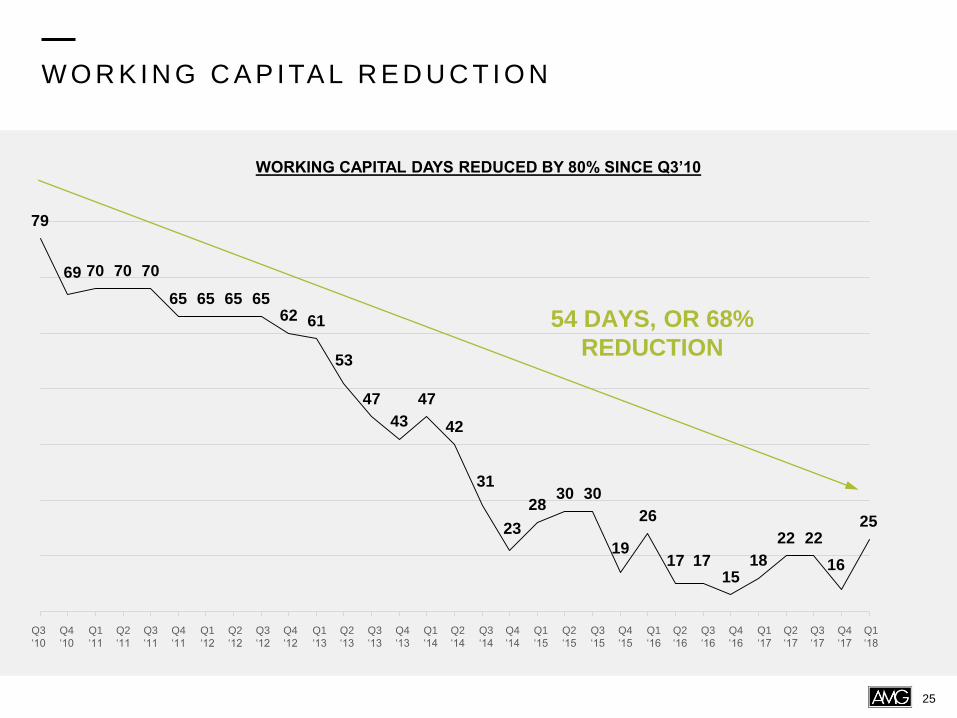
W O R K I N G C A P I TA L R E D U C T I O N
WORKING CAPITAL DAYS REDUCED BY 80% SINCE Q3’10
79
69 70 70 70
65 65 65 6562 61
53
47
43
47
42
31
23
2830 30
19
26
17 1715
18
22 22
16
25
54 DAYS, OR 68%
REDUCTION
25
Q1
‘11
Q2
‘11
Q3
‘11
Q4
‘11
Q1
‘12
Q2
‘12
Q3
‘12
Q4
‘12
Q1
‘13
Q2
‘13
Q3
‘13
Q4
‘13
Q1
‘14
Q2
‘14
Q3
‘14
Q3
‘10
Q4
‘10
Q4
‘14
Q1
‘15
Q2
‘15
Q3
‘15
Q4
‘15
Q1
‘16
Q2
‘16
Q3
‘16
Q4
‘16
Q1
‘17
Q2
‘17
Q3
‘17
Q4
‘17
Q1
‘18

Management’s priority in 2018 is to execute on our highly accretive lithium project
2 0 1 8 O U T L O O K & L I T H I U M P R O J E C T U P D AT E
L I T H I U M P R O J E C T U P D A T EO U T L O O K
We believe we can achieve our goals earlier
than previously expected and can commit to
turning the present EBITDA level into $200
million, or more, in the fiscal year ending
December 31, 2020, or earlier.
As demonstrated in the first quarter of 2018,
AMG expects full year 2018 EBITDA to improve
considerably compared to the prior year.
AMG's management team is focused on
delivering our highly accretive lithium project and
executing our long term lithium strategy. In
addition, we will continue to pursue other
acquisition opportunities and organic growth
projects in order to generate long term value for
our shareholders.
Project is progressing in-line with expectations – commissioning
has commenced as of May 15, 2018.
Phase I - Lithium Concentrate Plant 1: our first lithium concentrate
plant has now commenced start-up and will reach full name-plate
operating capacity of 90,000 tons per annum of lithium concentrate in
the fourth quarter of 2018.
Phase II - Lithium Concentrate Plant 2: work on our second lithium
concentrate plant is also well underway and we expect to complete
detailed engineering and commence construction in the third quarter of
2018. Furthermore, we expect to begin production by the end of 2019.
Phase III - Lithium Carbonate: we are preparing a definitive concept
to move downstream into the production of lithium chemicals, to
capture the incremental value associated with this part of the value
chain. We look forward to providing further updates in due course.
26