amga april 2014 dennis schneider, m.d., cmo; debbie
TRANSCRIPT

AMGA – April 2014 Dennis Schneider, M.D., CMO; Debbie Chandler, Exec VP/CEO Colorado Springs Health Partners, PC

CSHP Overview
Population Health – Our Strategy
CSHP structure and workflow
Show Me the Data
Other Initiatives
Questions

Physician owned
108 Physicians
157 Total Providers
2/3 Primary Care, 1/3
Specialty
11 Sites in Colorado Springs
& Vicinity
108,000 Patients
558,773 Encounters in 2013
287,243 Office Visits in 2013
Single, practice-wide EHR:
Allscripts Enterprise V11.2
Analytics: Humedica –
MinedShare®

Services/Programs
20+ Medical/Surgical
Specialties
Hospitalist/Sub-acute care
Ambulatory Surgery Center
Urgent Care
Lab
Radiology – Advanced
Imaging
Pharmacy
Sleep Center
Health/Wellness Management
Infusion Center

Urgent Care
Extended Hours Clinic (Primary Care)
Ambulatory Surgery Center
RNs on Call
Hospitalist Department
Health Management
On Site Sleep Center
Outpatient Infusion Clinic
SNF & LTAC coverage Closing the
loop!
Services that support the PCMH ambulatory
delivery system
One
Electronic
Patient
Record


“Managing the complete health needs of not only the patients you
see but also the ones that you don’t see.”

1. Define
2. Assign
3. Analyze
4. Focused outreach
4 Basic Steps: How Do You DO Population
Management?
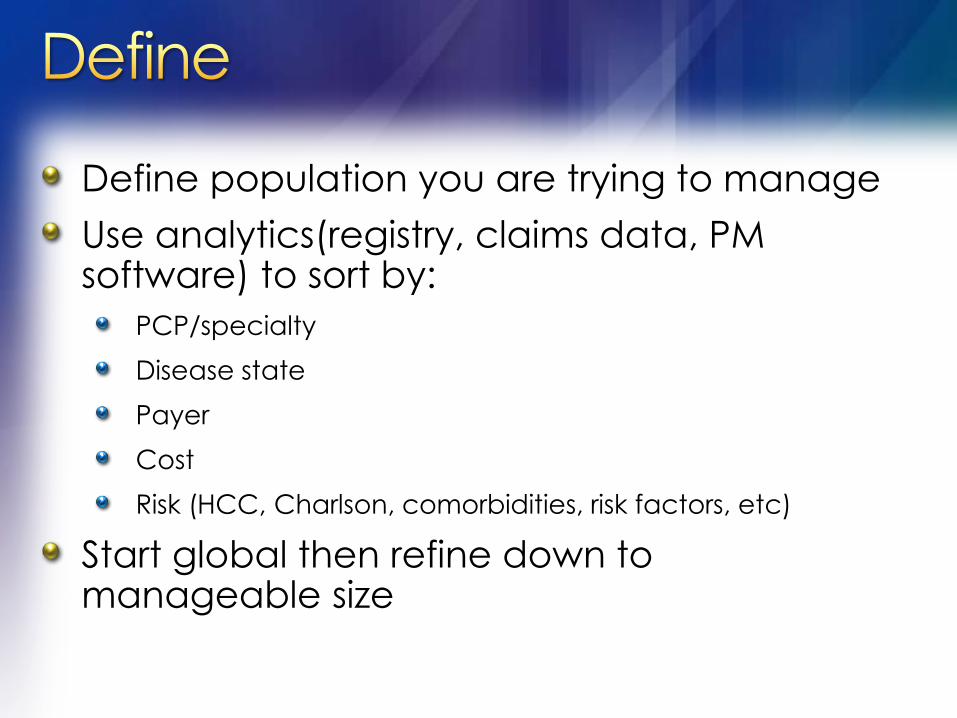
Define population you are trying to manage
Use analytics(registry, claims data, PM software) to sort by:
PCP/specialty
Disease state
Payer
Cost
Risk (HCC, Charlson, comorbidities, risk factors, etc)
Start global then refine down to manageable size

Assign the defined population to responsible provider
“Attribution” – inexact science, many methods
CMS definition- 4 cut method
Cut Report Description PCP Assignment
1st Cut Patients who have seen only one provider in
the past year
Assigned to that sole
provider
2nd Cut Patients who have seen multiple providers,
but one provider the majority of the time in
the past year
Assigned to majority
provider
3rd Cut Patients who have seen two or more
providers equally in the past year (no
majority provider can be determined)
Assigned to the provider
who performed the last
physical exam
4th Cut Patients who have seen multiple providers Assigned to last provider
seen

Keep focus on improving Value for that specific population
Value= quality/costs
3 levels of analysis
Basic
Intermediate
Advanced
Compiled by Clinical Innovation Team and Physician Champion Committee (you’ll hear more about this later…)
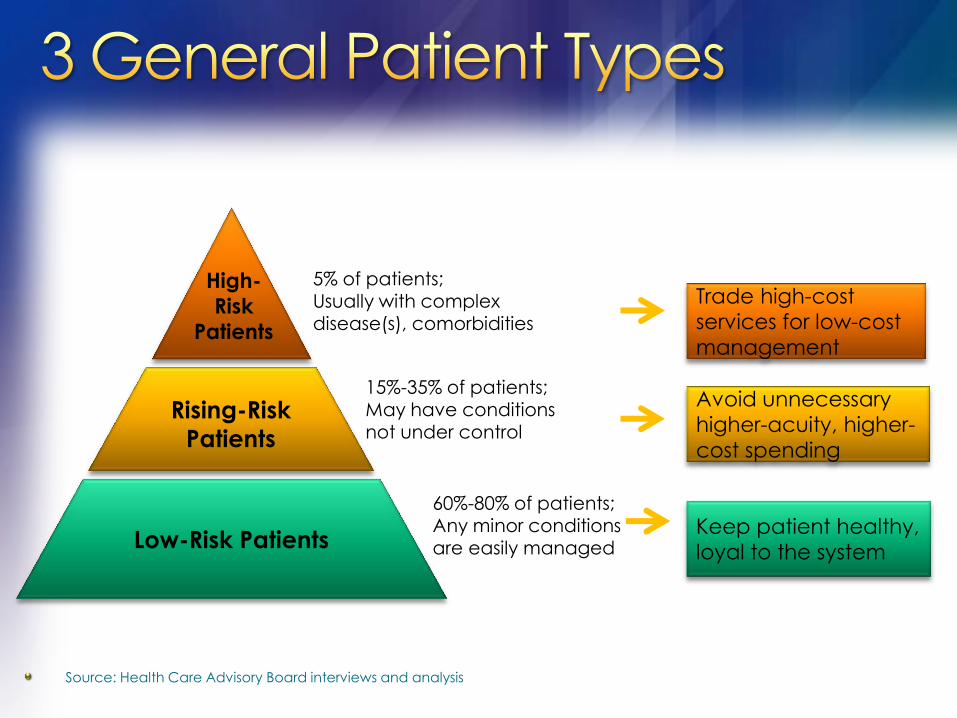
Source: Health Care Advisory Board interviews and analysis
High-
Risk
Patients
Rising-Risk
Patients
Low-Risk Patients
5% of patients; Usually with complex disease(s), comorbidities
15%-35% of patients;
May have conditions not under control
60%-80% of patients; Any minor conditions are easily managed
Trade high-cost
services for low-cost
management
Avoid unnecessary
higher-acuity, higher-
cost spending
Keep patient healthy,
loyal to the system

“Gaps in care”
Includes preventative measures (screenings, immunizations, etc.)
Disease specific metrics (A1c ,BP, LDL , etc.)
Coding/documentation gaps (RAF scores, accurate dx for analytics year to year)

Cost/claims data
High-utilizers
Disease Specific cohorts(CHF,DM,COPD)
Comorbidities
Risk profiles (HCC codes, Charlson scores)

Disease specific predictive analytics (CHF, COPD,DM)
Risk Factor Based Population Stratification(BMI, Smoking, etc.)
Value matrix-integrating quality and cost into analysis simultaneously; “quality at what cost”

Customized campaigns - Critical elements
Specific populations-manageable sizes
Specific clinical targets/goals-keep simple
Reasonable timeframes for completion
Measure Patient/Provider response rate
Measure/Report impact of campaign
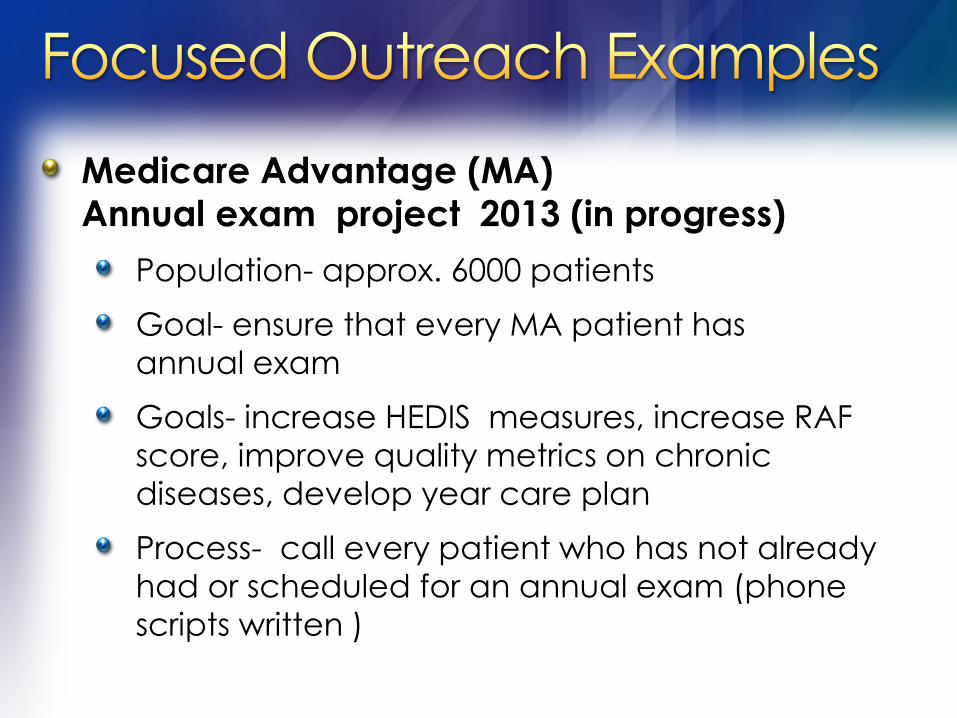
Medicare Advantage (MA)
Annual exam project 2013 (in progress)
Population- approx. 6000 patients
Goal- ensure that every MA patient has
annual exam
Goals- increase HEDIS measures, increase RAF
score, improve quality metrics on chronic
diseases, develop year care plan
Process- call every patient who has not already
had or scheduled for an annual exam (phone
scripts written )

0%
5%
10%
15%
20%
25%
30%
35%
40%
45%
Medicare Advantage
Outreach - Patient
Compliance
Previous
Compliance
Estimate
Post-Outreach
Efforts - 5500
calls

Process: RN Navigators gather daily
patient information from many
sources-hospitals, Hospitalists,
payer claims databases,
PCPs referrals

CHALLENGE:
Unnecessary ER utilization
Enhance system wide care coordination
SOLUTION:
RN Navigators called every post-ER pt. w/in 48hrs (M-F daily calls)
Patient Care Compass (PCMH)

Call includes
Med reconciliation
Care plan implementation
Case management
Disease education
Follow up appointments (PCP, specialists
and ancillaries) within 7-10 days

Which comes first?
Population management infrastructure vs. clinical analytic tools
We chose infrastructure
Followed PCMH concepts


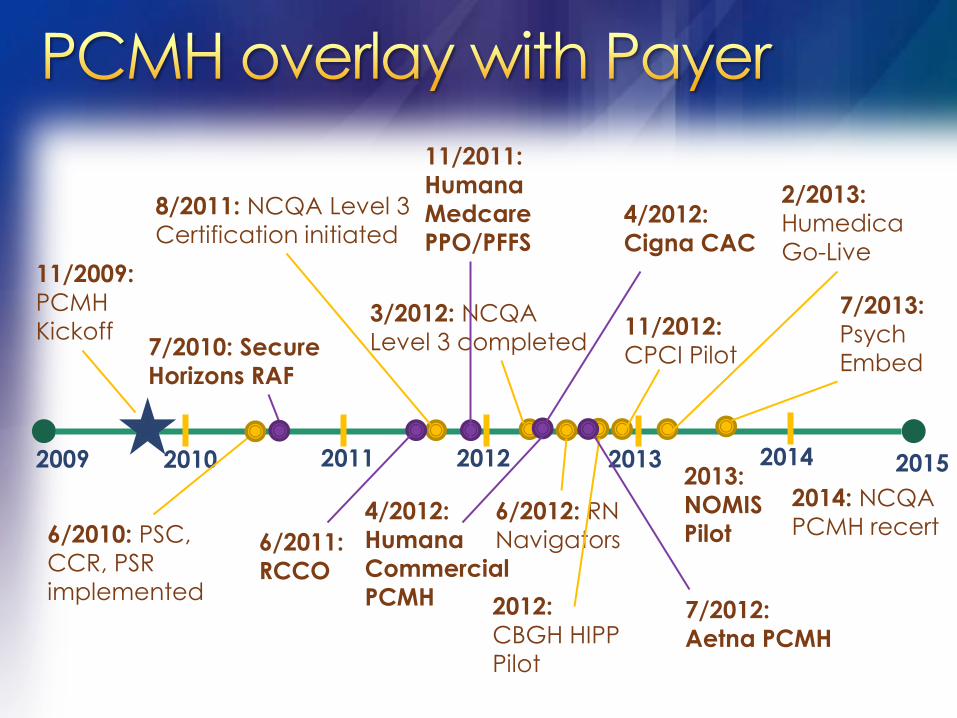
2015 2009 2010 2011 2012 2013 2014
11/2009:
PCMH
Kickoff
6/2010: PSC,
CCR, PSR
implemented
8/2011: NCQA Level 3
Certification initiated
3/2012: NCQA
Level 3 completed
6/2012: RN
Navigators
11/2012:
CPCI Pilot
2/2013:
Humedica
Go-Live
2013:
NOMIS
Pilot
7/2013:
Psych
Embed
2012:
CBGH HIPP
Pilot
2014: NCQA
PCMH recert

2015 2009 2010 2011 2012 2013 2014
7/2010: Secure
Horizons RAF
6/2011:
RCCO
4/2012:
Humana
Commercial
PCMH
11/2011:
Humana
Medcare
PPO/PFFS
7/2012:
Aetna PCMH
4/2012:
Cigna CAC
2015 2009 2010 2011 2012 2013 2014
2012:
CBGH HIPP
Pilot
11/2009:
PCMH
Kickoff
6/2010: PSC,
CCR, PSR
implemented
8/2011: NCQA Level 3
Certification initiated
3/2012: NCQA
Level 3 completed
6/2012: RN
Navigators
11/2012:
CPCI Pilot
2/2013:
Humedica
Go-Live
2013:
NOMIS
Pilot
7/2013:
Psych
Embed
2014: NCQA
PCMH recert
7/2010: Secure
Horizons RAF
6/2011:
RCCO
4/2012:
Humana
Commercial
PCMH
11/2011:
Humana
Medcare
PPO/PFFS
7/2012:
Aetna PCMH
4/2012:
Cigna CAC
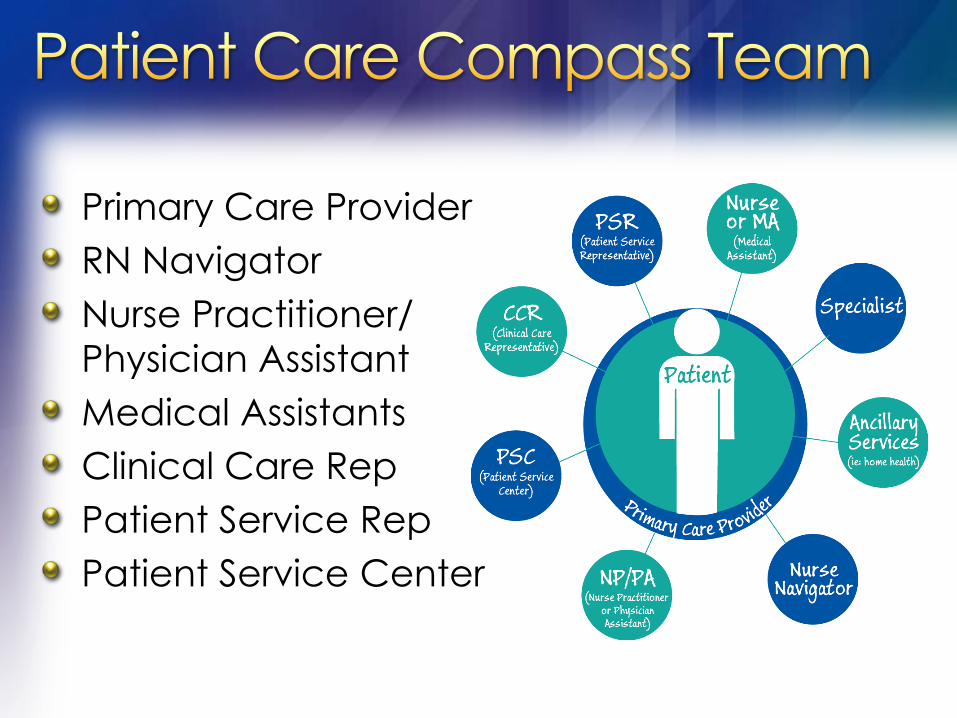
Primary Care Provider
RN Navigator
Nurse Practitioner/
Physician Assistant
Medical Assistants
Clinical Care Rep
Patient Service Rep
Patient Service Center

MA (Medical Assistant) / CCR (Clinical Care Representative)
Pre-visit preparation
Clinical checkout/follow up
Patient Education
Working the list & gaps in care

New department – Headed by CMO
Staff- Director,1 clinical data analyst, 2 report writers
Primary role -Population Data Analytics/ Data reports
Secondary role –assist COO in redesign of workflows for efficient use of resources to do population management
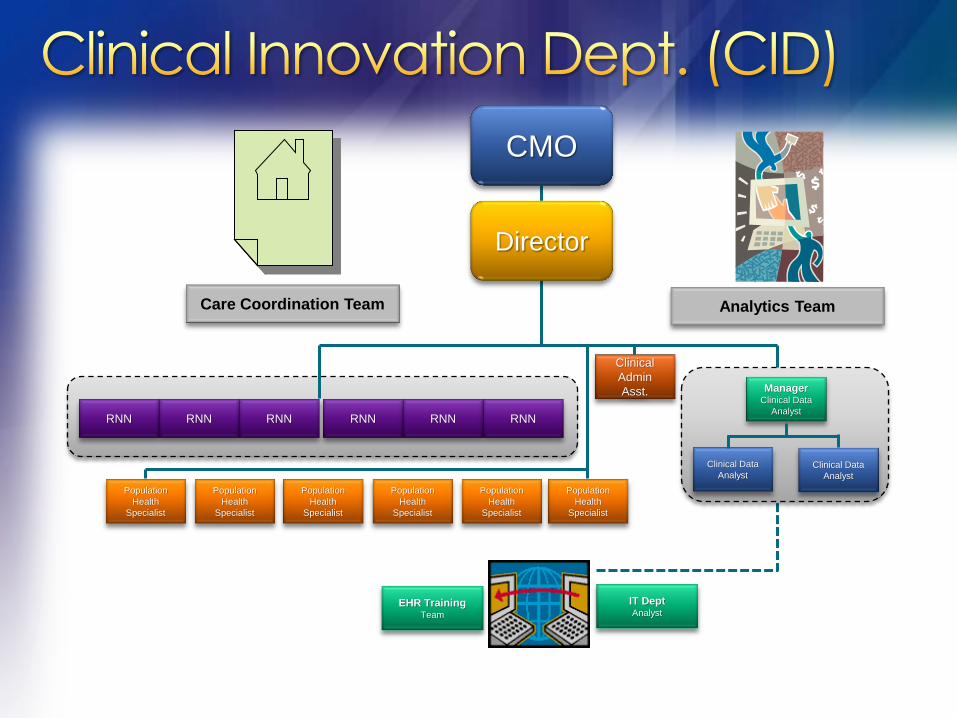
CMO
Director
Clinical
Admin
Asst. Manager Clinical Data
Analyst
Clinical Data
Analyst Clinical Data
Analyst
RNN RNN RNN RNN RNN RNN
Population
Health
Specialist
Population
Health
Specialist
Population
Health
Specialist
Population
Health
Specialist
Population
Health
Specialist
Population
Health
Specialist
EHR Training Team
IT Dept Analyst
Care Coordination Team Analytics Team

Located at each office (Primary)
Care transition and coordination
Past-hospital & ER visits
Care management of high-risk patients
Gaps in care

December 2013 - 4.8 FTE RN Navigators
1198 outreach calls to post-hospital/
ER patients:
490 appointments with PCP/Specialist/Ancillary
41% capture rate
VALUE = QUALITY/COST

28
38 40 40
29 30 29
25 28 28
25 25
16 15
7 5 5 6
4 2 1 0
5
10
15
20
25
30
35
40
45
Au
g…
Se
p…
Oc
t…
No
v…
De
c…
Jan
-…
Fe
b…
Ma
r…
Ap
r-…
Ma
…
Jun
-…
Jul-1
2
Au
g…
Se
p…
Oc
t…
No
v…
De
c…
Jan
-…
Fe
b…
Ma
r…
Ap
r-…
*Care management efforts
began July 2, 2012
ER
v
isits
N = 21 patients

Pre-visit assessments
Confirms all pertinent info needed for appt. is charted, ordered or communicated
Outreach call to patients who need ordered labs, testing (include a request for missing items info)

Collect data & generate reports on quality metrics for providers, payers, & regulatory entities
Collaborate with Population Health Specialists
Provide site/provider metrics data on D3, Hypertension projects
Pull queries for clinical research studies
Support of PCMH, Payer Initiatives

Position Function Staff Ratio
Physician Manage Panel 1
NP/PA Co-manage Panel 0.5-1 / doc
RN Navigator Highest Risk Care Management
(ER/Post-hospital / TOC)
1:9 docs
Population Health
Specialists
Routine outreach – pre-visit,
population management
outreach
1:8 docs
MA’s Enhanced intake, med.
Reconciliation
1:1 provider
Clinical Care
Representative
(CCR)
Post-visit coordination/scheduling
tests, f/u visits, education
materials
1:3 providers

Specialty providers & programs
Heart Failure Clinic
COPD Rehab Clinic
Urgent Care follow up/outreach
Specialty referral protocols
Ancillary Services-Advanced imaging appropriateness

Cardiology
Gastroenterology
Neurology
Orthopedics
Rheumatology

Date Diagnosis DA ED Accepting
Provider RN Follow-up
1/8/2014 HTN 1 Dr. Johnson Saw PCP 1/8/14
1/8/2014 CHEST PAIN 1 ED Pt not admitted. He was dx'd with epigastric pain and given Pepcid as Rx. 1/22/14: LMTC. 1/22/14: Pt called to advise that he is doing better and is seeing his VA doc for f/u.
1/8/2014 HYPOTENSION/
HEMATURIA 1 Dr. Monticelli
1/10/14: Pt was D/Cd from hospital today. He had a blood transfusion yest and is feeling much stronger.
1/8/2014 PNEUMONIA/
HYPOXIA/ DIABETES
1 Dr. Wyse 1/10/14: Pt still inpt at Penrose. 1/16/14: Pt D/Cd from hospital on 1/10/14 with dx: pneumonia. RNN contacted 1/13/14; Has appt with PCP 2/11/14.
1/9/2014 ACUTE MI 1 ED
1/10/14: Pt still inpt at Memorial. He had cardiac stent placed yest. 1/16/14: Pt D/Cd from hospital 1/11/14. He is set up to go to cardiac rehab on 1/27/14. 1/22/14: Spoke with pt. He is feeling much better. He is seeing Dr. Greenberg, Cardiology, on 1/27/14 and then will begin cardiac rehab.
1/11/2014 PNEUMONIA 1 Dr. Nitcher D/Cd from hospital 1/14/14 with dx: pneumonia and asthma. He is on antibiotics, steroids, and O2. Saw PCP 1/15/14 and has another appt with PCP 1/27/14.

Show Me The Data…

Payer claims data/reports
Precision BI- basic registry/ inquiry based reports
Humedica MinedShare®
Main analytic tool
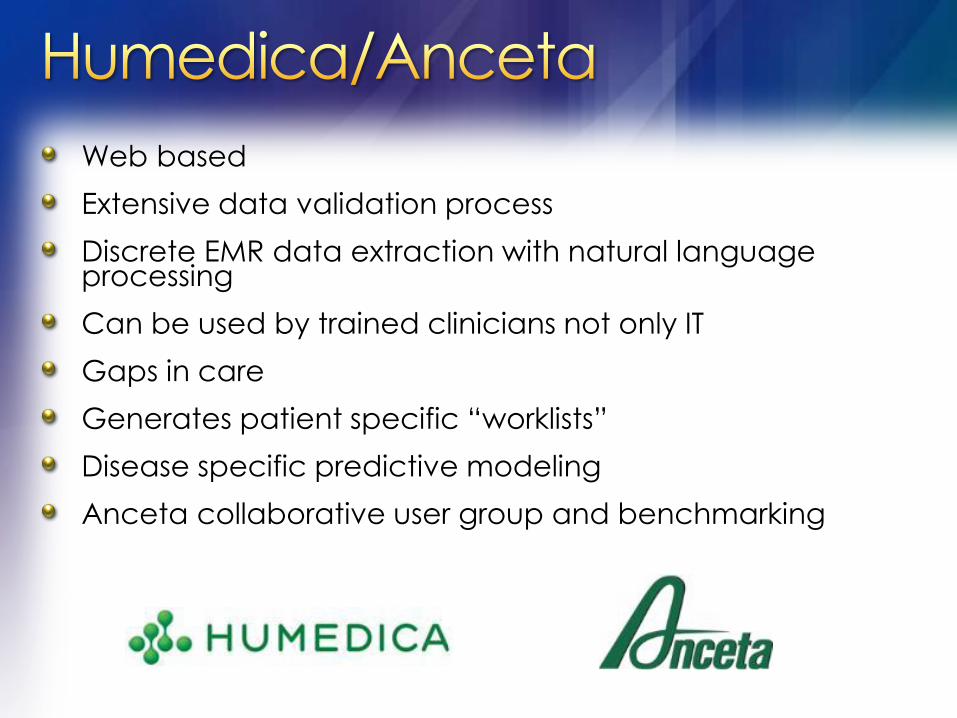
Web based
Extensive data validation process
Discrete EMR data extraction with natural language processing
Can be used by trained clinicians not only IT
Gaps in care
Generates patient specific “worklists”
Disease specific predictive modeling
Anceta collaborative user group and benchmarking

D3 control = A1c < 8, LDL < 100, and BP <140/90
38
%
41
%
34
%
50
%
48
%
41
%
38
% 4
7%
37
%
42
%
39
%
37
%
39
%
44
%
41
%
43
%
43
%
38
%
40
% 48
%
39
%
36
%
42
%
37
%
0%
10%
20%
30%
40%
50%
60%
AC BA BY CB CV DA DQ EW GB IG KT LA MB NE NQ PR QP SN TJ TU VB WD YQ ZW
CSHP 44%
Av all groups

3% Increase
42.4 43.1
33.9
44.5
55.4
37.5 33.6 35.1
41.6
46.8
36.8
48.3 51.9
43.4 39.4
42.8
0
10
20
30
40
50
60
Briargate East Fountain Monument Rockrimmon Southwest West Woodland
Park
D3 Patients in Control by Site
(A1c < 8, LDL < 100, B/P < 140/90)
YTD 2012 to YTD 2013
2012
2013
CSHP Target 45%
December 2013
Anceta Averge 37%
CSHP December 2012
Average 40.2%**
CSHP December 2013
Average 43.2%

Individual/Site PCP BP performance report
Retraining all MAs on proper BP measurement
technique
Adopting BP med algorithm
Outreach calls to identified
patients out of control
Defined goal of minimum
5% improvement over baseline
with some compensation at risk

66
%
70
%
65
%
76
%
81
%
73
%
68
%
72
%
71
%
71
%
63
%
66
%
70
%
71
%
64
%
69
%
71
%
64
%
63
%
68
%
68
%
67
%
72
%
67
%
0%
10%
20%
30%
40%
50%
60%
70%
80%
90%
AC BA BY CB CV DA DQ EW GB IG KT LA MB NE NQ PR QP SN TJ TU VB WD YQ ZW
CSHP
71%
Av all groups

7.5% Increase
69.1 69.8 63.5
75.5 80.5
66.7 62.3 63.2
73.6 77.9 76.7 78.5
83.8
70.2 74.2
79.4
0
10
20
30
40
50
60
70
80
90
Briargate East Fountain Monument Rockrimmon Southwest West Woodland
Park
Hypertension Patients in Control by Site
(B/P < 140/90)
YTD 2012 to YTD 2013
2012
2013
AMGA Target 80% December 2013 Anceta Average 69.7%
CSHP December 2012 Average 67.6% CSHP December 2013 Average 75%

0
40
80
120
160
200
240
280
320
CSHP PPPM
Mkt Exp PPPMSe
ve
rity
Ad
just
ed
PPPM
Major Service Category
=12% Cost Advantage

The Comprehensive Primary Care Initiative
A multi-payer initiative fostering collaboration between public and private health care payers to strengthen primary care. Medicare works with commercial/state health insurance plans offering care coordination payments to primary care doctors.
CSHP accounts for 8 of 74 practices (or 11%) in the state selected through a competitive process!
CPCI allows us to provide care coordination for 28,000 patients
Start with our highest risk patients, then additional outreach
Insurance Plans participating:
Anthem Blue Cross Blue Shield of Colorado/Cigna/Colorado Medicaid/ Humana/Rocky Mountain Health Plans/United Healthcare

0
40
80
120
160
200
240
280
320
InPatient
PMPM
Specialist
PMPM
PCP PMPM Total
CSHP PPPM
CPCI-CO
PPPM
Se
ve
rity
Ad
just
ed
PPPM
Major Service Category
35% Cost
Advantage
31% Cost Advantage 12% Cost
Advantage
-15% Cost Advantage

Other Initiatives

Automated reminder for compliance Hypertension
Diabetes
90 Day Trial
42 Distinct Patients Average age of 52
Control Rate Goal = 80% Pilot achieved 93%
Patient Response Rate Goal = 75% Pilot achieved 77%

Psychologist co-located in primary care setting
June 2013 launch
Coordinated with local behavioral health provider
Shared salary/cost
Present results to payers

0
2
4
6
8
10
12
14
16
18
Week of Nov
4th
Week of Nov
11th
Week of Nov
18th
Week of Nov
25th
Co-Visits
Follow up

Reason for BH Visit
Depression
Anxiety
Stress
ADHD
Chronic Pain
Sleep Disorders
Smoking Cessation
Migraines
Hypothyroid
Tics

AMGA Measure Up/ Pressure Down Hypertension campaign (underway)
Use Disease Specific Predictive Modeling (CHF,COPD)
Integrate Claims/cost data into clinical analytic tools to complete the data
Expand clinical analytics to specialists metrics

10. Engage Providers – “Show Me the DATA”
9. Centralize data analytic function- give out
data in measured amounts to avoid overload.
8. Build clinical teams/infrastructure first
7. Engage Patients- explain why we are
reaching out
6. Clearly identify goal of each clinical metric
(benchmark - internal and external)

5. Financial incentive alignment helps but should
not be only motivator
4. Create Transparency of Data culture with a
small dose of “friendly” competition between
providers/sites
3. Start with small focused outreach campaigns
2. Data is never “perfect”:
“The enemy of good is perfect”
1. This is hard work - Celebrate Success!

THANK YOU!