an 800 million solar mass black hole in a significantly ... · eduardo banados˜ 1,*, bram p....
TRANSCRIPT

An 800-million-solar-mass black hole in asignificantly neutral Universe at redshift 7.5Eduardo Banados1,*, Bram P. Venemans2, Chiara Mazzucchelli2, Emanuele P. Farina2,Fabian Walter2, Feige Wang3,4, Roberto Decarli2,5, Daniel Stern6, Xiaohui Fan7, FrederickB. Davies8, Joseph F. Hennawi8, Robert A. Simcoe9, Monica L. Turner9,10, Hans-WalterRix2, Jinyi Yang3,4, Daniel D. Kelson1, Gwen C. Rudie1, and Jan Martin Winters11
1The Observatories of the Carnegie Institution for Science, 813 Santa Barbara Street., Pasadena, CA 91101, USA2Max Planck Institut fur Astronomie, Konigstuhl 17, D-69117, Heidelberg, Germany3Department of Astronomy, School of Physics, Peking University, Beijing 100871, China4Kavli Institute for Astronomy and Astrophysics, Peking University, Beijing 100871, China5INAF – Osservatorio Astronomico di Bologna, via Gobetti 93/3, 40129, Bologna, Italy6Jet Propulsion Laboratory, California Institute of Technology, 4800 Oak Grove Drive, Pasadena, CA 91109, USA7Steward Observatory, The University of Arizona, 933 North Cherry Avenue, Tucson, AZ 85721–0065, USA8Department of Physics, Broida Hall, University of California, Santa Barbara, CA 93106–9530, USA9MIT-Kavli Center for Astrophysics and Space Research, 77 Massachusetts Avenue, Cambridge, MA, 02139, USA10Las Cumbres Observatory, 6740 Cortona Dr, Goleta, CA 93117, USA11Institut de Radioastronomie Millimetrique (IRAM), 300 rue de la Piscine, 38406 Saint Martin d’Heres, France*[email protected]
ABSTRACT
Quasars are the most luminous non-transient objects known and as a result they enable studiesof the Universe at the earliest cosmic epochs. Despite extensive efforts, however, the quasarULAS J1120+0641 at z = 7.09 has remained the only one known at z > 7 for more than half adecade1. Here we report observations of the quasar ULAS J134208.10+092838.61 (hereafterJ1342+0928) at redshift z = 7.54. This quasar has a bolometric luminosity of 4× 10¹³ times theluminosity of the Sun and a black hole mass of 8× 10⁸ solar masses. The existence of thissupermassive black hole when the Universe was only 690 million years old—just five percentof its current age—reinforces models of early black-hole growth that allow black holes withinitial masses of more than about 104 solar masses2,3 or episodic hyper-Eddington accretion4,5.We see strong evidence of absorption of the spectrum of the quasar redwards of the Lyman α
emission line (the Gunn-Peterson damping wing), as would be expected if a significant amount(more than 10 per cent) of the hydrogen in the intergalactic medium surrounding J1342+0928is neutral. We derive a significant fraction of neutral hydrogen, although the exact fractiondepends on the modelling. However, even in our most conservative analysis we find a fractionof more than 0.33 (0.11) at 68 per cent (95 per cent) probability, indicating that we are probingwell within the reionization epoch of the Universe.
We detected the quasar J1342+0928 as part of an on-going effort to find quasars at z > 7 by miningthree large-area surveys: the Wide-field Infrared Survey Explorer6 (ALLWISE), the United KingdomInfrared Telescope Infrared Deep Sky Survey (UKIDSS) Large Area Survey7, and the DECam LegacySurvey (DECaLS; http://legacysurvey.org/decamls). At redshifts of more than about 7, residual neutralhydrogen in the intergalactic medium (IGM) absorbs virtually all flux bluewards of the Lyman α (Lyα)emission line, which is redshifted to observed wavelengths of greater than about one micrometre, meaningthat quasars at these redshifts are not detectable in the optical bands. To identify quasars at redshifts
arX
iv:1
712.
0186
0v2
[as
tro-
ph.G
A]
6 J
ul 2
018

greater than 7, we therefore required a detection in both UKIDSS J and WISE W1 bands with a signal-to-noise ratio greater than 5 and no source in the DECaLS DR3 catalogue within 3′′. We also requireda non-detection in the DECaLS zDE-band image, as indicated by a flux of zDE,3σ − J > 2 determined byforced photometry (here zDE,3σ is the 3σ lower limit for the magnitude of the quasar in the DECaLSzDE-band image). Finally, we required a flat spectral energy distribution, which eliminates a large fractionof the most common contaminants of searches for quasars at redshifts of more than about 7: low-massbrown dwarfs in our Galaxy8. The survey photometry used to identify J1342+0928 is listed in ExtendedData Table 1.
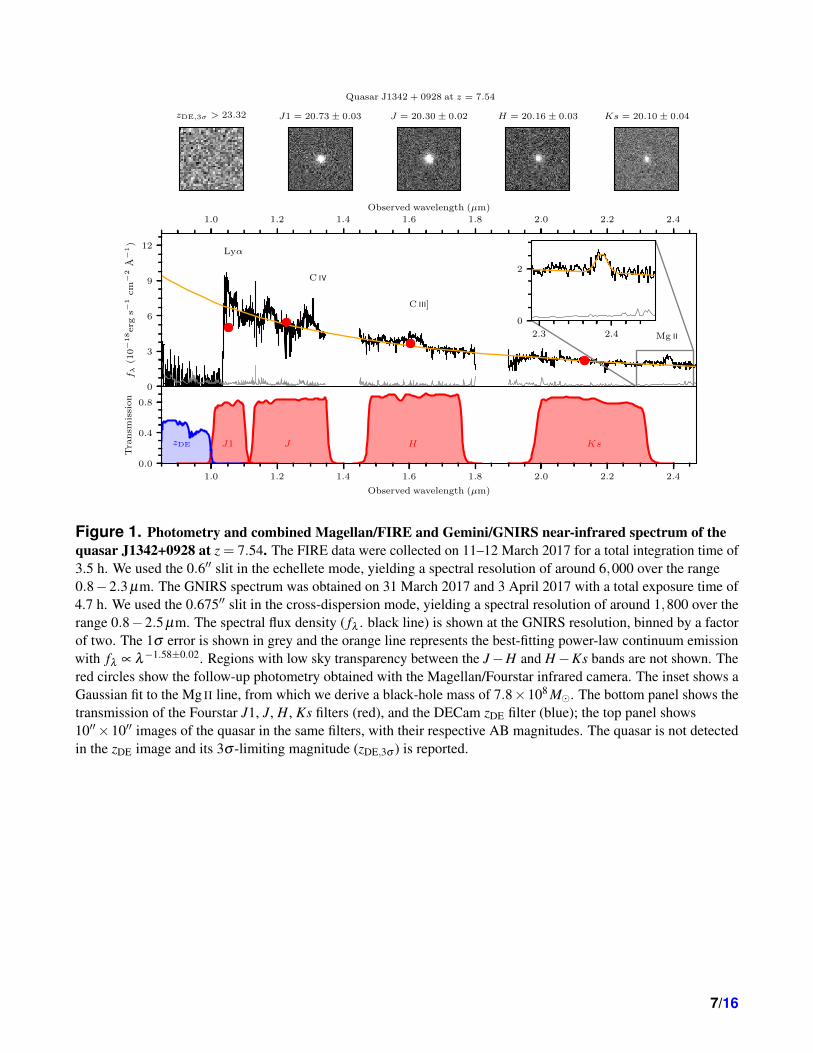
We confirmed J1342+ 0928 as a quasar with a 10 min spectrum with the Folded-port InfraRedEchellette (FIRE) spectrograph in prism mode at the Magellan 6.5 m Baade telescope at Las CampanasObservatory on 9 March 2017. To analyse the emission line properties in greater detail, we obtaineddeeper and higher-resolution spectra with FIRE, the Large Binocular Telescope (LBT) Utility Camerain the Infrared (LUCI) spectrograph at the Large Binocular Telescope, and the Gemini Near-InfraredSpectrograph (GNIRS) at the Gemini North telescope. The LUCI spectrum provided the first detection ofthe Mg II emission line at ∼2.4 µm but it was superseded by the higher-signal-to-noise ratio and largerwavelength coverage of the GNIRS spectrum. We also obtained deep follow-up photometry with theMagellan/Fourstar infrared camera on 19 March 2017. These data were used to bring the spectra to anabsolute flux scale, compensating for slit-losses. The combined spectrum and follow-up photometry ofJ1342+0928 are shown in Fig. 1.
The systemic redshift of this quasar is z = 7.5413±0.0007 (all error bars reported here correspond to1σ or the central 68% interval of the distribution), measured using IRAM/NOEMA observations of the[C II] 158 µm emission line from its host galaxy9. The redshift measured from a Gaussian fit to the Mg II
line (see Fig. 1) is 7.527±0.004, that is, blueshifted by 500±140km s−1 with respect to the systemicredshift. This is consistent with the velocity offsets observed10 in other quasars at z > 6. Adopting acosmology11 with a current value of the Hubble parameter of H0 = 67.7km s−1 Mpc−1, and cosmologicaldensity parameters ΩM = 0.307 and ΩΛ = 0.693, this quasar is situated at a cosmic age of just 690 Myrafter the Big Bang—that is, when the Universe was about 10% younger than at the redshift of the previousmost distant quasar known1—at times when conditions in the Universe were changing rapidly12.
The mass of the central black hole of the quasar can be estimated using the quasar luminosity and thefull-width at half maximum of its Mg II line, under the assumption that local scaling relations13 are stillvalid at high luminosity and high redshift14. The apparent ultraviolet magnitude measured at rest-frame1,450 A from the quasar spectrum is m1,450 = 20.34±0.04, which translates to an absolute magnitudeof M1,450 = −26.76± 0.04. To calculate the bolometric luminosity of the quasar (LBol), we first fit apower-law continuum to the spectrum and measure the luminosity at rest-frame 3,000A (L3,000). Wethen use the bolometric correction15 LBol = 5.15×L3,000, which results in LBol = 4.0×10¹³ L, whereL is the luminosity of the Sun. The Mg II line has a full-width at half maximum of 2,500+480
−320 kms−1,which together with the luminosity yields a black hole mass of 7.8+3.3
−1.9×10⁸ M, where M is the massof the Sun. The reported errors do not include the dominant systematic uncertainties in the local scalingrelations13 of 0.55 dex. The accretion rate of this quasar is consistent with Eddington accretion, with anEddington ratio of LBol/LEdd = 1.5+0.5
−0.4.The existence of supermassive black holes in the early Universe poses crucial questions about their
formation and growth processes. Observationally, the most distant quasars provide joint constraintson the mass of black-hole ‘seeds’ and their accretion efficiency. Assuming a typical matter-energyconversion efficiency4 of 10%, a black hole accreting at the Eddington rate grows exponentially ontimescales of around 50 Myr. In Fig. 2 we show the black-hole growth of three quasars assuming that
2/16

they accrete at the Eddington limit throughout their entire life: J1342+0928 at z = 7.54, J1120+0641 atz = 7.091, and SDSS J0100+2802 at z = 6.3316. These are the quasars that currently place the strongestconstraints on early black-hole growth. In all three cases, black-hole seeds of at least 1000 M are requiredby z = 40. The existence of these supermassive black holes at z > 7 is at odds with models of earlyblack-hole formation that do not involve either massive (more than about 104 M) seeds or episodes ofhyper-Eddington accretion.
The epoch of reionization was the last major phase transition in the Universe, when it changed frombeing completely neutral to ionized. The presence of complete Gunn-Peterson troughs17 in the spectraof z & 6 quasars indicates that there were only traces of neutral hydrogen (volume-averaged fraction ofneutral hydrogen xHI > 10−4) at z ≈ 6. Because the Lyα transition saturates at larger neutral fraction,Gunn-Peterson troughs are sensitive to only the end phases of reionization17. Therefore, to probe the epochwhen reionization occurred, we need alternative methods. During earlier stages of reionization (xHI > 0.1),neutral intergalactic matter should produce the characteristic damped Gunn-Peterson absorption redwardsof the Lyα emission line18 (this region of the spectrum is hereafter referred to as the damping wing).Evidence of this long-sought signature in quasar spectra has been reported only once, in the previousredshift record holder at z = 7.091, 19, 20.
To calculate the implied fraction of neutral hydrogen in the IGM (xHI), we must first estimate theshape of the unabsorbed continuum and then fit a parameterized absorption model using the data andcontinuum as inputs. This analysis is challenging because assumptions about the process of reionizationneed to be made and estimating the intrinsic strength of the Lyα emission for one single quasar is notstraightforward. The latter is particularly difficult for the case of J1342+0928, which has extreme lineblueshifts, which greatly reduces the number of lower-redshift quasars with which this source can becompared. We summarize our approach in Fig. 3: we follow previous work1, 20 to estimate the intrinsiccontinuum by searching for lower-redshift quasars with similar spectral features to J1342+ 0928 anda previously described method18 to obtain an estimate of the neutral fraction. The main result is thata significantly neutral IGM is necessary to reproduce the damping-wing profile of J1342+ 0928. Wefind xHI = 0.55+0.21
−0.18, with the 95% central interval of the xHI distribution of 0.26−0.93 (see Fig. 3). Toexplore how robust this result is, we consider an alternative model for the intrinsic emission from thequasar and two more elaborate models of the damping wing (Methods). All our analyses strongly favour ascenario in which the IGM surrounding J1342+0928 is significantly neutral, although the exact fractionof neutral hydrogen depends on the method (see Extended Data Table 2). Nevertheless, even our mostconservative method indicates xHI > 0.11 at 95% probability. Higher signal-to-noise ratio and largerwavelength coverage of the spectrum of the quasar is necessary to refine and strengthen this result.
An important caveat of our finding is that a similar absorption profile could also be caused by a singlehigh-column-density absorber (NH I > 2×1020 cm−2) in the immediate vicinity of the quasar18. Althoughwe find a large number of foreground heavy-element absorbers at lower redshifts, we find no evidencefor metal-line absorption at redshifts near that of the quasar. Adopting the methodology of Simcoe et al.(2012)21, a single Lyα absorber at z = 7.49±0.01 and NH I = 1020.50+0.32
−0.45 cm−2 could produce the dampingwing observed in J1342+0928. However, this absorber could have a metal abundance of at most 1/1,700times the solar value for oxygen (95% confidence), which would make it among the most distant andmetal-poor absorbers known21. The probability of intercepting a discrete absorber with NHI & 1020.50 cm−2
within 2000kms−1 of a quasar at z = 7.5 is less than 1%, based on the number density of such systems atlower redshifts22. This low probability supports the hypothesis that the absorption profile in J1342+0928is instead probing the neutral IGM gas in the epoch of reionization.
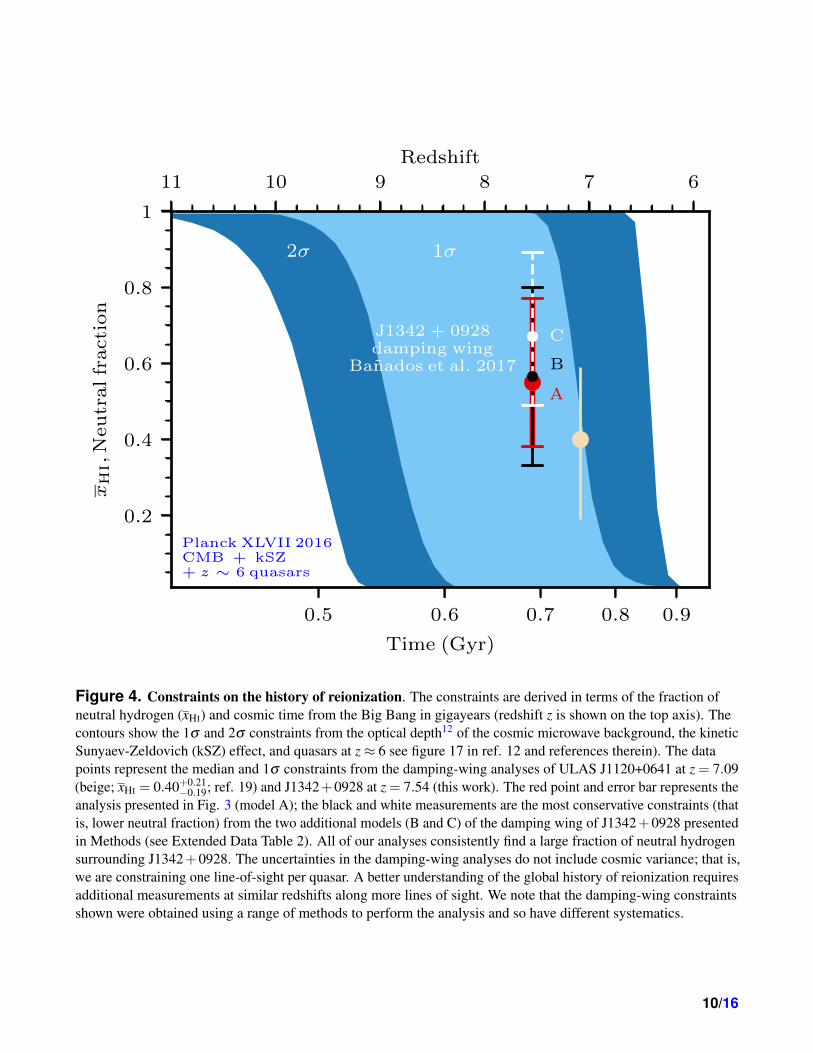
Finally, the fact that both known quasars at z > 7 show evidence of damping wings confirms that we
3/16
are starting to probe well within the epoch of reionization (see Fig. 4), in agreement with recent indicationsbased on the number density of Lyα-emitting galaxies at similar redshifts23 and results from the cosmicmicrowave background12.
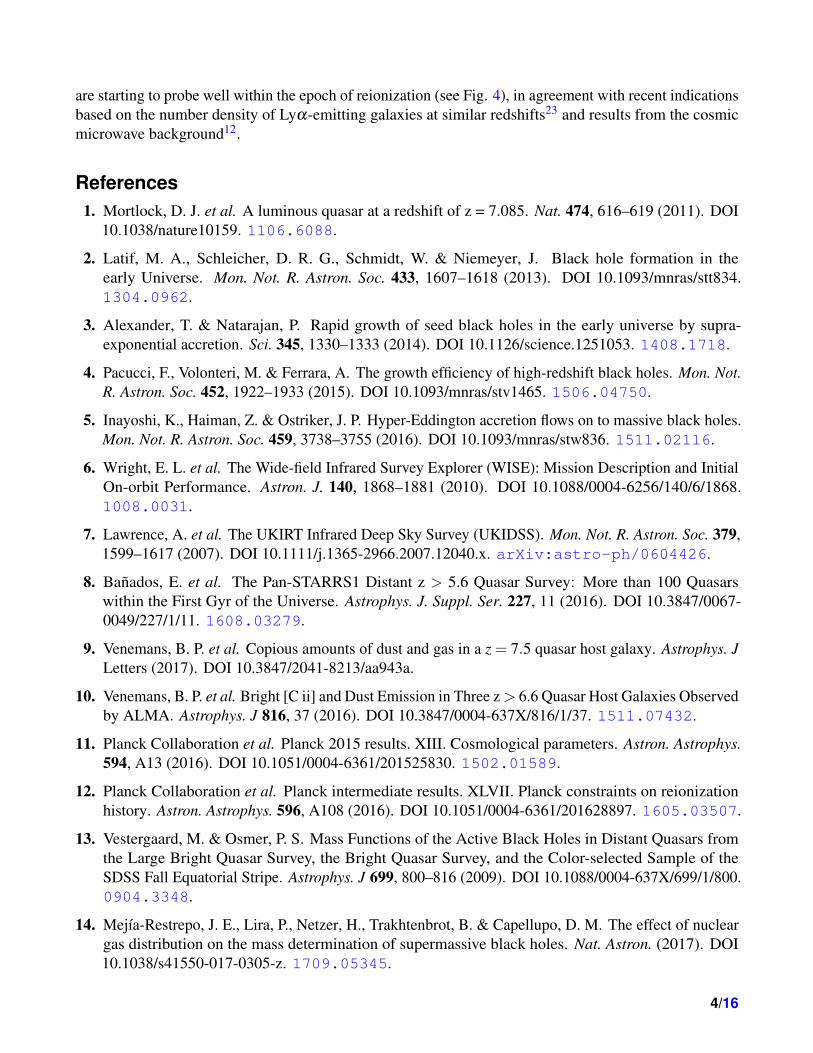
References1. Mortlock, D. J. et al. A luminous quasar at a redshift of z = 7.085. Nat. 474, 616–619 (2011). DOI
10.1038/nature10159. 1106.6088.
2. Latif, M. A., Schleicher, D. R. G., Schmidt, W. & Niemeyer, J. Black hole formation in theearly Universe. Mon. Not. R. Astron. Soc. 433, 1607–1618 (2013). DOI 10.1093/mnras/stt834.1304.0962.
3. Alexander, T. & Natarajan, P. Rapid growth of seed black holes in the early universe by supra-exponential accretion. Sci. 345, 1330–1333 (2014). DOI 10.1126/science.1251053. 1408.1718.
4. Pacucci, F., Volonteri, M. & Ferrara, A. The growth efficiency of high-redshift black holes. Mon. Not.R. Astron. Soc. 452, 1922–1933 (2015). DOI 10.1093/mnras/stv1465. 1506.04750.
5. Inayoshi, K., Haiman, Z. & Ostriker, J. P. Hyper-Eddington accretion flows on to massive black holes.Mon. Not. R. Astron. Soc. 459, 3738–3755 (2016). DOI 10.1093/mnras/stw836. 1511.02116.
6. Wright, E. L. et al. The Wide-field Infrared Survey Explorer (WISE): Mission Description and InitialOn-orbit Performance. Astron. J. 140, 1868–1881 (2010). DOI 10.1088/0004-6256/140/6/1868.1008.0031.
7. Lawrence, A. et al. The UKIRT Infrared Deep Sky Survey (UKIDSS). Mon. Not. R. Astron. Soc. 379,1599–1617 (2007). DOI 10.1111/j.1365-2966.2007.12040.x. arXiv:astro-ph/0604426.
8. Banados, E. et al. The Pan-STARRS1 Distant z > 5.6 Quasar Survey: More than 100 Quasarswithin the First Gyr of the Universe. Astrophys. J. Suppl. Ser. 227, 11 (2016). DOI 10.3847/0067-0049/227/1/11. 1608.03279.
9. Venemans, B. P. et al. Copious amounts of dust and gas in a z = 7.5 quasar host galaxy. Astrophys. JLetters (2017). DOI 10.3847/2041-8213/aa943a.
10. Venemans, B. P. et al. Bright [C ii] and Dust Emission in Three z > 6.6 Quasar Host Galaxies Observedby ALMA. Astrophys. J 816, 37 (2016). DOI 10.3847/0004-637X/816/1/37. 1511.07432.
11. Planck Collaboration et al. Planck 2015 results. XIII. Cosmological parameters. Astron. Astrophys.594, A13 (2016). DOI 10.1051/0004-6361/201525830. 1502.01589.
12. Planck Collaboration et al. Planck intermediate results. XLVII. Planck constraints on reionizationhistory. Astron. Astrophys. 596, A108 (2016). DOI 10.1051/0004-6361/201628897. 1605.03507.
13. Vestergaard, M. & Osmer, P. S. Mass Functions of the Active Black Holes in Distant Quasars fromthe Large Bright Quasar Survey, the Bright Quasar Survey, and the Color-selected Sample of theSDSS Fall Equatorial Stripe. Astrophys. J 699, 800–816 (2009). DOI 10.1088/0004-637X/699/1/800.0904.3348.
14. Mejıa-Restrepo, J. E., Lira, P., Netzer, H., Trakhtenbrot, B. & Capellupo, D. M. The effect of nucleargas distribution on the mass determination of supermassive black holes. Nat. Astron. (2017). DOI10.1038/s41550-017-0305-z. 1709.05345.
4/16

15. Richards, G. T. et al. Spectral Energy Distributions and Multiwavelength Selection of Type 1Quasars. Astrophys. J. Suppl. Ser. 166, 470–497 (2006). DOI 10.1086/506525. arXiv:astro-ph/0601558.
16. Wu, X.-B. et al. An ultraluminous quasar with a twelve-billion-solar-mass black hole at redshift 6.30.Nat. 518, 512–515 (2015). DOI 10.1038/nature14241. 1502.07418.
17. Becker, G. D. et al. Evidence of patchy hydrogen reionization from an extreme Lyα trough belowredshift six. Mon. Not. R. Astron. Soc. 447, 3402–3419 (2015). DOI 10.1093/mnras/stu2646.1407.4850.
18. Miralda-Escude, J. Reionization of the Intergalactic Medium and the Damping Wing of the Gunn-Peterson Trough. Astrophys. J 501, 15–22 (1998). DOI 10.1086/305799. astro-ph/9708253.
19. Greig, B., Mesinger, A., Haiman, Z. & Simcoe, R. A. Are we witnessing the epoch of reionisation at z =7.1 from the spectrum of J1120+0641? Mon. Not. R. Astron. Soc. (2016). DOI 10.1093/mnras/stw3351.1606.00441.
20. Bosman, S. E. I. & Becker, G. D. Re-examining the case for neutral gas near the redshift 7 quasarULAS J1120+0641. Mon. Not. R. Astron. Soc. 452, 1105–1111 (2015). DOI 10.1093/mnras/stv1336.1505.06880.
21. Simcoe, R. A. et al. Extremely metal-poor gas at a redshift of 7. Nat. 492, 79–82 (2012). DOI10.1038/nature11612. 1212.0548.
22. Songaila, A. & Cowie, L. L. The Evolution of Lyman Limit Absorption Systems to Redshift Six.Astrophys. J 721, 1448–1466 (2010). DOI 10.1088/0004-637X/721/2/1448. 1007.3262.
23. Zheng, Z.-Y. et al. First Results from the Lyman Alpha Galaxies in the Epoch of Reionization(LAGER) Survey: Cosmological Reionization at z ∼ 7. Astrophys. J 842, L22 (2017). DOI10.3847/2041-8213/aa794f. 1703.02985.
24. Gallerani, S., Fan, X., Maiolino, R. & Pacucci, F. Physical Properties of the First Quasars. Public.Astron. Soc. Aust. 34, e022 (2017). DOI 10.1017/pasa.2017.14. 1702.06123.
25. Paris, I. et al. The Sloan Digital Sky Survey Quasar Catalog: Twelfth data release. Astron. Astrophys.597, A79 (2017). DOI 10.1051/0004-6361/201527999. 1608.06483.
26. Fan, X. et al. Constraining the Evolution of the Ionizing Background and the Epoch of Reionizationwith z˜6 Quasars. II. A Sample of 19 Quasars. Astron. J. 132, 117–136 (2006). DOI 10.1086/504836.arXiv:astro-ph/0512082.
27. Eilers, A.-C. et al. Implications of z∼6 Quasar Proximity Zones for the Epoch of Reionization andQuasar Lifetimes. Astrophys. J 840, 24 (2017). DOI 10.3847/1538-4357/aa6c60. 1703.02539.
28. Suzuki, N., Tytler, D., Kirkman, D., O’Meara, J. M. & Lubin, D. Predicting QSO Continua in theLyα Forest. Astrophys. J 618, 592–600 (2005). DOI 10.1086/426062. astro-ph/0306577.
29. Paris, I. et al. A principal component analysis of quasar UV spectra at z ˜ 3. Astron. Astrophys. 530,A50 (2011). DOI 10.1051/0004-6361/201016233. 1104.2024.
30. Alvarez, M. A. & Abel, T. Quasar HII regions during cosmic reionization. Mon. Not. R. Astron. Soc.380, L30–L34 (2007). DOI 10.1111/j.1745-3933.2007.00342.x. astro-ph/0703740.
31. Davies, F. B., Furlanetto, S. R. & McQuinn, M. Quasar ionization front Lyα emission in aninhomogeneous intergalactic medium. Mon. Not. R. Astron. Soc. 457, 3006–3023 (2016). DOI10.1093/mnras/stw055. 1409.0855.
5/16

32. Lukic, Z. et al. The Lyman α forest in optically thin hydrodynamical simulations. Mon. Not. R.Astron. Soc. 446, 3697–3724 (2015). DOI 10.1093/mnras/stu2377. 1406.6361.
33. Mesinger, A., Furlanetto, S. & Cen, R. 21CMFAST: a fast, seminumerical simulation of the high-redshift 21-cm signal. Mon. Not. R. Astron. Soc. 411, 955–972 (2011). DOI 10.1111/j.1365-2966.2010.17731.x. 1003.3878.
34. Drovandi, C. C., Pettitt, A. N. & Lee, A. Bayesian Indirect Inference Using a Parametric AuxiliaryModel. ArXiv e-prints (2015). 1505.03372.
35. Bolton, J. S. et al. How neutral is the intergalactic medium surrounding the redshift z = 7.085quasar ULAS J1120+0641? Mon. Not. R. Astron. Soc. 416, L70–L74 (2011). DOI 10.1111/j.1745-3933.2011.01100.x. 1106.6089.
36. Foreman-Mackey, D., Hogg, D. W., Lang, D. & Goodman, J. emcee: The MCMC Hammer. PASP125, 306 (2013). DOI 10.1086/670067. 1202.3665.
37. Telfer, R. C., Zheng, W., Kriss, G. A. & Davidsen, A. F. The Rest-Frame Extreme-UltravioletSpectral Properties of Quasi-stellar Objects. Astrophys. J 565, 773–785 (2002). DOI 10.1086/324689.astro-ph/0109531.
Acknowledgments: We thank D. Ossip for his support with the FIRE echellete observations and A.Stephens for help preparing the GNIRS observations. This work is based on data collected with theMagellan Baade telescope, the Gemini North telescope (program GN-2017A-DD-4), the Large BinocularTelescope, and the IRAM/NOEMA interferometer. We are grateful for the support provided by the staff ofthese observatories. We acknowledge the use of the UKIDSS, WISE, and DECaLS surveys.
Author contributions: E.B., R.D., X.F., E.P.F., C.M., H.-W.R., D.S., B.P.V., F.Walter, F.Wang, and J.Y.discussed and planned the candidate selection and observing strategy, and analysed the data. E.B. selectedthe quasar and with D.S. obtained and analysed the discovery spectrum. R.A.S. provided the final FIREdata reduction. J.F.H. provided the final GNIRS data reduction. G.C.R. carried out the follow-up Fourstarobservations for this quasar. D.D.K. reduced the follow-up Fourstar data. J.M.W., B.P.V., and F.Waltercontributed with the observations and analysis of the IRAM/NOEMA data. The damping wing analyseswere carried out by E.B. (model A), F.B.D. and J.F.H (model B) and R.A.S. and M.L.T. (model C).F.B.D. and J.F.H. performed the PCA continuum modelling. R.A.S. performed the analysis to find thecharacteristics of a single absorber that could cause the absorption profile of the quasar. E.B. led the teamand prepared the manuscript. All co-authors discussed the results and provided input to the paper and dataanalysis.
Author information: Reprints and permissions information is available at www.nature.com/reprints. Theauthors declare no competing financial interests. Correspondence and requests for materials should beaddressed to [email protected].
6/16
1.0 1.2 1.4 1.6 1.8 2.0 2.2 2.4
Observed wavelength (µm)
0.0
0.4
0.8
Tra
nsm
issi
on
J1 J H KszDE
1.0 1.2 1.4 1.6 1.8 2.0 2.2 2.4
Observed wavelength (µm)
0
3
6
9
12
fλ
(10−
18erg
s−1
cm−
2A−
1)
Lyα
C IV
C III]
Mg II2.3 2.4
0
2
zDE,3σ > 23.32 J1 = 20.73± 0.03 J = 20.30± 0.02 H = 20.16± 0.03 Ks = 20.10± 0.04
Quasar J1342 + 0928 at z = 7.54
Figure 1. Photometry and combined Magellan/FIRE and Gemini/GNIRS near-infrared spectrum of thequasar J1342+0928 at z = 7.54. The FIRE data were collected on 11–12 March 2017 for a total integration time of3.5 h. We used the 0.6′′ slit in the echellete mode, yielding a spectral resolution of around 6,000 over the range0.8−2.3 µm. The GNIRS spectrum was obtained on 31 March 2017 and 3 April 2017 with a total exposure time of4.7 h. We used the 0.675′′ slit in the cross-dispersion mode, yielding a spectral resolution of around 1,800 over therange 0.8−2.5 µm. The spectral flux density ( fλ . black line) is shown at the GNIRS resolution, binned by a factorof two. The 1σ error is shown in grey and the orange line represents the best-fitting power-law continuum emissionwith fλ ∝ λ−1.58±0.02. Regions with low sky transparency between the J−H and H−Ks bands are not shown. Thered circles show the follow-up photometry obtained with the Magellan/Fourstar infrared camera. The inset shows aGaussian fit to the Mg II line, from which we derive a black-hole mass of 7.8×10⁸ M. The bottom panel shows thetransmission of the Fourstar J1, J, H, Ks filters (red), and the DECam zDE filter (blue); the top panel shows10′′×10′′ images of the quasar in the same filters, with their respective AB magnitudes. The quasar is not detectedin the zDE image and its 3σ -limiting magnitude (zDE,3σ ) is reported.
7/16

51015202530354045
Redshift
103
104
105
106
107
108
109
1010
Bla
ckhole
mass
(M
)
LBol = LEdd
0.55 dexerror bar
J1342 + 0928
7.8 × 10⁸ M at z = 7.54
Banados et al. 2017
J1120 + 0641
2.0 × 10⁹ M at z = 7.09
Mortlock et al. 2011
J0100 + 2802
1.2 × 10¹⁰ M at z = 6.33
Wu et al. 2015
Other z ∼ 6 quasars
0.07 0.1 0.15 0.25 0.4 0.7 1
Time (Gyr)
Figure 2. Black-hole growth of three of the highest-redshift and most-massive quasars in the earlyUniverse. J1342+0928 at z = 7.54 has a black-hole mass of 7.8×10⁸ M, J1120+0641 at z = 7.09 has a black-holemass of 2.0×10⁹ M (ref. 1) , and J0100+2802 at z = 6.33 has a black-hole mass of 1.2×10¹⁰ M (ref. 16). Thethree curves are normalized to the observed black-hole mass and redshift of these quasars (data points withstatistical error bars). The black-hole growth is modelled as MBH = MBH,seed× exp(time/50Myr), where t is timeand we have assumed that the black holes are accreting at the Eddington limit (LBol = LEdd) with a radiativeefficiency of 10%. The pale blue circles show a compilation24 of black-hole masses of quasars at z≈ 6. The greyerror bar at the bottom right represents dominant uncertainty, which is due to systematics in the local scaling relationthat is used to estimate the black-hole mass of quasars at these redshifts13. Ignoring this systematic uncertainty andassuming that the local relations apply to these extremely distant and luminous quasars, black-hole mass seeds moremassive than 1,000M by z = 40 are necessary to grow the observed supermassive black holes in all three cases.
8/16

1200 1400 1600 1800 2000 2200 2400 2600 2800
Rest− frame wavelength (A)
0
3
6
9
12
fλ
Lyα
C IV
C III]
Mg II
a
J1342 + 0928 SDSS matched composite
1190 1200 1210 1220 1230 1240 1250 1260
Rest− frame wavelength (A)
0
3
6
9
12
fλ
b
0.0 0.5 1.0
xHI
0.5
1.0
1.5
2.0
PD
F
1σ 2σ2σ
0.3
8
0.7
7
0.2
7
0.9
4
c
1 1.2 1.4 1.6 1.8 2 2.2 2.4
Observed wavelength (µm)
1.02 1.04 1.06
Observed wavelength (µm)
Figure 3. Continuum emission and damping-wing modelling in the spectrum of J1342+0928 (in units of10−18 erg s−1 cm−2 A−1). a, The quasar spectrum (black and grey) is the same at that shown in Fig. 1. Thecontinuum model (red) is constructed by averaging the SDSS DR12 quasars25 that were not flagged asbroad-absorption line quasars in the redshift interval 2.1 < zMg II < 2.4, and that have a median signal-to-noise ratiogreater than 5 in the C IV region. The subsample was further refined by considering only SDSS quasars with a C IV
blueshift with respect to Mg II within 1,000kms−1 of that observed in J1342+0928 (6,090±275kms−1) and withrest-frame C IV equivalent widths consistent at the 3σ level with the C IV equivalent width of J1342+0928(11.3±0.8A). This yielded 46 ‘analogue’ quasars. Their continua were fitted individually by a slowly varyingspline to remove strong absorption systems and noisy regions, and to interpolate between high-transmission peaksbluewards of Lyα . We then normalized each spectrum at 1,290A and averaged them. This composite spectrum isshown in red, and reproduces fairly well the spectral features of J1342+0928. Assuming the systemic redshiftderived from [C II], the proximity zone of J1342+0928, which is defined26, 27 as the physical radius at which thetransmission drops to 10%, is 1.3 Mpc. b, Close-up of the Lyα region, showing a strong absorption profile that canbe modelled as a damping wing caused by a significantly neutral IGM. The black and grey curves are the FIREspectrum and 1σ error, binned by a factor of two. The pale blue lines show regions masked out due to interveningabsorption systems. The thick red line is the SDSS-matched composite spectrum (see a); the thin red lines are usedas models of intrinsic emission (100 out of 3,000 shown). To take into account the error in the prediction for anygiven quasar, these models consist of bootstrapped mean composite spectra plus a relative error vector (SDSS quasar- mean)/mean chosen randomly from the 46 possible error vectors. The blue lines represent the expected18 dampingwing assuming a fully ionized proximity zone (region between the vertical dashed lines), a constant neutral fractionxHI between the end of the proximity zone and z = 7.0, and a fully ionized IGM at z < 7. The exact choice of thetransition redshift does not greatly affect the results. The green dotted line is the absorption that would be caused bya single absorber with NHI = 1020.5 cm−2 at z = 7.49. c, The derived probability density function (PDF) for xHI,with a median value and 68% central interval of xHI = 0.56+0.21
−0.18. In Methods we present one additional model of theintrinsic emission from the quasar and two additional models of the damping wing. All of our analyses require asignificantly neutral IGM to reproduce the damping-wing profile in the spectrum of J1342+0928 (see ExtendedData Table 2).
9/16
67891011
Redshift
0.2
0.4
0.6
0.8
1
xH
I,N
eutr
alfr
acti
on
2σ 1σ
A
B
CJ1342 + 0928damping wing
Banados et al. 2017
Planck XLVII 2016CMB + kSZ+ z ∼ 6 quasars
0.5 0.6 0.7 0.8 0.9
Time (Gyr)
Figure 4. Constraints on the history of reionization. The constraints are derived in terms of the fraction ofneutral hydrogen (xHI) and cosmic time from the Big Bang in gigayears (redshift z is shown on the top axis). Thecontours show the 1σ and 2σ constraints from the optical depth12 of the cosmic microwave background, the kineticSunyaev-Zeldovich (kSZ) effect, and quasars at z≈ 6 see figure 17 in ref. 12 and references therein). The datapoints represent the median and 1σ constraints from the damping-wing analyses of ULAS J1120+0641 at z = 7.09(beige; xHI = 0.40+0.21
−0.19; ref. 19) and J1342+0928 at z = 7.54 (this work). The red point and error bar represents theanalysis presented in Fig. 3 (model A); the black and white measurements are the most conservative constraints (thatis, lower neutral fraction) from the two additional models (B and C) of the damping wing of J1342+0928 presentedin Methods (see Extended Data Table 2). All of our analyses consistently find a large fraction of neutral hydrogensurrounding J1342+0928. The uncertainties in the damping-wing analyses do not include cosmic variance; that is,we are constraining one line-of-sight per quasar. A better understanding of the global history of reionization requiresadditional measurements at similar redshifts along more lines of sight. We note that the damping-wing constraintsshown were obtained using a range of methods to perform the analysis and so have different systematics.
10/16

MethodsDamping-wing modellingTo calculate the neutral fraction xHI of the IGM, we must first estimate the intrinsic emission from thequasar. After that, a model is fitted that reproduces the observed damping wing in the Lyα region. Wehave shown that the data strongly suggest that the IGM surrounding the quasar J1342+0928 at z = 7.54is significantly neutral: xHI = 0.56+0.21
−0.18 (see Fig. 3). Recovering the intrinsic continuum of J1342+0928is particularly challenging because of its extreme emission-line blueshifts, which are not well representedin matched composites at lower redshifts. Specifically, in the analysis presented here we found only 46lower-redshift quasars with similar C IV blueshifts and equivalent widths. Furthermore, we have modelledthe damping wing following a prescription18 that assumes a homogeneous neutral IGM between theproximity zone of the quasar and an arbitrary redshift, which we set to zEND = 7.0, and that considers theUniverse to be completely ionized below that redshift. We remark that given that the damping wing isproduced by the IGM in the environment of the quasar, the results are insensitive to the exact value ofzEND. The results change by less than 1% even in the extreme case of zEND = 6.0. Hereafter, we refer tothe IGM model presented in the main text as model A.
Here we reanalyse the data and present an additional model of the intrinsic emission from the quasarusing a principal component analysis (PCA) decomposition. Furthermore, we introduce two completelyindependent methods to model the damping wing using the intrinsic emission from the quasar obtainedin the main text (SDSS matched composite, hereafter continuum 1) and from the PCA model (hereaftercontinuum 2; described in more detail below) as inputs. In this way, we test how sensitive our conclusionsare to different assumptions and systematics in the analysis.
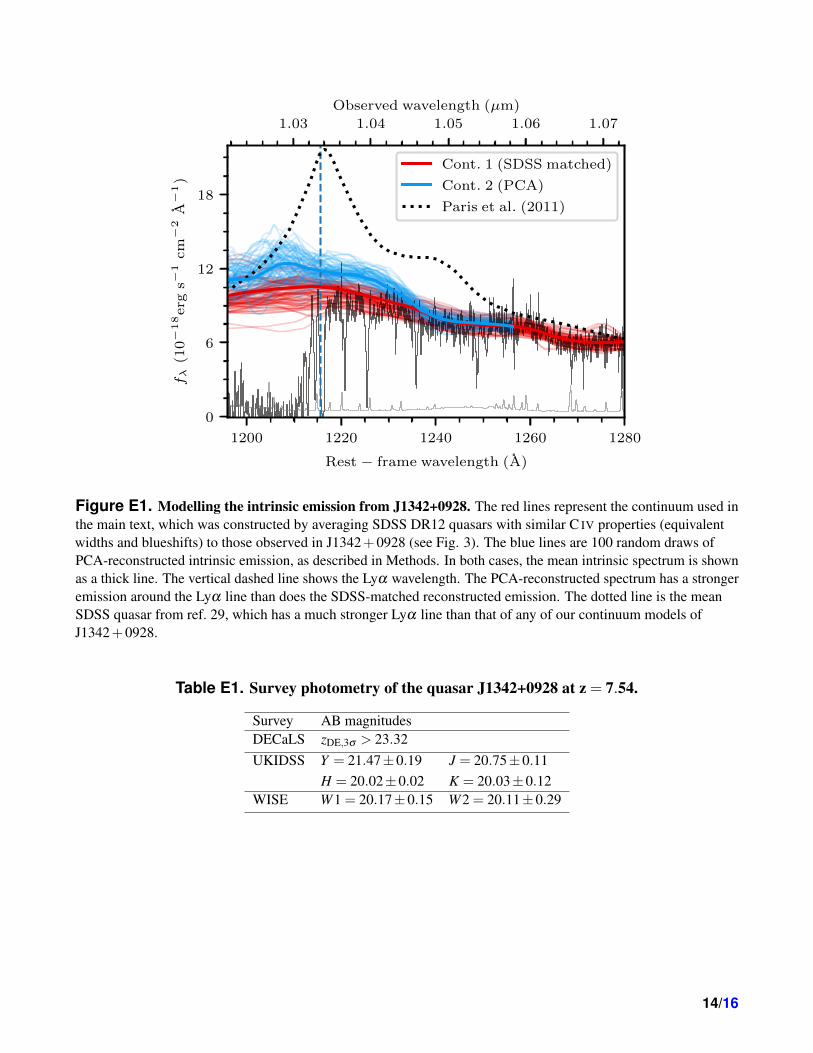
PCA modelIn this model, we predict the intrinsic quasar continuum in the Lyα region (λrest < 1,260 A) on thebasis of the remainder of the spectrum using a PCA analysis trained on 12,764 quasar spectra fromthe SDSS/BOSS DR12 quasar catalogue25. Quasars in the training set were chosen to have signal-to-noise ratios greater than 7 at λrest < 1,285 A and to lie at redshifts 2.1 < z < 2.5 such that the BOSSspectral range comfortably covered the Lyα region (down to λrest = 1,190 A) and the Mg II region upto λrest ≈ 2,800 A, similar to the rest-frame spectral coverage of J1342+0928. We constructed red-sideand blue-side PCA basis spectra from the training set after applying automated spline fits to recoverthe unabsorbed continuum. For each quasar in the training set, we fitted for the PCA coefficients and atemplate redshift simultaneously, placing each quasar into a common “PCA redshift frame” independentof (but largely similar to) their catalogue redshifts. We used these fits to define the matrix projection fromred-side to blue-side PCA coefficients as in Suzuki et al. (2005)28 and Paris et al. (2011)29. We then fittedthe red-side PCA coefficients of J1342+0928 in the same way as the training set. To estimate the bias anduncertainty of the continuum fit for quasars similar to J1342+0928, we measured the relative continuumerror for the 1% of quasars in the training set with the most similar red-side PCA coefficients. The relativeuncertainty in the Lyα region for this subset was found to be about 7%.
In Fig. E1 we compare the intrinsic Lyα emission from the quasar reconstructed by both the PCA andSDSS-matching analyses. Continuum 2 predicts a slightly stronger emission in the Lyα region, but inboth cases the emission is much weaker than for an average low-redshift SDSS quasar.
Damping wingUsing continuum 2 (PCA) as input for model A, we require an almost completely neutral Universe(xHI ≈ 1) to model the damping wing in the spectrum of J1342+ 0928. This is driven by the higher
11/16

intrinsic flux in the Lyα region of continuum 2. We would obtain an even more dramatic result if wenaively used an average SDSS quasar as input, which would have a much stronger Lyα emission line (Fig.E1). These results seem to reinforce our finding that the Universe is significantly neutral at z≈ 7.5. Toassess whether this result depends on the method used to reproduce the damping wing, we now introducetwo more elaborate methods (hereafter models B and C).
Model BIn this model, we place the quasar within simulated massive dark-matter haloes at z = 7.5, which in turnpopulate large-scale over-densities that are already ionized by galaxies before the quasar turns on30. Thedamping-wing strength is then sensitive to the distance to the nearest neutral patch set by the morphologyof reionization and to the output of ionizing photons from J1342+0928. Small proximity zones can resulteither from a high xHI in the surrounding IGM or from a short active lifetime of the central quasar27.We modelled the residual H I absorption inside the proximity zone of the quasar and the damping-wingprofile from the neutral IGM by simulating the radiative transfer of ionizing photons through the IGM31
from the locations of massive dark-matter haloes using a realistic distribution of densities from a large-volume hydrodynamical simulation32. The inside-out morphology of reionization as a function of xHI
was computed from independent large-volume semi-numerical simulations of patchy reionization using amodified version of the 21cmFAST code33.
The neutral-hydrogen fraction xHI and quasar lifetime tQ were then jointly constrained via a Bayesianapproach using pseudo-likelihood in the spirit of indirect inference methods (see, for example, Drovandiet al. 201534). We define our pseudo-likelihood as the product of independent flux PDFs evaluated inspectral bins of 500 km s−1, and treat the set of maximum pseudo-likelihood parameter values (xHI and tQ)as a summary statistic.
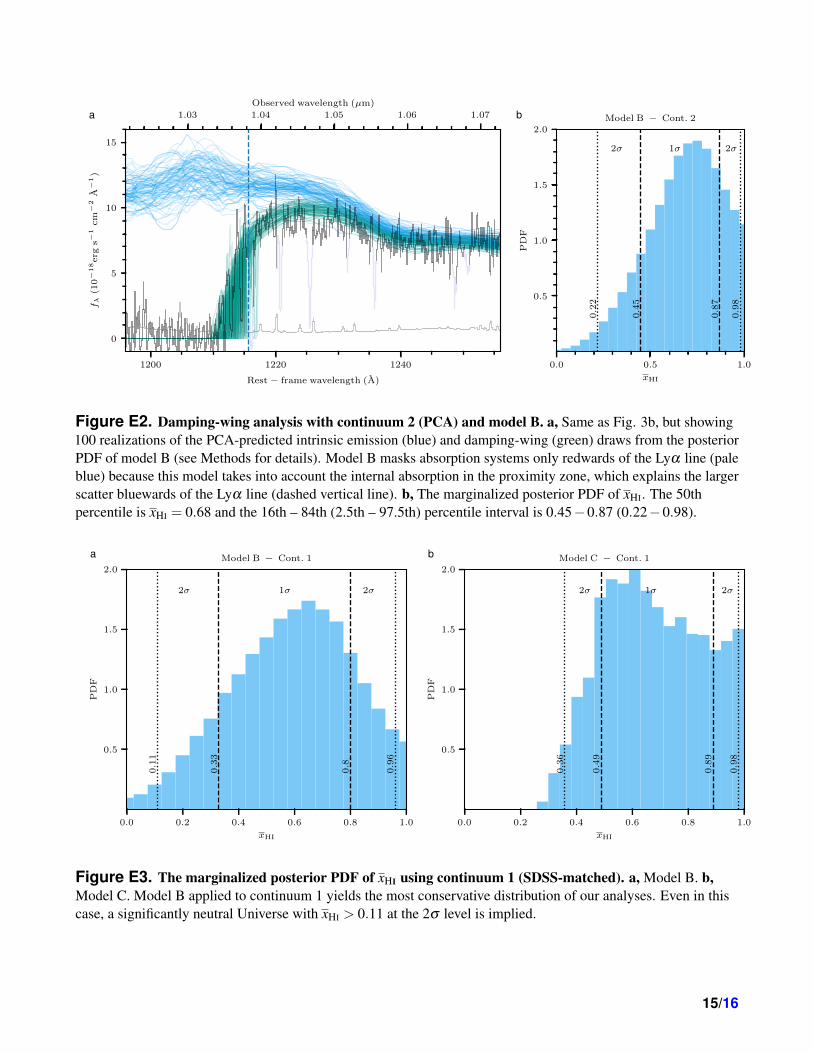
We applied model B to the quasar continuum obtained from the PCA method described above(continuum 2), using millions of forward-modelled mock spectra, including a self-consistent treatment ofthe highly covariant continuum (determined from our PCA training set), to compute the posterior PDF.Marginalizing over quasar lifetimes with a log-uniform prior in the range 105 < tQ < 108 yr, the central68% (95%) credible interval for xHI is 0.45−0.87 (0.22−0.98). We show a representation of model Busing the intrinsic emission from continuum 2 and the associated marginalized posterior PDF of xHI in Fig.E2.
If we apply model B using continuum 1 as input, then the central 68% (95%) credible interval for xHI
is 0.33−0.80 (0.11−0.96); we show the associated posterior PDF of xHI in Fig. E3a.
Model CIn this model, the IGM absorption profile is modelled on the basis of the methods outlined in Bolton etal. (2011)35. After the quasar turns on, it evacuates an expanding ionized region (the proximity zone)within the surrounding IGM. Its absorption profile is then specified by four parameters: (1) the ionizingluminosity of the quasar (constrained by photometry), (2) the size of the proximity zone (which is related tothe age of the quasar), (3) the mean density of the surrounding medium, and (4) xHI outside the proximityzone. We use an affine-invariant Markov Chain Monte Carlo (MCMC) solver36 to fit these four parameters.The ionizing luminosity of the quasar is estimated using the power-law indices from Telfer et al. (2002)37
and the quasar magnitudes from this work. We impose a Gaussian prior with a width determined from theerrors on the power-law index from ref. 37; the remaining parameters are all given flat priors.
Before fitting our model, we applied an automated clipping procedure to remove spectral absorptionfeatures. We divided the normalized spectrum into bins of size 2.5 A in the rest frame, and interpolated aB-spline through the mean flux in each bin. Any pixels with flux values more than 3σ below or 7σ above
12/16
the interpolated values were masked. This procedure was repeated until convergence was achieved. Then,we ran two MCMC realizations, one for each mean quasar continuum created above (1 and 2; see Fig.E1). For each continuum model, we ran 100 chains of 2,000 steps each, and used the final 200 steps toconstruct the posteriors (the burn-in occurs within the first 250 steps or so).
For continuum 1, the central 68% (95%) credible interval for xHI is 0.49− 0.89 (0.31− 0.99); itsposterior PDF is shown in Fig. E3b. By contrast, model C requires a neutral Universe (xHI ∼ 1) ifcontinuum 2 is used as input, in line with the result obtained using model A.
Final remarksIn Extended In Extended Data Table 2 we summarize the constraints on the neutral fraction obtained fromall IGM modelling methods used here with the two different models of the intrinsic emission from thequasar. In all cases we recover a large neutral fraction in the IGM. We show a comparison between thesethree models inf Fig. 4. To be conservative, we show the constraints obtained by using continuum 1 asinput because it predicts weaker emission around the Lyα line than does continuum 2 (Fig. E1) and solower neutral fractions are needed to explain the absorption profile in J1342+0928 (Extended Data Table2). The most conservative of the analysis is model B, which implies xHI > 0.11 at the 2σ level (see Fig.E3a)—one of strongest constraints yet in the history of reionization.
Data availability: The datasets generated and analysed during this study are available from the corre-sponding author on reasonable request.
Code availability: We have opted not to make available the codes used to model the damping wingbecause they will be described in more detail and made available in forthcoming papers (model B, F.B.D.et al., manuscript in preparation; model C, M.L.T et al., manuscript in preparation).
13/16
1200 1220 1240 1260 1280
Rest− frame wavelength (A)
0
6
12
18fλ
(10−
18erg
s−1
cm−
2A−
1)
Cont. 1 (SDSS matched)
Cont. 2 (PCA)
Paris et al. (2011)
1.03 1.04 1.05 1.06 1.07
Observed wavelength (µm)
Figure E1. Modelling the intrinsic emission from J1342+0928. The red lines represent the continuum used inthe main text, which was constructed by averaging SDSS DR12 quasars with similar C IV properties (equivalentwidths and blueshifts) to those observed in J1342+0928 (see Fig. 3). The blue lines are 100 random draws ofPCA-reconstructed intrinsic emission, as described in Methods. In both cases, the mean intrinsic spectrum is shownas a thick line. The vertical dashed line shows the Lyα wavelength. The PCA-reconstructed spectrum has a strongeremission around the Lyα line than does the SDSS-matched reconstructed emission. The dotted line is the meanSDSS quasar from ref. 29, which has a much stronger Lyα line than that of any of our continuum models ofJ1342+0928.
Table E1. Survey photometry of the quasar J1342+0928 at z = 7.54.
Survey AB magnitudesDECaLS zDE,3σ > 23.32UKIDSS Y = 21.47±0.19 J = 20.75±0.11
H = 20.02±0.02 K = 20.03±0.12WISE W1 = 20.17±0.15 W2 = 20.11±0.29
14/16
1200 1220 1240
Rest− frame wavelength (A)
0
5
10
15
fλ
(10−
18erg
s−1
cm−
2A−
1)
a
0.0 0.5 1.0
xHI
0.5
1.0
1.5
2.0
PD
F
1σ 2σ2σ
0.4
5
0.8
7
0.2
2
0.9
8
b Model B − Cont. 21.03 1.04 1.05 1.06 1.07
Observed wavelength (µm)
Figure E2. Damping-wing analysis with continuum 2 (PCA) and model B. a, Same as Fig. 3b, but showing100 realizations of the PCA-predicted intrinsic emission (blue) and damping-wing (green) draws from the posteriorPDF of model B (see Methods for details). Model B masks absorption systems only redwards of the Lyα line (paleblue) because this model takes into account the internal absorption in the proximity zone, which explains the largerscatter bluewards of the Lyα line (dashed vertical line). b, The marginalized posterior PDF of xHI. The 50thpercentile is xHI = 0.68 and the 16th – 84th (2.5th – 97.5th) percentile interval is 0.45−0.87 (0.22−0.98).
0.0 0.2 0.4 0.6 0.8 1.0
xHI
0.5
1.0
1.5
2.0
PD
F
1σ 2σ2σ
0.3
3
0.8
0.1
1
0.9
6
a Model B − Cont. 1
0.0 0.2 0.4 0.6 0.8 1.0
xHI
0.5
1.0
1.5
2.0
PD
F
1σ2σ 2σ0.4
9
0.8
9
0.3
6
0.9
8
b Model C − Cont. 1
Figure E3. The marginalized posterior PDF of xHI using continuum 1 (SDSS-matched). a, Model B. b,Model C. Model B applied to continuum 1 yields the most conservative distribution of our analyses. Even in thiscase, a significantly neutral Universe with xHI > 0.11 at the 2σ level is implied.
15/16
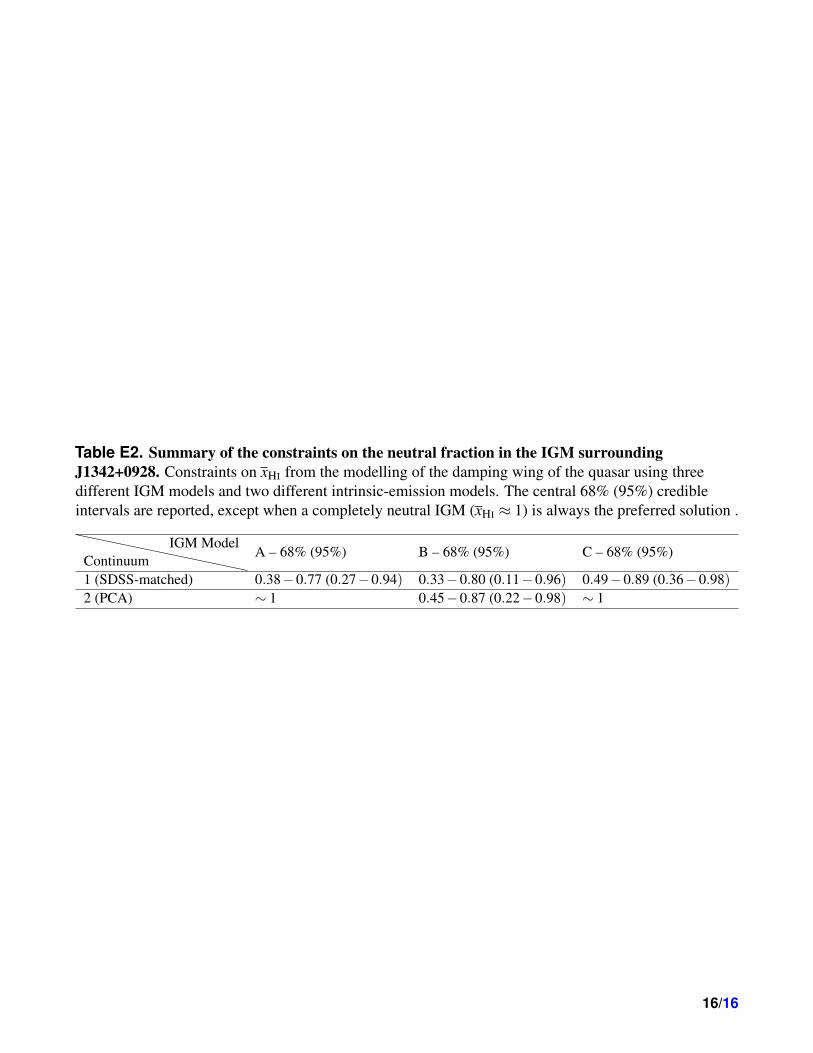
Table E2. Summary of the constraints on the neutral fraction in the IGM surroundingJ1342+0928. Constraints on xHI from the modelling of the damping wing of the quasar using threedifferent IGM models and two different intrinsic-emission models. The central 68% (95%) credibleintervals are reported, except when a completely neutral IGM (xHI ≈ 1) is always the preferred solution .
ContinuumIGM Model
A – 68% (95%) B – 68% (95%) C – 68% (95%)
1 (SDSS-matched) 0.38−0.77 (0.27−0.94) 0.33−0.80 (0.11−0.96) 0.49−0.89 (0.36−0.98)2 (PCA) ∼ 1 0.45−0.87 (0.22−0.98) ∼ 1
16/16