an abstract of the dissertation of - ir… · an abstract of the dissertation of medagama liyanage...
TRANSCRIPT

AN ABSTRACT OF THE DISSERTATION OF
Medagama Liyanage Amila Udayanga Liyanage for the degree of Doctor of
Philosophy in Chemistry presented on June 9, 2015.
Title: Synthesis of Intercalation Compounds and Nanocomposites of Inorganic
Layered Hosts.
Abstract approved:
_____________________________________________________________________
Michael M. Lerner
Novel synthetic strategies are developed to prepare new intercalation
compounds and nanocomposites with several layered hosts (NiPS3, Na-
montmorillonite, MoS2 and MoO3). In these products, alkali metals are ionic
intercalates and linear polymers, dendrimers or amines act as co-intercalates. In
addition to new synthetic approaches, new structures are identified and characterized.
A template synthesis method to prepare NiPS3/polymer nanocomposites is
reported for the first time. Polymers studied were polyethylene oxide (PEO),
polyethylenimine (PEI), polyvinyl alcohol (PVA) and polyvinylpyrrolidone (PVP).
NiPS3/PEO nanocomposites prepared by this template method contain polymer
monolayers (d = 0.42 nm) between host layers, in contrast to the polymer bilayers
reported in previous reports using a topotactic method. Packing fraction calculations
reveals that the interlayer space is denser for template synthesized NiPS3/PEO than
for the topotactically-derived MPS3/PEO nanocomposites (M = Ni, Fe, Cd, and Mn).
NiPS3/PEI, NiPS3/PVA and NiPS3/PVP nanocomposites were prepared for the first
time and also have polymer monolayers between host layers (d = 0.41, 0.42 and
1.56 nm, respectively). The monomer unit / NiPS3 formula ratio is ~ 1 for PEO, PEI
and PVA nanocomposites and ~ 0.5 for PVP nanocomposites. More dilute conditions,
more polar solvents, and longer aging times increase the crystallite size of the
obtained products. Reaction progress studies indicate that the P2S64-
and Ni2+
concentrations in the reaction mixture govern nanocomposite nucleation and growth.
Intercalated nanocomposites with lower generation (G0.0−2.0)
polyamidoamine (PAMAM) dendrimers and Na-montmorillonite (Na-MMT) are
synthesized using an exfoliation–adsorption method. This is the first report of the
G0.0 and G1.0 PAMAM/Na-MMT nanocomposites and of a structurally-ordered
G2.0 PAMAM/Na-MMT nanocomposite. The structures obtained depend on the
PAMAM generation and the starting reactant ratio. The spherical PAMAM in
aqueous medium transforms to a highly flattened conformation after incorporation
between the host layers. G0.0 PAMAM forms only monolayer galleries (d = 0.42
nm), while G2.0 PAMAM forms monolayers, bilayers (d = 0.84 nm), and mixed
phase structures at lower, higher, and intermediate, organic content, respectively, and
exhibits an interesting monolayer to bilayer transition. G1.0 PAMAM shows
intermediate behavior, with a monolayer to mixed-phase transition observed at the
reactant ratios studied. This is the first report of a monolayer arrangement for
PAMAM/clay nanocomposites. The maximum organic contents of G0.0 PAMAM
monolayer and G2.0 PAMAM bilayer nanocomposites are ∼7% and ∼14%
respectively, and these materials have ~2 times lower packing fractions (0.31−0.32)
than for linear polymer intercalate nanocomposites of Na-MMT. Under acidic
conditions all these nanocomposites form only monolayer galleries, which is ascribed
to the stronger electrostatic attraction between negatively charged MMT layers and
protonated PAMAM. Acidic conditions also slow the rate of formation of the
nanocomposites and generate more ordered products. The Na+ ions in the Na-MMT
structure play a significant role in PAMAM/Na-MMT nanocomposite formation.
Both Na-MMT and PAMAM structural units are preserved in the nanocomposites
obtained.
Electride solutions obtained by dissolution of Na(m) in ethylenediamine (en)
are used for the first time to generate MoS2 intercalation compounds with Na and en
as intercalate and cointercalate, respectively. Two new phases, labeled α and , have
d = 0.35 and 0.57 nm, respectively; the different gallery dimensions are ascribed to
parallel vs. perpendicular orientations of en in the galleries. The phase structure has
not been reported previously in any MS2 intercalation compounds. The intercalation
reaction proceeds via the formation of a metastable kinetic product, the phase, and
the subsequent generation of the thermodynamically stable α phase. Lower electride
concentrations, lower reaction temperatures and shorter reaction times favor
production of the phase. The products obtained have compositions of
Na0.2–0.3MoS2.0.3–0.4en with a larger packing fraction than the structurally analogous
A-en-GICs (A = alkali metal, GIC = Graphite intercalation compound). The
electrochemical reduction of MoS2 in en/NaPF6 does not result in these intercalation
reactions.

The incorporation of dendrimers into MoO3 is reported for the first time.
PAMAM/MoO3 nanocomposites are synthesized using an exfoliation - adsorption
method. G0.0 PAMAM only forms monolayers (d = ~ 0.5 nm) between MoO3
layers and G2.0 PAMAM forms both monolayer and bilayers (d = ~ 0.7-0.8 nm). In
addition to these two structures, a third unknown phase is observed with a much
larger gallery expansion (d = ~ 1.4 nm). These nanocomposites have a comparable
structures, compositions (12-14% organic component for G0.0 monolayer and 22-
25% for G2.0 bilayer) and packing fractions (0.5-0.7 for monolayer and 0.7-0.9 for
bilayer) to those in the previously reported linear polymer/MoO3 nanocomposites.
In the above studies, analyses by powder X-ray diffraction (PXRD) are
supported by compositional data from thermogravimetric analyses (TGA) and
structural optimization (Gaussian). Additionally, the product morphologies, surface
properties and constituents are evaluated using scanning electron microscopy (SEM),
energy-dispersive X-ray spectroscopy (EDS), and Fourier transform infrared (FTIR)
and Raman spectroscopies. UV-visible spectroscopy (UV-vis) is used to monitor
reaction progress. Capillary zone electrophoresis (CZE) is used to study compositions
and reaction progress.
©Copyright by Medagama Liyanage Amila Udayanga Liyanage
June 9, 2015
All Rights Reserved
Synthesis of Intercalation Compounds and Nanocomposites
of Inorganic Layered Hosts
by
Medagama Liyanage Amila Udayanga Liyanage
A DISSERTATION
submitted to
Oregon State University
in partial fulfillment of
the requirements for the
degree of
Doctor of Philosophy
Presented June 9, 2015
Commencement June 2016
Doctor of Philosophy dissertation of Medagama Liyanage Amila Udayanga Liyanage
presented on June 9, 2015
APPROVED:
Major Professor, representing Chemistry
Chair of the Department of Chemistry
Dean of the Graduate School
I understand that my dissertation will become part of the permanent collection of
Oregon State University libraries. My signature below authorizes release of my
dissertation to any reader upon request.
Medagama Liyanage Amila Udayanga Liyanage, Author
ACKNOWLEDGEMENTS
First of all, I would like to express my sincere gratitude to my advisor, Prof.
Michael M. Lerner for the guidance, encouragement and resources provided
throughout my studies at Oregon State University.
I am grateful to Profs. Douglas A. Keszler, MAS Subramanian, Vincent T.
Remcho, and Chih-hung (Alex) Chang for serving on my graduate committee and for
allowing me to use their laboratory facilities and instruments whenever needed.
I would also like to acknowledge the nice company and discussions of
Dr. Bahar Özmen-Monkul, Dr. Tosapol Maluangnont, Dr. Esther Ikhuoria,
Dr. Weekit Sirisaksoontorn, Hanyang Zhang, and Xiaochao Liu who are the past and
present members of Lerner group.
I take this opportunity to thank Dr. Christine Pastorek for assisting and
allowing me to use instruments in teaching labs. My gratitude goes to Dr. Adeniyi
Adenuga, Dr. Sean Muir and Changqing Pan (OSU Chemical Engineering) for their
assistance in various experiments.
Thank goes to the members of Subramanian and Remcho research groups,
Cindy, Paula, Luanne, Talley, Kristi, Todd, Greg, Jenna, Dan, Mark, Teresa (OSU
Electron Microscopy Facility) and Nick (OSU Chemical Engineering) for being
helpful at various research, administrative, and teaching environments. Also, I would
like to thank all the instructors and lab coordinators of General Chemistry Sequence
and Integrated Lab program.
I thank OSU Chemistry for the financial support provided throughout my
graduate studies and especially for Whiteley Fellowship in Materials Sciences for
Summer 2014, Travel awards in Summer 2011 and Summer 2014, and TA award for
Winter 2015. Also, I would like to thank College of Science for the Travel award
(COSSTA) in Summer 2014.
I thank all my teachers who enlightened me with their wisdom.

Special thanks to my friends and fellow graduate students; Weekit, Adeniyi,
and Mohamad Nazari, and the small Sri Lankan community in Corvallis for making
the life in Corvallis eventful and joyful.
Finally, and most importantly, I would like to thank my family. I thank my
loving parents, father Karunarathne Liyanage and mother Sunila Vithanage for
raising me up to who I am today. Your endless love, guidance and dedication made
me come this far. I wish to thank my little sister Achala Liyanage, my grandmother
Alice Ranathunga and my lovely wife Sulochana Wasala for the love and support
given throughout this journey.
CONTRIBUTION OF AUTHORS
Prof. Michael M. Lerner has contributed to the design and writing of each
manuscript. Dr. Esther U. Ikhuoria assisted in sample preparation in Chapter 3.
Dr. Adeniyi A. Adenuga, and Prof. Vincent T. Remcho assisted in capillary zone
electrophoresis experiments in Chapter 3. Dr. Esther U. Ikhuoria contributed in
sample preparation and analysis in Appendix A.
TABLE OF CONTENTS
Page
1 Introduction ................................................................................................................. 1
1.1 Intercalation chemistry ........................................................................................ 1
1.2 Metal phosphorous trisulfides (MPS3) ................................................................ 7
1.3 Sodium montmorillonite .................................................................................... 14
1.4 Transition metal dichalcogenides (MX2) ........................................................... 20
1.5 Molybdenum(VI) oxide (MoO3) ........................................................................ 24
1.6 Summary ............................................................................................................ 27
1.7 References .......................................................................................................... 27
2 Template preparation of NiPS3 polymer nanocomposites ........................................ 33
2.1 Abstract .............................................................................................................. 34
2.2 Introduction ........................................................................................................ 35
2.3 Experimental ...................................................................................................... 37
2.3.1 Reagents and Analytical Methods .............................................................. 37
2.3.2 Syntheses .................................................................................................... 38
2.4 Results and discussion ....................................................................................... 40
2.5 Conclusions ........................................................................................................ 50
2.6 References .......................................................................................................... 51
3 Synthesis and characterization of low-generation polyamidoamine (PAMAM)
dendrimer – sodium montmorillonite (Na-MMT) clay nanocomposites .................. 54
3.1 Abstract .............................................................................................................. 55
3.2 Introduction ........................................................................................................ 57
3.3 Experimental ...................................................................................................... 59
TABLE OF CONTENTS (Continued)
Page
3.3.1 Reagents ..................................................................................................... 59
3.3.2 Syntheses .................................................................................................... 59
3.3.3 Analytical methods ..................................................................................... 60
3.4 Results and discussion ....................................................................................... 63
3.5 Conclusions ........................................................................................................ 81
3.6 Associated content ............................................................................................. 82
3.7 References .......................................................................................................... 82
4 Use of amine electride chemistry to prepare molybdenum disulfide intercalation
compounds ................................................................................................................. 87
4.1 Abstract .............................................................................................................. 88
4.2 Introduction ........................................................................................................ 89
4.3 Experimental ...................................................................................................... 95
4.3.1 Reagents ..................................................................................................... 95
4.3.2 Chemical Syntheses .................................................................................... 95
4.3.3 Electrochemical syntheses .......................................................................... 96
4.3.4 Analyses ..................................................................................................... 96
4.4 Results and Discussion ....................................................................................... 97
4.5 Conclusions ...................................................................................................... 110
4.6 Acknowledgements .......................................................................................... 111
4.7 References ........................................................................................................ 111
5 Conclusion ............................................................................................................... 115
5.1 Conclusion ....................................................................................................... 115
TABLE OF CONTENTS (Continued)
Page
Bibliography ............................................................................................................... 120
Appendices ................................................................................................................. 129
A. Preparation and characterization of nanocomposites of polyamidoamine
(PAMAM) dendrimers with molybdenum (VI) oxide (MoO3) ............................ 129
A.1 Abstract ........................................................................................................... 130
A.2 Introduction ..................................................................................................... 131
A.3 Experimental ................................................................................................... 133
A.3.1 Materials .................................................................................................. 133
A.3.2 Syntheses ................................................................................................. 134
A.3.3 Characterization ...................................................................................... 135
A.4 Results and Discussion .................................................................................... 135
A.5 Conclusion ....................................................................................................... 146
A.6 References ....................................................................................................... 146
B. Supplementary Data .............................................................................................. 150
B.1 Supplementary Data ........................................................................................ 151
LIST OF FIGURES
Figure Page
1.1 Structure of a typical layered host and intercalation compound .............................. 3
1.2 Daumas-Herold models for staging in graphite intercalation chemistry ................. 5
1.3 Some intercalate arrangements within galleries ...................................................... 6
1.4 The FePS3 structure .................................................................................................. 8
1.5 Topotactic, exfoliation-adsorption vs template preparation method ...................... 13
1.6 Structure of anhydrous Na-montmorillonite .......................................................... 15
1.7 The layered structure of 2H-MoS2 ......................................................................... 20
1.8 Structure of MoO3 .................................................................................................. 24
2.1 PXRD patterns for PEO/NiPS3 nanocomposites obtained by the template
method. a-NiPS3 obtained by the same approach without PEO is shown for
comparison ............................................................................................................. 40
2.2 SEM image for a PEO/NiPS3 nanocomposite (Sample R0.5V10) ........................ 41
2.3 TGA of nanocomposites with different PEO compositions (* loss shoulder
ascribed to surface PEO) DTG indicates the first derivative of TGA curves ........ 42
2.4 Calculated C2H4O unit volumes from VABC ........................................................ 43
2.5 UV-visible spectra of some reactants and products of the template reactions.
The absorbance at 330 nm (*) is used to monitor nanocomposite formation ........ 48
2.6 Effect of Ni2+
and PEO concentrations on the rate of nanocomposite formation.
Curves are obtained using the indicated Ni2+
concentrations ................................ 49
2.7 Effect of P4S64-
concentration on the rate of nanocomposite formation.
Curves are obtained using the indicated P4S64-
concentrations .............................. 50
3.1 PXRD patterns for (a) G(0.0), (b) G(1.0), and (c) G(2.0) PAMAM/Na-MMT
nanocomposites. The reactant ratios (g/g PAMAM/Na-MMT) are indicated ....... 63
3.2 Mass loss and differential plots for 0.6G(1.0)-2 PAMAM/Na-MMT
nanocomposite ....................................................................................................... 65
LIST OF FIGURES (Continued)
Figure Page
3.3 Interlayer expansion variation with reactant ratios, PAMAM/Na-MMT g/g,
at room temperature and pH 10-11 ........................................................................ 68
3.4 Dendrimer mass % variation with reactant ratios, PAMAM/Na-MMT g/g,
at room temperature and pH 10-11 ........................................................................ 69
3.5 A structural model for the G0.0 monolayer nanocomposites. (H - white,
O - black, C - light grey, N - dark grey) ................................................................ 71
3.6 PXRD patterns of (a) G(0.0), (b) G(1.0), and (c) G(2.0)/Na-MMT
nanocomposites synthesized in acidic (pH=2-3) and basic (pH=10-11)
conditions. Reactant ratios for all the nanocomposites were 0.6 g/g
PAMAM/Na-MMT ................................................................................................ 72
3.7 Packing fraction vs dendrimer mass % of nanocomposites synthesized at
room temperature and pH 10-11. Labels show reactant ratios (g/g
PAMAM/Na-MMT). Packing fractions were not calculated for mixed phases .... 74
3.8 Capillary electrograms for different PAMAM generations at pH 2.7 (a) and
10.9 (b) ................................................................................................................... 76
3.9 FTIR spectra of (a) NaMMT, (b) PAMAM G(0.0) and (c) 0.4 PAMAM
G(0.0)/Na-MMT nanocomposite. The 2850-3500 cm-1
region of (c)
is intensified x10 for clarity. .................................................................................. 79
4.1 Schematic representations of MoS2 and NaxMoS2∙δH2O, where H2O is a
cointercalate. .......................................................................................................... 90
4.2 Powder XRD of MoS2 and the intercalation compounds obtained after 48 h
reaction at 60 °C (S-60C-48h) and after 24 h reaction at 60 °C using
decreased Na mass (M½-60C-24h). ....................................................................... 98
4.3 Powder XRD of MoS2 and the intercalation compounds obtained after 24 h
at reaction temperatures ambient to 100 °C. .......................................................... 99
4.4 Powder XRD data obtained for reaction of MoS2 with Na/en electride
solution at 60 °C. Reaction times are indicated at the right. ................................ 101
4.5 Ln(A/At) vs. reaction time at 60 °C. .................................................................... 102
4.6 Proposed reaction mechanism; MoS2 forms a metastable phase,
which converts to the more stable phase. ......................................................... 103

LIST OF FIGURES (Continued)
Figure Page
4.7 Gaussian-optimized molecular dimensions of ethylenediamine. ......................... 104
4.8 Thermograms of MoS2, en, (a) the phase Na-en-MoS2 intercalation
compound (S-60C-48h) and (b) a phase predominant product (S-60C-3h)
under Ar flow, and (c) phase predominant product (S-60C-3h) analyzed
under air flow. ...................................................................................................... 105
4.9 SEM images of (a) MoS2 and (b) phase intercalation compound
Na0.3MoS2∙0.4en. .................................................................................................. 107
4.10 Raman spectra of MoS2 and Na-en-MoS2 intercalation compound
(S-60C-3h) indicates the structural change upon intercalation. ........................ 108
4.11 Powder XRD profiles for MoS2 and products of electrochemical
reduction in en/NaPF6 with applied charges indicated. .................................... 109
4.12 Relative peak areas and widths for MoS2 and reduction products
at different applied charges. .............................................................................. 109
LIST OF TABLES
Table Page
1.1 Representative host lattices for intercalation ........................................................... 2
2.1 Compositional data from thermal analyses and calculated packing fractions
for PEO/NiPS3 nanocomposites ............................................................................. 44
2.2 Effect of synthetic conditions on crystallite size ................................................... 45
2.3 Structural and compositional data for new polymer/NiPS3 nanocomposites ........ 46
2.4 Comparison of packing fractions of known PEO/MPS3 nanocomposites.
The packing fractions were derived from compositional and structural data
in the references indicated ..................................................................................... 47
3.1 Structural and compositional data for PAMAM/Na-MMT nanocomposite
products obtained using PXRD (d and d) and TGA (organic mass %), and
derived packing fractions and crystallite sizes (L) ................................................ 66
3.2 Compositional and packing data for polymer/A-MMT nanocomposites .............. 70
3.3 Migration data from CZE and calculated charge data for PAMAM dendrimers .. 76
3.4 Comparison of IR bond vibrations in reactants and nanocomposites .................... 80
4.1 Compositional data for en containing intercalation compounds .......................... 106
5.1 Summary of template synthesized NiPS3/polymer nanocomposites
reported in this dissertation .................................................................................. 116
5.2 Summary of exfoliation-adsorption synthesized selected
PAMAM/Na-MMT nanocomposites reported in this dissertation ...................... 117
5.3 Summary of synthesized MoS2 intercalation compounds using
electride chemistry in this dissertation ................................................................. 118
LIST OF APPENDIX FIGURES
Figure Page
A1. PXRD patterns of [Na(H2O)2]0.25MoO3 and PAMAM/MoO3 nanocomposites
with G0 (a) or G2 (b) PAMAM at different reactant ratios ............................... 138
A2. Proposed schematic structure of obtained nanocomposites. (a) G0/MoO3
monolayer and (b) G2/MoO3 bilayer .................................................................. 138
A3. Interlayer expansions (Δd) obtained at different reactant ratios for
PAMAM/MoO3 nanocomposites using PAMAM G0 (∆) and G2 () ............... 139
A4. Thermographs of [Na(H2O)2]0.25MoO3 (a), and the nanocomposites
G0-0.5 (b) and G2-0.5 (c) ................................................................................... 139
A5. PXRD patterns showing the effect of temperature on G2 PAMAM/MoO3
nanocomposites ................................................................................................... 144
A6. SEM micrographs of (a) MoO3, (b) NaxMoO3 and
(c) the nanocomposite G2-0.8 ............................................................................. 144
A7. IR spectra of G2 PAMAM (a), nanocomposite G2-0.7 (b) and MoO3 (c) .......... 145
B1. PXRD data for (a) G(0.0), (b) G(1.0), and (c) G(2.0)/Na-MMT
nanocomposites synthesized at room temperature and 60 oC.
Reactant ratios were 0.3 g/g PAMAM/Na-MMT ............................................... 151
B2. FTIR spectrum of dehydrated Na-MMT .............................................................. 151
B3. FTIR spectrum of a 0.4 PAMAM G(2.0)/Na-MMT nanocomposite.
The 2850-3500 cm-1
region is intensified x10 for clarity .................................... 152

LIST OF APPENDIX TABLES
Table Page
A1. Physical properties of amine surface functional PAMAM dendrimers ............... 134
A2. PXRD repeat distances (d) and derived interlayer expansions (Δd) of
PAMAM/MoO3 nanocomposites at different reactant ratios .............................. 137
A3. Comparison of PAMAM/MoO3 with other polymer/MoO3 nanocomposites ..... 137
A4. Compositional data for different reactant ratios using PAMAM G0 and G2 ...... 141
A5. Effect of temperature on the structure of G2-0.3 nanocomposites ...................... 143
1
CHAPTER 1
INTRODUCTION
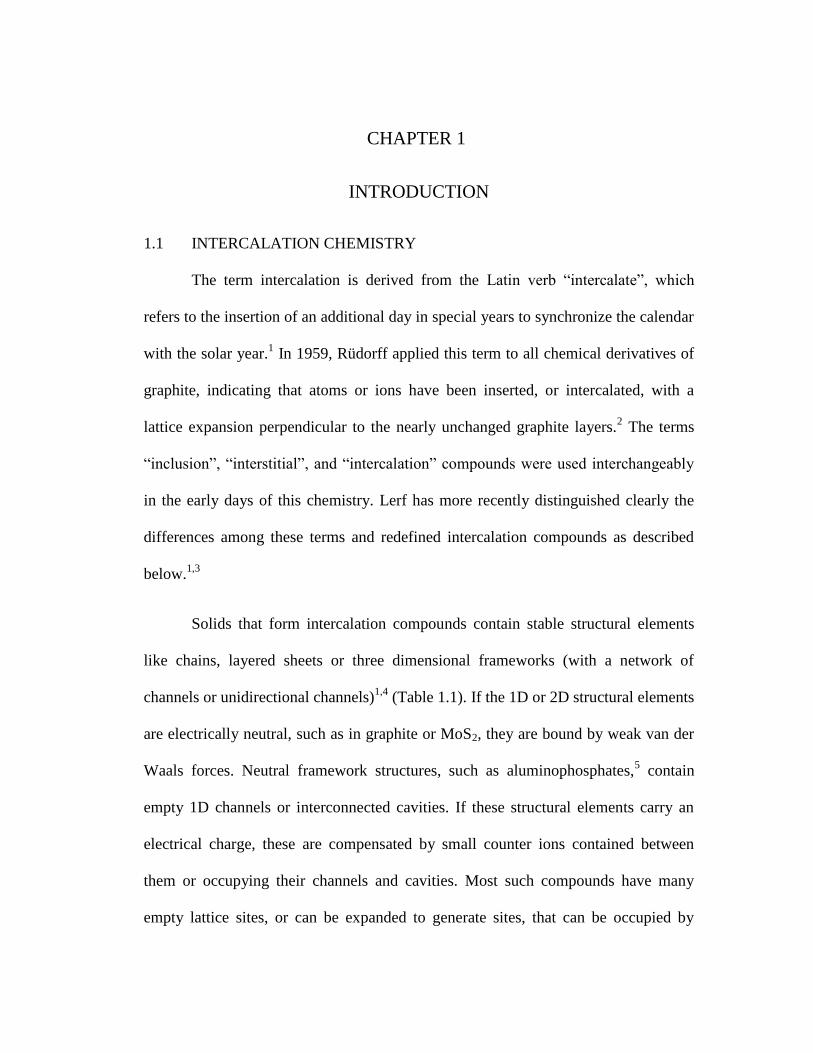
1.1 INTERCALATION CHEMISTRY
The term intercalation is derived from the Latin verb “intercalate”, which
refers to the insertion of an additional day in special years to synchronize the calendar
with the solar year.1 In 1959, Rüdorff applied this term to all chemical derivatives of
graphite, indicating that atoms or ions have been inserted, or intercalated, with a
lattice expansion perpendicular to the nearly unchanged graphite layers.2 The terms
“inclusion”, “interstitial”, and “intercalation” compounds were used interchangeably
in the early days of this chemistry. Lerf has more recently distinguished clearly the
differences among these terms and redefined intercalation compounds as described
below.1,3
Solids that form intercalation compounds contain stable structural elements
like chains, layered sheets or three dimensional frameworks (with a network of
channels or unidirectional channels)1,4
(Table 1.1). If the 1D or 2D structural elements
are electrically neutral, such as in graphite or MoS2, they are bound by weak van der
Waals forces. Neutral framework structures, such as aluminophosphates,5 contain
empty 1D channels or interconnected cavities. If these structural elements carry an
electrical charge, these are compensated by small counter ions contained between
them or occupying their channels and cavities. Most such compounds have many
empty lattice sites, or can be expanded to generate sites, that can be occupied by
2
additional atoms or molecules. Therefore the mobility of the interstitial atoms can be
very high if their interaction with the host structure is not too strong. This allows
many intercalation reactions to be carried out at or near ambient temperature, which
permits the preparation of metastable products that cannot be obtained by traditional
high temperature solid state reactions. In summary, intercalation is the reversible
uptake of atoms, ions, molecular cations, or molecules, generally at moderate
temperatures, and with conservation of structural elements in the host lattice.
However, the term intercalation refers to topology, and does not describe the nature
of the chemical reaction underlying this process.1
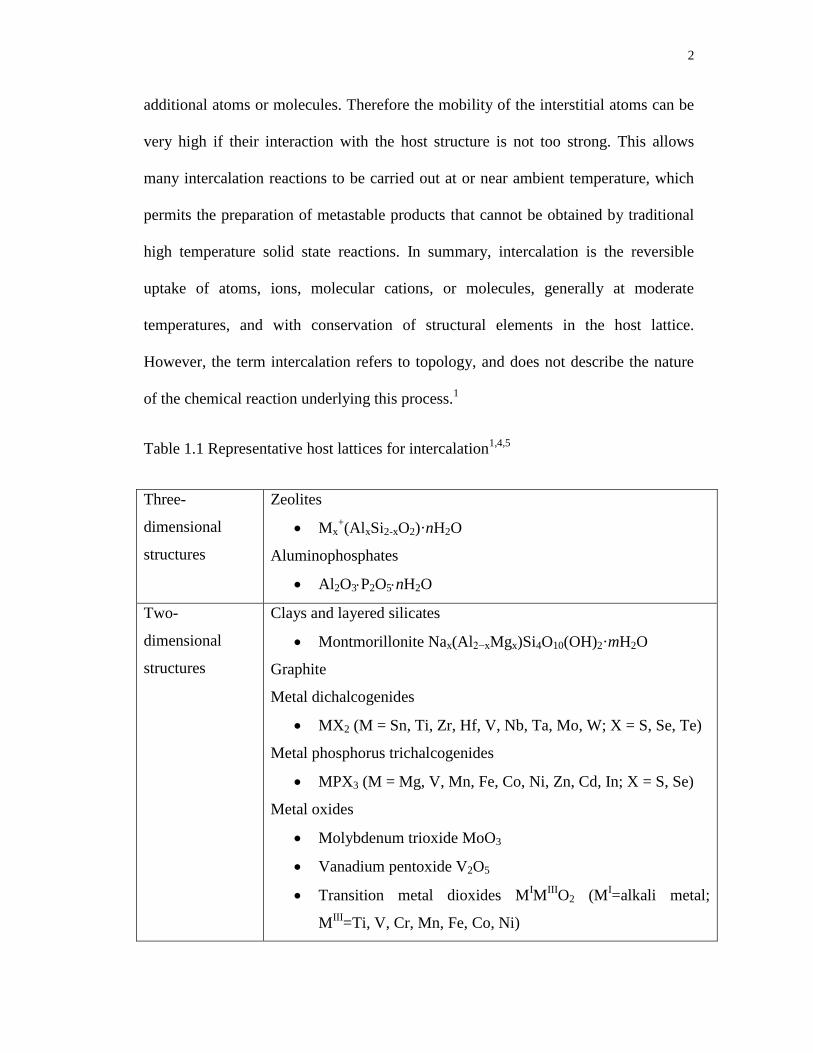
Table 1.1 Representative host lattices for intercalation1,4,5
Three-
dimensional
structures
Zeolites
Mx+(AlxSi2-xO2)·nH2O
Aluminophosphates
Al2O3P2O5nH2O
Two-
dimensional
structures
Clays and layered silicates
Montmorillonite Nax(Al2−xMgx)Si4O10(OH)2·mH2O
Graphite
Metal dichalcogenides
MX2 (M = Sn, Ti, Zr, Hf, V, Nb, Ta, Mo, W; X = S, Se, Te)
Metal phosphorus trichalcogenides
MPX3 (M = Mg, V, Mn, Fe, Co, Ni, Zn, Cd, In; X = S, Se)
Metal oxides
Molybdenum trioxide MoO3
Vanadium pentoxide V2O5
Transition metal dioxides MIM
IIIO2 (M
I=alkali metal;
MIII
=Ti, V, Cr, Mn, Fe, Co, Ni)
3
One-dimensional
structures
Carbon nanotubes
MX3 (M = Ti, Zr, Hf, Nb, Ta; X = S, Se)
Framework structures can intercalate species (molecules or ions) that can be
accommodated within their channels or cavities. On the other hand, 1D and 2D
lattices can expand in two or one dimensions, and are therefore relatively unrestricted
by intercalate size. This expansion potential allows the intercalation of a large variety
of intercalate species including atoms, ions, small molecules, organic cations, metal
complexes and polymers.1 From here onwards, this dissertation will focus only on the
intercalation compounds with layered host materials.
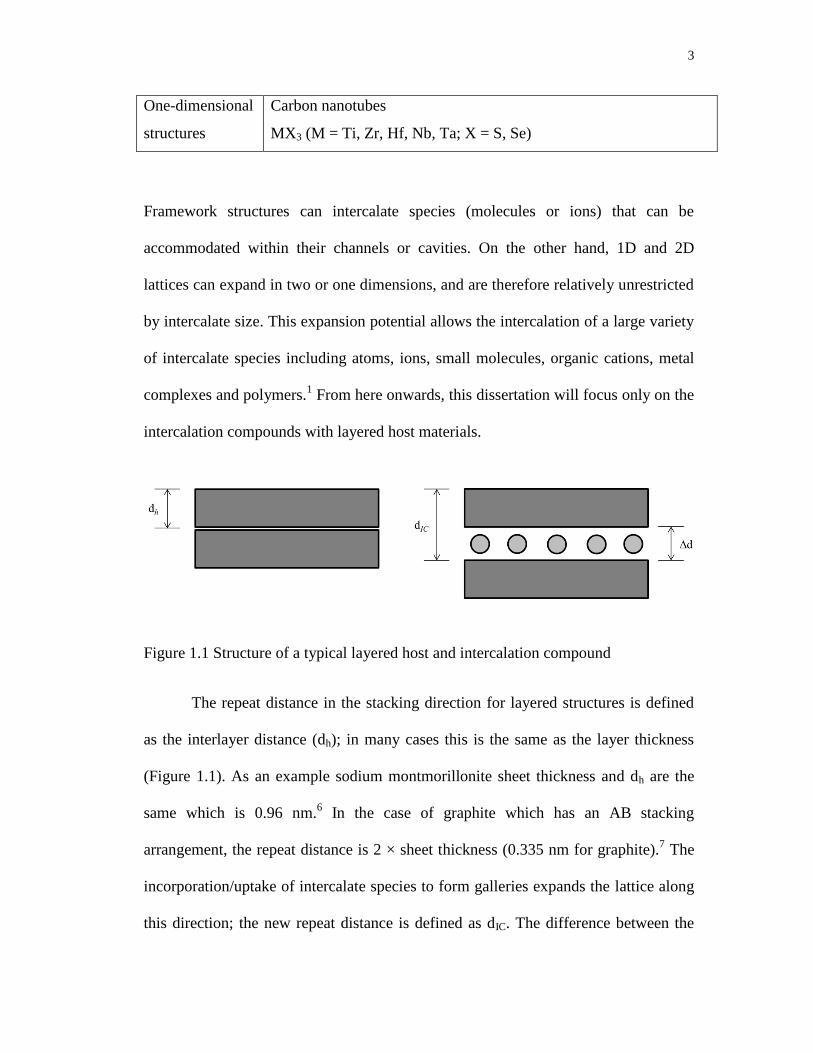
Figure 1.1 Structure of a typical layered host and intercalation compound
The repeat distance in the stacking direction for layered structures is defined
as the interlayer distance (dh); in many cases this is the same as the layer thickness
(Figure 1.1). As an example sodium montmorillonite sheet thickness and dh are the
same which is 0.96 nm.6 In the case of graphite which has an AB stacking
arrangement, the repeat distance is 2 × sheet thickness (0.335 nm for graphite).7 The
incorporation/uptake of intercalate species to form galleries expands the lattice along
this direction; the new repeat distance is defined as dIC. The difference between the
4
interlayer repeat distance of the intercalation compound and the host, dIC-dh, can be
called the interlayer expansion (d), or gallery height, and reflects the steric
requirements of the intercalate. Powder X-ray diffraction technique can be used to
determine dh and dIC for both the layered host and intercalation compounds that are
produced. On the molecular scale, interlayer expansions can be very small (< 0.1 nm
for some Li+ intercalation compounds) to very large (> 5 nm),
8 depending on the
nature of the intercalate species, their arrangement in the galleries, and in some cases
on the synthetic methods and post-reaction processing employed.
When the intercalate species are oligomers, polymers, or dendrimers, the
resulting intercalation compounds are often called nanocomposites, as both organic
and inorganic components co-exist alternatively with domains (in at least one
dimension) in the nanometer scale.1 These nanocomposites have properties markedly
differ from those of their components or micro- or macro-scaled composites with
similar compositions. As an example, nylon-6-based montmorillonite nanocomposites
have been shown to achieve a ~2 times higher Young’s modulus with respect to the
commercial nylon-6.9 In another study, a poly(ethylene oxide)/Li-montmorillonite
nanocomposite was shown to enhance the stability of the ionic conductivity when
compared to a PEO/LiBF4 polymer-salt complex.10
In most intercalation compounds, intercalate species are present between all
the host layers. In some cases, especially in graphite intercalation chemistry, some of
the layers do not separate to admit intercalate, and ordered sequences can form
comprising intercalate galleries and more than one host layer. This phenomenon is
referred to as staging. Stage 1, 2, and 3 intercalation compounds indicates that one,
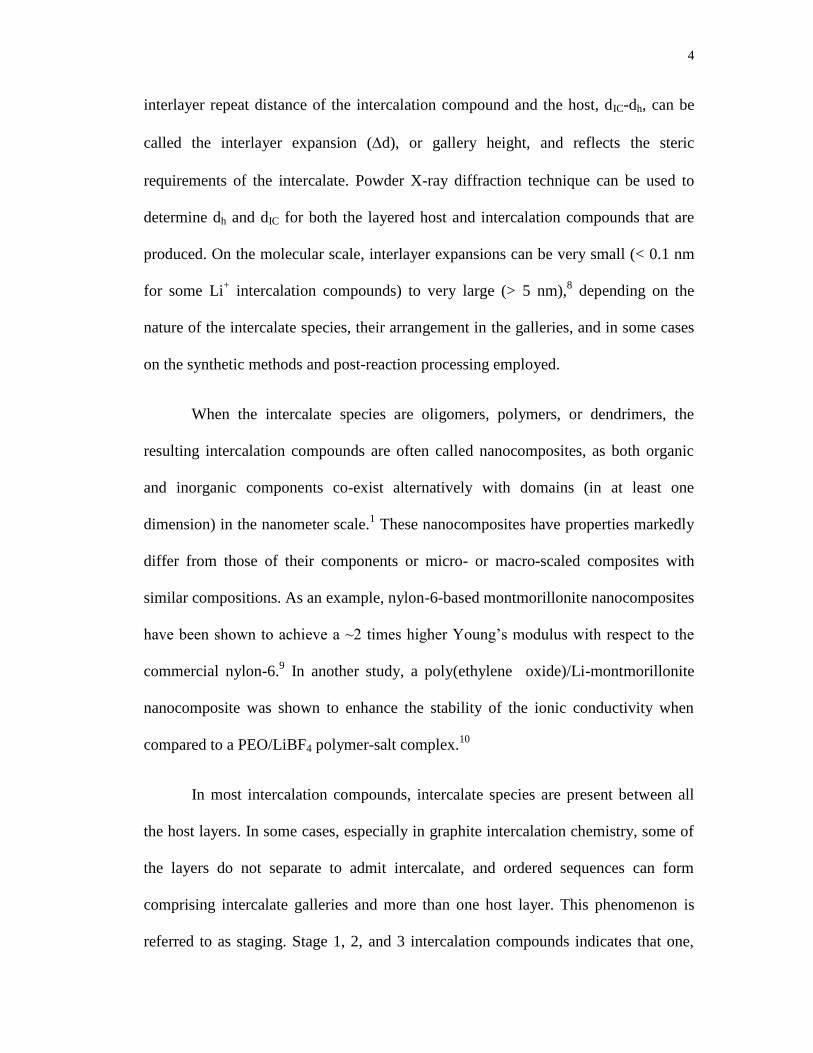
5
two and three host layers, respectively, are separated by the expanded galleries in an
ordered sequence. Daumas and Herold introduced a more realistic model to describe
this staging phenomenon in terms of intercalate domains (Figure 1.2). There are also
examples where disordered or random sequences of intercalate and host layers can
arise, this is termed interstratification and is common in clay chemistry.1,3
Figure 1.2 Daumas-Herold models for staging in graphite intercalation chemistry
Intercalate species are observed with a variety of arrangements within the
expanded galleries (Figure 1.3). Most common are monolayers or bilayers, although
trilayers and other organizations are also known. If the intercalate is anisotropic, it
may be oriented with longer axis “parallel” to the host layers, i.e. in a manner leading
to a minimal gallery height. Often the intercalates are charged and contain more and
less polar surfaces - the charged or polar ends will typically orient towards opposite
charges on the host, with nonpolar ends directed towards the gallery center. The
paraffinic structure arises when two intercalate layers are present to compensate the
charges of the host layers. These bilayers can be arranged with the intercalates
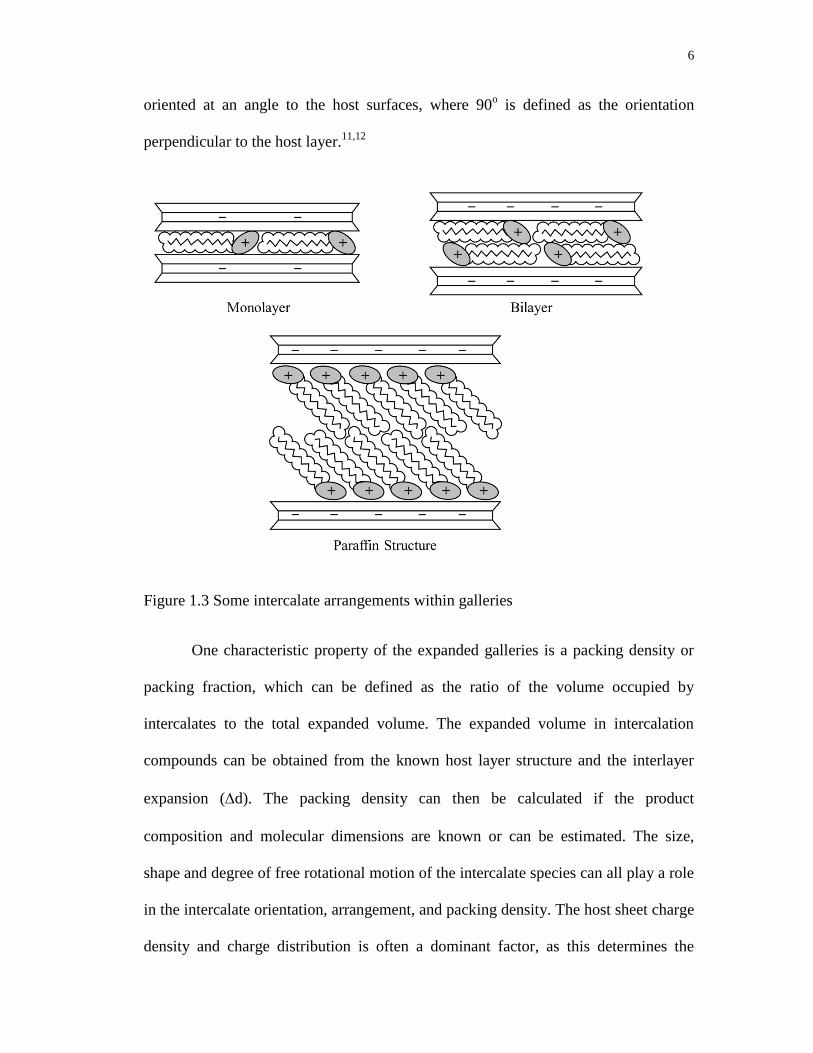
6
oriented at an angle to the host surfaces, where 90o is defined as the orientation
perpendicular to the host layer.11,12
Figure 1.3 Some intercalate arrangements within galleries
One characteristic property of the expanded galleries is a packing density or
packing fraction, which can be defined as the ratio of the volume occupied by
intercalates to the total expanded volume. The expanded volume in intercalation
compounds can be obtained from the known host layer structure and the interlayer
expansion (d). The packing density can then be calculated if the product
composition and molecular dimensions are known or can be estimated. The size,
shape and degree of free rotational motion of the intercalate species can all play a role
in the intercalate orientation, arrangement, and packing density. The host sheet charge
density and charge distribution is often a dominant factor, as this determines the

7
required surface density of the intercalate counter charges in the galleries. This latter
property varies widely in different hosts, and may depend on synthetic conditions. If
the intercalate species are small and have a higher charge density, they tend to form
monolayers. On the other hand, larger intercalate species may form bilayers because
the ratio of charge to available host surface (or footprint) is too small to allow charge
compensation for the host in a monolayer arrangement. Therefore, bilayer, pseudo-
trilayers, or paraffinic structures may be observed.1
In clays such as Na-montmorillonite, the host is electronically insulating and
the sheet charge density and distribution are less dependent on chemical potential.
This is in marked contrast to graphite or many metal dichalcogenides, which are
electronically conductive and redox active, with variable sheet charge densities and
distributions.1 Next, we will focus on a selected set of host materials, and the reported
syntheses and structures of their intercalation compounds and nanocomposites.
1.2 METAL PHOSPHOROUS TRISULFIDES (MPS3)
Metal phosphorous trisulfides (MPS3) form a broad and varied class of
compounds that exhibit several related structure types. FePS3 is often used as a
representative structure. FePS3 is monoclinic and deviates slightly from hexagonal
symmetry (Figure 1.4). The structure can be described by analogy to the layered
CdCl2 structure. In FePS3, the S atoms form an essentially cubic close packed array.
Alternate layers of octahedral sites within this array are vacant, the remaining
octahedral sites are filled by metal (M) and phosphorous atom pairs (P2). The formula
can be rewritten as M2/3(P2)1/3S2, to highlight the analogy to transition metal
8
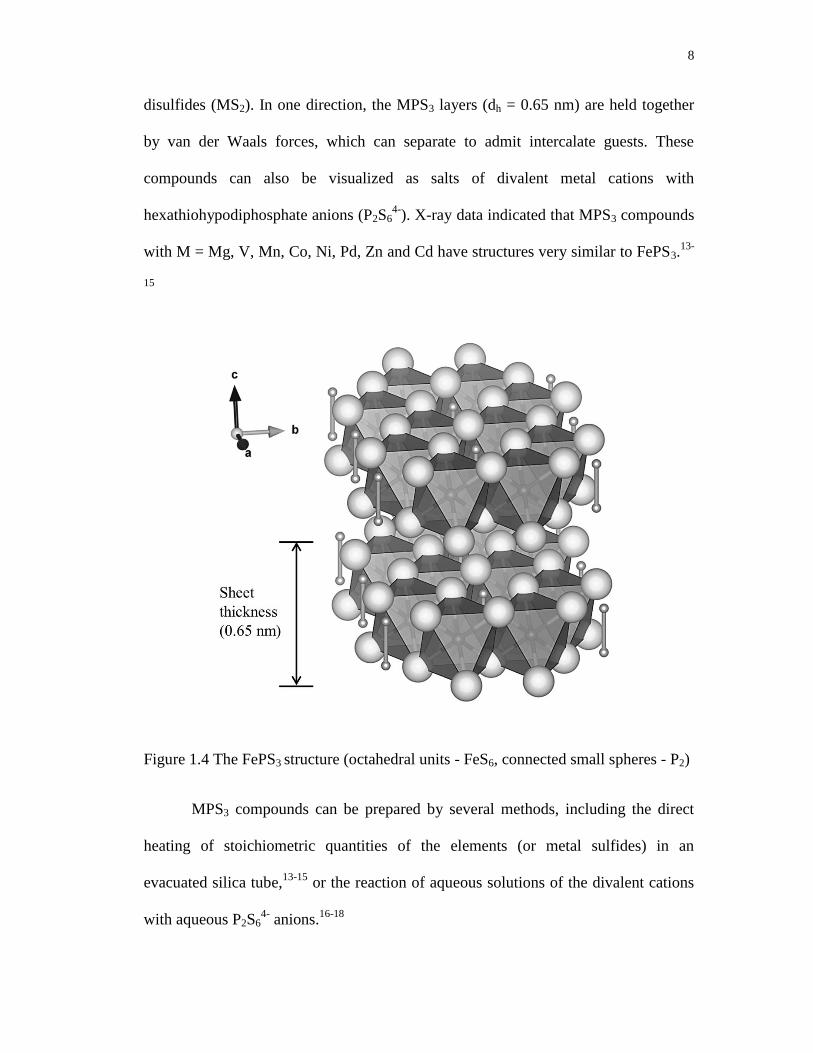
disulfides (MS2). In one direction, the MPS3 layers (dh = 0.65 nm) are held together
by van der Waals forces, which can separate to admit intercalate guests. These
compounds can also be visualized as salts of divalent metal cations with
hexathiohypodiphosphate anions (P2S64-
). X-ray data indicated that MPS3 compounds
with M = Mg, V, Mn, Co, Ni, Pd, Zn and Cd have structures very similar to FePS3.13-
15
Figure 1.4 The FePS3 structure (octahedral units - FeS6, connected small spheres - P2)
MPS3 compounds can be prepared by several methods, including the direct
heating of stoichiometric quantities of the elements (or metal sulfides) in an
evacuated silica tube,13-15
or the reaction of aqueous solutions of the divalent cations
with aqueous P2S64-
anions.16-18

9
Several MPS3 hosts directly react with n-alkylamines to form intercalation
compounds. This chemistry has been studied extensively with MgPS3, MnPS3 and
ZnPS3. The interlayer distances obtained are invariant to the carbon number of the n-
alkylamine, with dIC = 1.05 and d = 0.40 nm. The observed expansion can be
attributed to the van der Waals radius of a methyl group. From these observations it is
evident that the amine carbon chains are arranged parallel to the host layers. Based on
the interlayer expansions reported for n-alkylamine intercalates of MgPS3 and ZnPS3,
bilayer of amines are obtained arranged perpendicular to the host layers.13,15,19
Alkali metal cations can intercalate into MPS3 hosts by either chemical or
electrochemical reduction. The chemical approach uses a reactive organoalkali metal
compound like n-butyllithium, or sodium or potassium naphthalenide, at mild
temperatures (20-70 C). However, not all MPS3 hosts react similarly with n-
butyllithium. Complete occupancy of the vacant octahedral sites would lead to
Li1.5MPS3. When the lithium content exceeds Li1.2NiPS3, X-ray diffraction data
indicate that the NiPS3 host lattice is degraded irreversibly with the formation of Li2S.
FePS3 and some other MPSe3 compounds react with lower degrees of lithiation, and
CdPS3, ZnPS3 and MnPS3 do not react at all under these conditions. Another
interesting observation is that no interlayer expansion occurs upon Li+ intercalation.
For this same reason, the reaction can be difficult to monitor using powder X-ray
diffraction alone.13,15
LixNiPS3 is hygroscopic and reacts with atmospheric moisture, resulting in a
new intercalation phase with an interlayer expansion of 0.58 nm. This increased
expansion is attributed to the uptake of a bilayer of water molecules that solvate the

10
intercalate Li+ ions. Other alkali metal intercalation compounds with MPS3 show a
similar water uptake.13
Lithium intercalation into MPS3 has also been achieved electrochemically, for
example with NiPS3 as the cathode and Li(m) as the anode of an electrochemical cell
containing a Li salt electrolyte dissolved in an aprotic solvent. When the cell is
connected, Li(m) is spontaneously oxidized and NiPS3 reduced. Two different
LixNiPS3 phases (with x = 0-0.5 or x = 0.5-1.5) were obtained with this approach. For
x < 1.5, the intercalation reaction is electrochemically reversible, whereas lithiation to
x > 1.5 results in irreversible decomposition of the host lattice. The reaction rates
depend in part on the electrolyte employed. LeMehaute20
reported different discharge
curves obtained in dimethoxyethane-based electrolytes due to the co-intercalation of
solvent molecules along with Li+. Although many MPS3 hosts have been tested, only
NiPS3 and FePS3 have been found to undergo substantial electrochemical
intercalation. CdPS3, MnPS3 and ZnPS3 are less reactive or unreactive under similar
conditions. This has been explained in terms of the electronic band structure. ZnPS3
and CdPS3 contain d10
ions; because the 4s and 4p molecular orbitals levels are too
high in energy (~12eV) with respect to eg sub band, these compounds do not undergo
reductive intercalation.13,15
MnPS3 also reacts with aqueous salt solutions to form intercalation
compounds of general composition Mn1-xPS3A2x(H2O)y. These compositions result
from the abstraction of Mn2+
from the host structure, generating new cation vacancies
and a negative layer charge, rather than by the reduction of the transition metal
cations. To compensate this host layer charge, guest cations must intercalate between
11
host layers. A wide range of cations, including K+ and alkylammonium ions, have
been intercalated in this manner. Other relatively ionic hosts such as ZnPS3 and
CdPS3, with M2+
ions less stabilized by ligand field, show similar behavior. The more
covalent hosts NiPS3 have greater ligand field stabilization and do not show this layer
metal abstraction behavior; FePS3 is in this class and rarely show this chemistry.13,15
These reactions and the intercalation compounds produced have been explored for
applications in ion exchange and as precursors to new materials. For example, the
intercalate cations and/or solvent co-intercalates can be exchanged; Mn1-
xPS3A2x(H2O)y (A = Na, K) reacts in a solution of polyethylene oxide (PEO) to
generate new polymer nanocomposites.21
MPS3 compounds are mostly broad band semiconductors with bandgaps from
1.5-3.5 eV. The electrochemically active NiPS3 (1.6 eV) and FePS3 (1.5 eV) have
smaller band gaps. The optical properties and dc conductivities of these hosts can
change markedly upon intercalation. As an example, Brec et al. found that the
electronic resistivities of FePS3 and NiPS3 decreased gradually or rapidly,
respectively, when reacted with n-butyllithium. They suggested that reduction inserts
electrons to delocalized conduction bands resulting in enhanced conductivity, also
leading to free carrier absorption and increased reflectivity. The increased
conductivities also allow these materials to function efficiently as cathodes in
electrochemical cells. Chemical intercalation has little effect on the magnetic
properties of FePS3, but decreases the overall susceptibility with increasing Li content
in NiPS3. It was proposed that the populated band was not associated with either
metal 3d orbitals or P orbitals, but derives instead from S or metal 4s orbitals.13
12
Lagadic et al. first reported the synthesis of nanocomposites containing PEO
and MPS3 (M = Mn, Cd) via the reaction of an aqueous polymer solution with
M1-xPS3A2x(H2O)y (A = Na, K). The products obtained showed Δd ~ 0.8–0.9 nm,
attributed to the intercalation of bilayers of zig-zag-like PEO chains which also
coordinate alkali metal ions.21
Jeevanandam et al. prepared PEO/AxCdPS3
nanocomposites in a methanolic solution at 55 oC.
22 Manriquez et al. reported PEO/
LixMPS3 (M = Ni, Fe) using a similar method, and proposed a polymer helical
conformation.23
Manova et al. reported the intercalation of polyethylene glycol into
NaxNiPS3 by reaction in a methanolic aqueous solution, with Δd ~0.8 nm.24
Other
polymers that have been reported to form nanocomposites with MPS3 include linear
polyethylenimine (LPEI) and polyvinylpyrrolidone (PVP). LPEI was reported by
Oriakhi et al. to form nanocomposites with polymer monolayers (Δd = 0.4 nm) via
the reaction of Kx(H2O)yM1-x/2PS3 (M = Mn, Cd) and polymers in aqueous solution.25
The PVP-containing nanocomposite was reported by Yang et al. via reaction of a
potassium-intercalated MPS3 (M = Mn, Cd) and an aqueous PVP solution. The
reported Δd ~ 2.3 nm was much greater than that observed for the PEO
nanocomposites.26
A solvent-free, melt intercalation approach to obtain PEO/MPS3
nanocomposites (M = Mn, Cd) was first reported by Sukpirom et al. With this
method, KxM1-x/2PS3H2O was shown to directly intercalate PEO at 125 C. The
nanocomposite basal repeat distances were increased by ~ 0.8 nm, attributed to the
presence of PEO bilayers within the intercalate galleries.27
13
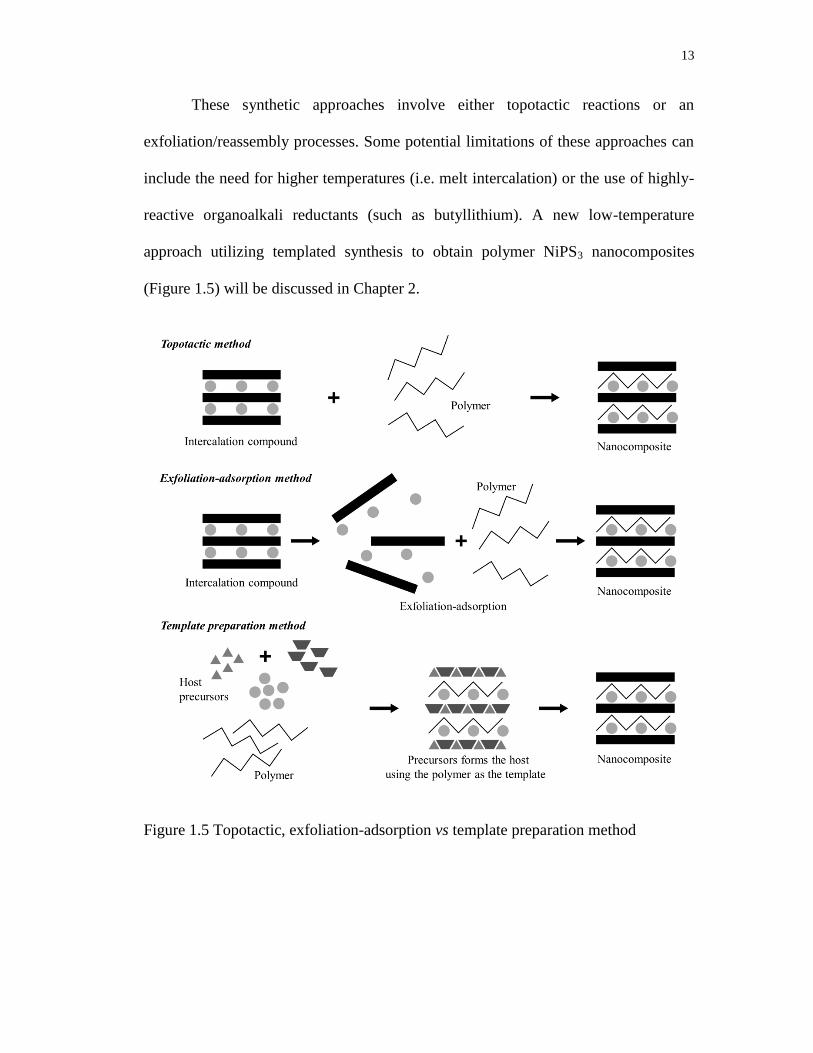
These synthetic approaches involve either topotactic reactions or an
exfoliation/reassembly processes. Some potential limitations of these approaches can
include the need for higher temperatures (i.e. melt intercalation) or the use of highly-
reactive organoalkali reductants (such as butyllithium). A new low-temperature
approach utilizing templated synthesis to obtain polymer NiPS3 nanocomposites
(Figure 1.5) will be discussed in Chapter 2.
Figure 1.5 Topotactic, exfoliation-adsorption vs template preparation method
14
1.3 SODIUM MONTMORILLONITE
Montmorillonites belong to the structural family known as the 2 : 1
phyllosilicates. Their crystal lattice consists of two-dimensional layers where a
central octahedral sheet of alumina or magnesia is encased by silica tetrahedra, with
oxygen ions of the octahedral sheet shared with SiO4 units (Figure 1.6). The layer
thickness/interlayer distance is ~ 1 nm. Substitution within the layers (for example,
Al3+
replaced by Mg2+
) generates negative charges that are counterbalanced by alkali
or alkaline earth cations, situated in the interlayer volume. Sodium montmorillonite
(Na-MMT), has the formula Nax(Al4−xMgx)Si8O20(OH)4 with a stacking repeat
distance of 0.96 nm for the anhydrous structure. The layer charge is not constant - it
varies from layer to layer, and derived values must be considered as an average value
over the whole crystal. The cation exchange capacity (CEC) is usually a good
qualitative or quantitative measure of the average sheet surface charge densities.
Smectite clays such as montmorillonite have a moderately negative surface charge,
and a CEC of 60-120 mEq/ 100 g.12,13,28
15
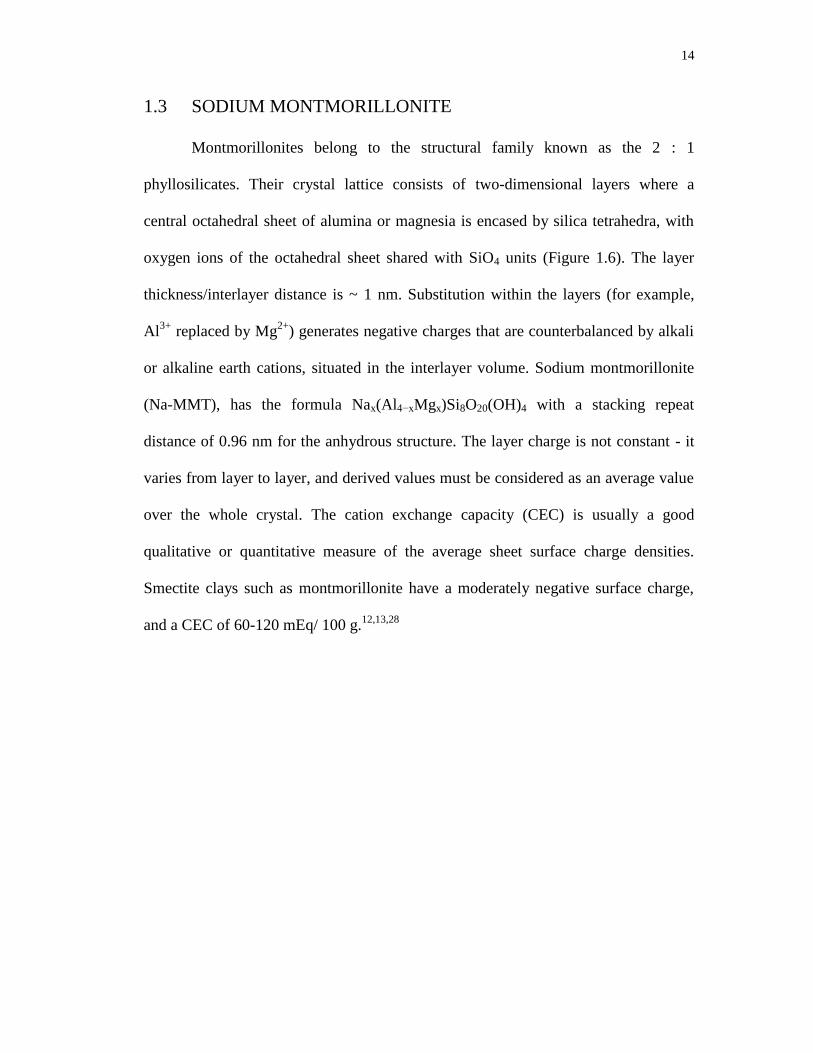
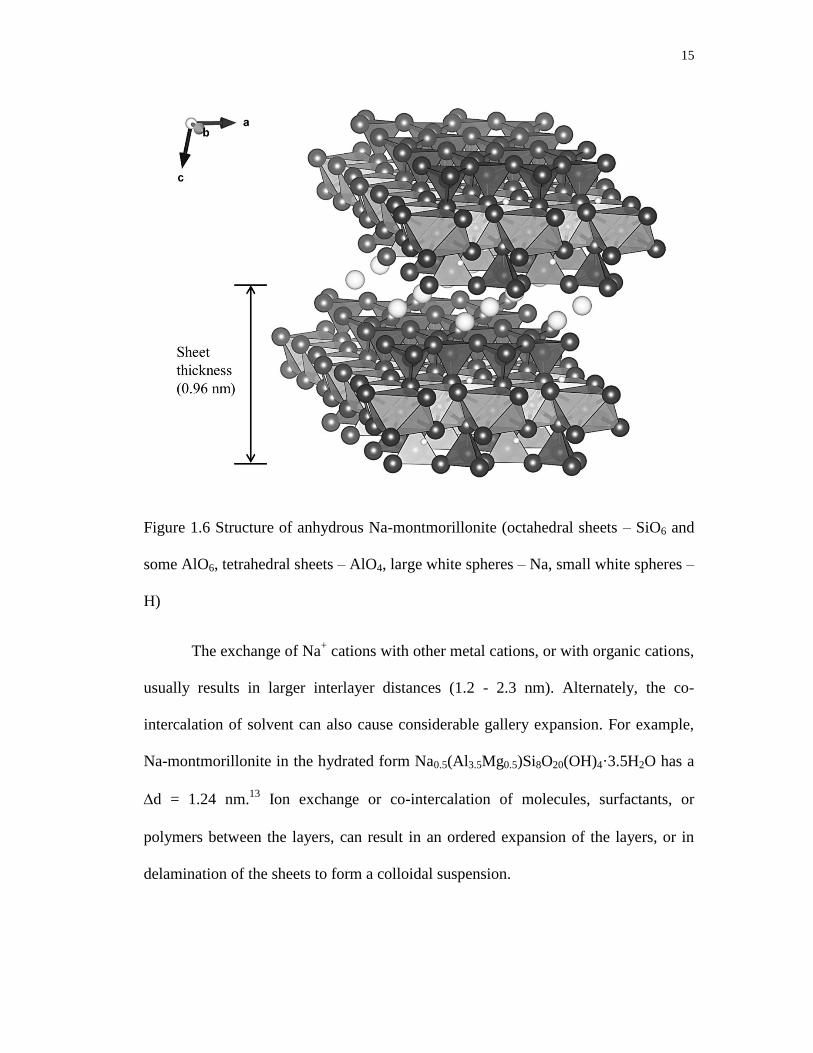
Figure 1.6 Structure of anhydrous Na-montmorillonite (octahedral sheets – SiO6 and
some AlO6, tetrahedral sheets – AlO4, large white spheres – Na, small white spheres –
H)
The exchange of Na+ cations with other metal cations, or with organic cations,
usually results in larger interlayer distances (1.2 - 2.3 nm). Alternately, the co-
intercalation of solvent can also cause considerable gallery expansion. For example,
Na-montmorillonite in the hydrated form Na0.5(Al3.5Mg0.5)Si8O20(OH)4·3.5H2O has a
d = 1.24 nm.13
Ion exchange or co-intercalation of molecules, surfactants, or
polymers between the layers, can result in an ordered expansion of the layers, or in
delamination of the sheets to form a colloidal suspension.
16
In order to render these hydrophilic phyllosilicates more organophilic, the
hydrated cations of the interlayer can be exchanged with cationic surfactants such as
alkylammonium or alkylphosphonium. These modified organoclays have lower
surface energies and are more compatible with non-polar organic intercalates.11
Intercalation of larger molecules like polyethylene glycol (PEG) and polymers
such as polyethylene oxide (PEO) can be achieved for both hydrophilic and
organophillic montmorillonites. Polymer-clay nanocomposites combine constituents
in at least one nanoscale dimension, typically on the order of 1 to 10 nm. Because of
this nanostructure, polymer-clay nanocomposites can possess unique properties. As
reported in the literature, polymer-clay nanocomposites can show enhanced
mechanical and thermal properties, gas permeability resistance, and fire retardancy.11
Nanocomposites can be produced by an in-situ polymerization, by solid phase
melt blending, or by reaction in solution phase (exfoliation/reassembly). The
synthetic method employed, as well as other material processing such as annealing
time, can have a significant impact on the product structure and properties. The
dimensions and microstructures of the dispersed phase significantly influence the
properties of polymer composites. When registry between the host layers is
maintained, the material is described as an intercalation compound. When this
registry is lost, and the clay layers are more randomly distributed throughout the
polymer matrix, the system is described as an exfoliated or delaminated
nanocomposite. If the clay is not dispersed, it is simply a microfiller. Polymer
composite materials are used widely as structural materials in diverse applications
17
such as transport (vehicles), construction, electronics and consumer products such as
packaging and sporting goods.11
The melt intercalation process was first reported relatively recently, in 1993,
by Vaia et al.29
A thermoplastic polymer is mechanically mixed with an organophilic
clay at elevated temperatures. The polymer chains intercalate between the
individual silicate layers of the clay. The proposed driving force is the enthalpic
contribution from polymer/organoclay interactions.11
In solution phase syntheses, both the clay (hydrophilic or organophilic), and
the polymer, are dissolved in water or a polar organic solvent. The entropy gain due
to solvent desorption drives the polymer chains to diffuse between the clay layers,
compensating for any decrease in chain conformational entropy. Solvent evaporation
leads to the desired nanocomposites product.11
In situ polymerization is an earlier strategy used to synthesize polymer-clay
nanocomposites. This is similar to the solution method indicated above, with the
solvent replaced by a polar monomer solution. Once the organoclay is swollen by the
monomer, a curing agent is added and, in favorable cases, complete exfoliation
occurs. According to previous studies, polymerization is believed to be the indirect
driving force of the exfoliation. The clay, due to its high surface energy, attracts polar
monomer molecules into the clay galleries until equilibrium is reached. The
polymerization reaction lowers the intercalate polarity and therefore displaces the
equilibrium. This allows new polar species to diffuse between the layers, and this

18
process progressively exfoliates the clay. Therefore, the nature of the curing agent as
well as the curing conditions can each play a role in the exfoliation process.11
Nanocomposites comprising polyethylene oxide and Na-montmorillonite can
form polymer monolayer or bilayer galleries, with Δd = 0.41 or 0.81 nm,
respectively.6 Polyethylene imine nanocomposites are only reported to form
intercalate monolayers with Δd = 0.42 nm.25
Ca-montmorillonite forms
nanocomposites with polyvinyl alcohol and the interlayer expansion ranged 0.59-0.74
nm, depending on processing conditions.30
There are a limited number of reports
related to the intercalation and formation of nanocomposites of montmorillonite with
dendrimers. Those structures include hyperbranched polymers,31, 32
higher-generation
polyamidoamines,33
dendrons,34
or dendritic quaternary ammoniums26
. Intercalation
of these species was found to result in very large gallery expansions (~ 3 nm),26,31,34
or pure and mixed phase nanocomposites,26,31,33,34
and or in some cases result in
exfoliated nanocomposites.31
Ratanarat et al. reported that generation 2.0 (G2.0)
polyamidoamine (PAMAM) forms an exfoliated nanocomposite with
Na-montmorillonite.35
Alongi et al. reported the synthesis of nanomposites containing
higher generation (G4.0−7.0) PAMAM with Na-montmorillonite (d = 0.78−0.97
nm).33
Nanocomposites can show dramatic property changes with respect to their
native constitutents, or even to micro/macrocomposites of similar composition. The
thermal stability of a polymer-layered-silicate nanocomposite of
poly(methylmethacrylate) (PMMA) and montmorillonite clay increases by 40-50
C.36
The nanocomposited forms of both linear and cross-linked PMMA in
19
montmorillonite are more stable by 40–50 C than the native polymers.36
This
increased stability is ascribed to both the structure change and to the restricted
thermal motion of the PMMA intercalates in the nanocomposite galleries. Aside from
thermal stability, reduced gas & liquid permeability, increased flame retardancy and
increased optical clarity have all been reported for polymer montmorillonite
nanocomposites.11
Adding to previous reports on the formation of some dendrimer-
montmorillonite nanocomposites, in Chapter 3 this dissertation will report the
formation and characterization of new lower generation polyamidoamine dendrimer
Na-montmorillonite nanocomposites. The materials contain a flattened PAMAM
monolayer or bilayer arrangement within galleries, and a monolayer to bilayer
transition with increasing dendrimer content.
20
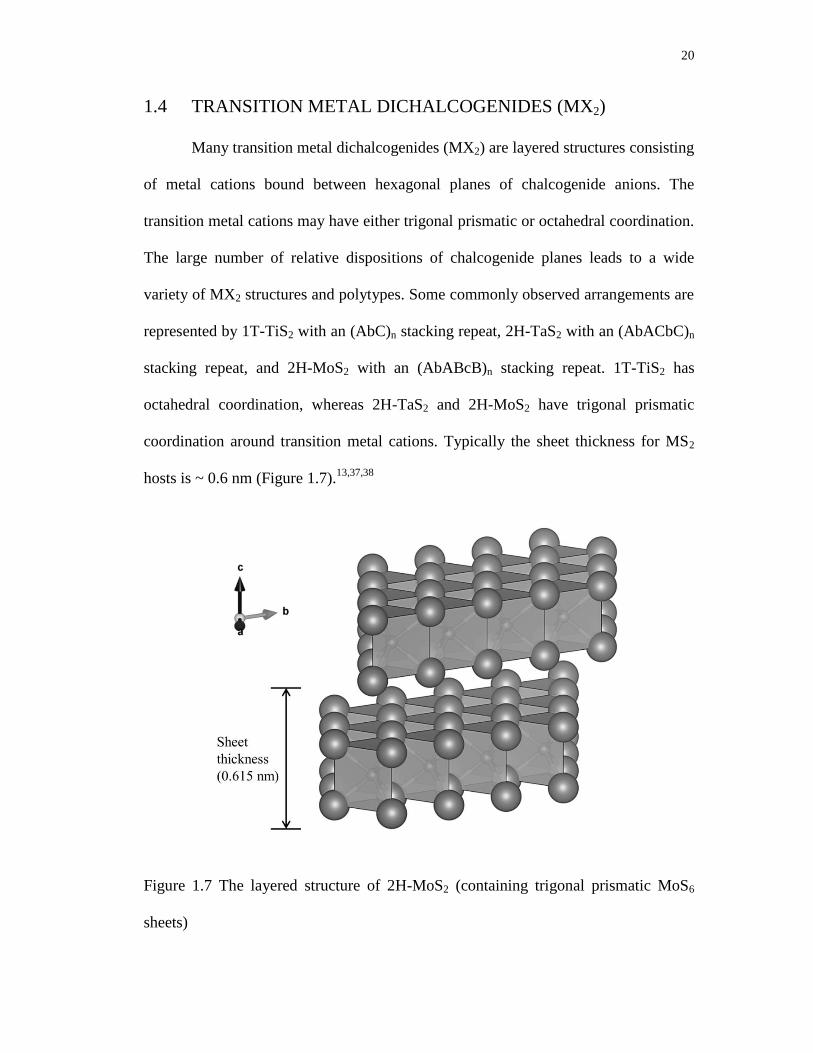
1.4 TRANSITION METAL DICHALCOGENIDES (MX2)
Many transition metal dichalcogenides (MX2) are layered structures consisting
of metal cations bound between hexagonal planes of chalcogenide anions. The
transition metal cations may have either trigonal prismatic or octahedral coordination.
The large number of relative dispositions of chalcogenide planes leads to a wide
variety of MX2 structures and polytypes. Some commonly observed arrangements are
represented by 1T-TiS2 with an (AbC)n stacking repeat, 2H-TaS2 with an (AbACbC)n
stacking repeat, and 2H-MoS2 with an (AbABcB)n stacking repeat. 1T-TiS2 has
octahedral coordination, whereas 2H-TaS2 and 2H-MoS2 have trigonal prismatic
coordination around transition metal cations. Typically the sheet thickness for MS2
hosts is ~ 0.6 nm (Figure 1.7).13,37,38
Figure 1.7 The layered structure of 2H-MoS2 (containing trigonal prismatic MoS6
sheets)
21
These layered materials have been investigated intensively as intercalation
hosts. Known intercalates include the alkali metal cations, alkylammonium cations,
ammonia, amines, water and other solvents. Alkali metal intercalation compounds
can be obtained directly by high temperature solid state synthesis, either by the
reaction of an MX2 host with an alkali metal, or by the direct reaction of the A, M and
X constituent elements.13, 37
Another widely-used technique is the intercalation of the
MX2 host using a liquid-phase reductant like butyllithium or sodium naphthalide
dissolved in suitable organic solvents, or with alkali metals dissolved in liquid
ammonia.2,13,39-41
Another common synthetic approach involves the electrochemical
reduction of the MX2 host in a suitable electrolyte.42,43
For the MX2 host structures with more readily reduced transition metal
cations, reductive intercalation can be accomplished using ammonia, amines or
aqueous solutions. This redox process need not involve any other reductant. In many
cases, additional neutral solvent co-intercalates along with cations.13
Alkali metal intercalation of MS2 was first observed in 1959, when Rudorff
reported a wide range of AxMX2 intercalation compounds prepared from MoS2,
MoSe2, WS2, WSe2, ReS2, TiS2, and TiSe2.2,39
Rouxel and coworkers also extensively
studied the intercalation of the group 4 transition metal MX2 compounds.37
Whittingham et al. studied the lithium intercalation of MX2, and Schollhorn et al.
reported several different syntheses and exchange reactions for MX2 intercalation
compounds.13,44
22
Rudorff reported the formation of Li0.8MoS20.8NH3, Na0.6MoS2, K0.6MoS2
and Cs0.5MoS2 compounds with interlayer expansions of 0.335, 0.135, 0.195 and
0.274 nm, respectively.39
The much larger expansion seen in Li0.8MoS20.8NH3 arises
from the presence of NH3 co-intercalate. Schollhorn and Weiss reported that these
intercalation compounds absorb water with a further increase in Δd of 0.29–0.70 nm,
depending on the reaction conditions.44
A series of alkali metal and alkaline earth intercalation compounds of MoS2
were synthesized in anhydrous NH3(l), with the observed d values ranging from
0.14 to 0.37 nm.40,41
The same method was utilized to prepare intercalation
compounds for TaS2, with the resulting products NaxTaS2 and KxTaS2 giving d of
0.11 and 0.21 nm, respectively.45
Some organic and inorganic bases react to form intercalation compounds with
groups 4 and 5 MX2 hosts, with d ranging from 0.30 nm (for smaller molecules like
NH3) to 5.23 nm (for octadecylamine), with compositions reflecting the uptake of 0.1
to 1.0 guests per MX2 unit.37
Schollhorn and Zagefka have suggested that in these
reactions the metals are reduced and amine molecules are protonated and intercalate
as ammonium cations; the interaction between the host and guest has been ascribed to
either charge transfer or a redox reaction.46
The correlation of reactivities to redox
potentials supports the latter interpretation. For example, the Group 6 chalcogenides
hosts are less easily reduced and do not react to form intercalation compounds with
organic bases.13,37

23
Some MX2 hosts react in strong aqueous base to intercalate hydrated alkali
metal cations, e.g. Na0.3TaS2H2O.37,47
These complex intercalates undergo facile
exchange in aqueous salt solutions.44
The water co-intercalate can be displaced in
polar inorganic or organic solvents (i.e. alcohols, ethers, amines, sulfoxides, etc).44
The product compositions, including both the contents of intercalate cations and of
cointercalates, depend on the degree of reduction, conditions of exposure to the
exchange solutions, and post-reaction processing.
Ethylenediamine (en) and trimethylenediamine (tn) react directly with TiS2,
NbS2, and TaS2 to form intercalation compounds with d = 0.34–0.41 nm. These
gallery dimensions indicate that the amine intercalates form monolayers with long
molecular axes oriented parallel to the host layers.48-50
These products show a
compositional range that depends on the host and the sample processing conditions,
with intercalate to MX2 ratios of 0.17–0.39 for en and 0.15–0.33 for tn. Secondary
amines, such as diethylamine, dibutylamine, and dipentylamine react with exfoliated
MoS2, generating Li0.1MoS2dialkylamine, with ranges of = 0.11–0.42 and
d = 0.37–0.45 nm, depending on the dialkylamine cointercalate.51
Recently, electride solutions in liquid amines have been used to synthesize
graphite intercalation compounds.7,52-54
In Chapter 4, the use of amine electride
chemistry to synthesize intercalation compounds of MoS2 will be described in detail.
24
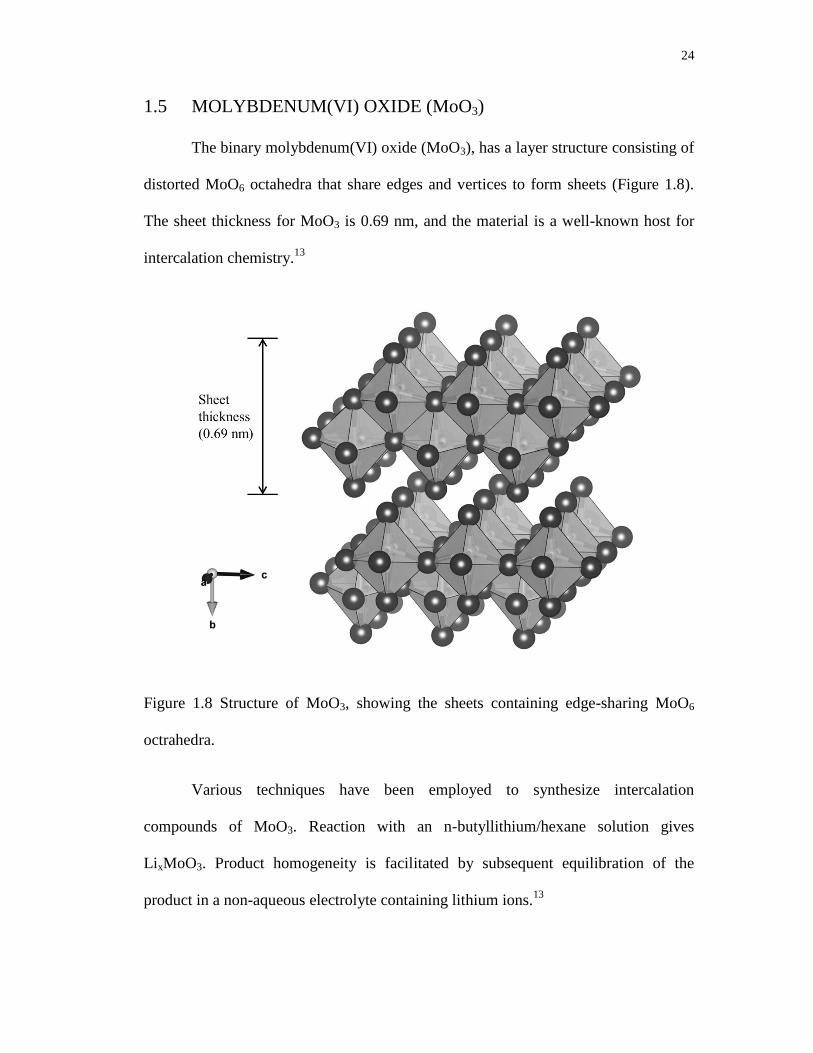
1.5 MOLYBDENUM(VI) OXIDE (MoO3)
The binary molybdenum(VI) oxide (MoO3), has a layer structure consisting of
distorted MoO6 octahedra that share edges and vertices to form sheets (Figure 1.8).
The sheet thickness for MoO3 is 0.69 nm, and the material is a well-known host for
intercalation chemistry.13
Figure 1.8 Structure of MoO3, showing the sheets containing edge-sharing MoO6
octrahedra.
Various techniques have been employed to synthesize intercalation
compounds of MoO3. Reaction with an n-butyllithium/hexane solution gives
LixMoO3. Product homogeneity is facilitated by subsequent equilibration of the
product in a non-aqueous electrolyte containing lithium ions.13

25
Li(s)|Li+(nonaqueous solvent)|MoO3 electrochemical cells with non-aqueous
electrolytes have an open-circuit voltage of ~ 2.8 V and have been utilized to
intercalate lithium into MoO3. Typical electrolytes are LiClO4 or LiI dissolved in
organic solvents like dimethylsulfoxide (DMSO) or propylene carbonate (PC).55
The
extent of these reactions can often be monitored coulometrically, and the products
obtained have the general formula of LixMoO3 and d ~ 0.1 nm. The
charge/discharge reaction is reversible up to x = 1.5.13
The intercalation of MoO3 by hydrogen is perhaps the most extensively
investigated. Chemical reduction of MoO3 in aqueous acid was first shown by
Glemser et al. to form a series of compounds that could be formulated as HxMoO3.13,
56-58 The vigorous reduction of MoO3 by Zn/HCl produces H2MoO3.
59 Intermediate
phases in the 0 < x < 2 range are obtained by the reaction of H2MoO3 with MoO3 in
sealed tubes at < 100 C.59
Four distinct and highly colored hydrogen bronze phases
are observed: blue orthorhombic (0.23 < x < 0.40), blue monoclinic (0.85 < x < 1.04),
red monoclinic (1.55 < x < 1.72), and green monoclinic (x = 1.99).59
These hydrogen
intercalation compounds are acidic and will react with Lewis bases (L) to form
intercalation compounds of general composition LyHxMoO3.13,55
Stoichiometric MoO3 is a white insulator; reductive intercalation, even at low
levels, results in both a large increase in electronic conductivity and a dramatic color
change to metallic blue-black. The intercalation compounds are often rapidly
re-oxidized when exposed to air.13
26
The cathodic reduction of MoO3 in aqueous solutions (typically mineral
acids)55
results in protonation to form HxMoO3; whereas the use of aqueous
electrolytes containing alkali metal or transition metal ions leads to metallic blue
hydrated phases Ax+(H2O)y[MoO3]
x-. For example, MoO3 is reduced in Na2S2O4(aq)
to form Nax(H2O)yMoO3. Both intercalate ions and co-intercalate solvent are often
readily exchanged by reaction with aqueous or polar organic solutions (e.g. DMSO).
Observed interlayer expansions are ~ 0.28 nm with large monovalent cations (Rb+,
Cs+), ~ 0.46 nm with small monovalent cations (Li
+, Na
+, K
+, NH4
+) and ~ 0.71 nm
for divalent cations.13,55
The reaction of Lix(H2O)yMoO3 with aqueous polymer solutions can result in
exchange of water for a polymer co-intercalate.25
Previous studies have reported the
intercalation of polyethylene oxide (PEO),27,60
linear polyethylenimine (LPEI),25
polyaniline (PANI),61
polyvinylpyrrolidone (PVP) and polyacrylamide (PAM),62
using this method or melt intercalation method.27
The interlayer expansions vary from
0.47 - 0.83 nm, depending on the polymer and how it is arranged in the galleries (for
example, to form mono or bilayers).25,61,63
Dendrimers are branched polymers which can similarly exchange into the
galleries. There have been no previous reports on the intercalation of dendrimers into
MoO3. The synthesis and characterization of dendrimer-MoO3 nanocomposites are
discussed in Appendix A.
27
1.6 SUMMARY
The further development of intercalation chemistry holds numerous
possibilities and potential impacts. The discovery of new synthetic routes, new
compounds, and new nanocomposites, may all solve important technological
problems. The next three chapters and Appendix A of this dissertation will describe
some novel experimental techniques to synthesize intercalation compounds and the
characterization of the new materials thereby obtained.
1.7 REFERENCES
1. A. Lerf, in Handbook of nanostructured materials and nanotechnology, ed. H.
S. Nalwa, Academic Press, San Diego, 2000, vol. 5, ch. 1, pp. 1-166.
2. W. Rüdorff and H. H. Sick, Angew. Chem., 1959, 71, 127.
3. A. Lerf, Dalton Trans., 2014, 43, 10276-10291.
4. A. J. Jacobson and L. F. Nazar, Intercalation Chemistry, Encyclopedia of
Inorganic and Bioinorganic Chemistry, John Wiley & Sons, 2011.
5. S. T. Wilson, B. M. Lok, C. A. Messina, T. R. Cannan and E. M. Flanigen, J.
Am. Chem. Soc., 1982, 104, 1146-1147.
6. J. H. Wu and M. M. Lerner, Chem. Mater., 1993, 5, 835-838.
7. T. Maluangnont, K. Gotoh, K. Fujiwara and M. M. Lerner, Carbon, 2011, 49,
1040-1042.

28
8. F. R. Gamble, J. H. Osiecki, M. Cais, R. Pisharody, F. J. Disalvo and T. H.
Geballe, Science, 1971, 174, 493-497.
9. L. M. Liu, Z. N. Qi and X. G. Zhu, J. Appl. Polym. Sci., 1999, 71, 1133-1138.
10. E. P. Giannelis, Adv. Mater., 1996, 8, 29-35.
11. S. Pavlidou and C. D. Papaspyrides, Prog. Polym. Sci., 2008, 33, 1119-1198.
12. M. Alexandre and P. Dubois, Mater. Sci. Eng. R, 2000, 28, 1-63.
13. Intercalation Chemistry, ed. M. S. Whittingham and A. J. Jacobson,
Academic Press, New York, NY, 1982.
14. G. Ouvrard, R. Brec and J. Rouxel, Mater. Res. Bull., 1985, 20, 1181-1189.
15. R. Brec, Solid State Ionics, 1986, 22, 3-30.
16. P. J. S. Foot and B. A. Nevett, Chem. Commun., 1987, 380-381.
17. E. Prouzet, G. Ouvrard, R. Brec and P. Seguineau, Solid State Ionics, 1988,
31, 79-90.
18. H. Loboue, C. Guillot-Deudon, A. F. Popa, A. Lafond, B. Rebours, C. Pichon,
T. Cseri, G. Berhault and C. Geantet, Catal. Today, 2008, 130, 63-68.
19. S. Yamanaka, H. Kobayashi and M. Tanaka, Chem. Lett., 1976, 329-332.
20. A. Lemehaute, C. R. Acad. Sci., 1978, 287, 309-311.
21. I. Lagadic, A. Leaustic and R. Clement, Chem. Comm., 1992, 1396-1397.
29
22. P. Jeevanandam and S. Vasudevan, Chem. Mater., 1998, 10, 1276-1285.
23. V. Manriquez, P. Barahona, D. Ruiz and R. E. Avila, Mater. Res. Bull., 2005,
40, 475-483.
24. E. Manova, C. Severac, A. Andreev and R. Clement, J. Catal., 1997, 169,
503-509.
25. C. O. Oriakhi, R. L. Nafshun and M. M. Lerner, Mater. Res. Bull., 1996, 31,
1513-1520.
26. F. Chen, H. Xiong, J. T. Yang, W. W. Cai and M. Q. Zhong, e-Polym., 2012,
No. 016.
27. N. Sukpirom, C. O. Oriakhi and M. M. Lerner, Mater. Res. Bull., 2000, 35,
325-331.
28. S. S. Ray and M. Okamoto, Prog. Polym. Sci., 2003, 28, 1539.
29. R. A. Vaia and E. P. Giannelis, Macromolecules, 1997, 30, 8000-8009.
30. K. A. Carrado, P. Thiyagarajan and D. L. Elder, Clays Clay Miner., 1996, 44,
506-514.
31. S. He and J. Lin, Appl. Mech. Mater., 2012, 108, 91-94.
32. M. Rodlert, C. J. G. Plummer, L. Garamszegi, Y. Leterrier, H. J. M.
Grunbauer and J. A. E. Manson, Polymer, 2004, 45, 949-960.
30
33. J. Alongi, O. Monticelli, S. Russo and G. Camino, J. Nanostruct. Polym.
Nanocompos., 2006, 2, 127-133.
34. T.-Y. Juang, Y.-C. Chen, C.-C. Tsai, S. A. Dai, T.-M. Wu and R.-J. Jeng,
Appl. Clay Sci., 2010, 48, 103-110.
35. K. Ratanarat, M. Nithitanakul, D. C. Martin and R. Magaraphan, Rev. Adv.
Mater. Sci., 2003, 5, 187-192.
36. J. W. Gilman, Appl. Clay Sci., 1999, 15, 31-49.
37. Intercalated layered materials, ed., F. A. Lévy, D. Reidel Publishing,
Dordrecht, Holland, 1979.
38. E. Benavente, M. A. Santa Ana, F. Mendizabal and G. Gonzalez, Coord.
Chem. Rev., 2002, 224, 87-109.
39. W. Rüdorff, Chimia, 1965, 19.
40. R. B. Somoano, V. Hadek and A. Rembaum, J. Chem. Phys., 1973, 58, 697-
701.
41. R. B. Somoano, V. Hadek, A. Rembaum, S. Samson and J. A. Woollam, J.
Chem. Phys., 1975, 62, 1068-1073.
42. M. A. Santa Ana, V. Sanchez and G. Gonzalez, Electrochim. Acta, 1995, 40,
1773-1775.
43. M. S. Whittingham, J. Electroanal. Chem., 1981, 118, 229-239.
31
44. R. Schöllhorn and A. Weiss, J. Less-Common Met., 1974, 36, 229-236.
45. O. Matsumoto, E. Yamada, Y. Kanzaki and M. Konuma, J. Phys. Chem.
Solids, 1978, 39, 191-192.
46. R. Schollhorn and H. D. Zagefka, Angew. Chem. Int. Ed., 1977, 16, 199-200.
47. M. S. Whittingham, Mater. Res. Bull., 1974, 9, 1681-1690.
48. H. Ogata, H. Fujimori, S. Miyajima, K. Kobashi, T. Chiba, R. E. Taylor and
K. Endo, J. Phys. Chem. Solids, 1997, 58, 701-710.
49. E. Figueroa, J. W. Brill and J. P. Selegue, J. Phys. Chem. Solids, 1996, 57,
1123-1127.
50. H. Boller and H. Blaha, J. Solid State Chem., 1982, 45, 119-126.
51. V. Sanchez, E. Benavente, M. A. Santa Ana and G. Gonzalez, Chem. Mater.,
1999, 11, 2296-2298.
52. T. Maluangnont, G. T. Bui, B. A. Huntington and M. M. Lerner, Chem.
Mater., 2011, 23, 1091-1095.
53. T. Maluangnont, M. M. Lerner and K. Gotoh, Inorg. Chem., 2011, 50, 11676-
11682.
54. T. Maluangnont, W. Sirisaksoontorn and M. M. Lerner, Carbon, 2012, 50,
597-602.

32
55. R. Schollhorn, R. Kuhlmann and J. O. Besenhard, Mater. Res. Bull., 1976, 11,
83-90.
56. O. Glemser and G. Lutz, Z. Anorg. Allg. Chem., 1951, 264, 17.
57. O. Glemser and G. Lutz, Z. Anorg. Allg. Chem., 1952, 269, 93.
58. O. Glemser, G. Lutz and G. Meyer, Z. Anorg. Allg. Chem., 1956, 285, 173.
59. J. J. Birtill and P. G. Dickens, Mater. Res. Bull., 1978, 13, 311-316.
60. Y. S. Hu, W. Chen, Q. Xu and R. Z. Yuan, J. Mater. Sci. Technol., 2001, 17,
S124-S126.
61. O. Y. Posudievsky, S. A. Biskulova and V. D. Pokhodenko, J. Mater. Chem.,
2002, 12, 1446-1449.
62. L. Wang, J. Schindler, C. R. Kannewurf and M. G. Kanatzidis, J. Mater.
Chem., 1997, 7, 1277-1283.
63. L. F. Nazar, H. Wu and W. P. Power, J. Mater. Chem., 1995, 5, 1985-1993.
33
CHAPTER 2
TEMPLATE PREPARATION OF NiPS3 POLYMER
NANOCOMPOSITES
Amila Udayanga Liyanage, and Michael M. Lerner
Department of Chemistry
Oregon State University
Corvallis, OR 97331-4003, USA
RSC Adv., 2012, 2, 474-479.
34
2.1 ABSTRACT
A template synthesis method can be used to prepare NiPS3 nanocomposites
with polyethylene oxide (PEO), polyethylenimine (PEI), polyvinyl alcohol (PVA)
and polyvinylpyrrolidone (PVP). Nanocomposites of NiPS3/PEI, NiPS3/PVA and
NiPS3/PVP have not been previously reported. The resulting materials are
characterized by powder X-ray diffraction (PXRD), thermogravimetric analysis
(TGA), scanning electron microscope (SEM) and energy-dispersive X-ray
spectroscopy (EDS). Reaction progress was monitored using UV-visible
spectroscopy. Template synthesized NiPS3/PEO nanocomposites show only polymer
zig-zag monolayers, in contrast to the bilayers obtained using the topotactic method,
and can generate denser interlayers than those obtained by topotactic methods. The
crystallite sizes increase for more dilute conditions, a more polar solvent, and longer
aging time. P2S64-
and Ni2+
concentrations govern nanocomposite nucleation and
growth, respectively.
35
2.2 INTRODUCTION
MPS3 and materials containing MPS3 layers show interesting properties for
nonlinear optics,1,2
magnetic3,4
or photomagnetic devices,5 catalysis,
6 and energy
storage in secondary batteries.7 For the latter example, NiPS3 shows an
electrochemical reduction that proceeds in several stages at potentials from 2.7 to 1.8
V up to a Li/Ni ratio of ~7.5. The reduction occurs quasi-reversibly over the range 0
Li/Ni 3 range, providing a high theoretical capacity as a secondary cathode.7
Xiao et al. reported that MoS2 shows a significantly higher reversible capacity
after an exfoliation process. Furthermore, the formation of a nanocomposite with
polyethylene oxide (PEO) allows both higher capacities and improved
charge/discharge cycling.8 Since MS2 and MPS3 are both layered materials with
intercalation chemistries, the preparation and electrochemical characterization of
PEO/NiPS3 nanocomposites are therefore of interest.
The synthesis and structures of MPS3 nanocomposites with different polymers
has been studied by several groups. In all cases, a topotactic method has been
employed, starting with a compound containing alkali metal cations between MPS3
layers. This intercalation compound may be obtained directly at high temperature,9 or
by introduction of alkali metal cations into the MPS3 host via ion exchange10
or
reduction of the M(II) cations in the host layers.6 The alkali metal cations likely
enable nanocomposite formation by coordinating to polymer functional groups, as has
been observed with many other layered hosts.11
36
Lagadic et al. first reported the synthesis of nanocomposites of PEO and
MPS3 (M = Mn, Cd) by reacting an aqueous polymer solution with M1-xPS3A2x(H2O)y
(A = Na, K). The products obtained showed gallery expansions of ≈ 0.8-0.9 nm,
consistent with the intercalation of bilayers of zig-zag-like PEO chains that
coordinate to alkali metal ions.10
Jeevanandam et al. subsequently prepared
PEO/CdPS3 nanocomposites in a methanolic solution at 55 °C.12
Manriquez et al.
reported the preparation of PEO nanocomposites from LixMPS3 (M = Ni, Fe) using a
similar approach. However, in this case the authors proposed a polymer helical
conformation.9
Manova et al. reported the intercalation of polyethylene glycol into a
NaxNiPS3 by reaction in a methanolic aqueous solution, with a gallery expansion of
≈0.8 nm.6
Other polymers that are known to form nanocomposites with MPS3 layers
include linear polyethylenimine, LPEI, and polyvinylpyrrolidone, PVP. The former
was reported by Oriakhi et al. to form nanocomposites with polymer monolayers
(expansion of 0.4 nm) via the reaction of Kx(H2O)yM1-x/2PS3 (M = Mn, Cd) and
polymer in aqueous solution;13
the latter was reported by Yang et al. via reaction of a
potassium intercalated intermediate MPS3 (M = Mn, Cd) and an aqueous PVP
solution. The interlayer expansion in that case was ≈ 2.3 nm, much greater than that
for PEO.14
A solvent-free, melt intercalation approach to obtain PEO/MPS3
nanocomposites (M = Mn, Cd) was reported by Sukpirom et al. With this method,
37
KxM1-x/2PS3·H2O was shown to directly intercalate PEO at 125 °C. The
nanocomposite basal repeat distances were increased by ≈ 0.8 nm, again ascribed to
the presence of PEO bilayers.15
MPS3 compounds are normally prepared by combining the elements or simple
precursors at elevated temperature.16,17
However, the synthesis of highly disordered or
amorphous NiPS3 at ambient temperature has been reported by reaction of Ni2+
salts
with alkali metal hexathiohypodiphosphate (Na4P2S6.6H2O or Li4P2S6.6H2O) in
aqueous solution.18-20
In the following study, we describe the first template approach
to MPS3 compounds, where layered nanocomposites are obtained directly using a
one-pot reaction with solution-phase precursors at ambient temperature.
2.3 EXPERIMENTAL
2.3.1 REAGENTS AND ANALYTICAL METHODS
Li2S (99.9%, Cerac), P (99%, Johnson Matthey), S (99.9%, Mallinckrodt),
Ni(NO3)2·6H2O (Aldrich), PEO (Aldrich, Mw=100,000), linear polyethylenimine
(Alfa Aeser, Mw=25,000), polyvinyl alcohol, 80% hydrolyzed (Aldrich, Mw=9-
10,000) and polyvinylpyrrolidone (Alfa Aeser, Mw=8,000) were purchased and used
without further purification.
Powder XRD (PXRD) patterns from 3-60° 2θ were obtained on a Rigaku
Miniflex II diffractometer, using Ni-filtered Cu-K radiation at a scan rate of 3° min-1
and step size of 0.020° 2θ. A modified Scherrer equation21
was used to determine
crystallite size (L) for the prepared nanocomposites:
38
(1)
where = 0.15406 nm, (2θhkl) = full width at half maximum (in radians) and θhkl =
diffraction angle. A Si(m) powder standard was employed for these measurements.
Thermogravimetric (TGA) analyses were performed under Ar flow (20 mL min-1
)
using a Shimadzu TGA-50 analyzer, from ambient to 500 °C at 5 °C min-1
. An
Agilent 8453 UV-visible spectrophotometer was used for UV analyses. Background
subtractions were carried out for all the UV-visible measurements. Scanning electron
micrographs (SEMs) were obtained using an FEI Quanta 600F FEG SEM. Energy-
dispersive X-ray spectroscopy (EDS) was used as a semi-quantitative elemental
analysis method.
Van der Waals volumes of C2H4O oligomers (C = 2-40) were calculated based
on Bondi radii using a method termed Atomic and Bond Contributions of van der
Waals volume (VABC).22
2.3.2 SYNTHESES
Li4P2S6 was synthesized as a white powder according to a published
procedure.23
Li2S, P and S were combined in 1 : 1 : 2 mole ratio and sealed in a quartz
tube under an inert atmosphere. The mixture was heated to 900 °C at 100 °C h-1
,
maintained at 900 °C for 0.5 h, rapidly cooled to 450 °C and held at 450 °C for 24 h.
Highly disordered or amorphous NiPS3 was synthesized via a process previously
reported by Prouzet et al.19
An aqueous solution of Ni(NO3)2·6H2O (0.31 g, 5.00 mL)
was added dropwise to an aqueous solution of Li4P2S6 (0.10 g, 5.00 mL) and stirred
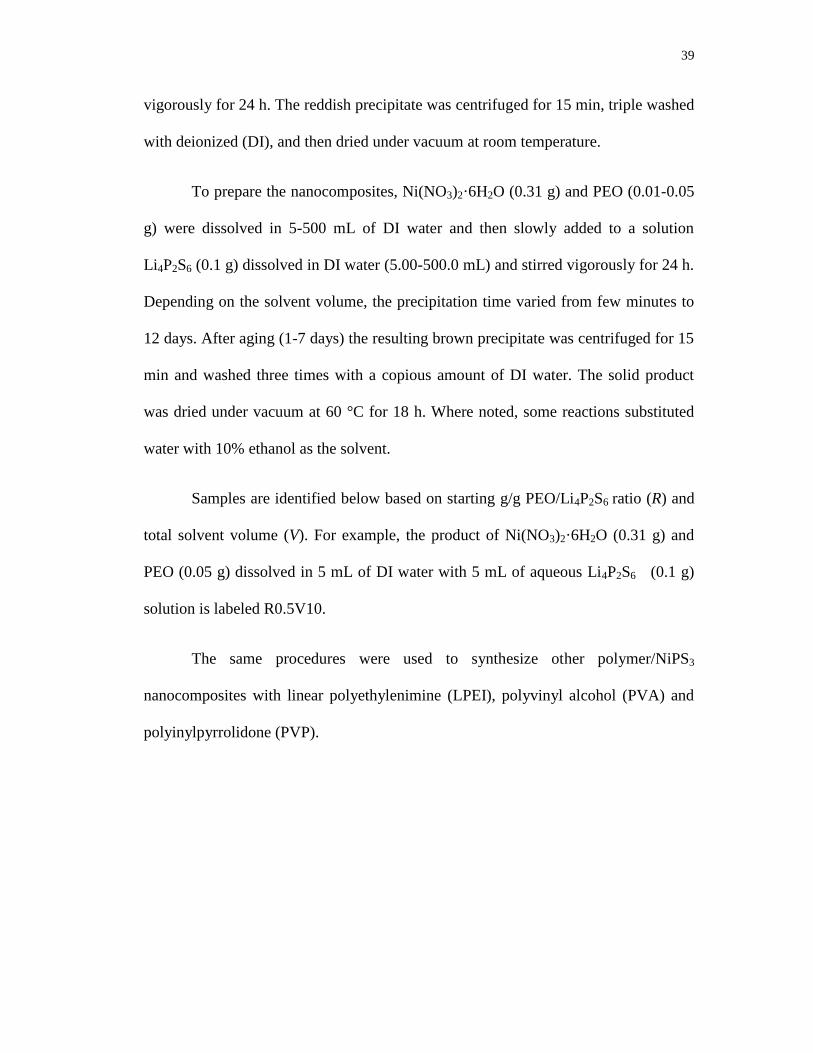
39
vigorously for 24 h. The reddish precipitate was centrifuged for 15 min, triple washed
with deionized (DI), and then dried under vacuum at room temperature.
To prepare the nanocomposites, Ni(NO3)2·6H2O (0.31 g) and PEO (0.01-0.05
g) were dissolved in 5-500 mL of DI water and then slowly added to a solution
Li4P2S6 (0.1 g) dissolved in DI water (5.00-500.0 mL) and stirred vigorously for 24 h.
Depending on the solvent volume, the precipitation time varied from few minutes to
12 days. After aging (1-7 days) the resulting brown precipitate was centrifuged for 15
min and washed three times with a copious amount of DI water. The solid product
was dried under vacuum at 60 °C for 18 h. Where noted, some reactions substituted
water with 10% ethanol as the solvent.
Samples are identified below based on starting g/g PEO/Li4P2S6 ratio (R) and
total solvent volume (V). For example, the product of Ni(NO3)2·6H2O (0.31 g) and
PEO (0.05 g) dissolved in 5 mL of DI water with 5 mL of aqueous Li4P2S6 (0.1 g)
solution is labeled R0.5V10.
The same procedures were used to synthesize other polymer/NiPS3
nanocomposites with linear polyethylenimine (LPEI), polyvinyl alcohol (PVA) and
polyinylpyrrolidone (PVP).
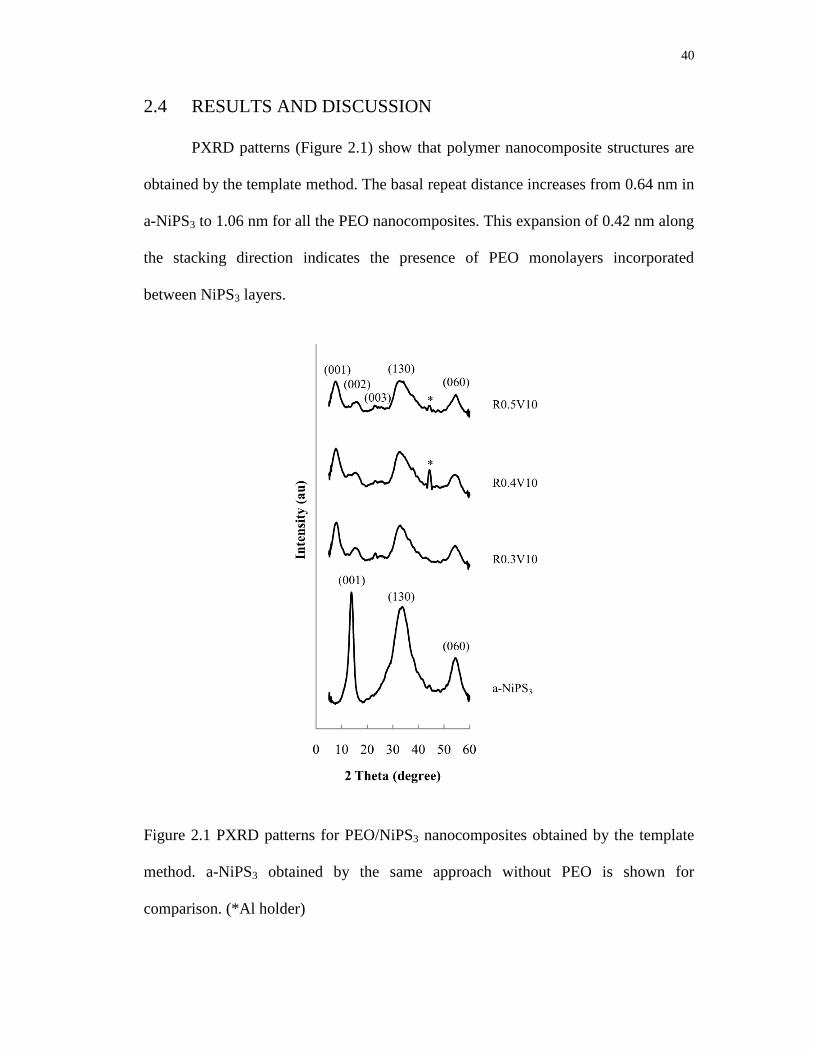
40
2.4 RESULTS AND DISCUSSION
PXRD patterns (Figure 2.1) show that polymer nanocomposite structures are
obtained by the template method. The basal repeat distance increases from 0.64 nm in
a-NiPS3 to 1.06 nm for all the PEO nanocomposites. This expansion of 0.42 nm along
the stacking direction indicates the presence of PEO monolayers incorporated
between NiPS3 layers.
Figure 2.1 PXRD patterns for PEO/NiPS3 nanocomposites obtained by the template
method. a-NiPS3 obtained by the same approach without PEO is shown for
comparison. (*Al holder)

41
Figure 2.2 shows a typical microstructure of the prepared PEO/NiPS3
nanocomposites, in this case for sample R0.5V10. The nanocomposites show an
expanded layered morphology with most particle dimensions above 10 m. For
samples with R = 0.5, i.e. with a high polymer content, SEM images also reveal the
presence of surface adsorbed polymer and show charging effects during imaging,
indicating the presence of non-conducting polymer on surfaces. TGA data (see
below) support the presence of surface-adsorbed PEO.
Figure 2.2 SEM image for a PEO/NiPS3 nanocomposite (sample R0.5V10).
EDS data indicates the presence of Ni, P, S, C and O in the nanocomposite
samples with an Ni : P : S ratio of 1 : 1 : 2.7. This supports the formation of host
NiPS3 structure from the precursors. Some sample degradation during analysis may
account for the less than nominal sulfur content.
Figure 2.3 shows thermal analysis data of the obtained products. The DTG
loss peak at 100–150 °C is ascribed to volatilization of intercalated water, and the loss
peak around 250 °C to PEO decomposition and volatilization. From the mass losses,
the relative contents of these components can be determined. For the R0.5V10
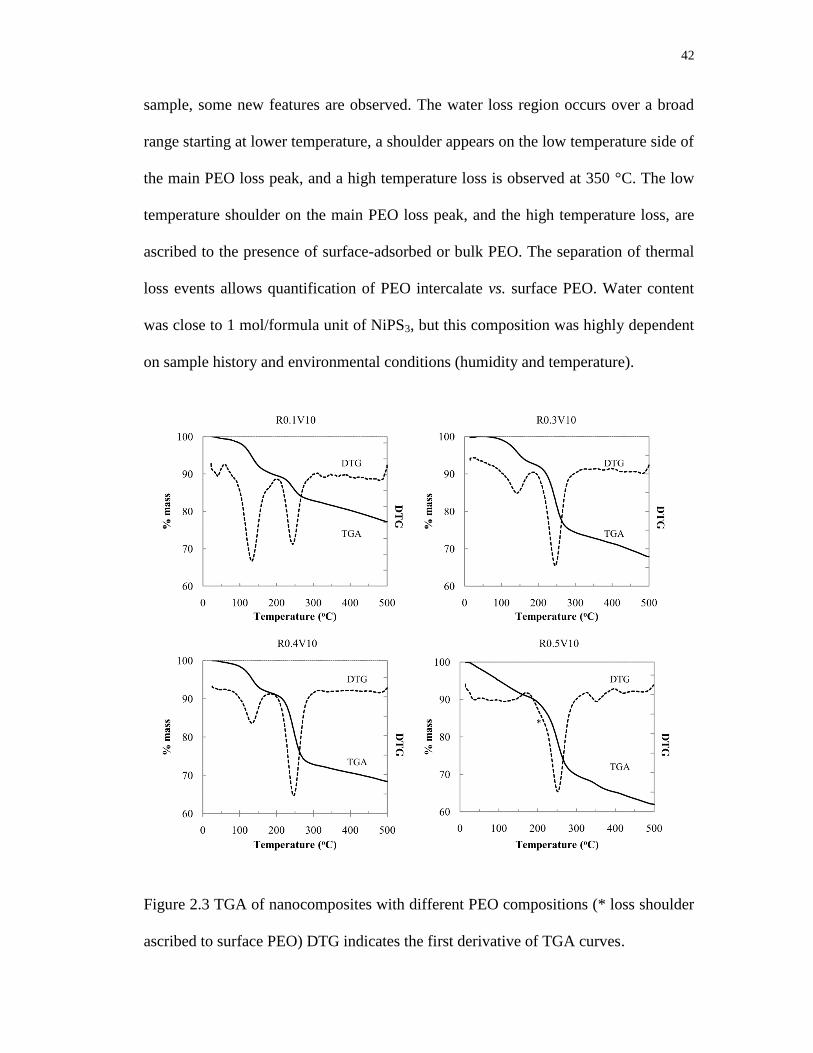
42
sample, some new features are observed. The water loss region occurs over a broad
range starting at lower temperature, a shoulder appears on the low temperature side of
the main PEO loss peak, and a high temperature loss is observed at 350 °C. The low
temperature shoulder on the main PEO loss peak, and the high temperature loss, are
ascribed to the presence of surface-adsorbed or bulk PEO. The separation of thermal
loss events allows quantification of PEO intercalate vs. surface PEO. Water content
was close to 1 mol/formula unit of NiPS3, but this composition was highly dependent
on sample history and environmental conditions (humidity and temperature).
Figure 2.3 TGA of nanocomposites with different PEO compositions (* loss shoulder
ascribed to surface PEO) DTG indicates the first derivative of TGA curves.
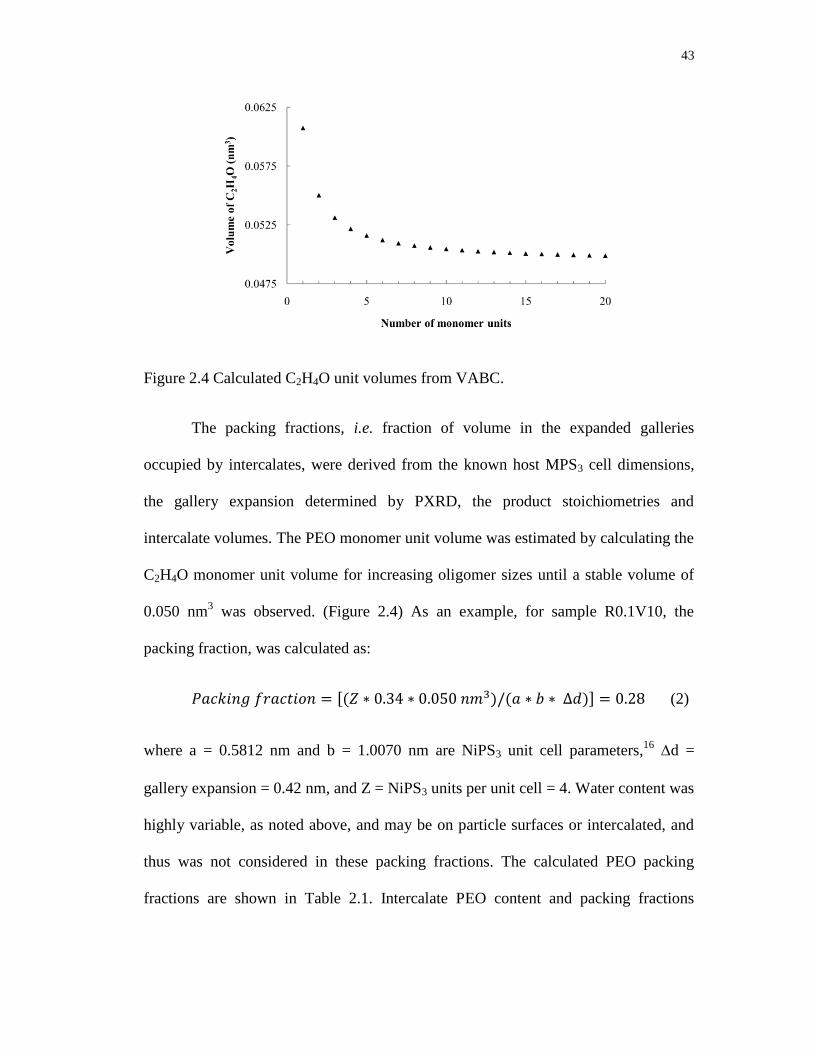
43
Figure 2.4 Calculated C2H4O unit volumes from VABC.
The packing fractions, i.e. fraction of volume in the expanded galleries
occupied by intercalates, were derived from the known host MPS3 cell dimensions,
the gallery expansion determined by PXRD, the product stoichiometries and
intercalate volumes. The PEO monomer unit volume was estimated by calculating the
C2H4O monomer unit volume for increasing oligomer sizes until a stable volume of
0.050 nm3 was observed. (Figure 2.4) As an example, for sample R0.1V10, the
packing fraction, was calculated as:
(2)
where a = 0.5812 nm and b = 1.0070 nm are NiPS3 unit cell parameters,16
d =
gallery expansion = 0.42 nm, and Z = NiPS3 units per unit cell = 4. Water content was
highly variable, as noted above, and may be on particle surfaces or intercalated, and
thus was not considered in these packing fractions. The calculated PEO packing
fractions are shown in Table 2.1. Intercalate PEO content and packing fractions
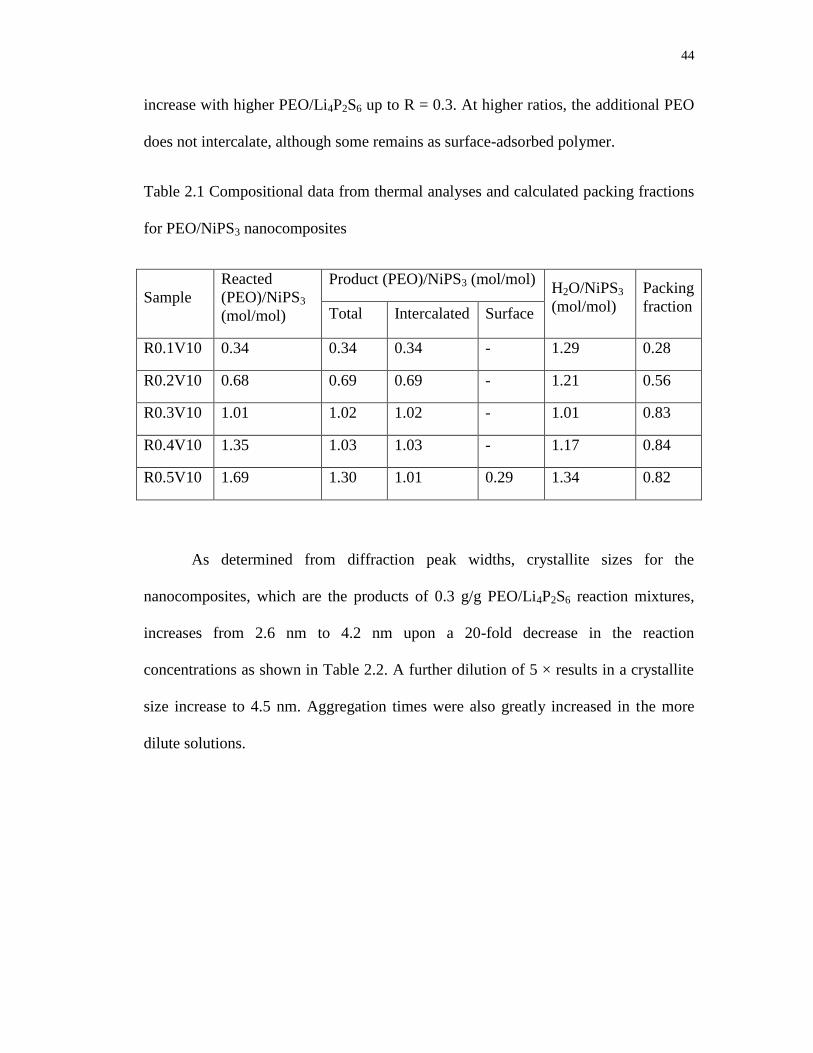
44
increase with higher PEO/Li4P2S6 up to R = 0.3. At higher ratios, the additional PEO
does not intercalate, although some remains as surface-adsorbed polymer.
Table 2.1 Compositional data from thermal analyses and calculated packing fractions
for PEO/NiPS3 nanocomposites
Sample
Reacted
(PEO)/NiPS3
(mol/mol)
Product (PEO)/NiPS3 (mol/mol) H2O/NiPS3
(mol/mol)
Packing
fraction Total Intercalated Surface
R0.1V10 0.34 0.34 0.34 - 1.29 0.28
R0.2V10 0.68 0.69 0.69 - 1.21 0.56
R0.3V10 1.01 1.02 1.02 - 1.01 0.83
R0.4V10 1.35 1.03 1.03 - 1.17 0.84
R0.5V10 1.69 1.30 1.01 0.29 1.34 0.82
As determined from diffraction peak widths, crystallite sizes for the
nanocomposites, which are the products of 0.3 g/g PEO/Li4P2S6 reaction mixtures,
increases from 2.6 nm to 4.2 nm upon a 20-fold decrease in the reaction
concentrations as shown in Table 2.2. A further dilution of 5 × results in a crystallite
size increase to 4.5 nm. Aggregation times were also greatly increased in the more
dilute solutions.
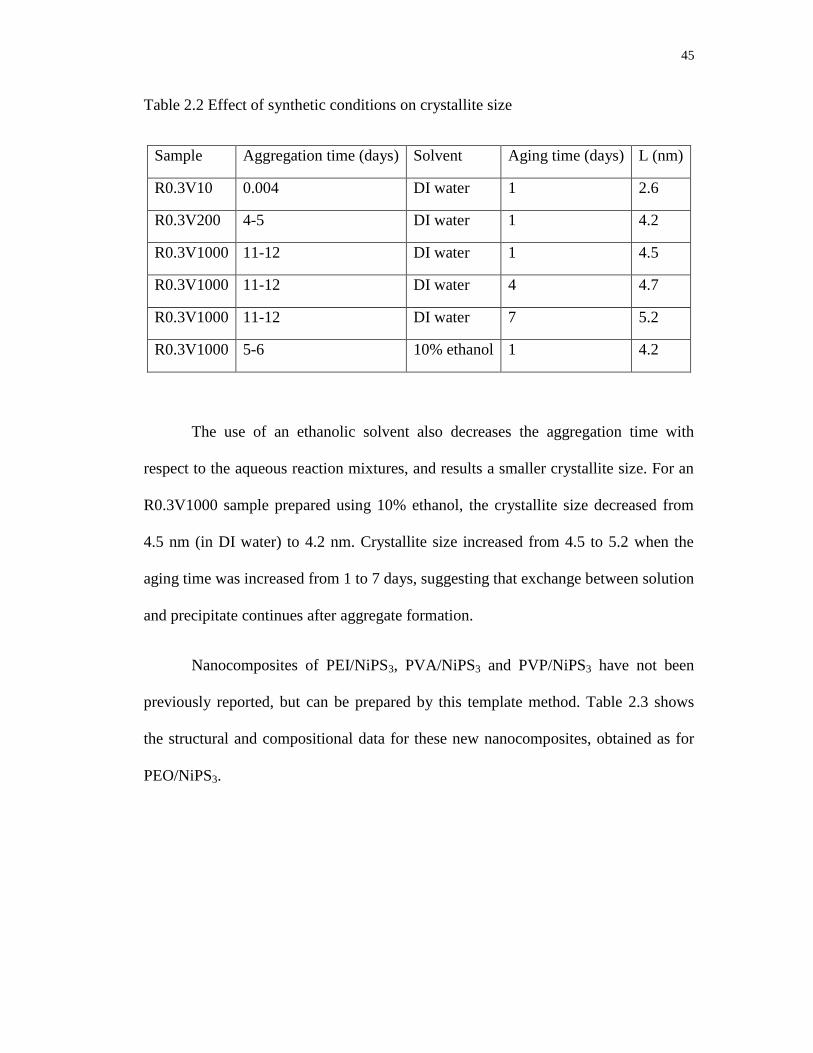
45
Table 2.2 Effect of synthetic conditions on crystallite size
Sample Aggregation time (days) Solvent Aging time (days) L (nm)
R0.3V10 0.004 DI water 1 2.6
R0.3V200 4-5 DI water 1 4.2
R0.3V1000 11-12 DI water 1 4.5
R0.3V1000 11-12 DI water 4 4.7
R0.3V1000 11-12 DI water 7 5.2
R0.3V1000 5-6 10% ethanol 1 4.2
The use of an ethanolic solvent also decreases the aggregation time with
respect to the aqueous reaction mixtures, and results a smaller crystallite size. For an
R0.3V1000 sample prepared using 10% ethanol, the crystallite size decreased from
4.5 nm (in DI water) to 4.2 nm. Crystallite size increased from 4.5 to 5.2 when the
aging time was increased from 1 to 7 days, suggesting that exchange between solution
and precipitate continues after aggregate formation.
Nanocomposites of PEI/NiPS3, PVA/NiPS3 and PVP/NiPS3 have not been
previously reported, but can be prepared by this template method. Table 2.3 shows
the structural and compositional data for these new nanocomposites, obtained as for
PEO/NiPS3.
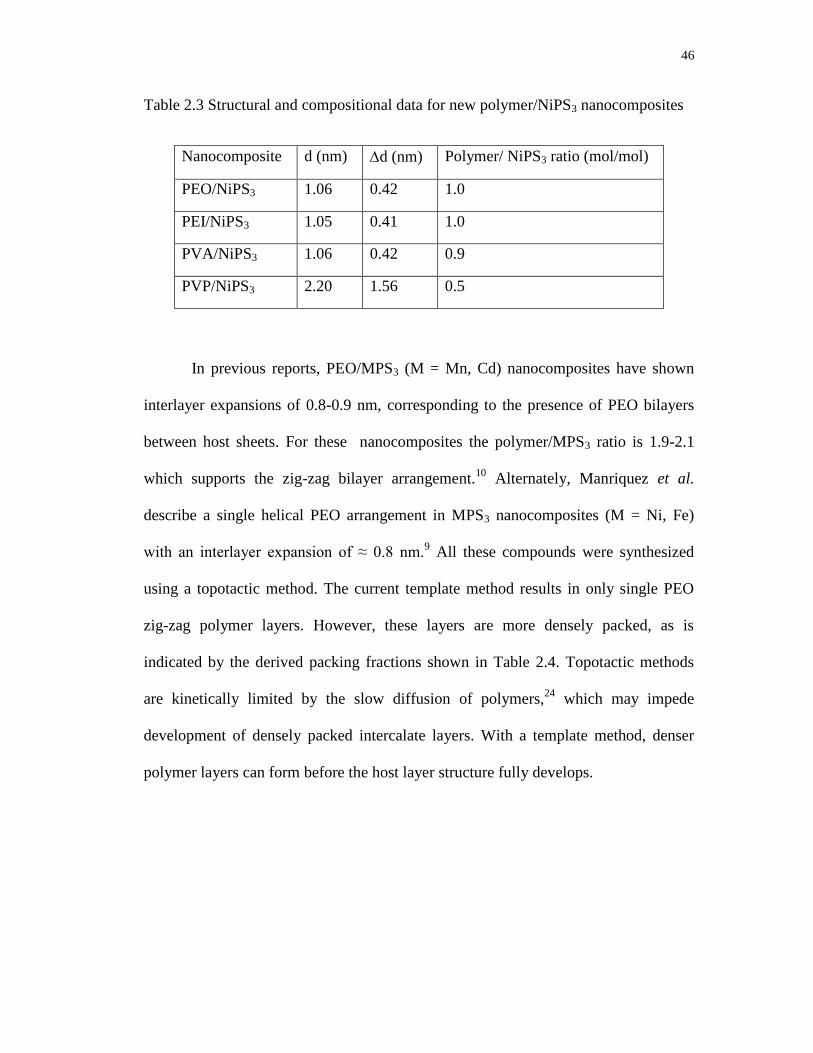
46
Table 2.3 Structural and compositional data for new polymer/NiPS3 nanocomposites
Nanocomposite d (nm) d (nm) Polymer/ NiPS3 ratio (mol/mol)
PEO/NiPS3 1.06 0.42 1.0
PEI/NiPS3 1.05 0.41 1.0
PVA/NiPS3 1.06 0.42 0.9
PVP/NiPS3 2.20 1.56 0.5
In previous reports, PEO/MPS3 (M = Mn, Cd) nanocomposites have shown
interlayer expansions of 0.8-0.9 nm, corresponding to the presence of PEO bilayers
between host sheets. For these nanocomposites the polymer/MPS3 ratio is 1.9-2.1
which supports the zig-zag bilayer arrangement.10
Alternately, Manriquez et al.
describe a single helical PEO arrangement in MPS3 nanocomposites (M = Ni, Fe)
with an interlayer expansion of ≈ 0.8 nm.9 All these compounds were synthesized
using a topotactic method. The current template method results in only single PEO
zig-zag polymer layers. However, these layers are more densely packed, as is
indicated by the derived packing fractions shown in Table 2.4. Topotactic methods
are kinetically limited by the slow diffusion of polymers,24
which may impede
development of densely packed intercalate layers. With a template method, denser
polymer layers can form before the host layer structure fully develops.
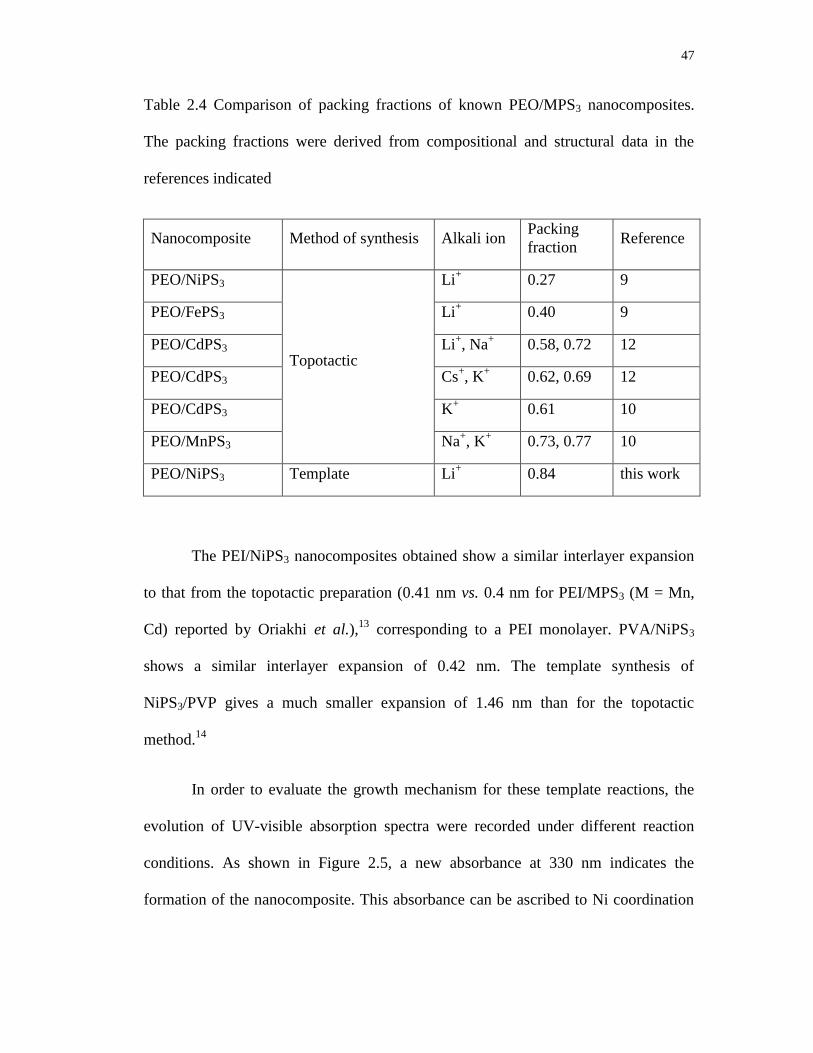
47
Table 2.4 Comparison of packing fractions of known PEO/MPS3 nanocomposites.
The packing fractions were derived from compositional and structural data in the
references indicated
Nanocomposite Method of synthesis Alkali ion Packing
fraction Reference
PEO/NiPS3
Topotactic
Li+ 0.27 9
PEO/FePS3 Li+ 0.40 9
PEO/CdPS3 Li+, Na
+ 0.58, 0.72 12
PEO/CdPS3 Cs+, K
+ 0.62, 0.69 12
PEO/CdPS3 K+ 0.61 10
PEO/MnPS3 Na+, K
+ 0.73, 0.77 10
PEO/NiPS3 Template Li+ 0.84 this work
The PEI/NiPS3 nanocomposites obtained show a similar interlayer expansion
to that from the topotactic preparation (0.41 nm vs. 0.4 nm for PEI/MPS3 (M = Mn,
Cd) reported by Oriakhi et al.),13
corresponding to a PEI monolayer. PVA/NiPS3
shows a similar interlayer expansion of 0.42 nm. The template synthesis of
NiPS3/PVP gives a much smaller expansion of 1.46 nm than for the topotactic
method.14
In order to evaluate the growth mechanism for these template reactions, the
evolution of UV-visible absorption spectra were recorded under different reaction
conditions. As shown in Figure 2.5, a new absorbance at 330 nm indicates the
formation of the nanocomposite. This absorbance can be ascribed to Ni coordination
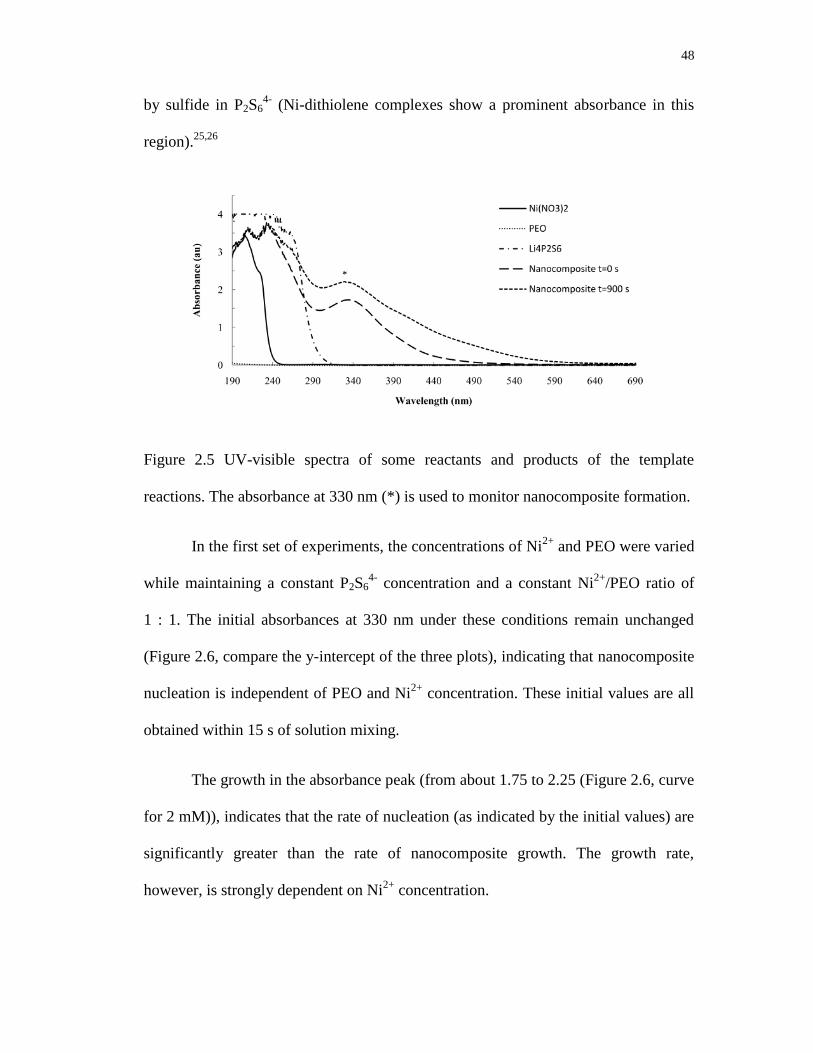
48
by sulfide in P2S64-
(Ni-dithiolene complexes show a prominent absorbance in this
region).25,26
Figure 2.5 UV-visible spectra of some reactants and products of the template
reactions. The absorbance at 330 nm (*) is used to monitor nanocomposite formation.
In the first set of experiments, the concentrations of Ni2+
and PEO were varied
while maintaining a constant P2S64-
concentration and a constant Ni2+
/PEO ratio of
1 : 1. The initial absorbances at 330 nm under these conditions remain unchanged
(Figure 2.6, compare the y-intercept of the three plots), indicating that nanocomposite
nucleation is independent of PEO and Ni2+
concentration. These initial values are all
obtained within 15 s of solution mixing.
The growth in the absorbance peak (from about 1.75 to 2.25 (Figure 2.6, curve
for 2 mM)), indicates that the rate of nucleation (as indicated by the initial values) are
significantly greater than the rate of nanocomposite growth. The growth rate,
however, is strongly dependent on Ni2+
concentration.
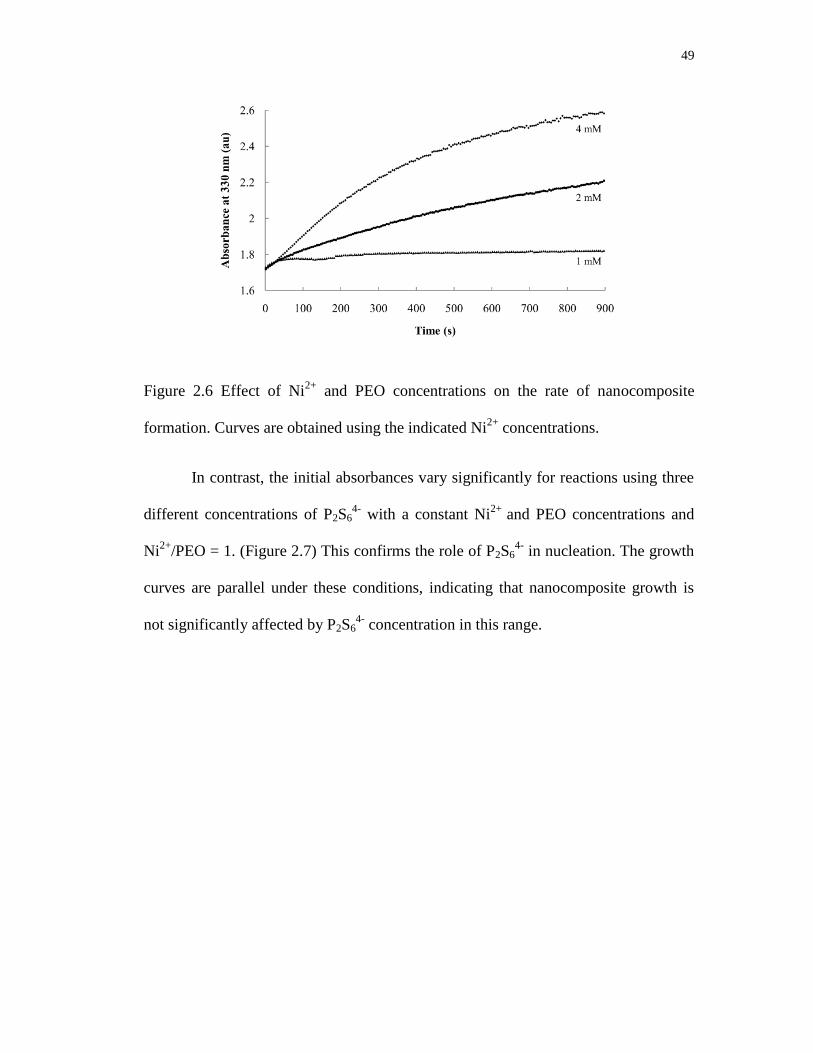
49
Figure 2.6 Effect of Ni2+
and PEO concentrations on the rate of nanocomposite
formation. Curves are obtained using the indicated Ni2+
concentrations.
In contrast, the initial absorbances vary significantly for reactions using three
different concentrations of P2S64-
with a constant Ni2+
and PEO concentrations and
Ni2+
/PEO = 1. (Figure 2.7) This confirms the role of P2S64-
in nucleation. The growth
curves are parallel under these conditions, indicating that nanocomposite growth is
not significantly affected by P2S64-
concentration in this range.

50
Figure 2.7 Effect of P4S64-
concentration on the rate of nanocomposite formation.
Curves are obtained using the indicated P4S64-
concentrations.
2.5 CONCLUSIONS
A template synthesis method can be used to synthesize NiPS3
nanocomposites. The obtained NiPS3/PEO nanocomposites show polymer zig-zag
monolayers at all combination ratios, in contrast to PEO nanocomposites derived
from a topotactic method, and the packing fractions are greater. The product
crystallite size increases with higher solvent volume, use of polar solvent and higher
aging time. P2S64-
and Ni2+
concentrations govern nanocomposite nucleation and
growth, respectively. Nanocomposites of NiPS3/PEI, NiPS3/PVA and NiPS3/PVP are
reported for the first time using this template method.
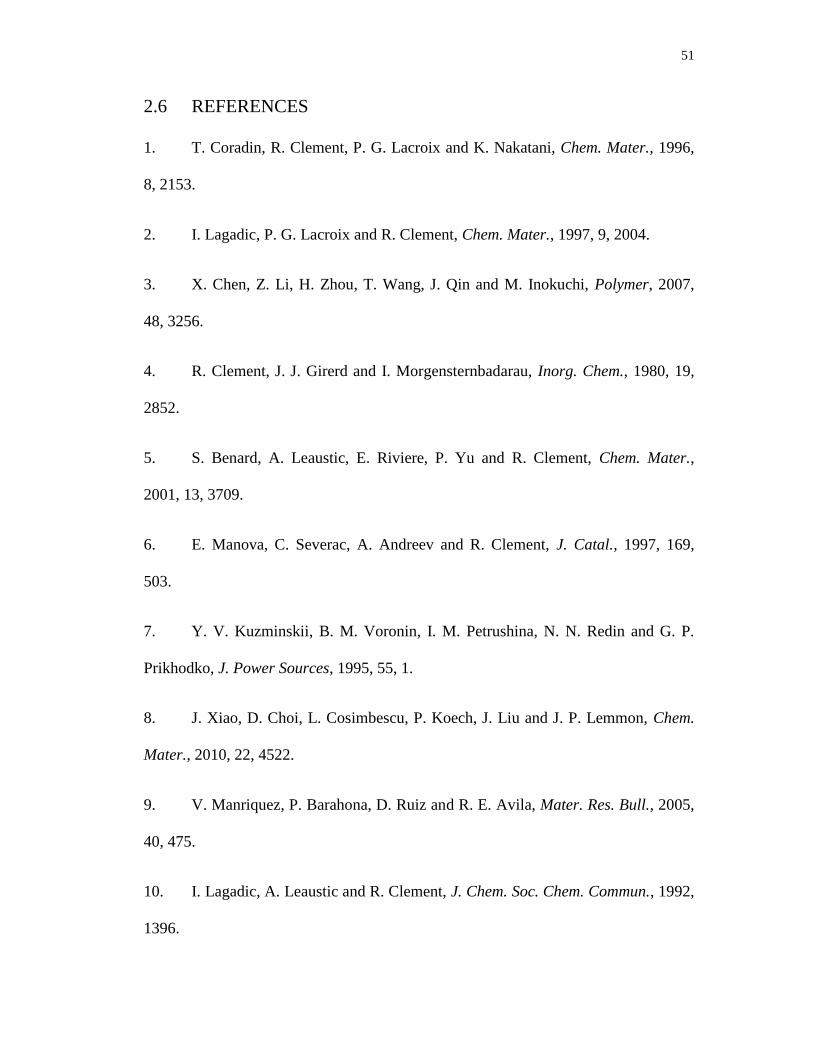
51
2.6 REFERENCES
1. T. Coradin, R. Clement, P. G. Lacroix and K. Nakatani, Chem. Mater., 1996,
8, 2153.
2. I. Lagadic, P. G. Lacroix and R. Clement, Chem. Mater., 1997, 9, 2004.
3. X. Chen, Z. Li, H. Zhou, T. Wang, J. Qin and M. Inokuchi, Polymer, 2007,
48, 3256.
4. R. Clement, J. J. Girerd and I. Morgensternbadarau, Inorg. Chem., 1980, 19,
2852.
5. S. Benard, A. Leaustic, E. Riviere, P. Yu and R. Clement, Chem. Mater.,
2001, 13, 3709.
6. E. Manova, C. Severac, A. Andreev and R. Clement, J. Catal., 1997, 169,
503.
7. Y. V. Kuzminskii, B. M. Voronin, I. M. Petrushina, N. N. Redin and G. P.
Prikhodko, J. Power Sources, 1995, 55, 1.
8. J. Xiao, D. Choi, L. Cosimbescu, P. Koech, J. Liu and J. P. Lemmon, Chem.
Mater., 2010, 22, 4522.
9. V. Manriquez, P. Barahona, D. Ruiz and R. E. Avila, Mater. Res. Bull., 2005,
40, 475.
10. I. Lagadic, A. Leaustic and R. Clement, J. Chem. Soc. Chem. Commun., 1992,
1396.
52
11. M. M. Lerner and C. O. Oriakhi, Handbook of Nanophase Materials, ed. A.
N. Goldstein, Dekker, New York, N.Y, 1997, 199-219.
12. P. Jeevanandam and S. Vasudevan, Chem. Mater., 1998, 10, 1276.
13. C. O. Oriakhi, R. L. Nafshun and M. M. Lerner, Mater. Res. Bull., 1996, 31,
1513.
14. D. Yang and R. F. Frindt, J. Mater. Res., 2000, 15, 2408.
15. N. Sukpirom, C. O. Oriakhi and M. M. Lerner, Mater. Res. Bull., 2000, 35,
325.
16. G. Ouvrard, R. Brec and J. Rouxel, Mater. Res. Bull., 1985, 20, 1181.
17. R. Brec, Solid State Ionics, 1986, 22, 3.
18. P. J. S. Foot and B. A. Nevett, J. Chem. Soc. Chem. Commun., 1987, 380.
19. E. Prouzet, G. Ouvrard, R. Brec and P. Seguineau, Solid State Ionics, 1988,
31, 79.
20. H. Loboue, C. Guillot-Deudon, A. F. Popa, A. Lafond, B. Rebours, C. Pichon,
T. Cseri, G. Berhault and C. Geantet, Catal. Today, 2008, 130, 63.
21. P. Fragnaud, E. Prouzet and R. Brec, J. Mater. Res., 1992, 7, 1839.
22. Y. H. Zhao, M. H. Abraham and A. M. Zissimos, J. Org. Chem., 2003, 68,
7368.
53
23. R. Mercier, J. P. Malugani, B. Fahys, J. Douglade and G. Robert, J. Solid
State Chem., 1982, 43, 151.
24. C. O. Oriakhi, I. V. Farr and M. M. Lerner, J. Mater. Chem., 1996, 6, 103.
25. J. F. Bai, J. L. Zuo, W. L. Tan, W. Ji, Z. Shen, H. K. Fun, K. Chinnakali, I. A.
Razak, X. Z. You and C. M. Che, J. Mater. Chem., 1999, 9, 2419.
26. Y. Ji, J. L. Zuo, L. X. Chen, Y. Q. Tian, Y. L. Song, Y. Z. Li and X. Z. You,
J. Phys. Chem. Solids, 2005, 66, 207.
54
CHAPTER 3
SYNTHESIS AND CHARACTERIZATION OF LOW-GENERATION
POLYAMIDOAMINE (PAMAM) DENDRIMER – SODIUM
MONTMORILLONITE (Na-MMT) CLAY NANOCOMPOSITES
Amila U. Liyanage, Esther U. Ikhuoria,a Adeniyi A. Adenuga,
Vincent T. Remcho, and Michael M. Lerner
Department of Chemistry
Oregon State University
Corvallis, OR 97331-4003, USA
a Fulbright visiting scholar, Oregon State University, 2011/2012.
Permanent address: Department of Chemistry, University of Benin,
Benin City, Nigeria.
Inorg. Chem., 2013, 52 (8), 4603–4610.
55
3.1 ABSTRACT
Polymer-inorganic nanocomposites are a recently developed class of materials
which have altered physical or chemical properties with respect to the pure polymer,
inorganic host, or their micro- and macro composites. Lower generation (G0.0-2.0)
polyamidoamine (PAMAM) dendrimer/Sodium montmorillonite (Na-MMT)
nanocomposites were synthesized in a solution-phase exfoliation adsorption reaction.
These are the first reports of the G0.0/ and G1.0/Na-MMT nanocomposites, and of a
structurally-ordered G2.0/Na-MMT. The materials were characterized using powder
X-ray diffraction (PXRD), thermogravimetric analysis (TGA) and Fourier transform
infrared spectroscopy (FTIR). PAMAM characteristics at acidic and basic aqueous
media were studied using capillary zone electrophoresis (CZE). Pseudospherical
PAMAM dendrimers in aqueous medium attain a highly flattened conformation
within the confined space between MMT sheets upon nanocomposite formation. The
nanocomposite structure depends on the PAMAM generation and the starting
dendrimer/organic composition. G0.0 always forms monolayer structures (d = 0.42
nm), while G2.0 forms monolayer structure, mixed phase and bilayer structures (d =
0.84 nm) at lower, intermediate, and higher organic content respectively, showing an
interesting monolayer to bilayer transition. G1.0 showed an intermediate behavior,
with monolayer to mixed-phase transition at the reactant ratios studied. This
monolayer arrangement of PAMAM/clay nanocomposites is reported for the first
time. Maximum organic contents of G0.0 monolayer and G2.0 bilayer
nanocomposites were ~7% and ~14%, respectively. Gallery expansions were similar
to those observed with linear polymer intercalates, but the packing fractions (0.31-
56
0.32) were 2-3 times lower. At acidic pH, the nanocomposites forming only
monolayer structures are obtained, indicating a stronger electrostatic attraction
between MMT and protonated PAMAM, and these nanocomposites formed more
slowly and were more ordered. Na+ ions play a significant role in nanocomposite
formation. At high pH, PAMAMs show high mobility, zeta potential, and surface
charge densities due to Na+ complexation in solution. FTIR data indicates that both
Na-MMT and PAMAM structural units are preserved in the nanocomposites
obtained.
57
3.2 INTRODUCTION
Polymer-inorganic nanocomposites are a recently developed class of materials
with at least one dimension of the phase combination in the nanometer range.
Depending on the overall dimensionality, there are several types of nanocomposites; a
prominent example is where two-dimensional (layered) inorganic structures
incorporate or are dispersed into polymers.1 In these polymer-containing layered
nancomposites, some polymers studied include poly(ethylene oxide) (PEO),2-4
linear
polyethylenimine (LPEI),4,5
polyvinyl alcohol (PVOH),4,6
poly(vinyl pyrrolidone)
(PVPyr),4 and polyaniline (PANI)
7 polymers; the inorganic structures include clays,
2,3
transition metal oxides, sulfides, selenides3,5,7
or phosphorous trisulfides4,5
and
layered double hydroxides.8 Depending on the nature and relative composition of
these constituents and also on the preparative method employed, the nanocomposites
may form as intercalation compounds (ordered) or as exfoliated (amorphous)
structures.9 Some preparative methods include exfoliation-adsorption,
2,3 in situ
intercalative polymerization,10
melt intercalation,11,12
and template synthesis.4 A
major reason for the growing interest in these nanocomposite materials is their
remarkably changed mechanical, thermal, optical or physicochemical properties with
respect to the constituent phases or conventional microcomposites.1 Specific
improvement for applied materials include increased moduli, tensile stress, thermal
stability and flame retardancy, decreased gas permeability, and enhanced thermal
stability of the ionic conductivity.1,13
Sodium montmorillonite, Nax(Al4-xMgx)Si8O20(OH)4 (Na-MMT), is a smectite
belonging to the structural family known as 2:1 phyllosilicates, which has layers with

58
central alumina or magnesia octahedra bound and covered by silica surfaces.1,13
These
anionic sheets are stacked with monovalent cation (Na+) residing in between them.
The stacking repeat for the anhydrous structure is 0.96 nm; ion exchange or co-
intercalation of molecules, surfactants, or polymers between the layers can result in
expansion of the layer repeat or delamination of the sheets into solution.5,14,15
Dendrimers are monodisperse macromolecules with a regular and highly
branched three-dimensional architecture, which consists of three basic components;
an initiator core, interior zones comprising cascading tiers of branches with radial
connectivity to the initiator core, and an exterior surface with terminal groups.16,17
Higher generation dendrimers add to the interior zone tiers. Polyamidoamines
(PAMAMs) are the first synthetic dendrimers, with potential applications in drug or
gene delivery, sensors, and nanoparticle synthesis.18-21
Although dendrimers can have
functional groups similar to those in linear polymers, the net connectivity contrasts
with that of linear polymers and provides an opportunity to evaluate the effect of
organic component on nanocomposite structure and the gallery composition of
intercalated nanocomposites.
Previous studies have reported nanocomposites combining hyperbranched
polymers,22,23
higher-generation PAMAMs,24
dendrons,25
or dendritic quaternary
ammoniums26
with smectite clays including montmorillonite,22-26
or kaolinite.27
Those reports indicated very large gallery expansions,22,25,26
both pure and mixed-
phase intercalated nanocomposites,22,24-26
and exfoliated nanocomposites.22
59
Ratanarat et al.15
have reported the only lower generation PAMAM/Na-MMT
nanocomposite, an exfoliated nanocomposite of generation 2.0 (G2.0) PAMAM and
Na-MMT. Alongi et al.24
have reported the synthesis of higher generation (G4.0-7.0)
PAMAM/Na-MMT nanocomposites. Here we report the first systematic
compositional study on the synthesis and characterization of lower generation
PAMAM/Na-MMT nanocomposites and clarify the adsorbed monolayer/bilayer
arrangements that occur in dendrimer nanocomposite galleries.
3.3 EXPERIMENTAL
3.3.1 REAGENTS
Polyamidoamine (PAMAM) aqueous solutions (~16% w/w, Dendritech),
sodium montmorillonite (Na-MMT) (SWy-2, Clay Minerals Society), HCl (36.5-
38.0%, EMD), H3PO4 (85%, Mallinckrodt), Na2HPO4 (ACS grade, Mallinckrodt
Baker), NaOH (ACS grade, Mallinckrodt), NaCl (ACS grade, Mallinckrodt),
Montmorillonite K 10 (Sigma-Aldrich), and AgNO3 (ACS grade, Alfa Aesar) were
purchased and used without further purification.
3.3.2 SYNTHESES
Aqueous solutions of PAMAM (0.01-0.08 g, 10.00 mL, pH 11-12) were
added dropwise to aqueous suspensions of Na-MMT (0.1000 g, 10.00 mL, pH 5-6).
Cloudy or powder-like white particles were visible within a few seconds to several
minutes of combining the reactants. The suspensions had a pH = 10-11 and were
stirred vigorously overnight at room temperature. The white precipitate was collected
after centrifugation for 10 minutes, washed twice with deionized (DI) water, and then
60
dried under vacuum at 60 °C for 18 h. Some reactions were performed at ambient
temperature, some at 60 °C.
In another set of nanocomposite syntheses, the PAMAM aqueous solutions
were adjusted to pH = 2-3 using 1M HCl prior to addition of the Na-MMT
suspension. Higher temperatures (50, 80 °C) were also utilized for some of these
syntheses. These obtained products were washed repeatedly until no precipitate
formed on reaction with dilute AgNO3 (aq).
Samples are labeled below based on the reacted g/g PAMAM/Na-MMT ratios
and PAMAM generation. For example, the sample obtained by reaction of 0.010 g of
generation 0.0 PAMAM with 0.1000 g of suspended Na-MMT is labeled “0.1G(0.0)”.
For reactions carried out at temperatures other than ambient temperature and pHs
other than pH=10-11, the temperature (in °C) and pH are also indicated, for example
“0.6G(2.0)-50-2”.
3.3.3 ANALYTICAL METHODS
Powder XRD (PXRD) patterns from 2° to 15° 2θ were obtained on a Rigaku
Miniflex II diffractometer, using Ni-filtered Cu K radiation at a scan rate of 1o
min-1
and step size of 0.020° 2θ. A modified Scherrer equation4 was used to determine
crystallite size (L) for the prepared nanocomposites:
⁄ (1)
where = 0.15418 nm, (2θhkl) = full width at half-maximum (in radians), and θhkl =
diffraction angle. A Si(m) powder standard was employed for these measurements.

61
Thermogravimetric (TGA) analyses were performed under Ar flow (20
mL/min) using a Shimadzu TGA-50 analyzer. Approximately 10-15 mg of sample
was placed into an open platinum pan and heated from ambient to 600 °C at 5
°C/min.
Capillary zone electrophoresis was performed to determine migration times
using an HP 3D
CE instrument equipped with a UV detector, using a 75 μm inner
diameter, 58.5 cm long fused silica capillary (50.0 cm to the detection window). New
capillaries were sequentially conditioned by flushing with methanol (30 min), water
(Milli-Q) (5 min), 1.0 M NaOH (30 min), water (5 min), and finally the background
electrolyte (BGE) for 30 min. As preconditioning, the capillary was flushed with 0.1
M NaOH (3 min), water (1 min), and BGE (4 min). As postconditioning, the capillary
was flushed with water (1 min). Background electrolytes used were 100 mM H3PO4,
pH adjusted to 2.7, and 50 mM Na2HPO4, pH adjusted to 10.9 with NaOH. Ionic
strengths of BGEs were adjusted to ~0.16 mol L-1
using NaCl. Samples were
prepared by freshly dissolving in H3PO4 or Na2HPO4, and the sample was adjusted to
the pH and the ionic strength of BGE, using NaOH and NaCl, respectively.
Migrations were accomplished at applied voltages of +15 kV (pH 2.7) and +18 kV
(pH 10.9). The capillary was thermostatted at 25 °C (pH 2.7) or 30 °C (pH 10.9).
Solutions were injected hydrodynamically at 50 mbar for 5 s. Direct detection was
employed at a wavelength of 210 nm.
The dimensionless mobility (µ0’) of the dendrimers was calculated using
(2)
62
where l is the effective length, L is the total length, V is the voltage, tm is the
migration time, µ0 is the electrophoretic mobility, is the dielectric constant of water
(80.5), 0 is the dielectric permittivity of the vacuum, k is the Boltzmann constant, T
is the temperature in kelvin, is the viscosity and e is charge of the electron.
Dimensionless zeta potentials and charge distribution functions (I0) were obtained
using numerical solutions published by Wiersema et al.28
and Loeb et al.29
Zeta
potential () and surface charge densities () were calculated according to the
following empirical formulas:30
(3)
= 5.8718 (I)1/2
I0 × 10-2
C/m2 (4)
IR spectra were taken using a Nicolet iS10 FT-IR spectrometer with an ATR
sample cell, using background corrections for air and collection geometry. Aqueous
PAMAM solutions were preconcentrated at 80 °C before collecting spectra. Diamond
and Ge ATR cells were used for liquid and solid samples, respectively.
Van der Waals volumes of PAMAM dendrimers (G 0.0, 1.0, and 2.0) were
calculated based on Bondi radii using a method termed “Atomic and Bond
Contributions of van der Waals volume” (VABC).31
Packing fractions were
calculated4 using
Packing fraction = [(Z n Vvdw) / (a b d)] (5)
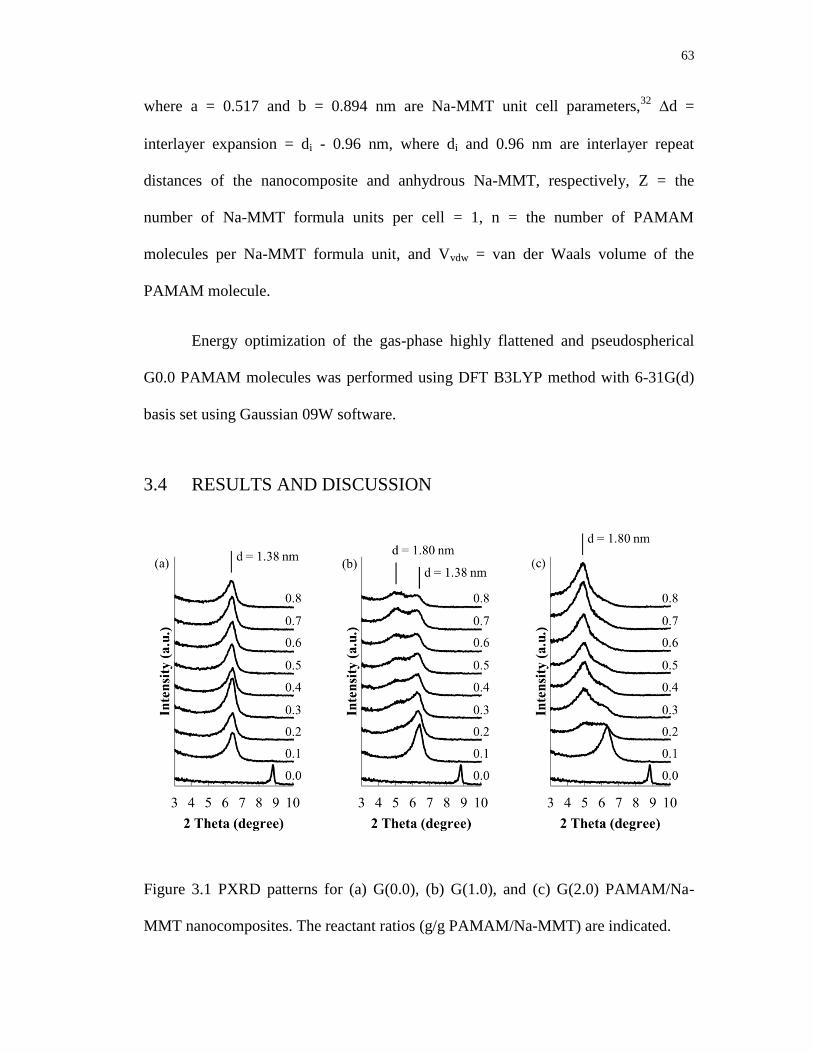
63
where a = 0.517 and b = 0.894 nm are Na-MMT unit cell parameters,32
d =
interlayer expansion = di - 0.96 nm, where di and 0.96 nm are interlayer repeat
distances of the nanocomposite and anhydrous Na-MMT, respectively, Z = the
number of Na-MMT formula units per cell = 1, n = the number of PAMAM
molecules per Na-MMT formula unit, and Vvdw = van der Waals volume of the
PAMAM molecule.
Energy optimization of the gas-phase highly flattened and pseudospherical
G0.0 PAMAM molecules was performed using DFT B3LYP method with 6-31G(d)
basis set using Gaussian 09W software.
3.4 RESULTS AND DISCUSSION
Figure 3.1 PXRD patterns for (a) G(0.0), (b) G(1.0), and (c) G(2.0) PAMAM/Na-
MMT nanocomposites. The reactant ratios (g/g PAMAM/Na-MMT) are indicated.
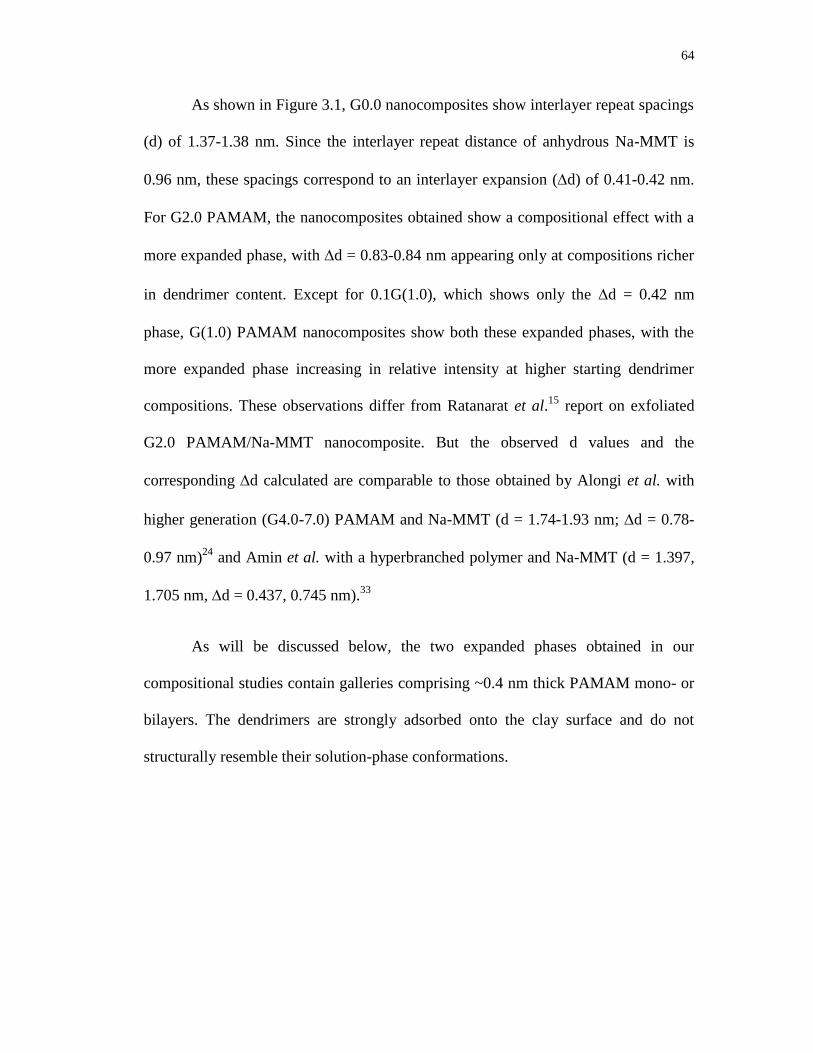
64
As shown in Figure 3.1, G0.0 nanocomposites show interlayer repeat spacings
(d) of 1.37-1.38 nm. Since the interlayer repeat distance of anhydrous Na-MMT is
0.96 nm, these spacings correspond to an interlayer expansion (d) of 0.41-0.42 nm.
For G2.0 PAMAM, the nanocomposites obtained show a compositional effect with a
more expanded phase, with d = 0.83-0.84 nm appearing only at compositions richer
in dendrimer content. Except for 0.1G(1.0), which shows only the d = 0.42 nm
phase, G(1.0) PAMAM nanocomposites show both these expanded phases, with the
more expanded phase increasing in relative intensity at higher starting dendrimer
compositions. These observations differ from Ratanarat et al.15
report on exfoliated
G2.0 PAMAM/Na-MMT nanocomposite. But the observed d values and the
corresponding d calculated are comparable to those obtained by Alongi et al. with
higher generation (G4.0-7.0) PAMAM and Na-MMT (d = 1.74-1.93 nm; d = 0.78-
0.97 nm)24
and Amin et al. with a hyperbranched polymer and Na-MMT (d = 1.397,
1.705 nm, d = 0.437, 0.745 nm).33
As will be discussed below, the two expanded phases obtained in our
compositional studies contain galleries comprising ~0.4 nm thick PAMAM mono- or
bilayers. The dendrimers are strongly adsorbed onto the clay surface and do not
structurally resemble their solution-phase conformations.
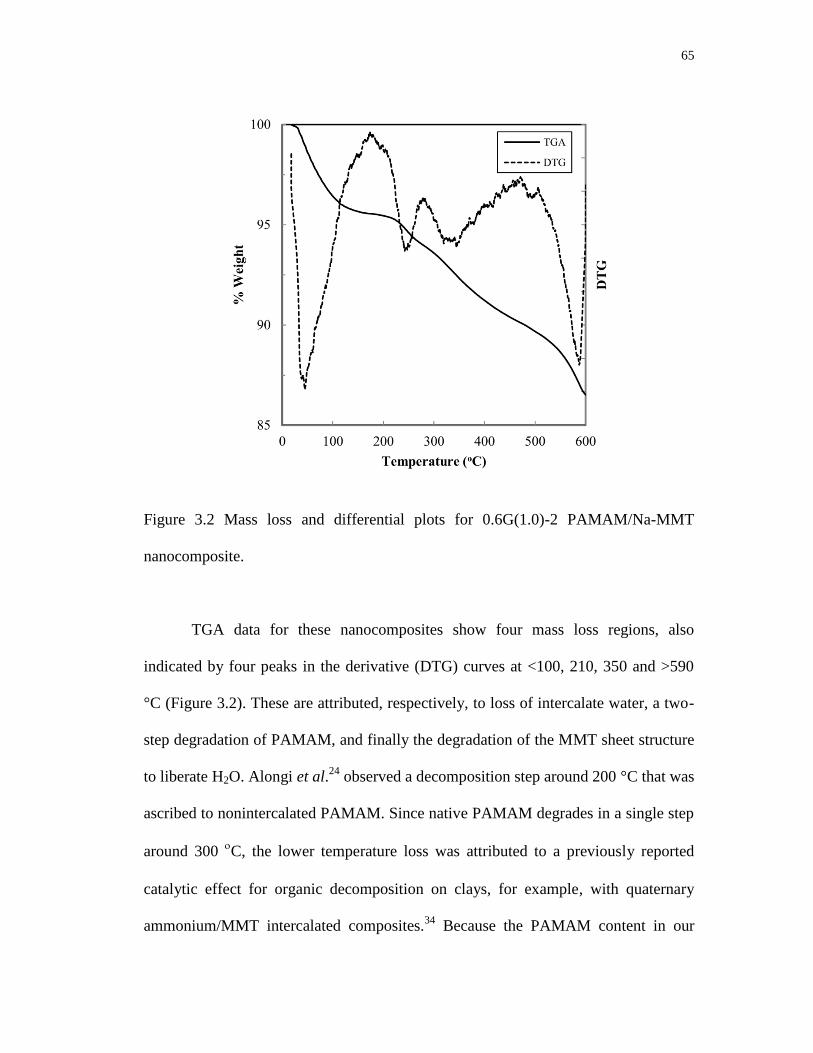
65
Figure 3.2 Mass loss and differential plots for 0.6G(1.0)-2 PAMAM/Na-MMT
nanocomposite.
TGA data for these nanocomposites show four mass loss regions, also
indicated by four peaks in the derivative (DTG) curves at <100, 210, 350 and >590
°C (Figure 3.2). These are attributed, respectively, to loss of intercalate water, a two-
step degradation of PAMAM, and finally the degradation of the MMT sheet structure
to liberate H2O. Alongi et al.24
observed a decomposition step around 200 °C that was
ascribed to nonintercalated PAMAM. Since native PAMAM degrades in a single step
around 300 C, the lower temperature loss was attributed to a previously reported
catalytic effect for organic decomposition on clays, for example, with quaternary
ammonium/MMT intercalated composites.34
Because the PAMAM content in our
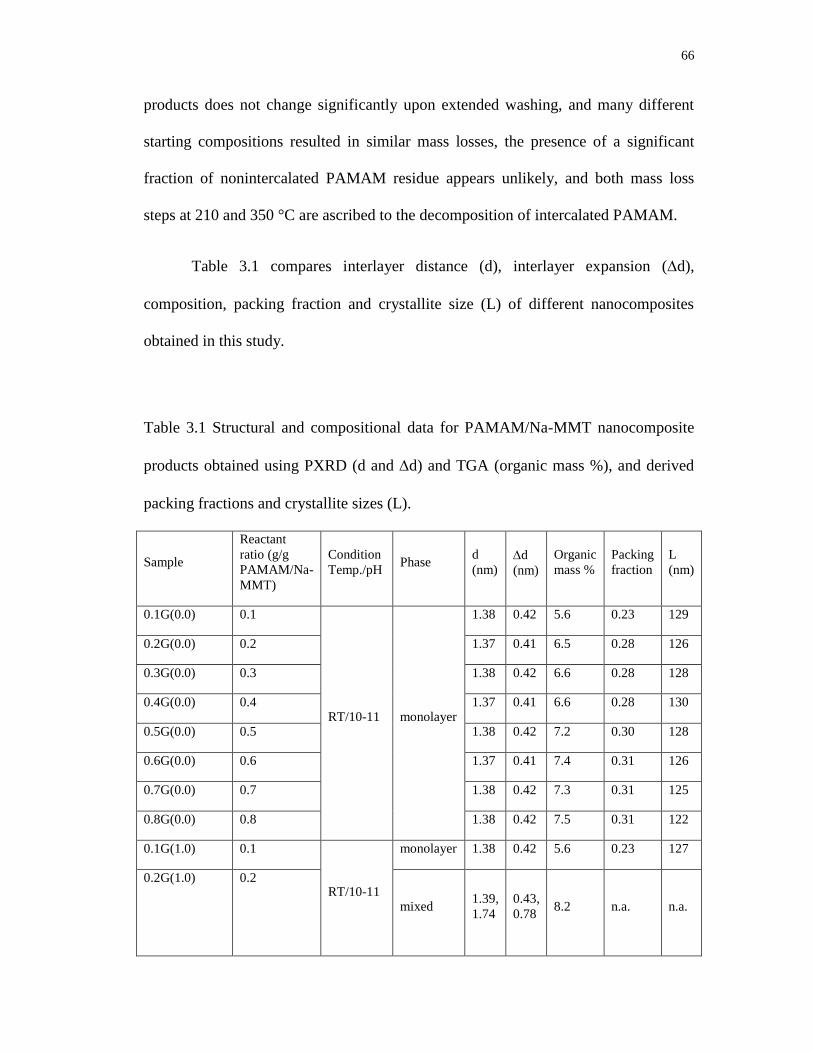
66
products does not change significantly upon extended washing, and many different
starting compositions resulted in similar mass losses, the presence of a significant
fraction of nonintercalated PAMAM residue appears unlikely, and both mass loss
steps at 210 and 350 °C are ascribed to the decomposition of intercalated PAMAM.
Table 3.1 compares interlayer distance (d), interlayer expansion (d),
composition, packing fraction and crystallite size (L) of different nanocomposites
obtained in this study.
Table 3.1 Structural and compositional data for PAMAM/Na-MMT nanocomposite
products obtained using PXRD (d and d) and TGA (organic mass %), and derived
packing fractions and crystallite sizes (L).
Sample
Reactant
ratio (g/g
PAMAM/Na-
MMT)
Condition
Temp./pH Phase
d
(nm) d
(nm)
Organic
mass %
Packing
fraction
L
(nm)
0.1G(0.0) 0.1
RT/10-11 monolayer
1.38 0.42 5.6 0.23 129
0.2G(0.0) 0.2 1.37 0.41 6.5 0.28 126
0.3G(0.0) 0.3 1.38 0.42 6.6 0.28 128
0.4G(0.0) 0.4 1.37 0.41 6.6 0.28 130
0.5G(0.0) 0.5 1.38 0.42 7.2 0.30 128
0.6G(0.0) 0.6 1.37 0.41 7.4 0.31 126
0.7G(0.0) 0.7 1.38 0.42 7.3 0.31 125
0.8G(0.0) 0.8 1.38 0.42 7.5 0.31 122
0.1G(1.0) 0.1
RT/10-11
monolayer 1.38 0.42 5.6 0.23 127
0.2G(1.0)
0.2
mixed 1.39,
1.74
0.43,
0.78 8.2 n.a. n.a.
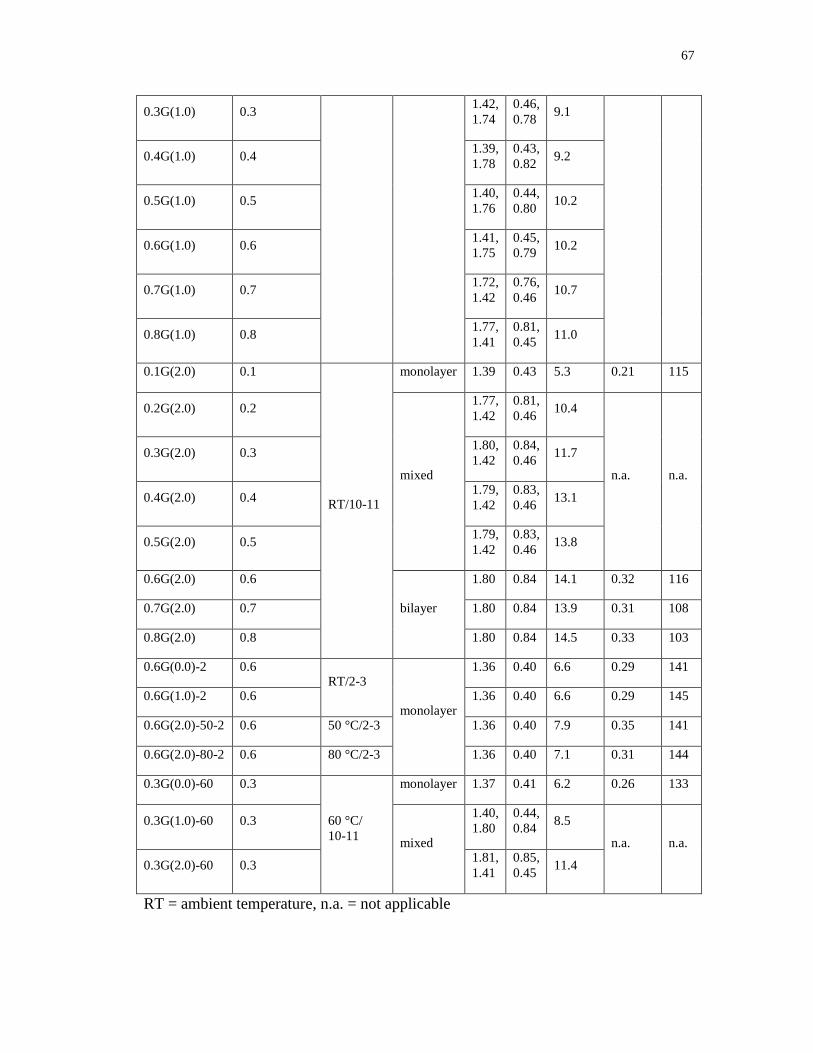
67
0.3G(1.0) 0.3 1.42,
1.74
0.46,
0.78 9.1
0.4G(1.0) 0.4 1.39,
1.78
0.43,
0.82 9.2
0.5G(1.0) 0.5 1.40,
1.76
0.44,
0.80 10.2
0.6G(1.0) 0.6 1.41,
1.75
0.45,
0.79 10.2
0.7G(1.0) 0.7 1.72,
1.42
0.76,
0.46 10.7
0.8G(1.0) 0.8 1.77,
1.41
0.81,
0.45 11.0
0.1G(2.0) 0.1
RT/10-11
monolayer 1.39 0.43 5.3 0.21 115
0.2G(2.0) 0.2
mixed
1.77,
1.42
0.81,
0.46 10.4
n.a. n.a.
0.3G(2.0) 0.3 1.80,
1.42
0.84,
0.46 11.7
0.4G(2.0) 0.4 1.79,
1.42
0.83,
0.46 13.1
0.5G(2.0) 0.5 1.79,
1.42
0.83,
0.46 13.8
0.6G(2.0) 0.6
bilayer
1.80 0.84 14.1 0.32 116
0.7G(2.0) 0.7 1.80 0.84 13.9 0.31 108
0.8G(2.0) 0.8 1.80 0.84 14.5 0.33 103
0.6G(0.0)-2 0.6 RT/2-3
monolayer
1.36 0.40 6.6 0.29 141
0.6G(1.0)-2 0.6 1.36 0.40 6.6 0.29 145
0.6G(2.0)-50-2 0.6 50 °C/2-3 1.36 0.40 7.9 0.35 141
0.6G(2.0)-80-2 0.6 80 °C/2-3 1.36 0.40 7.1 0.31 144
0.3G(0.0)-60 0.3
60 °C/
10-11
monolayer 1.37 0.41 6.2 0.26 133
0.3G(1.0)-60 0.3
mixed
1.40,
1.80
0.44,
0.84 8.5
n.a. n.a.
0.3G(2.0)-60 0.3 1.81,
1.41
0.85,
0.45 11.4
RT = ambient temperature, n.a. = not applicable
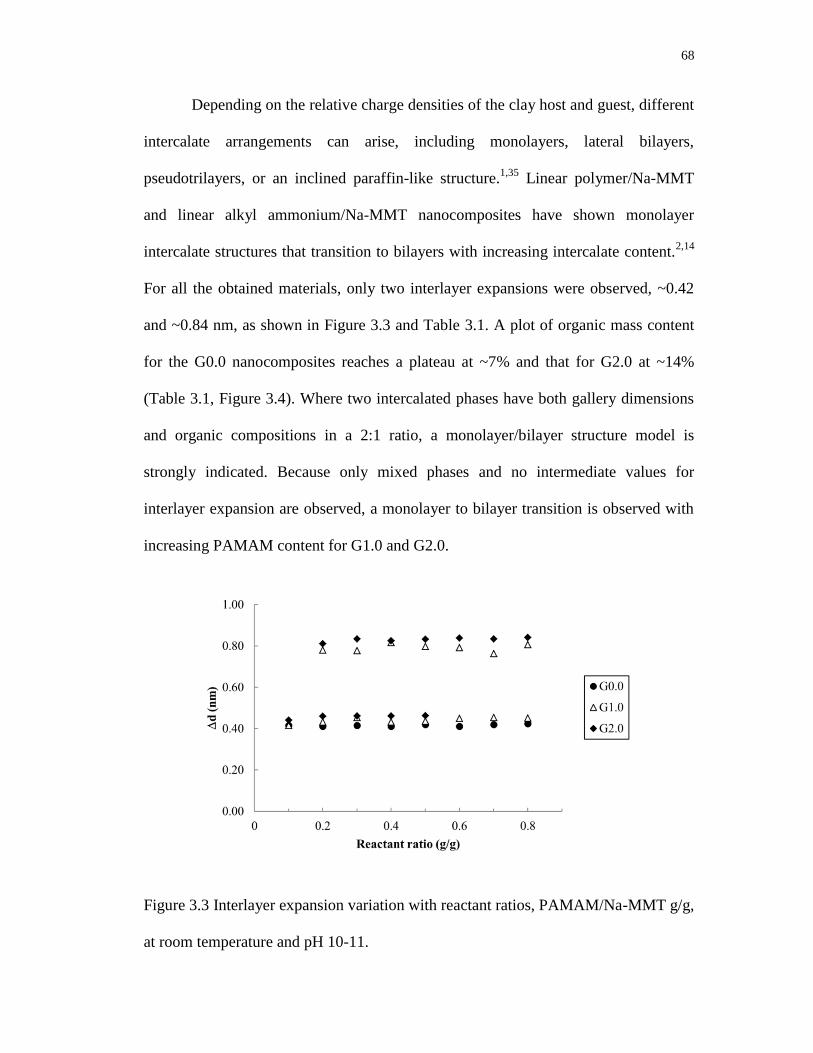
68
Depending on the relative charge densities of the clay host and guest, different
intercalate arrangements can arise, including monolayers, lateral bilayers,
pseudotrilayers, or an inclined paraffin-like structure.1,35
Linear polymer/Na-MMT
and linear alkyl ammonium/Na-MMT nanocomposites have shown monolayer
intercalate structures that transition to bilayers with increasing intercalate content.2,14
For all the obtained materials, only two interlayer expansions were observed, ~0.42
and ~0.84 nm, as shown in Figure 3.3 and Table 3.1. A plot of organic mass content
for the G0.0 nanocomposites reaches a plateau at ~7% and that for G2.0 at ~14%
(Table 3.1, Figure 3.4). Where two intercalated phases have both gallery dimensions
and organic compositions in a 2:1 ratio, a monolayer/bilayer structure model is
strongly indicated. Because only mixed phases and no intermediate values for
interlayer expansion are observed, a monolayer to bilayer transition is observed with
increasing PAMAM content for G1.0 and G2.0.
Figure 3.3 Interlayer expansion variation with reactant ratios, PAMAM/Na-MMT g/g,
at room temperature and pH 10-11.
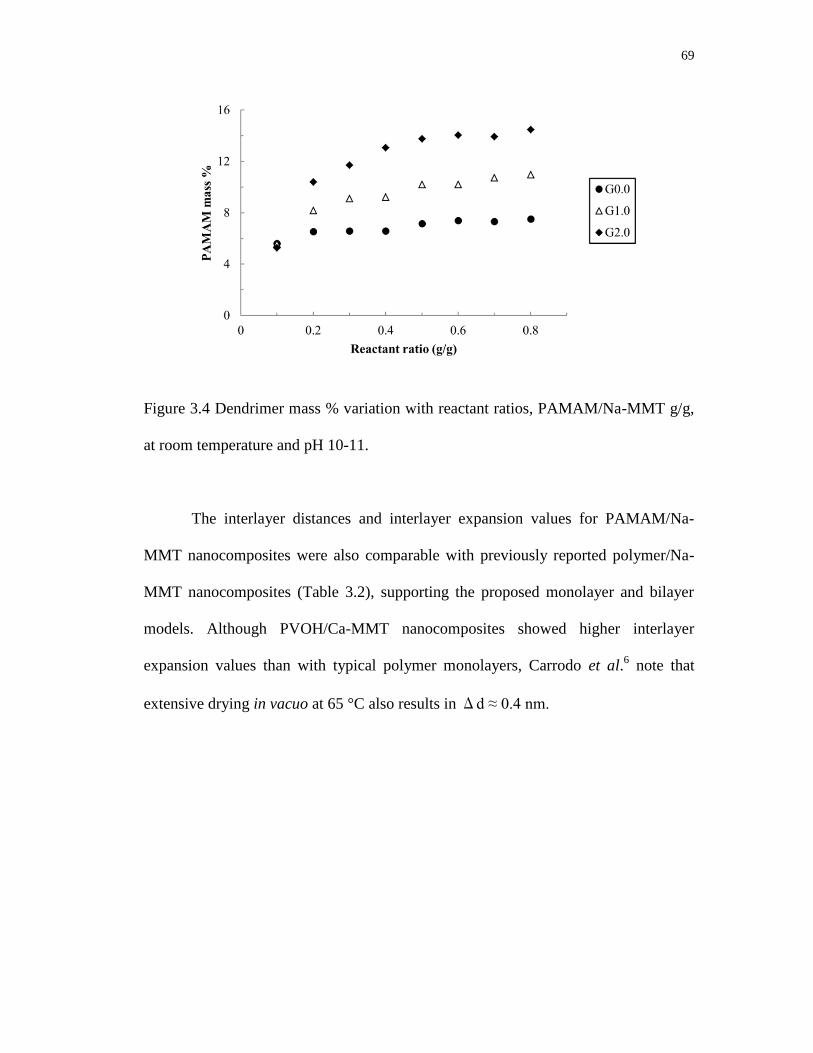
69
Figure 3.4 Dendrimer mass % variation with reactant ratios, PAMAM/Na-MMT g/g,
at room temperature and pH 10-11.
The interlayer distances and interlayer expansion values for PAMAM/Na-
MMT nanocomposites were also comparable with previously reported polymer/Na-
MMT nanocomposites (Table 3.2), supporting the proposed monolayer and bilayer
models. Although PVOH/Ca-MMT nanocomposites showed higher interlayer
expansion values than with typical polymer monolayers, Carrodo et al.6 note that
extensive drying in vacuo at 65 °C also results in Δd ≈ 0.4 nm.
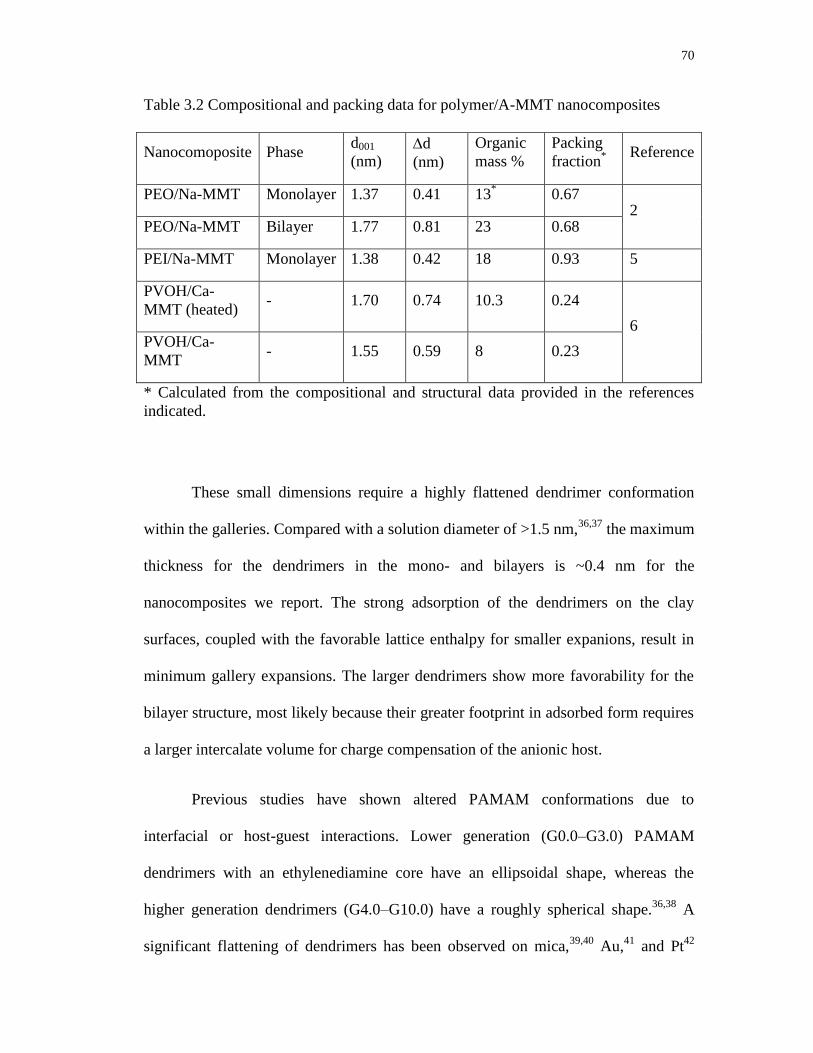
70
Table 3.2 Compositional and packing data for polymer/A-MMT nanocomposites
Nanocomoposite Phase d001
(nm) d
(nm)
Organic
mass %
Packing
fraction* Reference
PEO/Na-MMT Monolayer 1.37 0.41 13* 0.67
2 PEO/Na-MMT Bilayer 1.77 0.81 23 0.68
PEI/Na-MMT Monolayer 1.38 0.42 18 0.93 5
PVOH/Ca-
MMT (heated) - 1.70 0.74 10.3 0.24
6 PVOH/Ca-
MMT - 1.55 0.59 8 0.23
* Calculated from the compositional and structural data provided in the references
indicated.
These small dimensions require a highly flattened dendrimer conformation
within the galleries. Compared with a solution diameter of >1.5 nm,36,37
the maximum
thickness for the dendrimers in the mono- and bilayers is ~0.4 nm for the
nanocomposites we report. The strong adsorption of the dendrimers on the clay
surfaces, coupled with the favorable lattice enthalpy for smaller expanions, result in
minimum gallery expansions. The larger dendrimers show more favorability for the
bilayer structure, most likely because their greater footprint in adsorbed form requires
a larger intercalate volume for charge compensation of the anionic host.
Previous studies have shown altered PAMAM conformations due to
interfacial or host-guest interactions. Lower generation (G0.0–G3.0) PAMAM
dendrimers with an ethylenediamine core have an ellipsoidal shape, whereas the
higher generation dendrimers (G4.0–G10.0) have a roughly spherical shape.36,38
A
significant flattening of dendrimers has been observed on mica,39,40
Au,41
and Pt42

71
substrates; Hierlemann et al. provided evidence for 0.5-0.8 nm thick G4.0 dendrimers
on a Au surface.41
Even the highly branched net PAMAM, at least for the lower
generations, can compress into a highly flattened conformation with minimum
dimension comparable to those observed in the mono- and bilayers obtained.
To further explore the feasibility for such highly flattened structures, a
PAMAM G0.0 dendrimer was structurally optimized with flattened conformation of
only 0.38 nm using Gaussian 09W (see Figure 3.5). While the flattened model may
not correspond to the precise conformation of the dendrimer intercalates, the result
does support the feasibility of such PAMAM conformations in the obtained
nanocomposites. We calculate the flattened conformation energy of PAMAM G0.0 to
be ~100-200 kcal/mol than the pseudospherical conformation. However, these are
gas-phase calculations and do not account for the real synthetic conditions, where
both solvation and clay surface interactions are important.
Figure 3.5 A structural model for the G0.0 monolayer nanocomposites. (H, white;
O, black; C, light grey; N, dark grey).
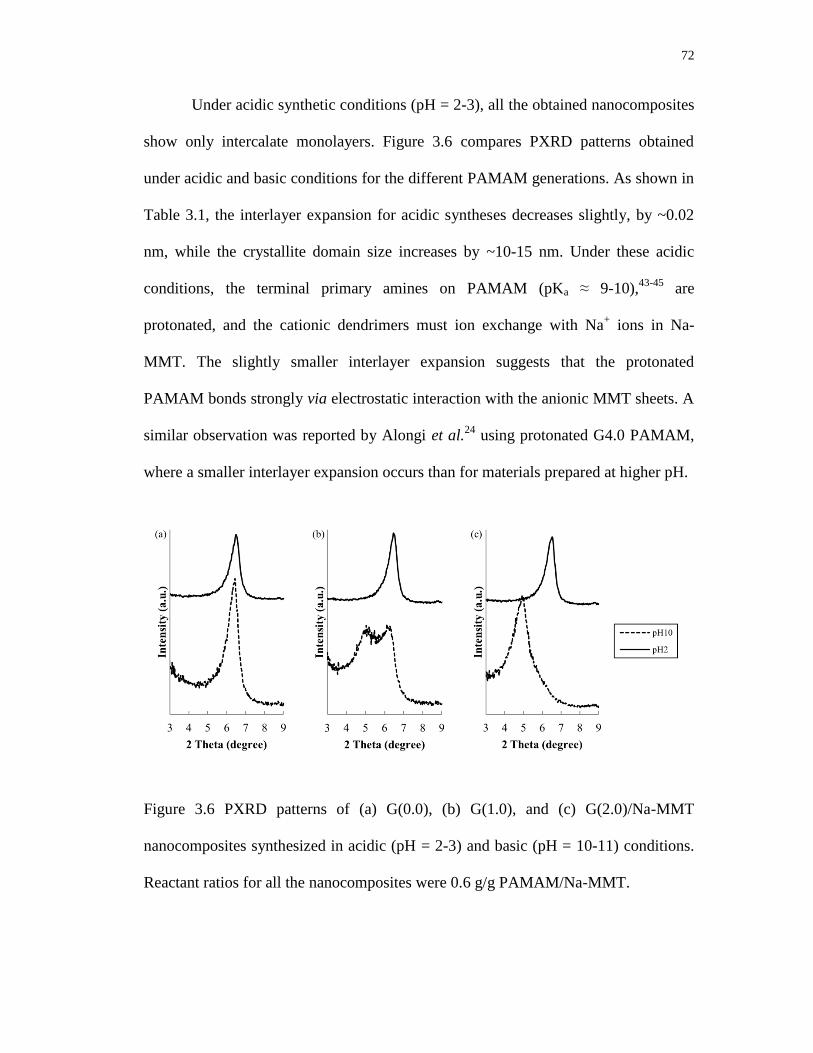
72
Under acidic synthetic conditions (pH = 2-3), all the obtained nanocomposites
show only intercalate monolayers. Figure 3.6 compares PXRD patterns obtained
under acidic and basic conditions for the different PAMAM generations. As shown in
Table 3.1, the interlayer expansion for acidic syntheses decreases slightly, by ~0.02
nm, while the crystallite domain size increases by ~10-15 nm. Under these acidic
conditions, the terminal primary amines on PAMAM (pKa ≈ 9-10),43-45
are
protonated, and the cationic dendrimers must ion exchange with Na+ ions in Na-
MMT. The slightly smaller interlayer expansion suggests that the protonated
PAMAM bonds strongly via electrostatic interaction with the anionic MMT sheets. A
similar observation was reported by Alongi et al.24
using protonated G4.0 PAMAM,
where a smaller interlayer expansion occurs than for materials prepared at higher pH.
Figure 3.6 PXRD patterns of (a) G(0.0), (b) G(1.0), and (c) G(2.0)/Na-MMT
nanocomposites synthesized in acidic (pH = 2-3) and basic (pH = 10-11) conditions.
Reactant ratios for all the nanocomposites were 0.6 g/g PAMAM/Na-MMT.

73
The increase in crystallite size at lower pH can be attributed to the observed
slower reaction rates. For example, under acidic conditions, a flocculate does not
appear at ambient temperature with G2.0 PAMAM. At 50 C, particles appear after
reaction for 30 minutes, and at 80 C they appear after 10 minutes. Elevated
temperature also increases the nanocomposite yield, although the yield remains lower
than that under basic conditions. The slower reaction kinetics may again be associated
with an ion exchange process required for a positively charged dendrimer.
When reactions are performed where a protonated montmorillonite, K10 (H-
MMT) is substituted for Na-MMT, no dendrimer intercalation is observed. This
difference implicates Na+ in the intercalation reaction, either via ion exchange or
dendrimer complexation.
To study the effect of synthesis temperature, 0.3 g/g PAMAM/Na-MMT
nanocomposites with all G0.0, G1.0, and G2.0 PAMAM were prepared at ambient
temperature and at 60 C. The obtained gallery dimensions (Table 3.1, d) and
relative phase contents for mixed phases as indicated by PXRD reflection intensities
(Figure B1, Appendix B) did not change significantly at higher temperature.
However, the organic mass contents were lower at higher temperature (Table 3.1),
which suggests that the higher rate of nanocomposite formation prevents efficient
packing of the expanded galleries with PAMAM.

74
Figure 3.7 Packing fraction vs dendrimer mass % of nanocomposites synthesized at
room temperature and pH 10-11. Labels show reactant ratios (g/g PAMAM/Na-
MMT). Packing fractions were not calculated for mixed phases.
For G0.0 nanocomposites, an increase of PAMAM packing fraction was also
observed at higher initial dendrimers ratios (Figure 3.7, left). G2.0 nanocomposites
which formed with higher organic loading are more tightly clustered (Figure 3.7,
right) indicating less effect of starting composition on product composition. It is very
clear that there are two structures having similar packing fractions at full loading
(0.31 for the monolayer, and 0.33 for the bilayer). H2O may partially fill the available
volume in the galleries; water content was not considered in the packing fraction
calculation because the water contents are highly variable and depend in part on
sample history. For comparison, packing fractions of ~0.67-0.68 can be deduced from
reported data for PEO/Na-MMT mono- and bilayer intercalate structures2 and of 0.93
for PEI/Na-MMT,5 although a much lower value can be deduced from data reported
for PVOH/Ca-MMT.6 Linear polymers can yield packing fractions 2-3 times higher

75
than those observed for the PAMAM/Na-MMT nanocomposites. This difference may
be due to inefficiencies in packing the flattened dendrimers but may also be an
electrostatic effect related to the higher charge density of the dendrimers.
To help understand the mechanism of nanocomposite formation, capillary
zone electrophoresis (CZE) was used to evaluate the nature of solvated PAMAM at
pH conditions employed in these syntheses. Figure 3.8 shows electrograms of
PAMAM at pH 2.7 and 10.9, with results summarized in Table 3.3. The positively
charged PAMAM dendrimers migrate toward the cathode under a positive applied
voltage. Migration times increase with increasing PAMAM generation, reflecting a
decreased charge density for the higher generation dendrimers. Surface charge
densities at pH 2.7 were estimated 0.10-0.19 C/m2. Shi et al.
30 and Ebber et al.
46 also
observed clear separation of PAMAM generations 2.0–5.0 at pH 2.5 and generations
1.0–5.0 at pH 2.7. Although these PAMAM generations have similar theoretical
charge/mass ratios, Shi et al.30
proposed a shielding model that retards migration for
larger dendrimers.
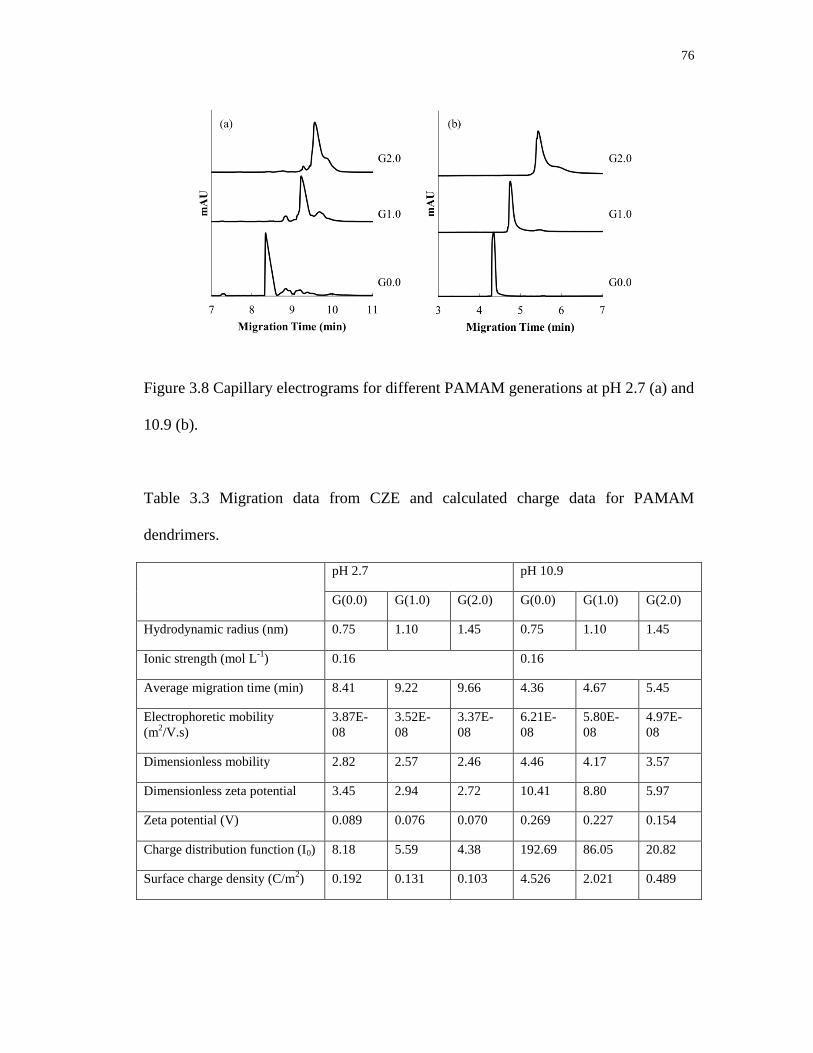
76
Figure 3.8 Capillary electrograms for different PAMAM generations at pH 2.7 (a) and
10.9 (b).
Table 3.3 Migration data from CZE and calculated charge data for PAMAM
dendrimers.
pH 2.7 pH 10.9
G(0.0) G(1.0) G(2.0) G(0.0) G(1.0) G(2.0)
Hydrodynamic radius (nm) 0.75 1.10 1.45 0.75 1.10 1.45
Ionic strength (mol L-1
) 0.16 0.16
Average migration time (min) 8.41 9.22 9.66 4.36 4.67 5.45
Electrophoretic mobility
(m2/V.s)
3.87E-
08
3.52E-
08
3.37E-
08
6.21E-
08
5.80E-
08
4.97E-
08
Dimensionless mobility 2.82 2.57 2.46 4.46 4.17 3.57
Dimensionless zeta potential 3.45 2.94 2.72 10.41 8.80 5.97
Zeta potential (V) 0.089 0.076 0.070 0.269 0.227 0.154
Charge distribution function (I0) 8.18 5.59 4.38 192.69 86.05 20.82
Surface charge density (C/m2) 0.192 0.131 0.103 4.526 2.021 0.489
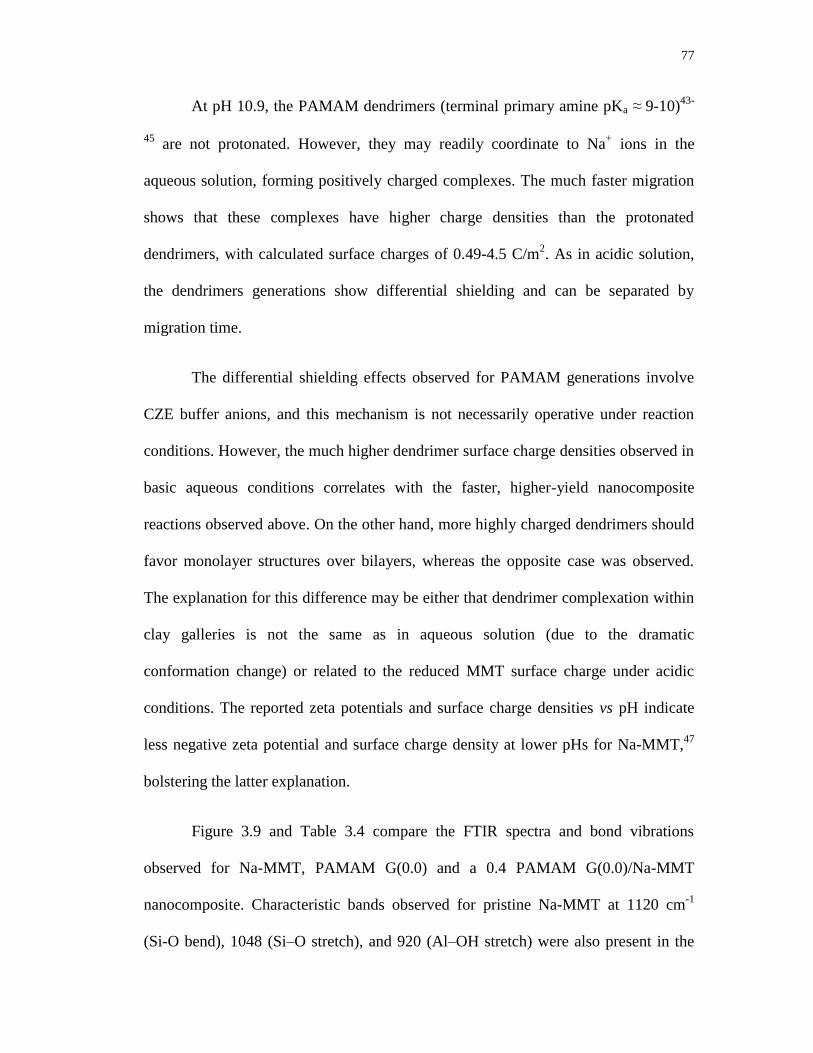
77
At pH 10.9, the PAMAM dendrimers (terminal primary amine pKa ≈9-10)43-
45 are not protonated. However, they may readily coordinate to Na
+ ions in the
aqueous solution, forming positively charged complexes. The much faster migration
shows that these complexes have higher charge densities than the protonated
dendrimers, with calculated surface charges of 0.49-4.5 C/m2. As in acidic solution,
the dendrimers generations show differential shielding and can be separated by
migration time.
The differential shielding effects observed for PAMAM generations involve
CZE buffer anions, and this mechanism is not necessarily operative under reaction
conditions. However, the much higher dendrimer surface charge densities observed in
basic aqueous conditions correlates with the faster, higher-yield nanocomposite
reactions observed above. On the other hand, more highly charged dendrimers should
favor monolayer structures over bilayers, whereas the opposite case was observed.
The explanation for this difference may be either that dendrimer complexation within
clay galleries is not the same as in aqueous solution (due to the dramatic
conformation change) or related to the reduced MMT surface charge under acidic
conditions. The reported zeta potentials and surface charge densities vs pH indicate
less negative zeta potential and surface charge density at lower pHs for Na-MMT,47
bolstering the latter explanation.
Figure 3.9 and Table 3.4 compare the FTIR spectra and bond vibrations
observed for Na-MMT, PAMAM G(0.0) and a 0.4 PAMAM G(0.0)/Na-MMT
nanocomposite. Characteristic bands observed for pristine Na-MMT at 1120 cm-1
(Si-O bend), 1048 (Si–O stretch), and 920 (Al–OH stretch) were also present in the

78
nanocomposites without significant shifts, confirming that the aluminosilicate sheets
do not change.48,49
A sharp peak near 3600 cm-1
and a broad band at 3400 cm-1
,
corresponding to O-H stretches, were each present in both Na-MMT and the
nanocomposites. The former arises from intrasheet O-H5,49
the latter from H2O
adsorbate or intercalate.49
The latter band, along with the associated O-H bend at
1636 cm-1
, are reduced or absent after Na-MMT is heated at 80 C for 24 h (Figure
B2, Appendix B). Both O-H absorption intensities are significantly reduced in the
nanocomposite, indicating that less water is present in the nanocomposite than in Na-
MMT. The terminal amine groups of dehydrated PAMAM G0.0 produce strong N-H
stretches at 3284 cm-1
(asymmetric) and 3068 (symmetric).50,51
These absorption
intensities increase for higher PAMAM generations, reflecting the larger number of
terminal amine groups.51
The nanocomposites present a band at 3290 cm-1
(Figure
3.9c). The G2.0/Na-MMT nanocomposite (Figure B3, Appendix B) shows this band
at higher intensity. Characteristic PAMAM absorptions at 2930, 1645, and 1554 cm-1
,
corresponding to a C-H stretch, amide I (primarily C=O) stretch, and amide II (a
combination of N-H in-plane bend and C-N stretch), respectively, are also seen in
both dehydrated PAMAM and the obtained nanocomposites.50
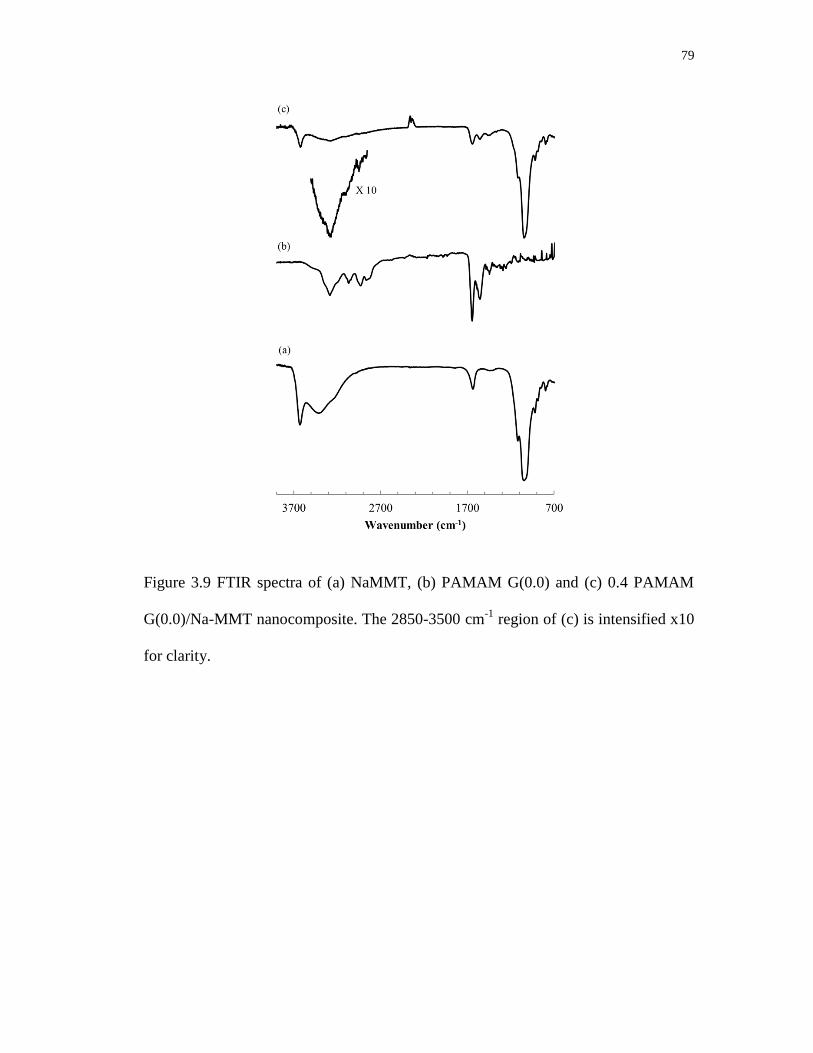
79
Figure 3.9 FTIR spectra of (a) NaMMT, (b) PAMAM G(0.0) and (c) 0.4 PAMAM
G(0.0)/Na-MMT nanocomposite. The 2850-3500 cm-1
region of (c) is intensified x10
for clarity.
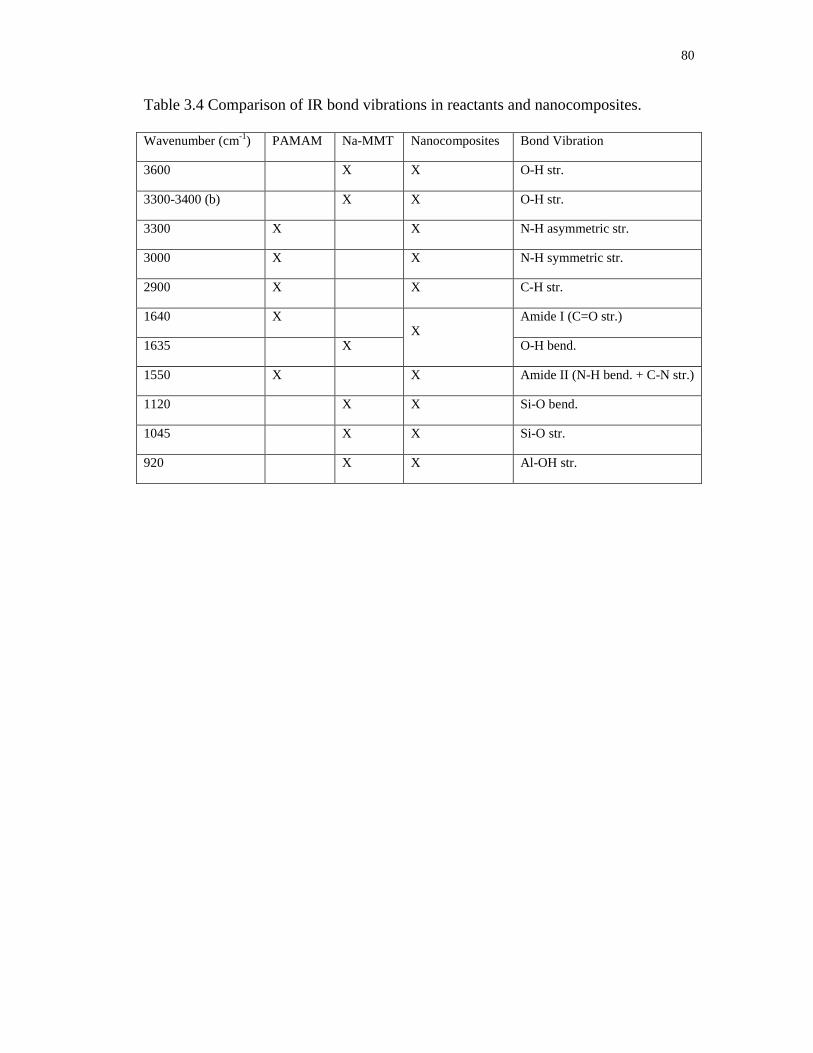
80
Table 3.4 Comparison of IR bond vibrations in reactants and nanocomposites.
Wavenumber (cm-1
) PAMAM Na-MMT Nanocomposites Bond Vibration
3600 X X O-H str.
3300-3400 (b) X X O-H str.
3300 X X N-H asymmetric str.
3000 X X N-H symmetric str.
2900 X X C-H str.
1640 X X
Amide I (C=O str.)
1635 X O-H bend.
1550 X X Amide II (N-H bend. + C-N str.)
1120 X X Si-O bend.
1045 X X Si-O str.
920 X X Al-OH str.
81
3.5 CONCLUSIONS
Lower generation (G0.0-2.0) PAMAM dendrimers form intercalated
nanocomposites with Na-MMT. These are the first reports of the G0.0 and G1.0/Na-
MMT nanocomposites and of a structurally ordered G2.0/Na-MMT. Compositional
studies show clearly that the structures obtained depend on the generation of
PAMAM and the starting organic composition. G0.0 always forms monolayer
structures (d = 0.42 nm), while G2.0 also forms bilayer structures (d = 0.84 nm) at
higher organic content, showing a marked monolayer to bilayer transition. G1.0
showed an intermediate behavior, with mixed-phase products obtained at the reactant
ratios studied. This monolayer arrangement of PAMAM/clay nanocomposites is
reported for the first time. Maximum organic contents of G0.0 monolayer and G2.0
bilayer nanocomposites were ~7% and ~14% respectively. Although gallery
expansions were similar to those observed with linear polymer intercalates, packing
fractions of 0.31-0.32 were 2-3 times lower. At acidic pH, the nanocomposites
forming only monolayer structures are obtained, indicating a stronger electrostatic
attraction between MMT and protonated PAMAM, and these nanocomposites formed
more slowly and were more ordered. Na+ ions play a significant role in
nanocomposite formation. At high pH, PAMAMs show high mobility, zeta potential,
and surface charge densities due to Na+ complexation in solution. FTIR data indicates
that both Na-MMT and PAMAM structural units are preserved in the nanocomposites
obtained.
82
3.6 ASSOCIATED CONTENT
Supporting information available in the Appendix B. Comparison of PXRDs
for room temperature and 60 0C syntheses, and FTIR spectra of dehydrated Na-MMT
and 0.4G(2.0)/Na-MMT nanocomposite.
3.7 REFERENCES
1. M. Alexandre and P. Dubois, Mater. Sci. Eng. R, 2000, 28, 1-63.
2. J. H. Wu and M. M. Lerner, Chem. Mater., 1993, 5, 835-838.
3. J. P. Lemmon, J. H. Wu, C. Oriakhi and M. M. Lerner, Electrochim. Acta,
1995, 40, 2245–2249.
4. A. U. Liyanage and M. M. Lerner, RSC Adv., 2012, 2, 474-479.
5. C. O. Oriakhi, R. L. Nafshun and M. M. Lerner, Mater. Res. Bull., 1996, 31,
1513-1520.
6. K. A. Carrado, P. Thiyagarajan and D. L. Elder, Clays Clay Miner., 1996, 44,
506-514.
7. M. G. Kanatzidis, R. Bissessur, D. C. Degroot, J. L. Schindler and C. R.
Kannewurf, Chem. Mater., 1993, 5, 595–596.
8. C. O. Oriakhi, I. V. Farr and M. M. Lerner, J. Mater. Chem., 1996, 6, 103-
107.
9. E. P. Giannelis, Adv. Mater., 1996, 8, 29-35.

83
10. P. B. Messersmith and E. P. Giannelis, Chem. Mater., 1993, 5, 1064-1066.
11. N. Sukpirom, C. O. Oriakhi and M. M. Lerner, Mater. Res. Bull., 2000, 35,
325-331.
12. J. C. Huang, Z. K. Zhu, J. Yin, X. F. Qian and Y. Y. Sun, Polymer, 2001, 42,
873-877.
13. S. S. Ray and M. Okamoto, Prog. Polym. Sci., 2003, 28, 1539-1641.
14. J. L. Bonczek, W. G. Harris and P. Nkedi-Kizza, Clays Clay Miner., 2002, 50,
11-17.
15. K. Ratanarat, M. Nithitanakul, D. C. Martin and R. Magaraphan, Rev. Adv.
Mater. Sci., 2003, 5, 187-192.
16. A. W. Bosman, H. M. Janssen and E. W. Meijer, Chem. Rev., 1999, 99, 1665-
1688.
17. D. A. Tomalia, A. M. Naylor and W. A. Goddard, Angew. Chem. Int. Ed.
Engl., 1990, 29, 138-175.
18. Y. Kim, A. M. Klutz and K. A. Jacobson, Bioconjugate Chem., 2008, 19,
1660-1672.
19. M. X. Tang, C. T. Redemann and F. C. Szoka, Bioconjugate Chem., 1996, 7,
703-714.
20. P. Singh, F. Moll, S. H. Lin, C. Ferzli, K. S. Yu, R. K. Koski, R. G. Saul and
P. Cronin, Clin. Chem., 1994, 40, 1845-1849.
84
21. M. Q. Zhao and R. M. Crooks, Adv. Mater., 1999, 11, 217-220.
22. S. He and J. Lin, Appl. Mech. Mater., 2012, 108, 91-94.
23. M. Rodlert, C. J. G. Plummer, L. Garamszegi, Y. Leterrier, H. J. M.
Grunbauer and J. A. E. Manson, Polymer, 2004, 45, 949-960.
24. J. Alongi, O. Monticelli, S. Russo and G. Camino, J. Nanostruct. Polym.
Nanocompos., 2006, 2, 127-133.
25. T.-Y. Juang, Y.-C. Chen, C.-C. Tsai, S. A. Dai, T.-M. Wu and R.-J. Jeng,
Appl. Clay Sci., 2010, 48, 103-110.
26. F. Chen, H. Xiong, J. T. Yang, W. W. Cai and M. Q. Zhong, e-Polym., 2012,
No. 016.
27. M. H. A. Rehim, A. M. Youssef and H. A. Essawy, Mater. Chem. Phys.,
2010, 119, 546-552.
28. P. H. Wiersema, A. L. Loeb and J. T. Overbeek, J. Colloid Interface Sci.,
1966, 22, 78-99.
29. A. L. Loeb, J. T. G. Overbeek and P. H. Wiersema, The Electrical Double
Layer around a Spherical Colloid Particle; MIT Press: Cambridge, MA, 1961.
30. X. Y. Shi, I. Banyai, W. G. Lesniak, M. T. Islam, I. Orszagh, P. Balogh, J. R.
Baker and L. P. Balogh, Electrophoresis, 2005, 26, 2949-2959.
31. Y. H. Zhao, M. H. Abraham and A. M. Zissimos, J. Org. Chem., 2003, 68,
7368-7373.
85
32. J. W. Anthony, R. A. Bideaux, K. W. Bladh and M. C. Nichols, Handbook of
Mineralogy; Mineralogical Society of America: Chantilly, VA, 1990.
33. A. Amin, A. S. Taha and M. A. A. El-Ghaffar, J. Appl. Polym. Sci., 2010, 118,
525-537.
34. W. Xie, Z. M. Gao, W. P. Pan, D. Hunter, A. Singh and R. Vaia, Chem.
Mater., 2001, 13, 2979-2990.
35. P. C. LeBaron, Z. Wang and T. J. Pinnavaia, Appl. Clay Sci., 1999, 15, 11-29.
36. B. K. Nanjwade, H. M. Bechra, G. K. Derkar, F. V. Manvi and V. K.
Nanjwade, Eur. J. Pharm. Sci., 2009, 38, 185-196.
37. M. El-Sayed, M. F. Kiani, M. D. Naimark, A. H. Hikal and H. Ghandehari,
Pharm. Res., 2001, 18, 23-28.
38. Y. Y. Cheng, Z. H. Xu, M. L. Ma and T. W. Xu, J. Pharm. Sci., 2008, 97,
123-143.
39. J. Li, L. T. Piehler, D. Qin, J. R. Baker, D. A. Tomalia and D. J. Meier,
Langmuir, 2000, 16, 5613-5616.
40. T. A. Betley, M. M. B. Holl, B. G. Orr, D. R. Swanson, D. A. Tomalia and J.
R. Baker, Langmuir, 2001, 17, 2768-2773.
41. A. Hierlemann, J. K. Campbell, L. A. Baker, R. M. Crooks and A. J. Ricco, J.
Am. Chem. Soc., 1998, 120, 5323-5324.
86
42. K. Takada, D. J. Diaz, H. D. Abruna, I. Cuadrado, C. Casado, B. Alonso, M.
Moran and J. Losada, J. Am. Chem. Soc., 1997, 119, 10763-10773.
43. M. Castagnola, C. Zuppi, D. V. Rossetti, F. Vincenzoni, A. Lupi, A. Vitali, E.
Meucci and I. Messana, Electrophoresis, 2002, 23, 1769-1778.
44. H. M. Brothers, L. T. Piehler and D. A. Tomalia, J. Chromatogr. A, 1998,
814, 233-246.
45. D. Cakara, J. Kleimann and M. Borkovec, Macromolecules, 2003, 36, 4201-
4207.
46. A. Ebber, M. Vaher, J. Peterson and M. Lopp, J. Chromatogr. A, 2002, 949,
351-358.
47. A. Delgado, F. Gonzalezcaballero and J. M. Bruque, J. Colloid Interface Sci.,
1986, 113, 203-211.
48. D. Lee, K. Char, S. W. Lee and Y. W. Park, J. Mater. Chem., 2003, 13, 2942-
2947.
49. O. M. Sadek and W. K. Mekhemer, Thermochim. Acta, 2001, 370, 57-63.
50. I. Grabchev, C. Petkov and V. Bojinov, Dyes Pigm., 2004, 62, 229-234.
51. P. Punyacharoennon, S. Charuchinda and K. Srikulkit, J. Appl. Polym. Sci.,
2008, 110, 3336-3347.
87
CHAPTER 4
USE OF AMINE ELECTRIDE CHEMISTRY TO PREPARE
MOLYBDENUM DISULFIDE INTERCALATION COMPOUNDS
Amila Udayanga Liyanage, and Michael M. Lerner
Department of Chemistry
Oregon State University
Corvallis, OR 97331-4003, USA
RSC Adv., 2014, 4, 47121-47128.
88
4.1 ABSTRACT
Electride solutions, formed by dissolution of Na(m) in ethylenediamine (en),
are used to generate MoS2 intercalation compounds. Two new intercalation
compounds were obtained, labeled and phases, containing both Na and en as
intercalate and cointercalate respectively. The intercalation reaction proceeds via
formation of a kinetic product, the phase, and subsequent generation of a stable
thermodynamic product, the phase. The and phases have interlayer distances,
dIC, of 1.19 and 0.97 nm, respectively, which are ascribed to a perpendicular or
parallel orientation of en within the intercalate galleries. Product compositions,
morphologies and spectrochemical features are obtained from thermogravimetry,
SEM and Raman measurement. Electrochemical reduction of MoS2 in an en-based
electrolyte is investigated, but does not show the same intercalation reactions. The
chemistry observed is compared with that previously reported for this and other MS2
hosts, and with graphite intercalation.
89
4.2 INTRODUCTION
Many transition metal dichalcogenides (MX2) are layered structures consisting
of metal cations bound between hexagonal planes of chalcogenide anions.1-3
The MX2
layers can often be chemically4-8
or electrochemically9-11
reduced with concomitant
intercalation of cationic guests, including the alkali metals,4-6,8
alkaline earths,7 or
other molecular or complex cations.1,10
The electrostatic attraction between the
positive intercalates and the negative MX2 layers stabilize these intercalation
compounds.1 In order to accommodate the cation guests, the MX2 sheets separate,
with the interlayer expansion, d, defined as:
(1)
where and are the interlayer repeat distances observed for the intercalation
compound and the MX2 host, respectively (Figure 4.1). The many possible relative
dispositions of chalcogenide planes leads to a rich variety of identified MX2
structures and polytypes. The transition metal cations may have either trigonal
prismatic or octahedral chalcogenide coordination. Some commonly observed
arrangements are represented by 1T-TiS2 with an (AbC)n stacking repeat, 2H-TaS2
with an (AbACbC)n stacking repeat, and 2H-MoS2 with an (AbABcB)n stacking
repeat. 1T-TiS2 has octahedral coordination, whereas 2H-TaS2 and 2H-MoS2 have
trigonal prismatic coordination around transition metal cations.1-3

90
Figure 4.1 Schematic representations of MoS2 and NaxMoS2∙δH2O, where H2O is a
cointercalate.
MoS2 is a rather chemically inert semiconductor, and is highly anisotropic,
with an electrical resistivity 1000× greater in the direction perpendicular to the sheets.
Important applications include use as a solid lubricant in both terrestrial and space
environments (where graphite shows poor performance), as a catalyst in
hydrodesulfurization and hydrogen evolution reactions, and as a photochemical
catalyst in the oxidation of organics. MoS2 holds promise for more efficient solar cells
due to its resistance to photodegradation in water and photochemical activity over a
wide frequency range.3
Intercalation by alkali metal cations and co-intercalates can change MoS2
from a semiconductor to a metal.3 For example, the band gap decreases and the
electrical conductivity increases by formation of Li0.1MoS2.(PEO)12
and
Li0.1MoS2∙dialkylamine,13
which both act as mixed electronic-ionic conductors.
Intercalation chemistry may thereby enable tailored conductivities for specific
materials applications. Some alkali metal or alkali earth metal intercalation
91
compounds with MoS2 are superconducting, with transition temperatures typically
~7° K.7,8
Intercalation of promoter elements like Co or Ni has improved the catalytic
activity of -Al2O3-supported MoS2 in hydrodesulfurization.3 Enhanced hydrogen
evolution catalysis has been reported by use of metallic 1T-MoS2 nanosheets obtained
via chemical exfoliation of 2H-MoS2 nanostructures grown directly on graphite.14
MoS2 and its intercalation compounds may also be useful as electrodes in
energy storage. Lemmon et al. have reported improved Li cycling stability and a
significant increase in reversible capacity for the PEO/MoS2 and PEO/MoS2/graphene
composites.15,16
MoS2, MoS2/graphene composites and MoS2 nanosheets have
recently been explored for use in Na-ion batteries where cycling performance is
highly correlated to the nanostructure.17-19
Several synthetic routes have been used to produce AxMX2 intercalation
compounds where A is an alkali metal, including; (1) direct high temperature solid
state synthesis by combining either the MX2 host and an alkali metal or combining
the A, M and X constituent elements,1,2
(2) reaction of the MX2 host with a reductant
solution,4-7
or (3) electrochemical reduction of the MX2 host in a suitable
electrolyte.9,11
For some metal redox couples, such as Mo(IV)/Mo(III), the
intercalation reaction requires powerful reductants such as an alkali metal dissolved
in liquid ammonia.4,5,8
This blue electride solution contains sodium ion complex
cations and solvated electrons which are a powerful reductant:20
M(s) → [M(NH3)6]
+ (solv.) + e
− (solv.)
(2)
92
Other strong reductants that have been used to form AxMX2 include
butyllithium or sodium naphthalide dissolved in suitable organic solvents.1,6
For MX2
hosts with more easily reduced metal cations, intercalation can be accomplished using
ammonia,2,21,22
amines1,2,23-26
or aqueous solutions.27
In some cases, solvent (Sol.) cointercalation is observed (Figure 4.1), to
generate compounds represented as AxMX2∙δSol. The driving force for such
cointercalation is the retention of some solvation of the alkali metal intercalate.
Alkali metal intercalation of MS2 was first reported in 1959.4 Rüdorff has
reported a wide range of AxMX2 intercalation compounds with the hosts including
MoS2, MoSe2, WS2, WSe2, ReS2, TiS2, and TiSe2.4,5
Rouxel and coworkers have also
extensively studied intercalation of the group 4 transition metal MX2 compounds.2
Whittingham et al. studied the lithium intercalation of MX2s6 and Schöllhorn et al.
reported several different syntheses and exchange reactions for MX2 intercalation
compounds.1,28
Rüdorff reported formation of Li0.8MoS2∙0.8NH3, Na0.6MoS2, K0.6MoS2 and
Cs0.5MoS2 compounds with interlayer expansions (d, eqn (1)) of 0.335, 0.135, 0.195
and 0.274 nm, respectively.5 Since the ionic radius of Li
+ is ≈ 0.076 nm,
29 the much
larger expansion of Li0.8MoS2∙0.8NH3 indicates the presence of NH3 cointercalate.
Schöllhorn and Weiss reported that these intercalation compounds can also absorb
water to form hydrated cation complexes with an increase in Δd to 0.29–0.70 nm,
depending on the reaction conditions.28
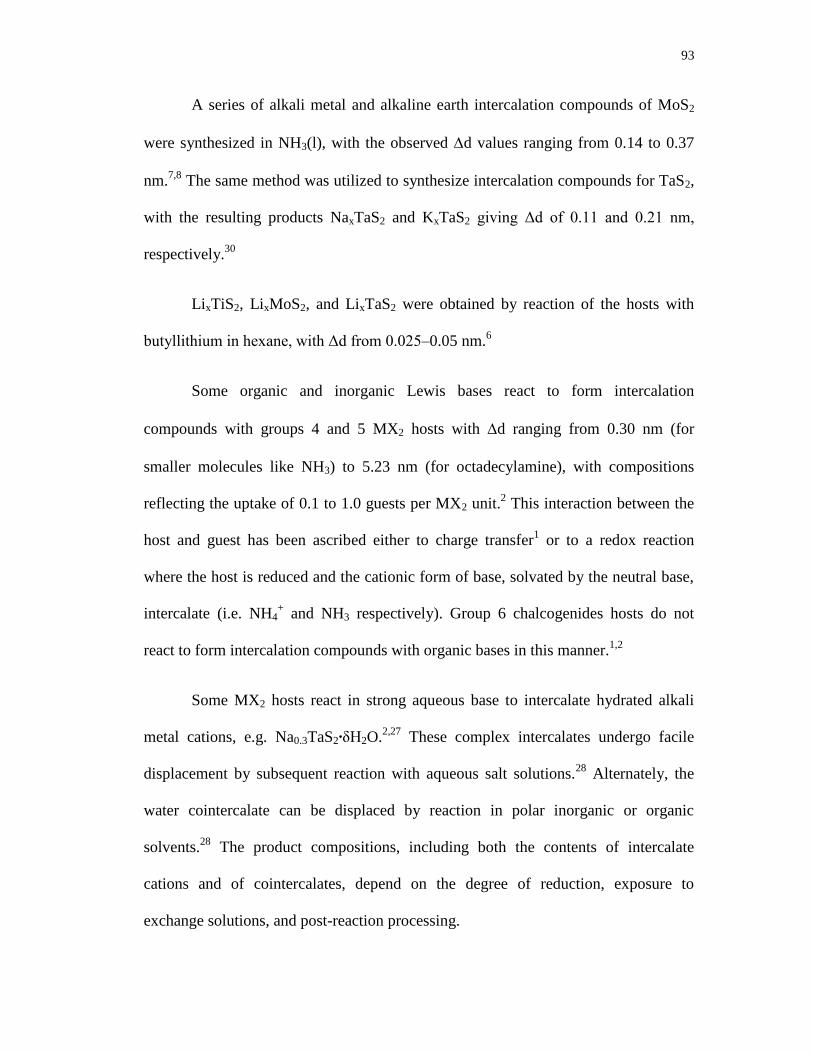
93
A series of alkali metal and alkaline earth intercalation compounds of MoS2
were synthesized in NH3(l), with the observed d values ranging from 0.14 to 0.37
nm.7,8
The same method was utilized to synthesize intercalation compounds for TaS2,
with the resulting products NaxTaS2 and KxTaS2 giving Δd of 0.11 and 0.21 nm,
respectively.30
LixTiS2, LixMoS2, and LixTaS2 were obtained by reaction of the hosts with
butyllithium in hexane, with Δd from 0.025–0.05 nm.6
Some organic and inorganic Lewis bases react to form intercalation
compounds with groups 4 and 5 MX2 hosts with d ranging from 0.30 nm (for
smaller molecules like NH3) to 5.23 nm (for octadecylamine), with compositions
reflecting the uptake of 0.1 to 1.0 guests per MX2 unit.2 This interaction between the
host and guest has been ascribed either to charge transfer1 or to a redox reaction
where the host is reduced and the cationic form of base, solvated by the neutral base,
intercalate (i.e. NH4+ and NH3 respectively). Group 6 chalcogenides hosts do not
react to form intercalation compounds with organic bases in this manner.1,2
Some MX2 hosts react in strong aqueous base to intercalate hydrated alkali
metal cations, e.g. Na0.3TaS2∙δH2O.2,27
These complex intercalates undergo facile
displacement by subsequent reaction with aqueous salt solutions.28
Alternately, the
water cointercalate can be displaced by reaction in polar inorganic or organic
solvents.28
The product compositions, including both the contents of intercalate
cations and of cointercalates, depend on the degree of reduction, exposure to
exchange solutions, and post-reaction processing.

94
Ethylenediamine (en) and trimethylenediamine (tn) react directly with TiS2,
NbS2, and TaS2 to form intercalation compounds with Δd = 0.34–0.41 nm. From the
known intercalate dimensions, these gallery dimensions indicate that the amine
intercalates must form monolayers with long molecular axes oriented parallel to the
host layers.24-26
These products show a range of compositions depending on the host
and sample processing conditions, with intercalate to MX2 ratios of 0.17–0.39 for en
and 0.15–0.33 for tn. Secondary amines, such as diethylamine, dibutylamine, and
dipentylamine react with exfoliated MoS2, generating Li0.1MoS2∙dialkylamine,
where = 0.11-0.42 and Δd = 0.374–0.445 nm, depending on the dialkylamine
cointercalate.13
Our group has previously explored the use of electride solutions to prepare
graphite intercalation compounds containing amines or diamine intercalates.31-34
Stage 1 and 2 graphite intercalation compounds (GICs) were reported for syntheses
using Li(m) or Na(m) dissolved in liquid en. When the intercalate is the Li(en)+
complex, the intercalate guests show an orientation transition of perpendicular to
parallel upon evacuation. With Na(en)+, the complexes show only a parallel
orientation.33
Since the reduction of graphite generally occurs at a lower potential than that
for MoS2, it is worthwhile to explore electride reactions for the intercalation of
dichalcogenide hosts, especially since alkali metal-amine electride systems (other
than with ammonia) have not previously been reported. In this work, we describe the
first use of electride solutions to form MoS2 intercalation compounds with amines,
along with the product structures and compositions obtained. A novel intermediate
95
phase is found, and we propose a mechanism for the reaction. The results obtained are
also analyzed in light of recent reports on electrochemical reduction of MoS2.
4.3 EXPERIMENTAL
4.3.1 REAGENTS
Sodium metal (3-12 mm pieces in oil, 99.95%, Alfa Aeser), ethylenediamine
(en) (99%, Alfa Aeser), molybdenum disulfide (MoS2) (powder <2 micron, 99%,
Aldrich), poly(ethylene-co-propylene-co-5-methylene-2-norbornene) (EPDM)
(Aldrich), acetylene black (99.5+%, Alfa Aeser), cyclohexane (ACS grade, Alfa
Aeser), sodium hexafluorophosphate (NaPF6) (98%, Aldrich) and acetonitrile (HPLC
grade, Fisher Scientific) were used as received.
4.3.2 CHEMICAL SYNTHESES
Synthesis and handling of the air-sensitive reagents were performed under an
inert atmosphere (N2) using either a drybox or septum-syringe techniques. In a typical
reaction, Na metal (50 mg) was stirred overnight in ethylenediamine (3.0 mL) at 60
°C under an inert (N2) atmosphere to form a blue-colored electride solution. MoS2
(100 mg) was then added to the electride solution, and the reaction vigorously stirring
at 60 °C for 48 h. Samples were centrifuged for 10 minutes and the solution phase
was extracted by syringe. The solid products were placed under vacuum for 12 h at
60 °C.
As specified below, the above reaction conditions (time, temperature, reagent
amounts and chemical addition sequence) were varied for some experiments.
96
Products obtained are labeled with reaction temperature and time. For example, the
sample obtained by reaction at 60 °C for 24 h has been labeled “S-60C-24h”.
4.3.3 ELECTROCHEMICAL SYNTHESES
Galvanostatic reduction was performed in a 2-compartment cell with a fritted
glass separator maintained under an inert (N2) atmosphere at ambient temperature.
Working electrodes were prepared by painting SS mesh (geometric area ~1 cm2) with
a cyclohexane slurry containing MoS2 powder (80 mass pct.), acetylene black (15
mass pct.), and EPDM binder (5 mass pct.). The dried electrode mass was 18-20 mg.
Counter and reference electrodes were SS mesh and SS wire. The electrolyte solution
was 0.1 M NaPF6 in ethylenediamine. Working electrodes were reduced at a constant
current of 0.10 mA for 16–48 h, then immediately removed from the cell, rinsed
briefly with 3–4 mL of acetonitrile, and dried overnight under vacuum at ambient
temperature.
4.3.4 ANALYSES
Powder X-ray diffraction (XRD) data from 3–20° 2θ were collected on a
Rigaku MiniFlex II diffractometer, using Ni-filtered Cu Kα radiation, at a scan rate of
3° min-1
and step size of 0.02°. Diffraction peak areas were obtained using MDI
JADE 9.0 XRD analysis software. Thermogravimetric (TGA) analyses were
performed using a Shimadzu TGA-50 analyzer under flowing Ar gas (20 mL min-1
)
from ambient to 400 °C at a heating rate of 10 °C min-1
and under air from ambient to
900 °C at a heating rate of 10 °C min-1
. Scanning electron micrographs (SEM) were
obtained using an FEI Quanta 600F scanning electron microscope equipped with a
field emission gun and operated at 10 kV. Raman spectra were obtained from 60–
97
4000 cm-1
using a Witec Alpha 300 confocal Raman microscope with 514 nm laser
source.
The van der Waals volume of en, Ven = 0.0651 nm3 was calculated based on
Bondi radii using a method termed “Atomic and Bond Contributions of van der
Waals volume” (VABC).35
Volume of Na+, VNa = 0.00445 nm
3 was calculated using
the ionic radius of Na+ (0.102 nm).
29 Packing fractions for MoS2 intercalation
compounds were calculated36,37
as:
√ (3)
where n and m are the molar ratios of Na : MoS2 and en : MoS2 respectively, and
a = 0.3160 nm1,2
.
Energy optimization of the gas-phase en molecule was performed using the
DFT B3LYP method with a 6-31G+(d,p) basis set and Gaussian 09W software.
4.4 RESULTS AND DISCUSSION
The powder XRD patterns obtained from reactions of MoS2 with a sodium
electride solution (Figures 4.2, and 4.3) shows host expansion to form new
intercalation compounds. In Figure 4.2 (S-60C-48h), a single new phase is evident
with interlayer distance, dIC = 0.97 nm. The expansion relative to the host MoS2 sheet
thickness (d002 = 0.615 nm)3 is d = 0.35 nm. Hereafter this new phase is labeled the
phase.
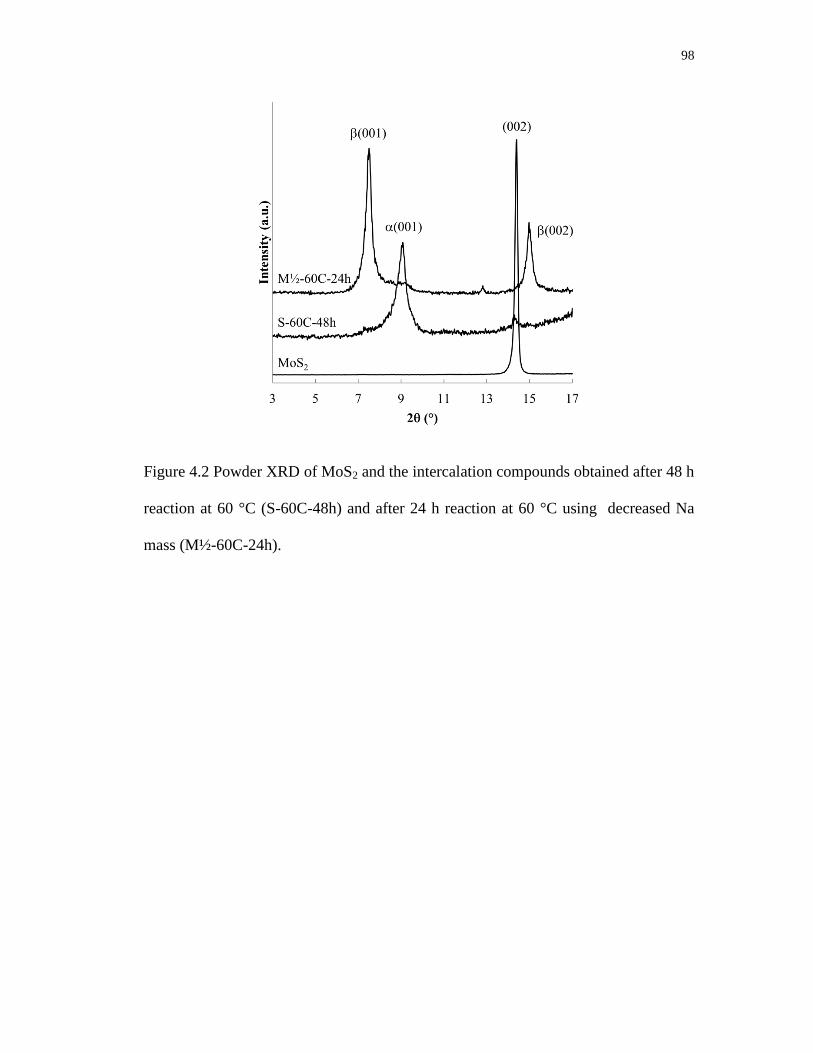
98
Figure 4.2 Powder XRD of MoS2 and the intercalation compounds obtained after 48 h
reaction at 60 °C (S-60C-48h) and after 24 h reaction at 60 °C using decreased Na
mass (M½-60C-24h).
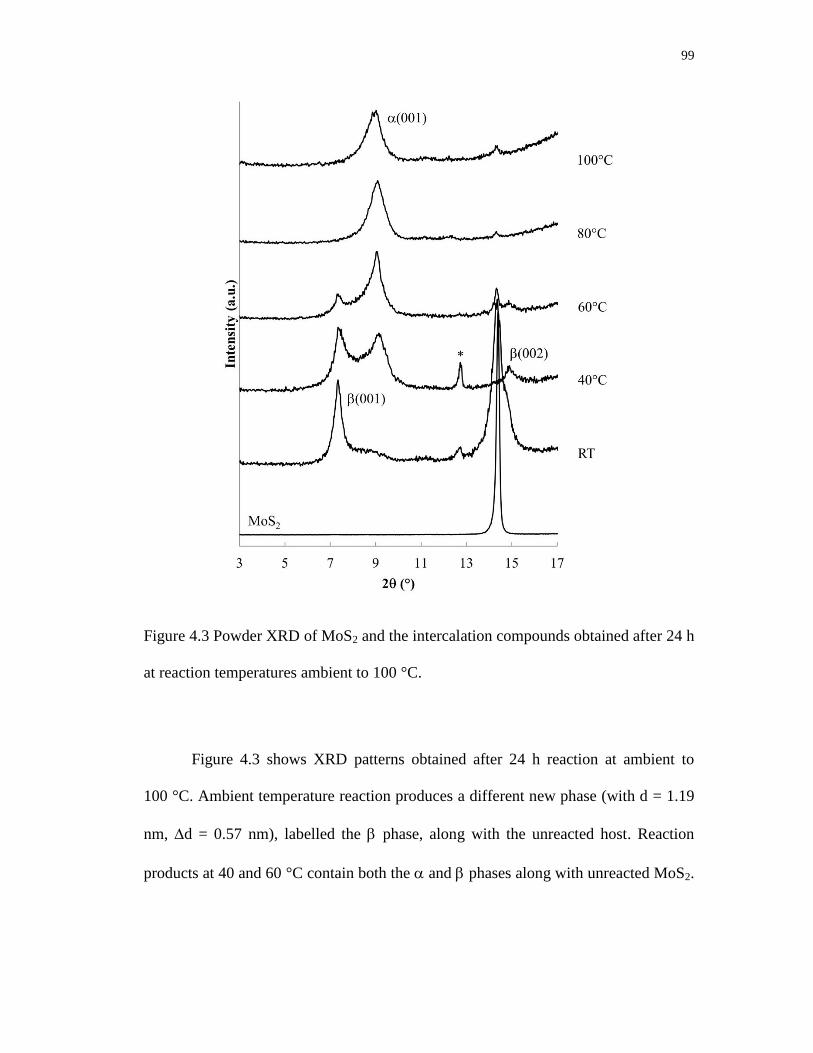
99
Figure 4.3 Powder XRD of MoS2 and the intercalation compounds obtained after 24 h
at reaction temperatures ambient to 100 °C.
Figure 4.3 shows XRD patterns obtained after 24 h reaction at ambient to
100 °C. Ambient temperature reaction produces a different new phase (with d = 1.19
nm, d = 0.57 nm), labelled the phase, along with the unreacted host. Reaction
products at 40 and 60 °C contain both the and phases along with unreacted MoS2.

100
Higher temperature reactions, at 80 °C and 100 °C, produce mainly the phase, with
a very small residual of unreacted MoS2.
Lower temperature reactions show an additional diffraction peak (tagged with
an *) near d = 0.69 nm, attributed to NaxMoS2, i.e. the intercalation product without
the en cointercalate. This phase has previously been reported, with d = 0.75 nm (ref.
28) or d=0.71 nm.38
The small interlayer expansion observed for this phase (Δd ≈ 0.1
nm) eliminates the possibility of en contained in that product.
Summarizing the changes observed with varied reaction temperature, (i) lower
temperature reactions result in a relatively large amount of unreacted host (an
incomplete reaction), and are relatively rich in the phase, and (ii) higher
temperatures generate nearly complete reactions to form mainly the phase.
The incomplete reactions observed at lower temperature could arise from the
slow kinetics of amine electride (reactant) formation, resulting in a low reductant
concentration, or alternately they may be related to a slower rate of diffusion of the
Na(en)x+ complex intercalate into the intercalation compound galleries.
In other experiments aimed at decreasing the electride reactant concentration,
reactions for 48 h reaction at 60 °C were run using ½ the mass of Na or 5× the
standard volume of en. Both changes results in products containing both the and
phases and unreacted MoS2. The association of phase and incomplete reactions
again provides some evidence that the phase is a kinetic product. In one experiment
using the decreased Na mass, the product obtained after 24 h reaction at 60 °C
contained only the phase (Figure 4.2. M½-60C-24h).

101
Products obtained at 60 °C with varied reaction times are shown in Figure 4.4.
Shorter reaction times produce the phase along with unreacted MoS2; the phase is
first evident after reaction for 1 h. At longer reaction times, the phase and MoS2 are
no longer observed. These data confirm that the phase is formed more rapidly as a
kinetic product, but ultimately disappears as the more stable phase forms.
Figure 4.4 Powder XRD data obtained for reaction of MoS2 with Na/en electride
solution at 60 °C. Reaction times are indicated at the right.
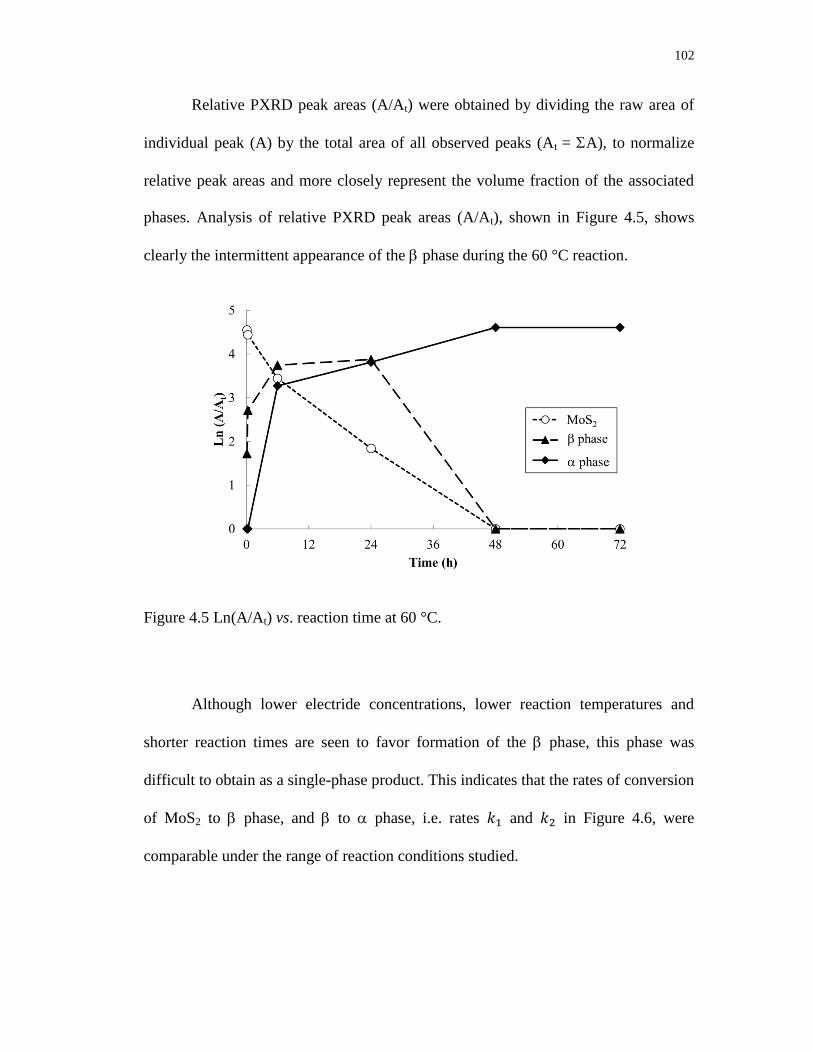
102
Relative PXRD peak areas (A/At) were obtained by dividing the raw area of
individual peak (A) by the total area of all observed peaks (At = A), to normalize
relative peak areas and more closely represent the volume fraction of the associated
phases. Analysis of relative PXRD peak areas (A/At), shown in Figure 4.5, shows
clearly the intermittent appearance of the phase during the 60 °C reaction.
Figure 4.5 Ln(A/At) vs. reaction time at 60 °C.
Although lower electride concentrations, lower reaction temperatures and
shorter reaction times are seen to favor formation of the phase, this phase was
difficult to obtain as a single-phase product. This indicates that the rates of conversion
of MoS2 to phase, and to phase, i.e. rates and in Figure 4.6, were
comparable under the range of reaction conditions studied.
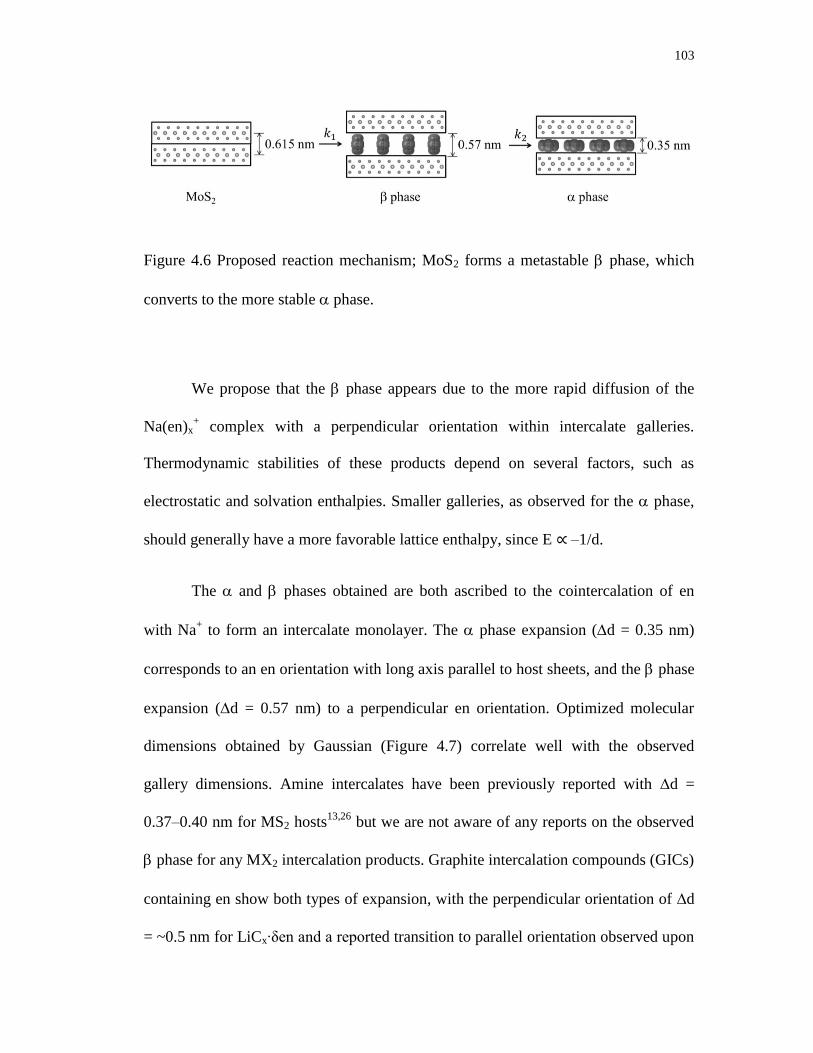
103
Figure 4.6 Proposed reaction mechanism; MoS2 forms a metastable phase, which
converts to the more stable phase.
We propose that the phase appears due to the more rapid diffusion of the
Na(en)x+ complex with a perpendicular orientation within intercalate galleries.
Thermodynamic stabilities of these products depend on several factors, such as
electrostatic and solvation enthalpies. Smaller galleries, as observed for the phase,
should generally have a more favorable lattice enthalpy, since E ∝ –1/d.
The and phases obtained are both ascribed to the cointercalation of en
with Na+ to form an intercalate monolayer. The phase expansion (d = 0.35 nm)
corresponds to an en orientation with long axis parallel to host sheets, and the phase
expansion (d = 0.57 nm) to a perpendicular en orientation. Optimized molecular
dimensions obtained by Gaussian (Figure 4.7) correlate well with the observed
gallery dimensions. Amine intercalates have been previously reported with d =
0.37–0.40 nm for MS2 hosts13,26
but we are not aware of any reports on the observed
phase for any MX2 intercalation products. Graphite intercalation compounds (GICs)
containing en show both types of expansion, with the perpendicular orientation of d
= ~0.5 nm for LiCx∙δen and a reported transition to parallel orientation observed upon

104
evacuation of the product.33
That work also reported the formation of a GIC with
composition NaC15∙1.0en with d = 0.36 nm, indicating a parallel en orientation.33
Figure 4.7 Gaussian-optimized molecular dimensions of ethylenediamine.
An alternate explanation for the appearance of and phases could be the
formation of en monolayers and bilayers, respectively, as occurs in the hydration of
AxMS2.39
However, thermogravimetric data (vide infra) show that the obtained phases
have similar en content, which does not support this model. Additionally, the
observed dIC for the phase is 1.19 nm, which is significantly less than the 1.32 nm
calculated to accommodate two en layers.
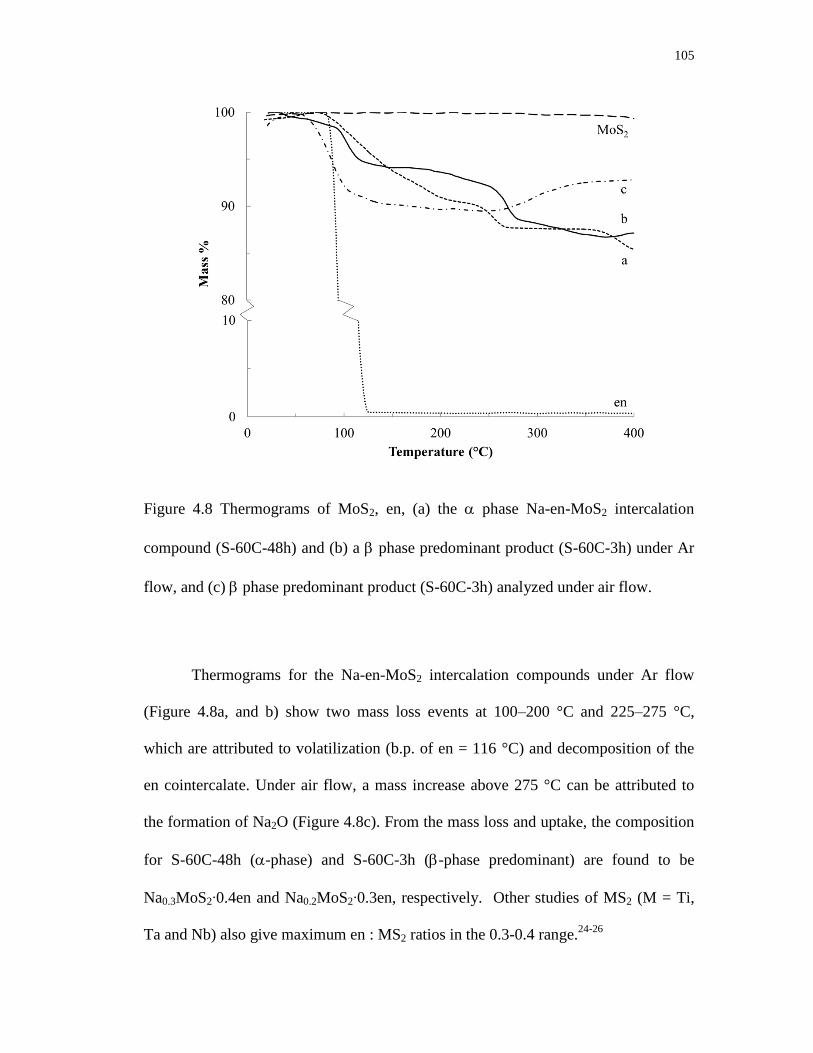
105
Figure 4.8 Thermograms of MoS2, en, (a) the phase Na-en-MoS2 intercalation
compound (S-60C-48h) and (b) a phase predominant product (S-60C-3h) under Ar
flow, and (c) phase predominant product (S-60C-3h) analyzed under air flow.
Thermograms for the Na-en-MoS2 intercalation compounds under Ar flow
(Figure 4.8a, and b) show two mass loss events at 100–200 °C and 225–275 °C,
which are attributed to volatilization (b.p. of en = 116 °C) and decomposition of the
en cointercalate. Under air flow, a mass increase above 275 °C can be attributed to
the formation of Na2O (Figure 4.8c). From the mass loss and uptake, the composition
for S-60C-48h (-phase) and S-60C-3h (-phase predominant) are found to be
Na0.3MoS2∙0.4en and Na0.2MoS2∙0.3en, respectively. Other studies of MS2 (M = Ti,
Ta and Nb) also give maximum en : MS2 ratios in the 0.3-0.4 range.24-26
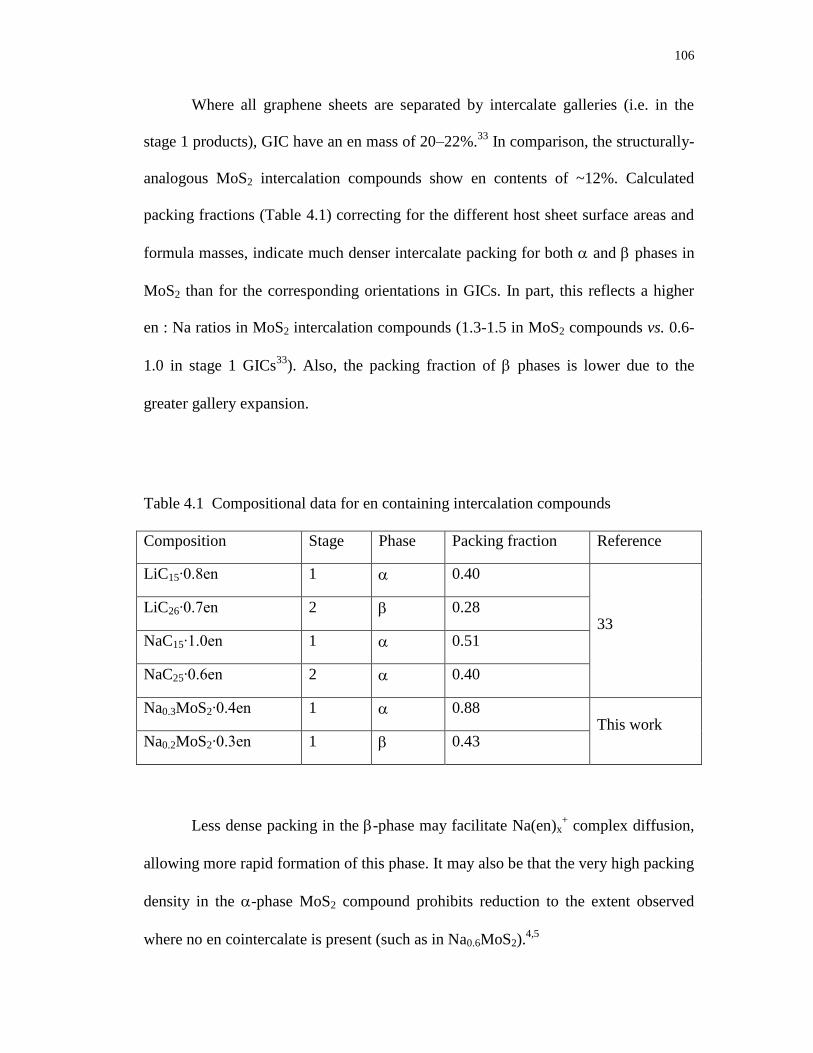
106
Where all graphene sheets are separated by intercalate galleries (i.e. in the
stage 1 products), GIC have an en mass of 20–22%.33
In comparison, the structurally-
analogous MoS2 intercalation compounds show en contents of ~12%. Calculated
packing fractions (Table 4.1) correcting for the different host sheet surface areas and
formula masses, indicate much denser intercalate packing for both and phases in
MoS2 than for the corresponding orientations in GICs. In part, this reflects a higher
en : Na ratios in MoS2 intercalation compounds (1.3-1.5 in MoS2 compounds vs. 0.6-
1.0 in stage 1 GICs33
). Also, the packing fraction of phases is lower due to the
greater gallery expansion.
Table 4.1 Compositional data for en containing intercalation compounds
Composition Stage Phase Packing fraction Reference
LiC15∙0.8en 1 0.40
33 LiC26∙0.7en 2 0.28
NaC15∙1.0en 1 0.51
NaC25∙0.6en 2 0.40
Na0.3MoS2∙0.4en 1 0.88 This work
Na0.2MoS2∙0.3en 1 0.43
Less dense packing in the -phase may facilitate Na(en)x+ complex diffusion,
allowing more rapid formation of this phase. It may also be that the very high packing
density in the -phase MoS2 compound prohibits reduction to the extent observed
where no en cointercalate is present (such as in Na0.6MoS2).4,5

107
The calculated sheet charge densities for NaC15∙1.0en, Na0.3MoS2∙0.4en and
Na0.2MoS2∙0.3en are 2.5, 3.5, and 2.3 e- per nm
2, respectively. Again, we can propose
that lower charge densities may allow for more rapid diffusion, but result in a less
thermodynamically stable product.
SEM images (Figure 4.9) show that a layered microstructure is retained in all
samples, with the reaction products displaying a somewhat delaminated appearance
as compared to the starting MoS2.
Figure 4.9 SEM images of (a) MoS2 and (b) phase intercalation compound
Na0.3MoS2∙0.4en
Raman spectra of MoS2 and a representative Na-en-MoS2 intercalation
compound are shown in Figure 4.10. MoS2 displays prominent sharp absorbance
peaks at 390 cm-1
(E2g1 mode) and 418 cm
-1 (A2g mode) as has been reported
previously.40,41
After intercalation, the spectrum background increases significantly,
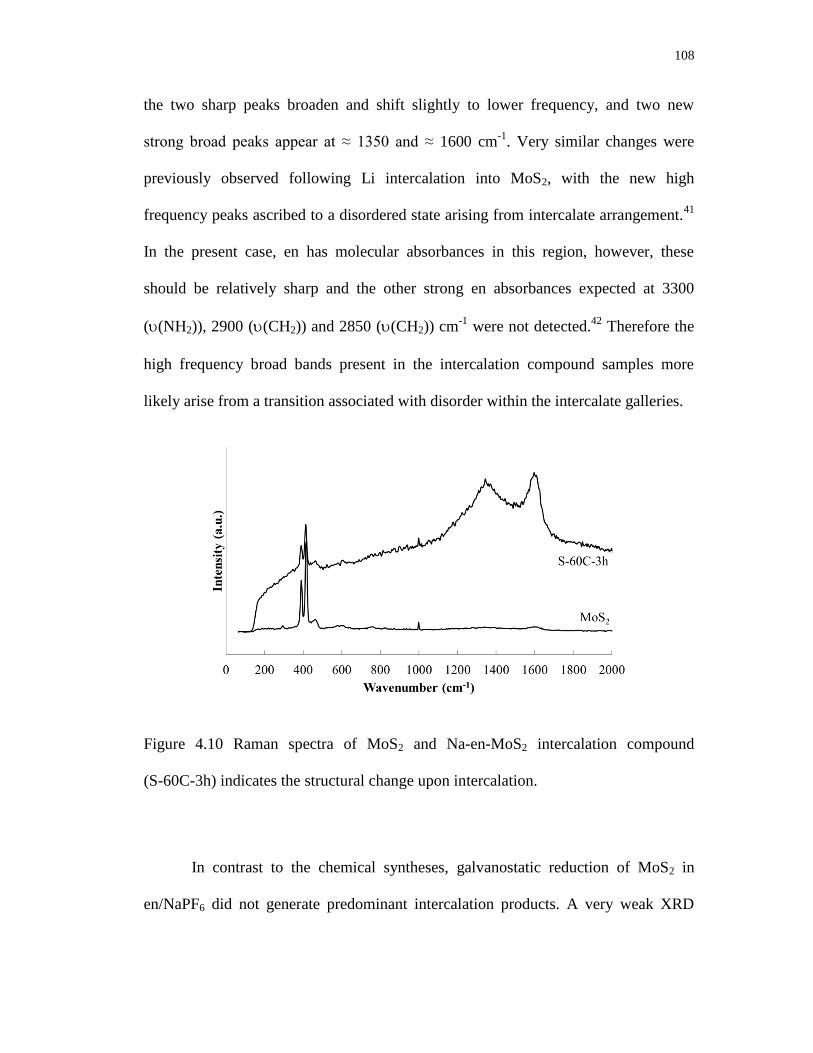
108
the two sharp peaks broaden and shift slightly to lower frequency, and two new
strong broad peaks appear at ≈ 1350 and ≈ 1600 cm-1
. Very similar changes were
previously observed following Li intercalation into MoS2, with the new high
frequency peaks ascribed to a disordered state arising from intercalate arrangement.41
In the present case, en has molecular absorbances in this region, however, these
should be relatively sharp and the other strong en absorbances expected at 3300
((NH2)), 2900 ((CH2)) and 2850 ((CH2)) cm-1
were not detected.42
Therefore the
high frequency broad bands present in the intercalation compound samples more
likely arise from a transition associated with disorder within the intercalate galleries.
Figure 4.10 Raman spectra of MoS2 and Na-en-MoS2 intercalation compound
(S-60C-3h) indicates the structural change upon intercalation.
In contrast to the chemical syntheses, galvanostatic reduction of MoS2 in
en/NaPF6 did not generate predominant intercalation products. A very weak XRD
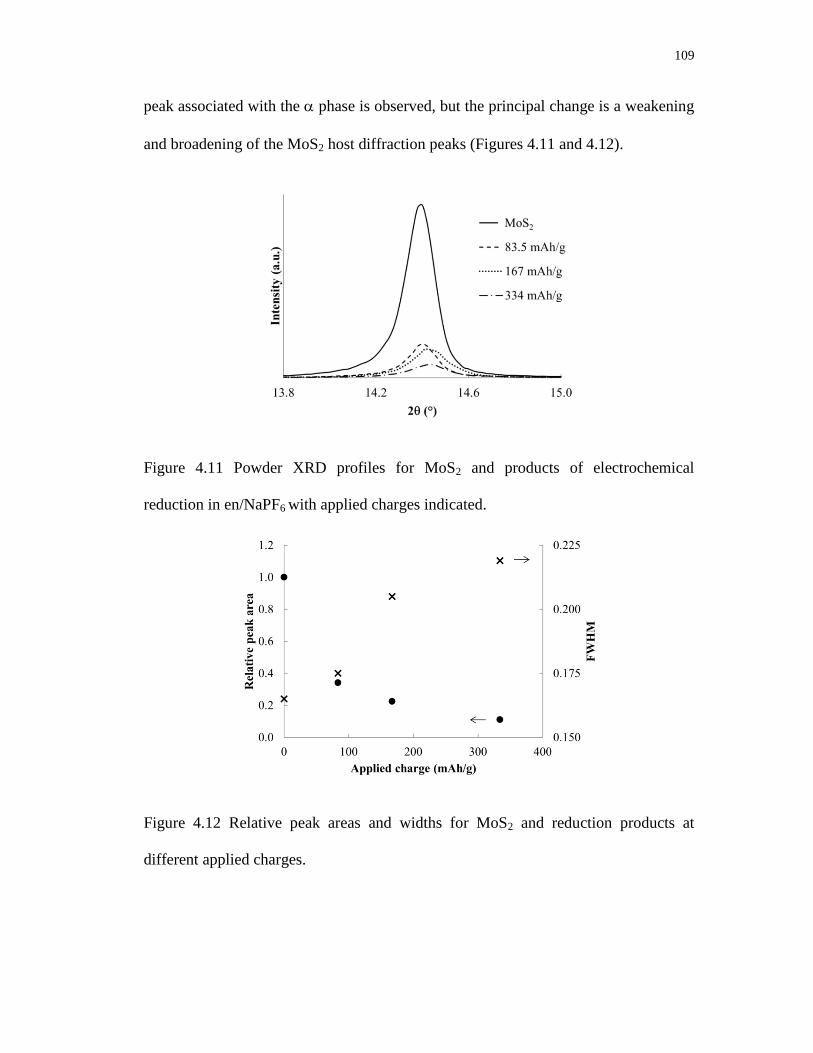
109
peak associated with the phase is observed, but the principal change is a weakening
and broadening of the MoS2 host diffraction peaks (Figures 4.11 and 4.12).
Figure 4.11 Powder XRD profiles for MoS2 and products of electrochemical
reduction in en/NaPF6 with applied charges indicated.
Figure 4.12 Relative peak areas and widths for MoS2 and reduction products at
different applied charges.
110
Lemmon et al. reported that reduction of MoS2 in a 7 : 3 vv ethylene methyl
carbonate : ethylene carbonate electrolyte with LiPF6 resulted in formation of Li2S
and an amorphous form of Mo or LixMo.15,16
The analogous reduction for Na reaction
is in eqn (4):
MoS2 + (4+x)Na+
+ (4+x)e- → 2 Na2S + NaxMo (4)
Theoretically the capacity required for the above reduction is ≈ 840 mA h g-1
(if x = 1); each 1e- reduction translates to 167 mA h g
-1. After applying from half to
twice the latter charge, almost no intercalation products were evident. As can be seen,
the ordered layered structure is destroyed even at much lower applied charges,
suggesting an entirely different and non-intercalative mechanism for this
electrochemical reduction.
4.5 CONCLUSIONS
MoS2 reacts with electride solutions with amine to form intercalation
compounds of composition Na0.2-0.3MoS2∙0.3-0.4en. A metastable product, identified
as the phase, shows a perpendicular en orientation with interlayer expansion of 0.57
nm, and the thermodynamic product, or phase, shows a parallel orientation and
interlayer expansion of 0.35 nm. Shorter reaction time, dilution and lower
temperatures favor formation of the phase. The intercalation products are not
obtained by electrochemical reduction in en/NaPF6.

111
4.6 ACKNOWLEDGEMENTS
We thank Professor Chih-Hung Chang and Changqing Pan (OSU Chemical
Engineering) for assistance with Raman measurements. A.U.L. thanks the Whiteley
Fellowship in Material Sciences for financial support.
4.7 REFERENCES
1. Intercalation Chemistry, ed. M. S. Whittingham and A. J. Jacobson,
Academic Press, New York, NY, 1982.
2. Intercalated layered materials, ed., F. A. Lévy, D. Reidel Publishing,
Dordrecht, Holland, 1979.
3. E. Benavente, M. A. Santa Ana, F. Mendizabal and G. Gonzalez, Coord.
Chem. Rev., 2002, 224, 87.
4. W. Rüdorff and H. H. Sick, Angew. Chem., 1959, 71, 127.
5. W. Rüdorff, Chimia, 1965, 19, 489.
6. M. S. Whittingham and F. R. Gamble, Mater. Res. Bull., 1975, 10, 363.
7. R. B. Somoano, V. Hadek, A. Rembaum, S. Samson and J. A. Woollam, J.
Chem. Phys., 1975, 62, 1068.
8. R. B. Somoano, V. Hadek and A. Rembaum, J. Chem. Phys., 1973, 58, 697.
9. M. A. Santa Ana, V. Sanchez and G. Gonzalez, Electrochim. Acta, 1995, 40,
1773.
112
10. A. A. Stepanov, N. D. Lenenko, A. S. Golub and V. S. Pervov, Russ. J.
Electrochem., 2013, 49, 86.
11. M. S. Whittingham, J. Electroanal. Chem., 1981, 118, 229.
12. G. Gonzalez, M. A. Santa Ana and E. Benavente, Electrochim. Acta, 1998, 43,
1327.
13. V. Sanchez, E. Benavente, M. A. Santa Ana and G. Gonzalez, Chem. Mater.,
1999, 11, 2296.
14. M. A. Lukowski, A. S. Daniel, F. Meng, A. Forticaux, L. S. Li and S. Jin, J.
Am. Chem. Soc., 2013, 135, 10274.
15. J. Xiao, D. W. Choi, L. Cosimbescu, P. Koech, J. Liu and J. P. Lemmon,
Chem. Mater., 2010, 22, 4522.
16. J. Xiao, X. J. Wang, X. Q. Yang, S. D. Xun, G. Liu, P. K. Koech, J. Liu and J.
P. Lemmon, Adv. Funct. Mater., 2011, 21, 2840.
17. L. David, R. Bhandavat and G. Singh, ACS Nano, 2014, 8, 1759.
18. G. S. Bang, K. W. Nam, J. Y. Kim, J. Shin, J. W. Choi and S.-Y. Choi, ACS
Appl. Mater. Interfaces, 2014, 6, 7084.
19. J. Park, J.-S. Kim, J.-W. Park, T.-H. Nam, K.-W. Kim, J.-H. Ahn, G. Wang
and H.-J. Ahn, Electrochim. Acta, 2013, 92, 427.
20. J. L. Dye, Science, 2003, 301, 607.

113
21. E. Wein, W. Mullerwarmuth and R. Schöllhorn, Solid State Ionics, 1987, 22,
231.
22. L. Bernard, M. McKelvy, W. Glaunsinger and P. Colombet, Solid State
Ionics, 1985, 15, 301.
23. L. A. Brown, W. S. Glaunsinger and M. J. McKelvy, J. Solid State Chem.,
2000, 155, 326.
24. H. Ogata, H. Fujimori, S. Miyajima, K. Kobashi, T. Chiba, R. E. Taylor and
K. Endo, J. Phys. Chem. Solids, 1997, 58, 701.
25. E. Figueroa, J. W. Brill and J. P. Selegue, J. Phys. Chem. Solids, 1996, 57,
1123.
26. H. Boller and H. Blaha, J. Solid State Chem., 1982, 45, 119.
27. M. S. Whittingham, Mater. Res. Bull., 1974, 9, 1681.
28. R. Schöllhorn and A. Weiss, J. Less-Common Met., 1974, 36, 229.
29. R. D. Shannon, Acta Crystallogr. Sect. A: Cryst. Phys. Diffr. Theor. Gen.
Crystallogr., 1976, 32, 751.
30. O. Matsumoto, E. Yamada, Y. Kanzaki and M. Konuma, J. Phys. Chem.
Solids, 1978, 39, 191.
31. T. Maluangnont, K. Gotoh, K. Fujiwara and M. M. Lerner, Carbon, 2011, 49,
1040.
114
32. T. Maluangnont, G. T. Bui, B. A. Huntington and M. M. Lerner, Chem.
Mater., 2011, 23, 1091.
33. T. Maluangnont, M. M. Lerner and K. Gotoh, Inorg. Chem., 2011, 50, 11676.
34. T. Maluangnont, W. Sirisaksoontorn and M. M. Lerner, Carbon, 2012, 50,
597.
35. Y. H. Zhao, M. H. Abraham and A. M. Zissimos, J. Org. Chem., 2003, 68,
7368.
36. A. U. Liyanage and M. M. Lerner, RSC Adv., 2012, 2, 474.
37. A. U. Liyanage, E. U. Ikhuoria, A. A. Adenuga, V. T. Remcho and M. M.
Lerner, Inorg. Chem., 2013, 52, 4603.
38. J. Zheng, H. Zhang, S. H. Dong, Y. P. Liu, C. T. Nai, H. S. Shin, H. Y. Jeong,
B. Liu and K. P. Loh, Nat. Commun., 2014, 5, 2995.
39. A. Lerf and R. Schöllhorn, Inorg. Chem., 1977, 16, 2950.
40. C. N. R. Rao and A. Nag, Eur. J. Inorg. Chem., 2010, 4244.
41. T. Sekine, C. Julien, I. Samaras, M. Jouanne and M. Balkanski, Mater. Sci.
Eng. B, 1989, 3, 153.
42. M. G. Giorgini, M. R. Pelletti, G. Paliani and R. S. Cataliotti, J. Raman
Spectrosc., 1983, 14, 16.
115
CHAPTER 5
CONCLUSION
5.1 CONCLUSION
The development of novel synthetic methods, along with resulting new
intercalation compounds and nanocomposites, and their structural and compositional
analyses, are reported in this dissertation. Below are some conclusions and proposals
for additional studies on new synthetic reactions.
A template synthesis method was developed to obtain NiPS3/polymer
nanocomposites. A summary of the resulting nanocomposites is shown in Table 5.1.
The observed monolayer arrangement in intercalate galleries for NiPS3/PEO is
different from the previously-reported bilayers obtained by a topotactic route for
MPS3/PEO nanocomposites. Three other polymer/NiPS3 nanocomposites (NiPS3/PEI,
NiPS3/PVA and NiPS3/PVP) are also reported for the first time using this new
synthetic approach. The template method results in more densely packed galleries.
More dilute conditions, a more polar solvent and longer aging times increases the
crystallite size of the nanocomposites. The concentrations of P2S64-
and Ni2+
in the
reaction solution govern the nanocomposite nucleation and growth, respectively.
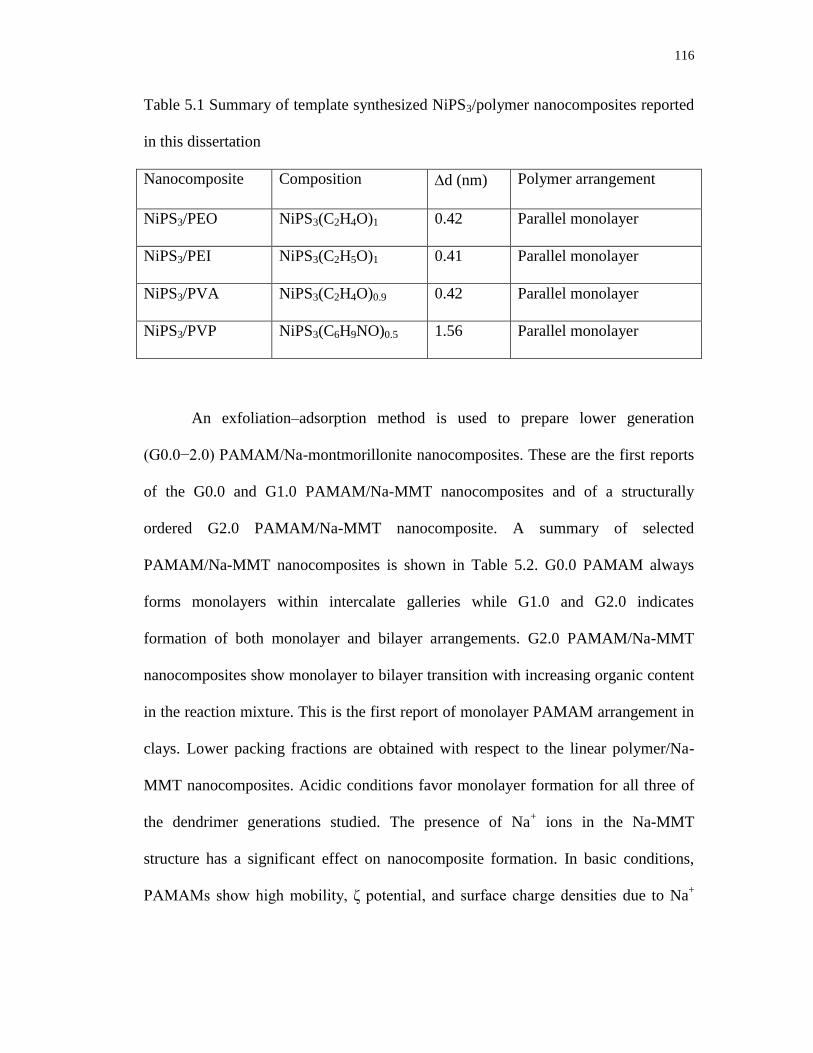
116
Table 5.1 Summary of template synthesized NiPS3/polymer nanocomposites reported
in this dissertation
Nanocomposite Composition d (nm) Polymer arrangement
NiPS3/PEO NiPS3(C2H4O)1 0.42 Parallel monolayer
NiPS3/PEI NiPS3(C2H5O)1 0.41 Parallel monolayer
NiPS3/PVA NiPS3(C2H4O)0.9 0.42 Parallel monolayer
NiPS3/PVP NiPS3(C6H9NO)0.5 1.56 Parallel monolayer
An exfoliation–adsorption method is used to prepare lower generation
(G0.0−2.0) PAMAM/Na-montmorillonite nanocomposites. These are the first reports
of the G0.0 and G1.0 PAMAM/Na-MMT nanocomposites and of a structurally
ordered G2.0 PAMAM/Na-MMT nanocomposite. A summary of selected
PAMAM/Na-MMT nanocomposites is shown in Table 5.2. G0.0 PAMAM always
forms monolayers within intercalate galleries while G1.0 and G2.0 indicates
formation of both monolayer and bilayer arrangements. G2.0 PAMAM/Na-MMT
nanocomposites show monolayer to bilayer transition with increasing organic content
in the reaction mixture. This is the first report of monolayer PAMAM arrangement in
clays. Lower packing fractions are obtained with respect to the linear polymer/Na-
MMT nanocomposites. Acidic conditions favor monolayer formation for all three of
the dendrimer generations studied. The presence of Na+ ions in the Na-MMT
structure has a significant effect on nanocomposite formation. In basic conditions,
PAMAMs show high mobility, ζ potential, and surface charge densities due to Na+
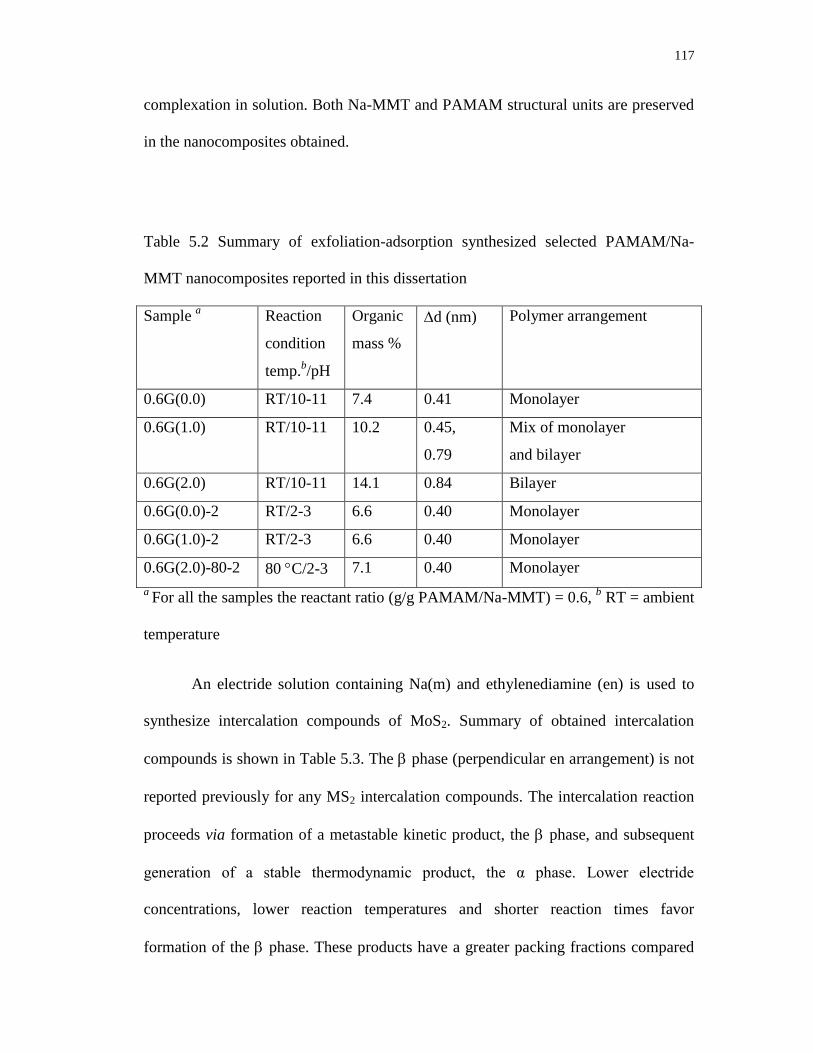
117
complexation in solution. Both Na-MMT and PAMAM structural units are preserved
in the nanocomposites obtained.
Table 5.2 Summary of exfoliation-adsorption synthesized selected PAMAM/Na-
MMT nanocomposites reported in this dissertation
Sample a
Reaction
condition
temp.b/pH
Organic
mass %
d (nm) Polymer arrangement
0.6G(0.0) RT/10-11 7.4 0.41 Monolayer
0.6G(1.0) RT/10-11 10.2 0.45,
0.79
Mix of monolayer
and bilayer
0.6G(2.0) RT/10-11 14.1 0.84 Bilayer
0.6G(0.0)-2 RT/2-3 6.6 0.40 Monolayer
0.6G(1.0)-2 RT/2-3 6.6 0.40 Monolayer
0.6G(2.0)-80-2 80 C/2-3 7.1 0.40 Monolayer
a For all the samples the reactant ratio (g/g PAMAM/Na-MMT) = 0.6,
b RT = ambient
temperature
An electride solution containing Na(m) and ethylenediamine (en) is used to
synthesize intercalation compounds of MoS2. Summary of obtained intercalation
compounds is shown in Table 5.3. The phase (perpendicular en arrangement) is not
reported previously for any MS2 intercalation compounds. The intercalation reaction
proceeds via formation of a metastable kinetic product, the phase, and subsequent
generation of a stable thermodynamic product, the α phase. Lower electride
concentrations, lower reaction temperatures and shorter reaction times favor
formation of the phase. These products have a greater packing fractions compared
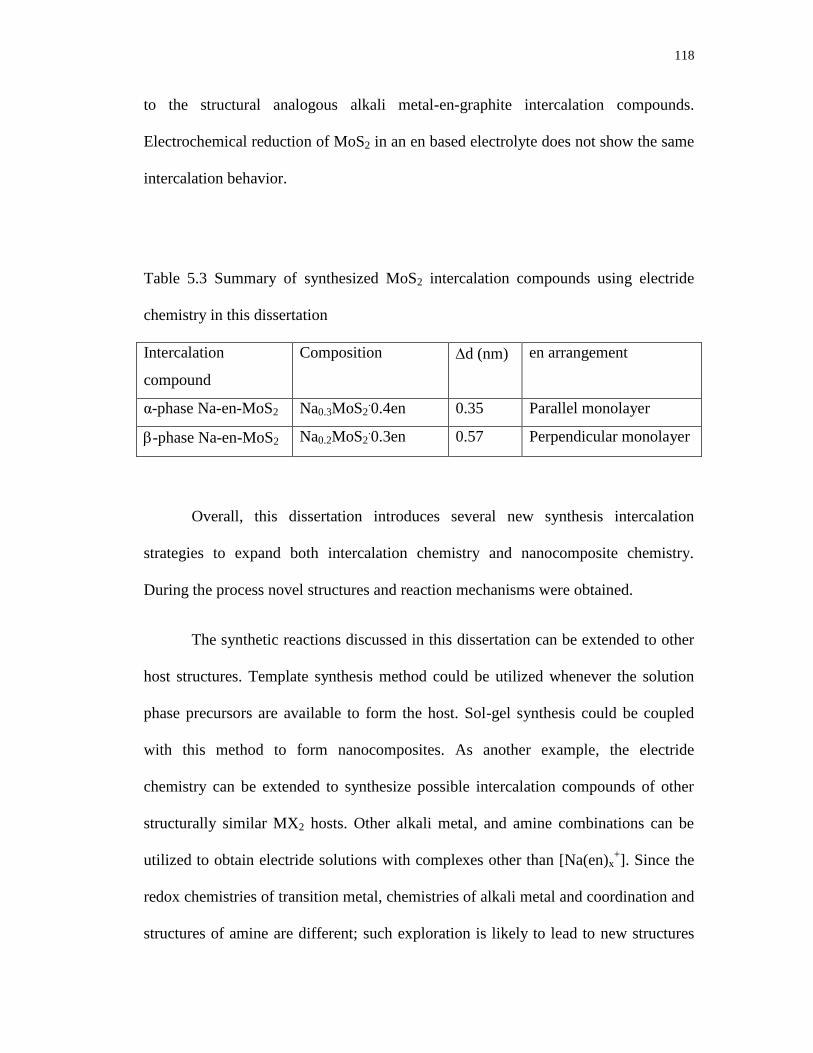
118
to the structural analogous alkali metal-en-graphite intercalation compounds.
Electrochemical reduction of MoS2 in an en based electrolyte does not show the same
intercalation behavior.
Table 5.3 Summary of synthesized MoS2 intercalation compounds using electride
chemistry in this dissertation
Intercalation
compound
Composition d (nm) en arrangement
α-phase Na-en-MoS2 Na0.3MoS2.0.4en 0.35 Parallel monolayer
-phase Na-en-MoS2 Na0.2MoS2.0.3en 0.57 Perpendicular monolayer
Overall, this dissertation introduces several new synthesis intercalation
strategies to expand both intercalation chemistry and nanocomposite chemistry.
During the process novel structures and reaction mechanisms were obtained.
The synthetic reactions discussed in this dissertation can be extended to other
host structures. Template synthesis method could be utilized whenever the solution
phase precursors are available to form the host. Sol-gel synthesis could be coupled
with this method to form nanocomposites. As another example, the electride
chemistry can be extended to synthesize possible intercalation compounds of other
structurally similar MX2 hosts. Other alkali metal, and amine combinations can be
utilized to obtain electride solutions with complexes other than [Na(en)x+]. Since the
redox chemistries of transition metal, chemistries of alkali metal and coordination and
structures of amine are different; such exploration is likely to lead to new structures
119
and compositions, along with different materials properties. The application of
electride chemistry in NiPS3 is another possibility. Since electride solution can apply
a greater reduction potential, this may allow new intercalation or nanocomposite
chemistry.
Intercalation compounds may also act as precursors in the synthesis of other
intercalation compounds and nanocomposites. For an example Na-en-MoS2 could
reacted with surfactants to obtain larger galleries, ultimately forming stable exfoliated
nanosheets of MoS2-
, or can react with polymers or dendrimers to form Na-polymer-
MoS2 nanocomposites.
Previously there were reports on stabilization and/or higher capacity effected
by PEO incorporation into LixMoS2. Since Na-ion batteries are of interest currently,
new path to obtain analogous nanocomposites are of interest. Since dendrimers have
the capability to encapsulate other molecules, those are a very important topic in drug
delivery. Future attempts can be directed to form nanocomposites with a dendrimer
encapsulated compound. Nanocomposites containing dendrimers could act as a
reservoir for the slow release of encapsulating drug or molecules.
120
BIBLIOGRAPHY
Alexandre, M.; Dubois, P., Mater. Sci. Eng. R 2000, 28 (1-2), 1-63.
Alongi, J.; Monticelli, O.; Russo, S.; Camino, G., J. Nanostruct. Polym. Nanocompos.
2006, 2 (4), 127-133.
Amin, A.; Taha, A. S.; El-Ghaffar, M. A. A., J. Appl. Polym. Sci. 2010, 118 (1), 525-
537.
Anthony, J. W.; Bideaux, R. A.; Bladh, K. W.; Nichols, M. C., Handbook of
Mineralogy. Mineralogical Society of America: Chantilly, VA, 1990.
Bai, J. F.; Zuo, J. L.; Tan, W. L.; Ji, W.; Shen, Z.; Fun, H. K.; Chinnakali, K.; Razak,
I. A.; You, X. Z.; Che, C. M., J. Mater. Chem. 1999, 9, 2419.
Bang, G. S.; Nam, K. W.; Kim, J. Y.; Shin, J.; Choi, J. W.; Choi, S.-Y., ACS Appl.
Mater. Interfaces, 2014, 6, 7084.
Benard, S.; Leaustic, A.; Riviere, E.; Yu, P.; Clement, R., Chem. Mater. 2001, 13
(10), 3709-3716.
Benavente, E.; Santa Ana, M. A.; Mendizabal, F.; Gonzalez, G., Coord. Chem. Rev.
2002, 224 (1-2), 87-109.
Bernard, L.; McKelvy, M.; Glaunsinger, W.; Colombet, P., Solid State Ionics, 1985,
15, 301.
Betley, T. A.; Holl, M. M. B.; Orr, B. G.; Swanson, D. R.; Tomalia, D. A.; Baker, J.
R., Langmuir 2001, 17 (9), 2768-2773.
Birtill, J. J.; Dickens, P. G., Mater. Res. Bull. 1978, 13 (4), 311-316.
Boller, H.; Blaha, H., J. Solid State Chem. 1982, 45 (1), 119-126.
Bonczek, J. L.; Harris, W. G.; Nkedi-Kizza, P., Clays Clay Miner. 2002, 50 (1), 11-
17.
Bosman, A. W.; Janssen, H. M.; Meijer, E. W., Chem. Rev. 1999, 99 (7), 1665-1688.
Brec, R., Solid State Ionics 1986, 22 (1), 3-30.
Brothers, H. M.; Piehler, L. T.; Tomalia, D. A., J. Chromatogr. A 1998, 814 (1-2),
233-246.
121
Brown, L. A.; Glaunsinger, W. S.; McKelvy, M. J., J. Solid State Chem., 2000, 155,
326.
Cakara, D.; Kleimann, J.; Borkovec, M., Macromolecules 2003, 36 (11), 4201-4207.
Campanella, L.; Pistoia, G., J. Electrochem. Soc. 1971, 118, 1905-1908.
Carrado, K. A.; Thiyagarajan, P.; Elder, D. L., Clays Clay Miner. 1996, 44 (4), 506-
514.
Castagnola, M.; Zuppi, C.; Rossetti, D. V.; Vincenzoni, F.; Lupi, A.; Vitali, A.;
Meucci, E.; Messana, I., Electrophoresis 2002, 23 (12), 1769-1778.
Chen, F.; Xiong, H.; Yang, J. T.; Cai, W. W.; Zhong, M. Q., e-Polym. 2012, No. 016.
Chen, X.; Li, Z.; Zhou, H.; Wang, T.; Qin, J.; Inokuchi, M., Polymer 2007, 48 (11),
3256-3261.
Cheng, Y. Y.; Xu, Z. H.; Ma, M. L.; Xu, T. W., J. Pharm. Sci. 2008, 97 (1), 123-143.
Clement, R.; Girerd, J. J.; Morgensternbadarau, I., Inorg. Chem. 1980, 19 (9), 2852-
2854.
Coradin, T.; Clement, R.; Lacroix, P. G.; Nakatani, K., Chem. Mater. 1996, 8 (8),
2153-2158.
Costa, A. S.; Imae, T.; Takagi, K.; Kikuta, K., Prog. Colloid Polym. Sci. 2004, 128,
113-119.
David, L.; Bhandavat, R.; Singh, G., ACS Nano, 2014, 8, 1759.
Delgado, A.; Gonzalezcaballero, F.; Bruque, J. M., J. Colloid Interface Sci. 1986, 113
(1), 203-211.
Dye, J. L., Science, 2003, 301, 607.
Ebber, A.; Vaher, M.; Peterson, J.; Lopp, M., J. Chromatogr. A 2002, 949 (1-2), 351-
358.
El-Sayed, M.; Kiani, M. F.; Naimark, M. D.; Hikal, A. H.; Ghandehari, H., Pharm.
Res. 2001, 18 (1), 23-28.
Esfand, R.; Tomalia, D. A., Laboratory Synthesis of Poly(amidoamine)(PAMAM)
Dendrimers. in: Frechet, J. M. J.; Tomalia, D. A., eds. Dendrimers and Other
Dendritic Polymers. John Wiley & Sons, Ltd.: Chichester, UK. 2002, pp. 587-604.
122
Figueroa, E.; Brill, J. W.; Selegue, J. P., J. Phys. Chem. Solids 1996, 57 (6-8), 1123-
1127.
Foot, P. J. S.; Nevett, B. A., Chem. Comm. 1987, (5), 380-381.
Fragnaud, P.; Prouzet, E.; Brec, R., J. Mater. Res. 1992, 7 (7), 1839-1846.
Gamble, F. R.; Osiecki, J. H.; Cais, M.; Pisharod.R, Science 1971, 174 (4008), 493-
497.
Giannelis, E. P., Adv. Mater. 1996, 8 (1), 29-35.
Gilman, J. W., Appl. Clay Sci. 1999, 15 (1-2), 31-49.
Giorgini, M. G.; Pelletti, M. R.; Paliani, G.; Cataliotti, R. S., J. Raman Spectrosc.,
1983, 14, 16.
Glemser, O.; Lutz, G., Z. Anorg. Allg. Chem. 1951, 264, 17.
Glemser, O.; Lutz, G., Z. Anorg. Allg. Chem. 1952, 269, 93.
Glemser, O.; Lutz, G.; Meyer, G., Z. Anorg. Allg. Chem. 1956, 285, 173.
Gonzalez, G.; Santa Ana, M. A.; Benavente, E., Electrochim. Acta, 1998, 43, 1327.
Grabchev, I.; Petkov, C.; Bojinov, V., Dyes Pigm. 2004, 62 (3), 229-234.
He, S.; Lin, J., Appl. Mech. Mater. 2012, 108, 91-94.
Hierlemann, A.; Campbell, J. K.; Baker, L. A.; Crooks, R. M.; Ricco, A. J., J. Am.
Chem. Soc. 1998, 120 (21), 5323-5324.
Hoffman, L. W.; Andersson, G. G.; Sharma, A.; Clarke, S. R.; Voelcker, N. H.,
Langmuir 2011, 27, 6759-6767.
Hu, Y.S.; Chen, W.; Xu, Q.; Yuan, R.Z., J. Mater. Sci. Technol. 2001, 17, S124-
S126.
Huang, J. C.; Zhu, Z. K.; Yin, J.; Qian, X. F.; Sun, Y. Y., Polymer 2001, 42 (3), 873-
877.
Jacobson, A. J.; Nazar, L. F., Intercalation Chemistry. in Encyclopedia of Inorganic
and Bioinorganic Chemistry, John Wiley & Sons, 2011.
Jeevanandam, P.; Vasudevan, S., Chem. Mater. 1998, 10 (5), 1276-1285.
123
Ji, Y.; Zuo, J. L.; Chen, L. X.; Tian, Y. Q.; Song, Y. L.; Li, Y. Z.; You, X. Z., J. Phys.
Chem. Solids 2005, 66 (1), 207-212.
Juang, T.-Y.; Chen, Y.-C.; Tsai, C.-C.; Dai, S. A.; Wu, T.-M.; Jeng, R.-J., Appl. Clay
Sci. 2010, 48 (1-2), 103-110.
Kanatzidis, M. G.; Bissessur, R.; Degroot, D. C.; Schindler, J. L.; Kannewurf, C. R.,
Chem. Mater. 1993, 5 (5), 595-596.
Kerr, T.A.; Wu, H.; Nazar, L.F., Chem. Mater. 1996, 8 (8), 2005-2015.
Kim, Y.; Klutz, A. M.; Jacobson, K. A., Bioconjugate Chem. 2008, 19 (8), 1660-
1672.
Kuzminskii, Y. V.; Voronin, B. M.; Petrushina, I. M.; Redin, N. N.; Prikhodko, G. P.,
J. Power Sources 1995, 55 (1), 1-6.
Lagadic, I.; Lacroix, P. G.; Clement, R., Chem. Mater. 1997, 9 (9), 2004-2012.
Lagadic, I.; Leaustic, A.; Clement, R., Chem. Comm. 1992, (19), 1396-1397.
LeBaron, P. C.; Wang, Z.; Pinnavaia, T. J., Appl. Clay Sci. 1999, 15 (1-2), 11-29.
Lee, D.; Char, K.; Lee, S. W.; Park, Y. W., J. Mater. Chem. 2003, 13 (12), 2942-
2947.
Lemehaute, A., C. R. Acad. Sci. 1978, 287 (8), 309-311.
Lemmon, J. P.; Wu, J. H.; Oriakhi, C.; Lerner, M. M., Electrochim. Acta 1995, 40
(13-14), 2245-2249.
Lerf, A., Intercalation compounds in layered host lattices: supramolecular chemistry
in nanodimensions. in: Nalwa, H. S., ed. Handbook of nanostructured materials and
nanotechnology, Academic Press: San Diego, 2000; Vol. 5, Ch. 1, pp 1-166.
Lerf, A., Dalton Trans. 2014, 43 (27), 10276-10291.
Lerf, A., Schollhorn, R., Inorg. Chem., 1977, 16, 2950.
Lerner, M. M.; Oriakhi, C. O., Polymers in ordered nanocomposites. in: Goldstein, A.
N., Ed. Handbook of nanophase materials, Marcel Dekker: New York, N.Y, 1997, pp
199-219.
Lévy, F. A., Intercalated layered materials. D. Reidel Publishing: Dordrecht,
Holland, 1979.
124
Li, J.; Piehler, L. T.; Qin, D.; Baker, J. R.; Tomalia, D. A.; Meier, D. J., Langmuir
2000, 16 (13), 5613-5616.
Liyanage, A. U.; Ikhuoria, E. U.; Adenuga, A. A.; Remcho, V. T.; Lerner, M. M.,
Inorg. Chem. 2013, 52, 4603.
Liyanage, A. U.; Lerner, M. M., RSC Adv. 2012, 2 (2), 474-479.
Liu, L. M.; Qi, Z. N.; Zhu, X. G., J. Appl. Polym. Sci. 1999, 71 (7), 1133-1138.
Loboue, H.; Guillot-Deudon, C.; Popa, A. F.; Lafond, A.; Rebours, B.; Pichon, C.;
Cseri, T.; Berhault, G.; Geantet, C., Catal. Today 2008, 130 (1), 63-68.
Loeb, A. L.; Overbeek, J. T. G.; Wiersema, P. H., The electrical double layer around
a spherical colloid particle. MIT Press: Cambridge, MA, 1961.
Lukowski, M. A.; Daniel, A. S.; Meng, F.; Forticaux, A.; Li, L. S.; Jin, S., J. Am.
Chem. Soc., 2013, 135, 10274.
Maluangnont, T.; Bui, G. T.; Huntington, B. A.; Lerner, M. M., Chem. Mater. 2011,
23 (5), 1091-1095.
Maluangnont, T.; Gotoh, K.; Fujiwara, K.; Lerner, M. M., Carbon 2011, 49 (3),
1040-1042.
Maluangnont, T.; Lerner, M. M.; Gotoh, K., Inorg. Chem. 2011, 50 (22), 11676-
11682.
Maluangnont, T.; Sirisaksoontorn, W.; Lerner, M. M., Carbon 2012, 50 (2), 597-602.
Manias, E.; Polizos, G.; Nakajima, H.; Heidecker, M. J., in: Morgan, A. B.; Wilkie,
C. A., eds., Flame retardent polymer nanocomposites, John Wiley & Sons, Inc.:
Hoboken, New Jersey, NJ, 2007, pp. 31-66.
Manova, E.; Severac, C.; Andreev, A.; Clement, R., J. Catal. 1997, 169 (2), 503-509.
Manriquez, V.; Barahona, P.; Ruiz, D.; Avila, R. E., Mater. Res. Bull. 2005, 40 (3),
475-483.
Matsumoto, O.; Yamada, E.; Kanzaki, Y.; Konuma, M., J. Phys. Chem. Solids 1978,
39 (2), 191-192.
Mercier, R.; Malugani, J. P.; Fahys, B.; Douglade, J.; Robert, G., J. Solid State Chem.
1982, 43 (2), 151-162.
Messersmith, P. B.; Giannelis, E. P., Chem. Mater. 1993, 5 (8), 1064-1066.
125
Murugan, A.V.; Viswanath, A.K.; Gopinath, C.S.; Vijayamohanan, K., J. Appl. Phys.
2006, 100 (7), 074319-1–074319-5.
Nanjwade, B. K.; Bechra, H. M.; Derkar, G. K.; Manvi, F. V.; Nanjwade, V. K., Eur.
J. Pharm. Sci. 2009, 38 (3), 185-196.
Nazar, L.F.; Wu, H.; Power, W.P., J. Mater. Chem. 1995, 5 (11), 1985-93.
Ogata, H.; Fujimori, H.; Miyajima, S.; Kobashi, K.; Chiba, T.; Taylor, R. E.; Endo,
K., J. Phys. Chem. Solids 1997, 58 (5), 701-710.
Oriakhi, C. O.; Farr, I. V.; Lerner, M. M., J. Mater. Chem. 1996, 6 (1), 103-107.
Oriakhi, C. O.; Nafshun, R. L.; Lerner, M. M., Mater. Res. Bull. 1996, 31 (12), 1513-
1520.
Oriakhi, C. O.; Zhang, X. R.; Lerner, M. M., Appl. Clay Sci. 1999, 15 (1-2), 109-118.
Ouvrard, G.; Brec, R.; Rouxel, J., Mater. Res. Bull. 1985, 20 (10), 1181-1189.
Park, J.; Kim, J.-S.; Park, J.-W.; Nam, T.-H.; Kim, K.-W.; Ahn, J.-H.; Wang, G.;
Ahn, H.-J., Electrochim. Acta, 2013, 92, 427.
Pavlidou, S.; Papaspyrides, C. D., Prog. Polym. Sci. 2008, 33 (12), 1119-1198.
Pereiraramos, J. P.; Kumagai, N., J. Power Sources 1995, 56 (1), 87-90.
Posudievsky, O.Y.; Biskulova, S.A.; Pokhodenko, V.D., J. Mater. Chem. 2002, 12
(5), 1446-1449.
Prouzet, E.; Ouvrard, G.; Brec, R.; Seguineau, P., Solid State Ionics 1988, 31 (1), 79-
90.
Punyacharoennon, P.; Charuchinda, S.; Srikulkit, K., J. Appl. Polym. Sci. 2008, 110
(6), 3336-3347.
Rajesh, R.; Venkatesan, R., J. Mol. Catal. A: Chem. 2012, 359, 88-96.
Rao, C. N. R.; Nag, A., Eur. J. Inorg. Chem., 2010, 4244.
Ratanarat, K.; Nithitanakul, M.; Martin, D. C.; Magaraphan , R., Rev. Adv. Mater.
Sci. 2003, 5 (3), 187-192.
Ray, S. S.; Okamoto, M., Prog. Polym. Sci. 2003, 28 (11), 1539-1641.
Rehim, M. H. A.; Youssef, A. M.; Essawy, H. A., Mater. Chem. Phys. 2010, 119 (3),
546-552.
126
Rodlert, M.; Plummer, C. J. G.; Garamszegi, L.; Leterrier, Y.; Grunbauer, H. J. M.;
Manson, J. A. E., Polymer 2004, 45 (3), 949-960.
Rüdorff, W., Chimia 1965, 19.
Rüdorff, W.; Sick, H. H., Angew. Chem. 1959, 71, 127.
Sadek, O. M.; Mekhemer, W. K., Thermochim. Acta 2001, 370 (1-2), 57-63.
Sadekar, S.; Ghandehari, H., Adv. Drug Deliv. Rev. 2012, 64, 571-588.
Sanchez, V.; Benavente, E.; Santa Ana, M. A.; Gonzalez, G., Chem. Mater. 1999, 11
(9), 2296-2298.
Santa Ana, M. A.; Sanchez, V.; Gonzalez, G., Electrochim. Acta 1995, 40 (11), 1773-
1775.
Schöllhorn, R.; Kuhlmann, R.; Besenhard, J. O., Mater. Res. Bull. 1976, 11 (1), 83-
90.
Schöllhorn, R.; Weiss, A., J. Less-Common Met. 1974, 36 (1-2), 229-236.
Schöllhorn, R.; Zagefka, H. D., Angew. Chem. Int. Ed. 1977, 16 (3), 199-200.
Sekine, T.; Julien, C.; Samaras, I.; Jouanne, M.; Balkanski, M., Mater. Sci. Eng., B
1989, 3, 153.
Shannon, R. D., Acta Crystallogr., Sect. A: Cryst. Phys., Diffr., Theor. Gen.
Crystallogr., 1976, 32, 751.
Shi, X. Y.; Banyai, I.; Lesniak, W. G.; Islam, M. T.; Orszagh, I.; Balogh, P.; Baker, J.
R.; Balogh, L. P., Electrophoresis 2005, 26 (15), 2949-2959.
Singh, P.; Moll, F.; Lin, S. H.; Ferzli, C.; Yu, K. S.; Koski, R. K.; Saul, R. G.; Cronin,
P., Clin. Chem. 1994, 40 (9), 1845-1849.
Somoano, R. B.; Hadek, V.; Rembaum, A., J. Chem. Phys. 1973, 58 (2), 697-701.
Somoano, R. B.; Hadek, V.; Rembaum, A.; Samson, S.; Woollam, J. A., J. Chem.
Phys. 1975, 62 (3), 1068-1073.
Stepanov, A. A.; Lenenko, N. D.; Golub, A. S.; Pervov, V. S., Russ. J. Electrochem.,
2013, 49, 86.
Sukpirom, N.; Oriakhi, C. O.; Lerner, M. M., Mater. Res. Bull. 2000, 35 (3), 325-331.
127
Takada, K.; Diaz, D. J.; Abruna, H. D.; Cuadrado, I.; Casado, C.; Alonso, B.; Moran,
M.; Losada, J., J. Am. Chem. Soc. 1997, 119 (44), 10763-10773.
Tan, N. C. B.; Balogh, L.; Trevino, S. F.; Tomalia, D. A.; Lin, J. S., Polymer 1999, 40
(10), 2537-2545.
Tang, M. X.; Redemann, C. T.; Szoka, F. C., Bioconjugate Chem. 1996, 7 (6), 703-
714.
Thomas, D. M.; McCarron, E. M., Mater. Res. Bull.. 1986, 21 (8), 945-960.
Tomalia, D. A., Prog. Polym. Sci. 2005, 30 (3-4), 294-324.
Tomalia, D. A.; Naylor, A. M.; Goddard, W. A., Angew. Chem. Int. Ed. Engl. 1990,
29 (2), 138-175.
Vaia, R. A.; Giannelis, E. P., Macromolecules 1997, 30 (25), 8000-8009.
Wang, L.; Schindler, J.; Kannewurf, C.R.; Kanatzidis, M.G., J. Mater. Chem. 1997, 7
(7), 1277-83.
Wein, E.; Mullerwarmuth, W.; Schollhorn, R., Solid State Ionics, 1987, 22, 231.
Whittingham, M. S., J. Electroanal. Chem. 1981, 118, 229-239.
Whittingham, M. S., Mater. Res. Bull. 1974, 9 (12), 1681-1690.
Whittingham, M. S.; Gamble, F. R., Mater. Res. Bull., 1975, 10, 363.
Whittingham, M. S.; Jacobson, A. J., Intercalation Chemistry. Academic Press: New
York, NY., 1982.
Wiersema, P. H.; Loeb, A. L.; Overbeek, J. T., J. Colloid Interface Sci. 1966, 22 (1),
79-99.
Wilson, S. T.; Lok, B. M.; Messina, C. A.; Cannan, T. R.; Flanigen, E. M., J. Am.
Chem. Soc. 1982, 104 (4), 1146-1147.
Wu, J. H.; Lerner, M. M., Chem. Mater. 1993, 5 (6), 835-838.
Xiao, J.; Choi, D.; Cosimbescu, L.; Koech, P.; Liu, J.; Lemmon, J. P., Chem. Mater.
2010, 22 (16), 4522-4524.
Xiao, J.; Wang, X. J.; Yang, X. Q.; Xun, S. D.; Liu, G.; Koech, P. K.; Liu, J.;
Lemmon, J. P., Adv. Funct. Mater., 2011, 21, 2840.
128
Xie, W.; Gao, Z. M.; Pan, W. P.; Hunter, D.; Singh, A.; Vaia, R., Chem. Mater. 2001,
13 (9), 2979-2990.
Yamanaka, S.; Kobayashi, H.; Tanaka, M., Chem. Lett. 1976, (4), 329-332.
Yang, D.; Frindt, R. F., J. Mater. Res. 2000, 15 (11), 2408-2413.
Zhao, M. Q.; Crooks, R. M., Adv. Mater. 1999, 11 (3), 217-220.
Zhao, Y. H.; Abraham, M. H.; Zissimos, A. M., J. Org. Chem. 2003, 68 (19), 7368-
7373.
Zheng, J.; Zhang, H.; Dong, S. H.; Liu, Y. P.; Nai, C. T.; Shin, H. S.; Jeong, H. Y.;
Liu, B.; Loh, K. P., Nat. Commun., 2014, 5, 2995.
129
APPENDIX A
PREPARATION AND CHARACTERIZATION OF
NANOCOMPOSITES OF POLYAMIDOAMINE (PAMAM)
DENDRIMERS WITH MOLYBDENUM(VI) OXIDE (MoO3)
Esther U. Ikhuoria,a Amila U. Liyanage, and Michael M. Lerner
Department of Chemistry
Oregon State University
Corvallis, OR 97331-4003, USA
a Fulbright visiting scholar, Oregon State University, 2011/2012.
Department of Chemistry, University of Benin, Benin City, Nigeria.
Mat. Chem. Phys., 2013, 139 (2-3), 911-916.

130
A.1 ABSTRACT
The preparation and characterization of polymer nanocomposites is an
important research area because of the significant changes in materials properties
relative to the component phases or to conventional microscale or macroscale
composites. Polyamidoamine (PAMAM)/molybdenum(VI) oxide (MoO3)
nanocomposites were synthesized using an exfoliation/adsorption method and
characterized by powder X-ray diffraction, thermogravimetric analyses, scanning
electron microscopy and infrared spectroscopy. Generation 0 (G0) and generation 2
(G2) PAMAM forms nanocomposites with MoO3 with either intercalate monolayers
or bilayers, with resulting gallery expansions (d) of ~ 0.5 and ~ 0.7-0.8 nm,
respectively. G0 only forms monolayers whereas G2 forms mono and bilayers. The
spherical PAMAM conformation in aqueous medium changes dramatically to a
highly-flattened conformation within the intercalate galleries. Reaction temperature
also affects the structure of the obtained G2 PAMAM nanocomposites. Bilayer
nanocomposites obtained at 40 and 120 °C show d = 1.4 nm and 0.7 nm,
respectively. Mixed phases were obtained at 60 °C. The obtained nanocomposite
compositions and structures are compared with previously-reported polymer/MoO3
nanocomposites.
131
A.2 INTRODUCTION
Nanocomposites are materials derived from two or more phases where at least
one dimension of the combination is in the nanometer scale. Polymer nanocomposites
are a new class of advanced polymer composites that often display enhanced physical
properties such as strength, hardness, thermal and viscoelasticity. Nanocomposite
properties depend not only on those of their parent phases, but also on the structural
complexity, morphology and interfacial interactions of these constituents. With an
eye towards new and improved devices, nanocomposites often display dramatically
improved performance relative to those currently available.1 For example, a
material’s stiffness can be improved without sacrificing mechanical toughness, or its
barrier properties enhanced without sacrifice of desirable properties such as
transparency, flame retardancy and biodegradability.2 The ability to avoid the trade-
off in functional materials which is typical of conventional composites illustrates the
potential importance of nanocomposites.
Two dimensional (2D) layered structures have been investigated intensively
as host lattices for preparing nanocomposites. These host lattices may exfoliate into a
polymer matrix or incorporate polymer guests within well-defined interlayer
galleries.3 Many two dimensional compounds which involve intercalation of
molecules or ions between inorganic layered sheets have been reported.4,5
Again, the
preparation and detailed characterization of polymer nanocomposites is an active area
of research because of the possibility of a remarkable improvement in materials
properties when compared with purely organic or inorganic phases or conventional
micro and macro composites.
132
Dendrimers are synthetic, mono-disperse macromolecules with a regular and
highly-branched three-dimensional architecture.6 In contrast to traditional polymers,
dendrimers have core-shell structures consisting of three basic architectural
components: a core, interior shells (generations) with repeating branch-cell units, and
terminal functional groups.7 They are produced by an interactive sequence of reaction
steps, in which each added step leads to a higher-generation material.6 This approach
provides unprecedented control over composition and architecture, as well as the
ability to add numerous different terminal groups that affect their surface chemistry.8
Polyamidoamine (PAMAM) dendrimers are one of the most well investigated
families and have been evaluated for diverse applications ranging from drug delivery
to molecular encapsulation and gene therapy, as well as for building blocks for
nanostructures.9-12
Molybdenum trioxide (MoO3) is an example of 2D layered structure that has
been examined as a potentially useful electrode because of it rich redox
chemistry.13,14
It exhibits a unique layered structure in which Mo atom is surrounded
by distorted octahedron of oxygen atoms with two layers of corner-sharing MoO6
units.15
As an electrode material for rechargeable battery application, MoO3 is limited
by slow kinetics for Li-ion transport, an electronically-insulating state upon full
oxidation, and poor cycling behavior when compared to other metal
oxides/chalcogenides.15
One approach to modify the properties of the layered MoO3
has been intercalation of electronically-conducting guests.4 Previous studies have also
reported on the intercalation of polyethylene oxide (PEO),16,17
linear
polyethylenimine (LPEI),18
polyaniline (PANI),19
polyvinylpyrrolidone (PVP) and
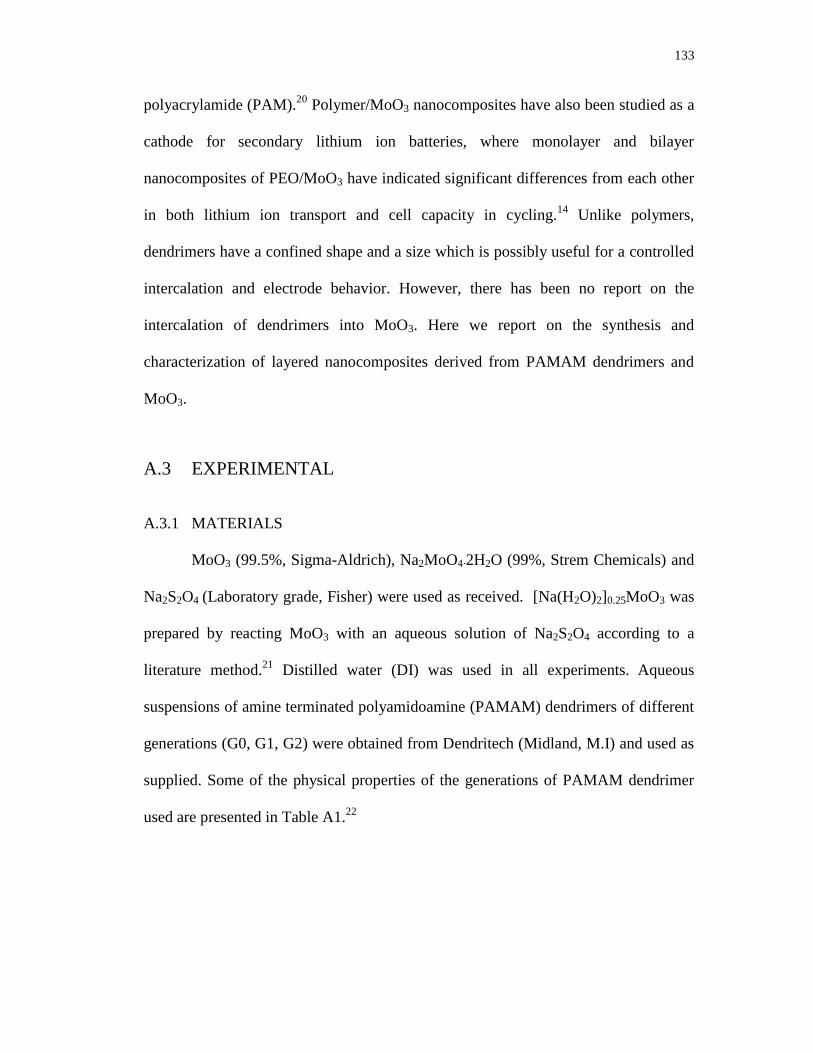
133
polyacrylamide (PAM).20
Polymer/MoO3 nanocomposites have also been studied as a
cathode for secondary lithium ion batteries, where monolayer and bilayer
nanocomposites of PEO/MoO3 have indicated significant differences from each other
in both lithium ion transport and cell capacity in cycling.14
Unlike polymers,
dendrimers have a confined shape and a size which is possibly useful for a controlled
intercalation and electrode behavior. However, there has been no report on the
intercalation of dendrimers into MoO3. Here we report on the synthesis and
characterization of layered nanocomposites derived from PAMAM dendrimers and
MoO3.
A.3 EXPERIMENTAL
A.3.1 MATERIALS
MoO3 (99.5%, Sigma-Aldrich), Na2MoO4∙2H2O (99%, Strem Chemicals) and
Na2S2O4 (Laboratory grade, Fisher) were used as received. [Na(H2O)2]0.25MoO3 was
prepared by reacting MoO3 with an aqueous solution of Na2S2O4 according to a
literature method.21
Distilled water (DI) was used in all experiments. Aqueous
suspensions of amine terminated polyamidoamine (PAMAM) dendrimers of different
generations (G0, G1, G2) were obtained from Dendritech (Midland, M.I) and used as
supplied. Some of the physical properties of the generations of PAMAM dendrimer
used are presented in Table A1.22
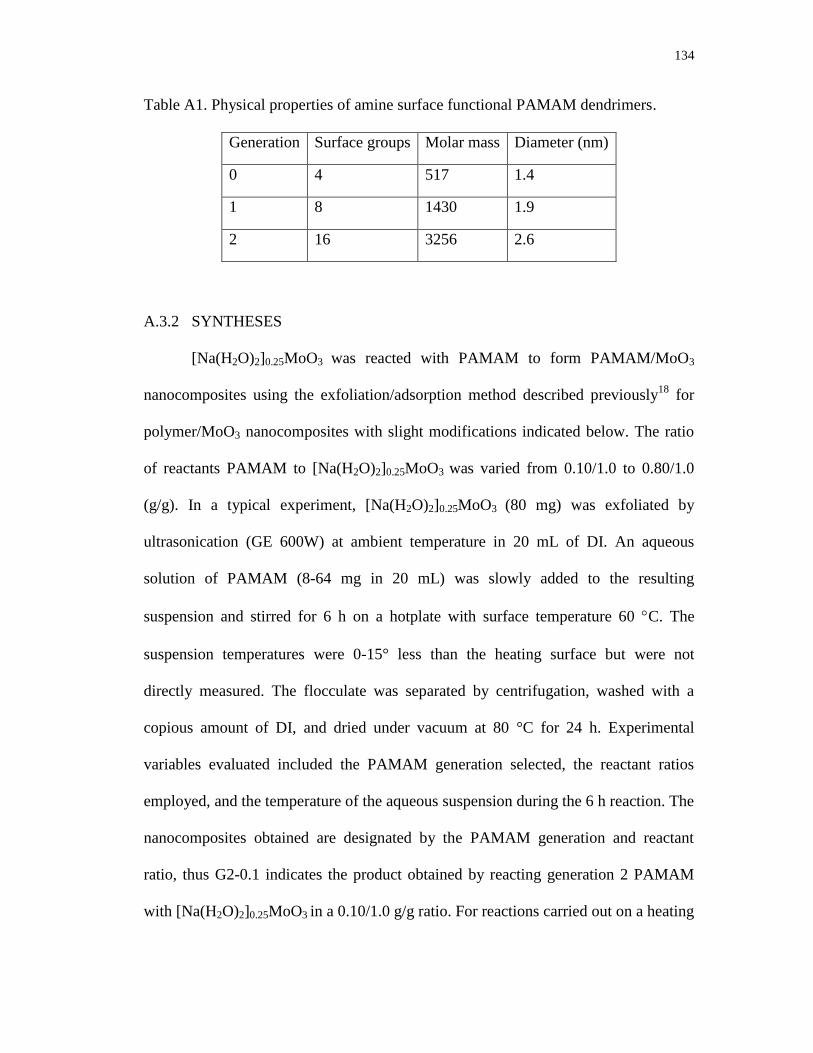
134
Table A1. Physical properties of amine surface functional PAMAM dendrimers.
Generation Surface groups Molar mass Diameter (nm)
0 4 517 1.4
1 8 1430 1.9
2 16 3256 2.6
A.3.2 SYNTHESES
[Na(H2O)2]0.25MoO3 was reacted with PAMAM to form PAMAM/MoO3
nanocomposites using the exfoliation/adsorption method described previously18
for
polymer/MoO3 nanocomposites with slight modifications indicated below. The ratio
of reactants PAMAM to [Na(H2O)2]0.25MoO3 was varied from 0.10/1.0 to 0.80/1.0
(g/g). In a typical experiment, [Na(H2O)2]0.25MoO3 (80 mg) was exfoliated by
ultrasonication (GE 600W) at ambient temperature in 20 mL of DI. An aqueous
solution of PAMAM (8-64 mg in 20 mL) was slowly added to the resulting
suspension and stirred for 6 h on a hotplate with surface temperature 60 C. The
suspension temperatures were 0-15° less than the heating surface but were not
directly measured. The flocculate was separated by centrifugation, washed with a
copious amount of DI, and dried under vacuum at 80 °C for 24 h. Experimental
variables evaluated included the PAMAM generation selected, the reactant ratios
employed, and the temperature of the aqueous suspension during the 6 h reaction. The
nanocomposites obtained are designated by the PAMAM generation and reactant
ratio, thus G2-0.1 indicates the product obtained by reacting generation 2 PAMAM
with [Na(H2O)2]0.25MoO3 in a 0.10/1.0 g/g ratio. For reactions carried out on a heating

135
surface other than at 60 °C, the heating surface temperature (in °C) is also indicated
in the label, for example G2-0.1-80.
A.3.3 CHARACTERIZATION
Products were characterized by powder X-ray diffraction (PXRD) using a
Rigaku Miniflex II X-Ray diffractometer with Ni-filtered Cu Kα radiation (λ =
0.15418 nm) at a scan rate of 1° min
-1 between 3° and 30° 2θ. Thermogravimetric
analyses were collected on a Shimadzu TGA-50 at 5 °C min-1
under flowing Ar.
Scanning electron micrographs (SEMs) were obtained using an FEI Quanta 600F
FEG instrument. IR spectra were recorded using a Nicolet iS10 FT-IR spectrometer
with Smart iTR ATR sampling accessory and Ge crystal from 4000-700 cm-1
.
A.4 RESULTS AND DISCUSSION
When PAMAM/MoO3 nanocomposites were synthesized at room
temperature, only multiple phase products were obtained. However, after reactions
on the 60 °C heating surface, PXRD single phase products could also be obtained.
Figure A1 shows the PXRD patterns of the nanocomposites prepared at 60 °C from
different reactant ratios of G0 or G2 PAMAM and [Na(H2O)2]0.25MoO3. The MoO3
sheet thickness is 0.69 nm, and the repeat distance (d) increases to 0.97 nm in
[Na(H2O)2]0.25MoO3, so that the interlayer expansion (Δd) is 0.28 nm. This expansion
is consistent with a Na+ plus water monolayer intercalate.
14,21 The repeat distance, d,
further increases to approximately 1.2 nm for all nanocomposites derived from G0
PAMAM and [Na(H2O)2]0.25MoO3. This interlayer expansion (Δd) of ~ 0.5 nm
relative to MoO3 is much less than the diameter of solution-phase G0 PAMAM
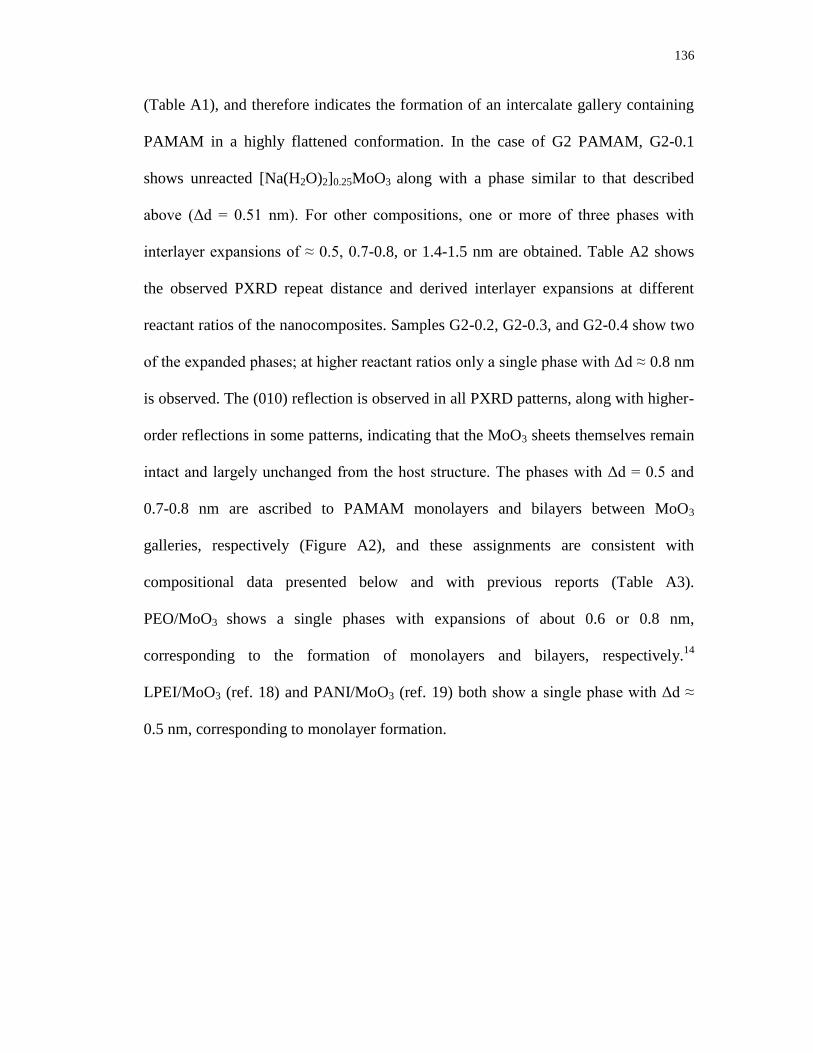
136
(Table A1), and therefore indicates the formation of an intercalate gallery containing
PAMAM in a highly flattened conformation. In the case of G2 PAMAM, G2-0.1
shows unreacted [Na(H2O)2]0.25MoO3 along with a phase similar to that described
above (Δd = 0.51 nm). For other compositions, one or more of three phases with
interlayer expansions of ≈ 0.5, 0.7-0.8, or 1.4-1.5 nm are obtained. Table A2 shows
the observed PXRD repeat distance and derived interlayer expansions at different
reactant ratios of the nanocomposites. Samples G2-0.2, G2-0.3, and G2-0.4 show two
of the expanded phases; at higher reactant ratios only a single phase with Δd ≈ 0.8 nm
is observed. The (010) reflection is observed in all PXRD patterns, along with higher-
order reflections in some patterns, indicating that the MoO3 sheets themselves remain
intact and largely unchanged from the host structure. The phases with Δd = 0.5 and
0.7-0.8 nm are ascribed to PAMAM monolayers and bilayers between MoO3
galleries, respectively (Figure A2), and these assignments are consistent with
compositional data presented below and with previous reports (Table A3).
PEO/MoO3 shows a single phases with expansions of about 0.6 or 0.8 nm,
corresponding to the formation of monolayers and bilayers, respectively.14
LPEI/MoO3 (ref. 18) and PANI/MoO3 (ref. 19) both show a single phase with Δd ≈
0.5 nm, corresponding to monolayer formation.

137
Table A2. PXRD repeat distances (d) and derived interlayer expansions (Δd) of
PAMAM/MoO3 nanocomposites at different reactant ratios.
Reactant ratio G0 G2
d (nm) Δd (nm) d (nm) Δd (nm)
0.1 1.20 0.51 0.96; 1.20 0.24; 0.51
0.2 1.21 0.52 1.41; 2.23 0.72; 1.54
0.3 1.20 0.51 1.34; 2.12 0.65; 1.43
0.4 1.20 0.51 1.41; 2.13 0.72; 1.44
0.5 1.20 0.51 1.48 0.79
0.6 1.19 0.50 1.46 0.77
0.7 1.20 0.51 1.47 0.78
0.8 1.18 0.49 1.51 0.82
Table A3. Comparison of PAMAM/MoO3 with other polymer/MoO3
nanocomposites.
Intercalate Organic mass % d
(nm) Type
Packing
fraction Reference
PEO 10
* 0.60 Monolayer 0.46
*
14 21
* 0.83 Bilayer 0.74
*
LPEI 16 0.47 Monolayer 0.96* 18
PANI 17* 0.54 Monolayer 0.71
* 19
G0 PAMAM 12-14 0.51 Monolayer 0.55-0.69 This
work G2 PAMAM 22-25 0.79 Bilayer 0.77-0.95
* Calculated from the compositional and structural data provided in the reference indicated.
138
Figure A1. PXRD patterns of [Na(H2O)2]0.25MoO3 and PAMAM/MoO3
nanocomposites with G0 (a) or G2 (b) PAMAM at different reactant ratios.
Figure A2. Proposed schematic structure of obtained nanocomposites. (a) G0/MoO3
monolayer and (b) G2/MoO3 bilayer.
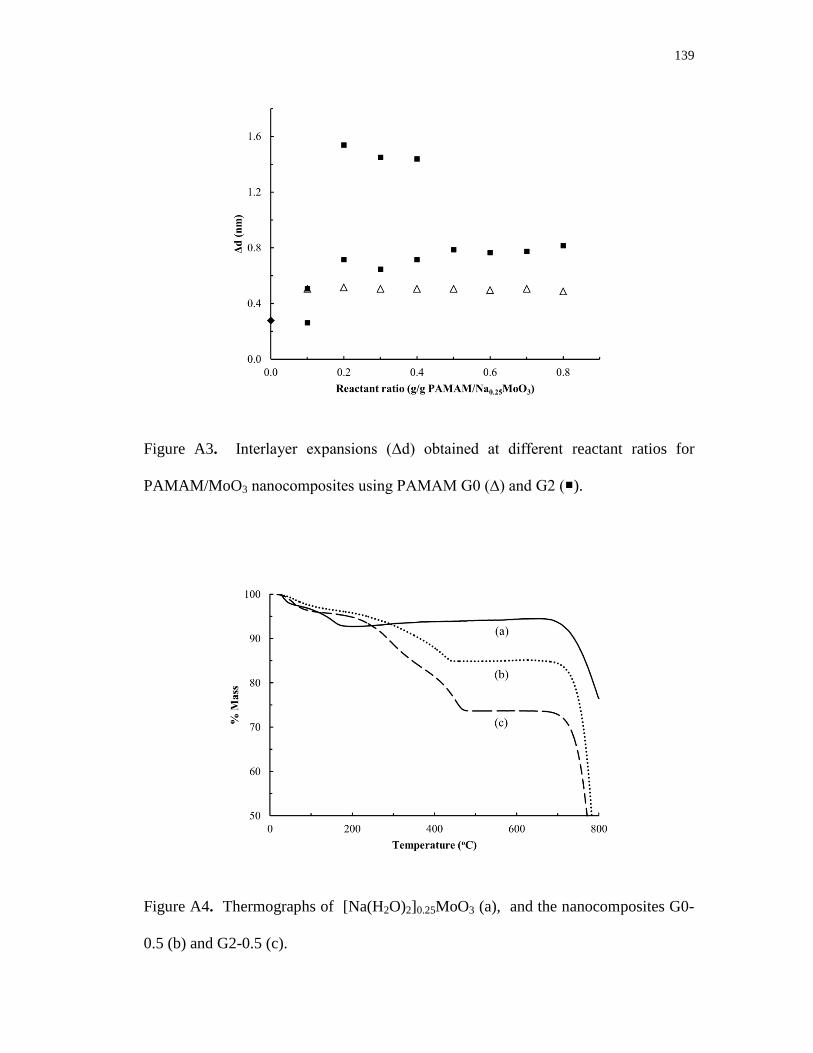
139
Figure A3. Interlayer expansions (Δd) obtained at different reactant ratios for
PAMAM/MoO3 nanocomposites using PAMAM G0 (∆) and G2 ().
Figure A4. Thermographs of [Na(H2O)2]0.25MoO3 (a), and the nanocomposites G0-
0.5 (b) and G2-0.5 (c).

140
Figure A4 shows the thermographs of [Na(H2O)2]0.25MoO3 and two
representative nanocomposites. [Na(H2O)2]0.25MoO3 shows a dehydration mass loss
of about 5% below 150 °C, and is then thermally stable up to about 700 °C. Both
nanocomposites also show a mass loss attributed to dehydration at low temperatures,
and a larger mass loss from 200 to 400 °C attributed to the decomposition and
volatilization of PAMAM. From these mass loss events, the compositions of
PAMAM, H2O, and Na0.25MoO3 in each material were obtained. These compositions
are reported in Table A4.
As can be seen in Figure A3 and Table A4, the nanocomposites where PXRD
data indicate a single bilayer phase, G2-0.5 to G2-0.8, contain 22-25 mass %
PAMAM. The G0 PAMAM nancomposites, which all show a single monolayer
phase, contain a PAMAM content of 12-14 mass %. This approximate 2:1 ratio of
PAMAM content for the two phases supports their assignments as bilayer and
monlayer intercalate structures as described above, and agrees with the organic
content observed previously for polymer/MoO3 nanocomposites (10-17% for
monolayer and 21% for bilayer structures) as shown in Table A3. Compositions G2-
0.2 to 0.4 are mixed phase products containing about 22-28 mass % PAMAM.
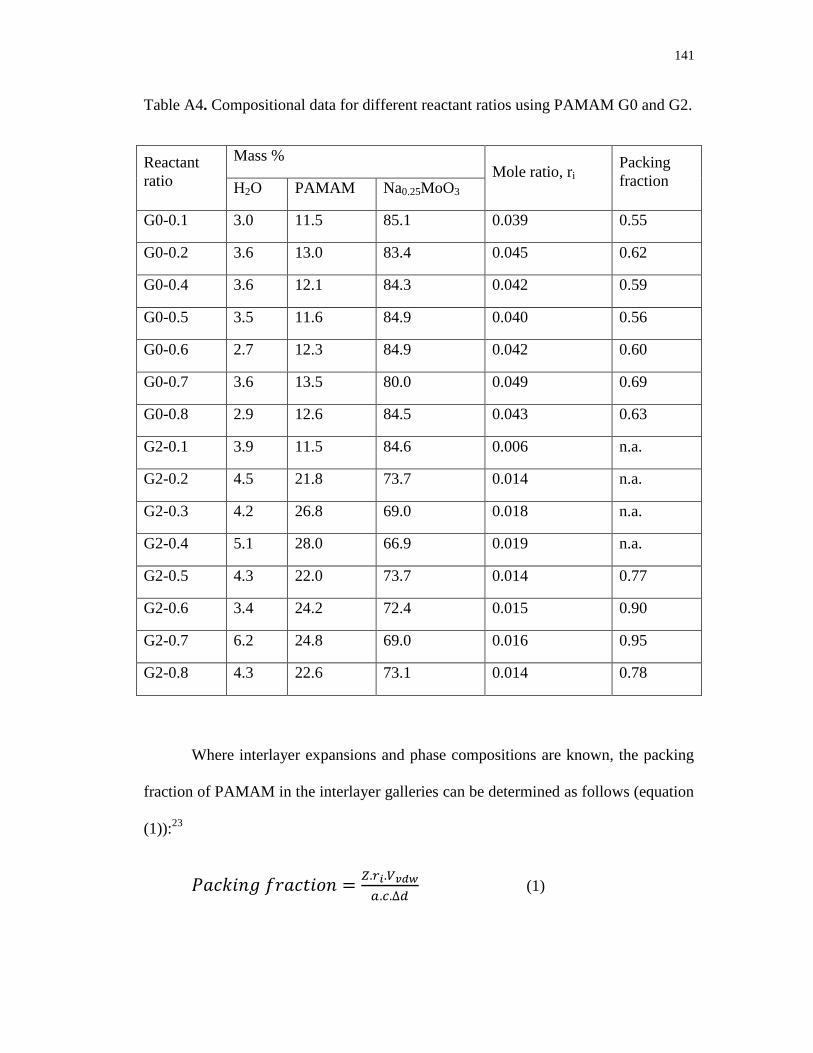
141
Table A4. Compositional data for different reactant ratios using PAMAM G0 and G2.
Reactant
ratio
Mass % Mole ratio, ri
Packing
fraction H2O PAMAM Na0.25MoO3
G0-0.1 3.0 11.5 85.1 0.039 0.55
G0-0.2 3.6 13.0 83.4 0.045 0.62
G0-0.4 3.6 12.1 84.3 0.042 0.59
G0-0.5 3.5 11.6 84.9 0.040 0.56
G0-0.6 2.7 12.3 84.9 0.042 0.60
G0-0.7 3.6 13.5 80.0 0.049 0.69
G0-0.8 2.9 12.6 84.5 0.043 0.63
G2-0.1 3.9 11.5 84.6 0.006 n.a.
G2-0.2 4.5 21.8 73.7 0.014 n.a.
G2-0.3 4.2 26.8 69.0 0.018 n.a.
G2-0.4 5.1 28.0 66.9 0.019 n.a.
G2-0.5 4.3 22.0 73.7 0.014 0.77
G2-0.6 3.4 24.2 72.4 0.015 0.90
G2-0.7 6.2 24.8 69.0 0.016 0.95
G2-0.8 4.3 22.6 73.1 0.014 0.78
Where interlayer expansions and phase compositions are known, the packing
fraction of PAMAM in the interlayer galleries can be determined as follows (equation
(1)):23
(1)
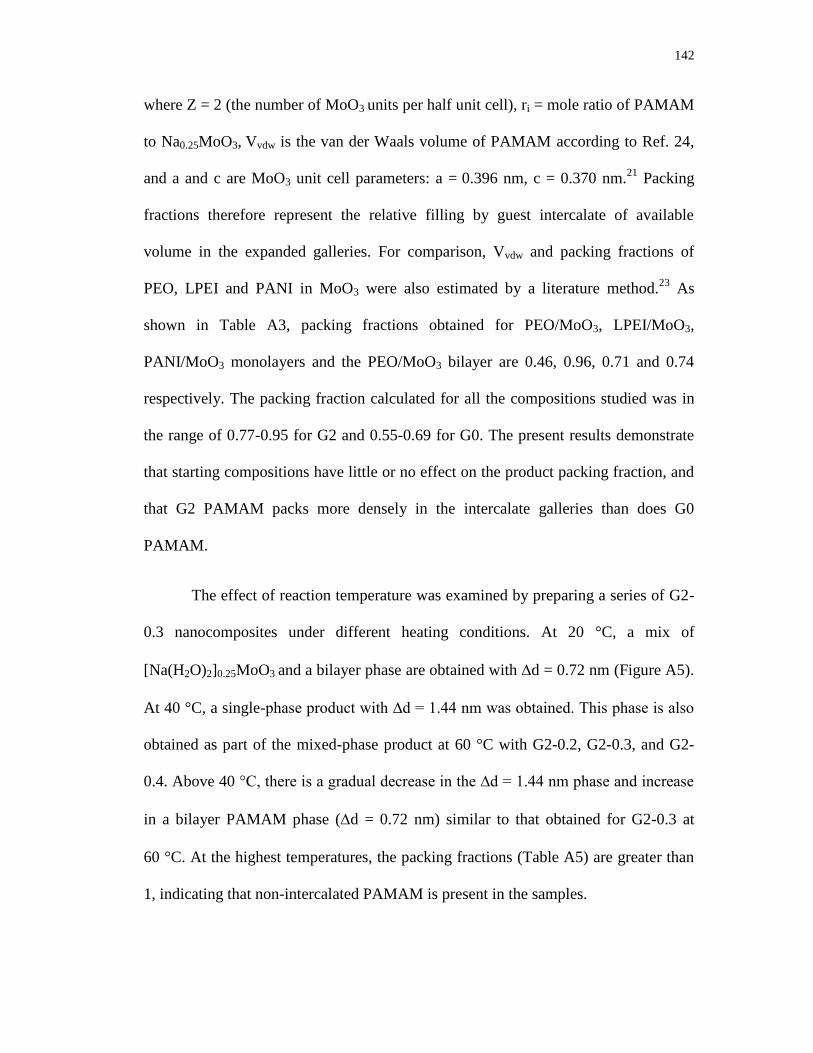
142
where Z = 2 (the number of MoO3 units per half unit cell), ri = mole ratio of PAMAM
to Na0.25MoO3, Vvdw is the van der Waals volume of PAMAM according to Ref. 24,
and a and c are MoO3 unit cell parameters: a = 0.396 nm, c = 0.370 nm.21
Packing
fractions therefore represent the relative filling by guest intercalate of available
volume in the expanded galleries. For comparison, Vvdw and packing fractions of
PEO, LPEI and PANI in MoO3 were also estimated by a literature method.23
As
shown in Table A3, packing fractions obtained for PEO/MoO3, LPEI/MoO3,
PANI/MoO3 monolayers and the PEO/MoO3 bilayer are 0.46, 0.96, 0.71 and 0.74
respectively. The packing fraction calculated for all the compositions studied was in
the range of 0.77-0.95 for G2 and 0.55-0.69 for G0. The present results demonstrate
that starting compositions have little or no effect on the product packing fraction, and
that G2 PAMAM packs more densely in the intercalate galleries than does G0
PAMAM.
The effect of reaction temperature was examined by preparing a series of G2-
0.3 nanocomposites under different heating conditions. At 20 °C, a mix of
[Na(H2O)2]0.25MoO3 and a bilayer phase are obtained with d = 0.72 nm (Figure A5).
At 40 °C, a single-phase product with ∆d = 1.44 nm was obtained. This phase is also
obtained as part of the mixed-phase product at 60 °C with G2-0.2, G2-0.3, and G2-
0.4. Above 40 °C, there is a gradual decrease in the ∆d = 1.44 nm phase and increase
in a bilayer PAMAM phase (d = 0.72 nm) similar to that obtained for G2-0.3 at
60 °C. At the highest temperatures, the packing fractions (Table A5) are greater than
1, indicating that non-intercalated PAMAM is present in the samples.

143
Calculations of packing fractions indicate that the very highly expanded phase
must be stage 1 (with all galleries occupied). Unusually higher expansion (d = 3.8
nm, d = 3.1 nm) has been reported previously for PVP/Li0.25MoO3 and
PAM/Li0.25MoO3 nanocomposites.20
The actual PAMAM arrangement or
conformational changes to form these very large galleries has yet to be established.
Table A5. Effect of temperature on the structure of G2-0.3 nanocomposites.
Temp
(oC)
Mass % Mole ratio,
ri
d
(nm)
∆d
(nm)
Packing
Fraction H2O PAMAM Na0.25MoO3
20 3.6 14.1 82.3 0.008 0.97;
1.43
0.28;
0.74 n.a.
40 3.7 24.2 72.1 0.015 2.13 1.44 0.48
60 4.1 26.8 69.1 0.018 1.32;
2.12
0.63;
1.43 n.a.
80 5.5 30.0 64.5 0.021 1.12;
1.40
0.43;
0.71 n.a.
100 4.9 30.6 64.5 0.022 1.42 0.73 1.34
120 5.0 26.4 68.6 0.018 1.44 0.75 1.06
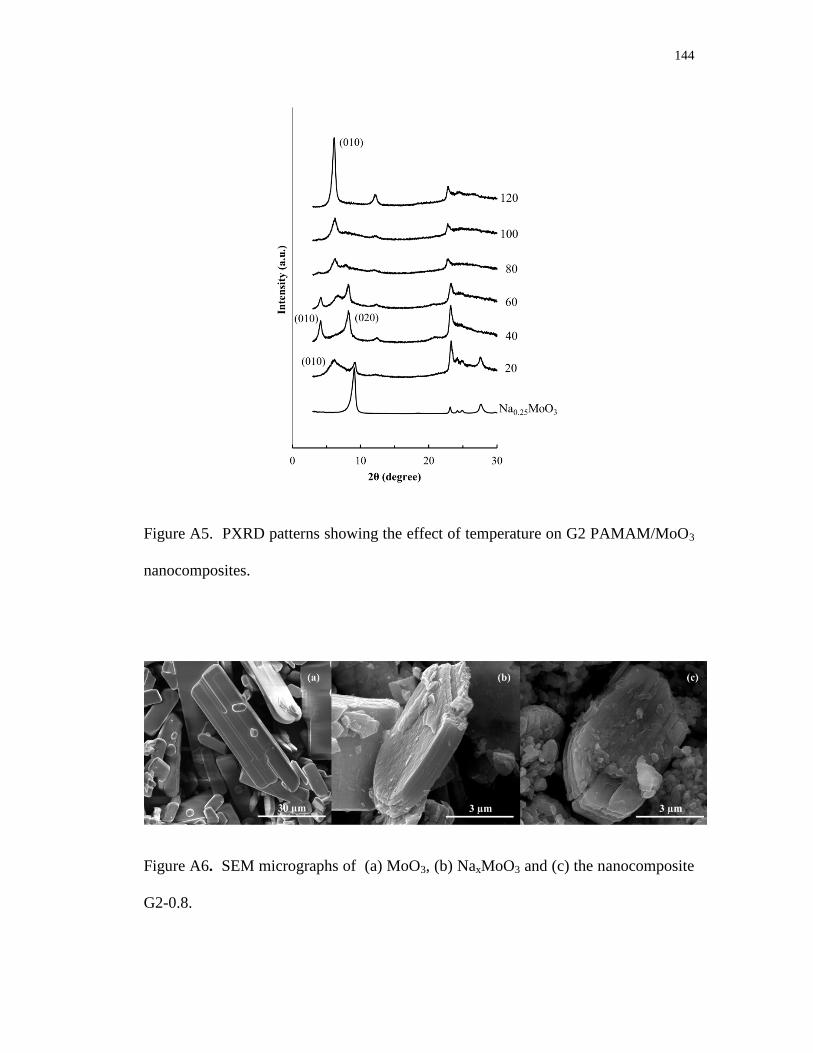
144
Figure A5. PXRD patterns showing the effect of temperature on G2 PAMAM/MoO3
nanocomposites.
Figure A6. SEM micrographs of (a) MoO3, (b) NaxMoO3 and (c) the nanocomposite
G2-0.8.
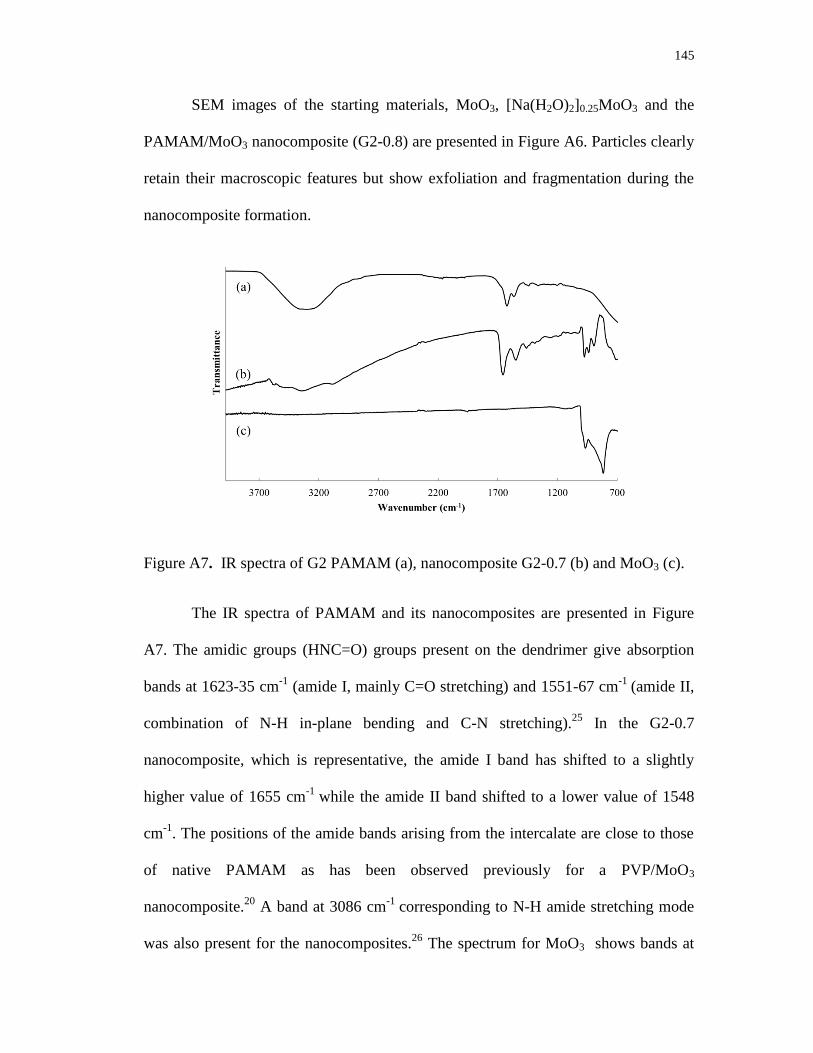
145
SEM images of the starting materials, MoO3, [Na(H2O)2]0.25MoO3 and the
PAMAM/MoO3 nanocomposite (G2-0.8) are presented in Figure A6. Particles clearly
retain their macroscopic features but show exfoliation and fragmentation during the
nanocomposite formation.
Figure A7. IR spectra of G2 PAMAM (a), nanocomposite G2-0.7 (b) and MoO3 (c).
The IR spectra of PAMAM and its nanocomposites are presented in Figure
A7. The amidic groups (HNC=O) groups present on the dendrimer give absorption
bands at 1623-35 cm-1
(amide I, mainly C=O stretching) and 1551-67 cm-1
(amide II,
combination of N-H in-plane bending and C-N stretching).25
In the G2-0.7
nanocomposite, which is representative, the amide I band has shifted to a slightly
higher value of 1655 cm-1
while the amide II band shifted to a lower value of 1548
cm-1
. The positions of the amide bands arising from the intercalate are close to those
of native PAMAM as has been observed previously for a PVP/MoO3
nanocomposite.20
A band at 3086 cm-1
corresponding to N-H amide stretching mode
was also present for the nanocomposites.26
The spectrum for MoO3 shows bands at

146
966 and 816 cm-1
,
corresponding to M=O and M-O stretching vibrations,
respectively,17
which shift to 974, 938 and 894 cm
-1 in the nanocomposites. The shift
to higher wavenumber absorbances suggests that the anionic MoO3 layers in the
nanocomposite are less reduced than in Na0.25MoO3.20
A.5 CONCLUSION
This study indicates that PAMAM dendrimers can be intercalated into MoO3
as monolayers or bilayers. The intercalate arrangement is strongly dependent on the
PAMAM generation. Bilayers of G2 PAMAM can be formed in MoO3 gallery even at
low PAMAM composition. This is a new observation, which is contrary to the
observation with other polymer guests that bilayers are formed only at higher
compositions.
Reaction temperature was observed to affect the structure of the obtained
nanocomposites. Pure bilayers with different levels of expansion were obtained at 40
and 120 °C, whereas mixed phases were obtained at 60 °C.
A.6 REFERENCES
1. S. S. Ray, M. Okamoto, Progress in Polymer Science. 28 (2003) 1539-1641.
2. E. Manias, G. Polizos, H. Nakajima, M. J. Heidecker, in: A. B. Morgan and C.
A. Wilkie (Eds.), Flame retardant polymer nanocomposites, John Wiley & Sons, Inc.
Hoboken, New Jersey, 2007, pp. 31-66.
3. T. A. Kerr, H. Wu, L. F. Nazar, Chemistry of Materials. 8 (1996) 2005-2015.
147
4. A. V. Murugan, A. K. Viswanath, C. S. Gopinath, K. Vijayamohanan, Journal
of Applied Physics. 100 (2006).
5. C. O. Oriakhi, X. R. Zhang, M. M. Lerner, Applied Clay Science. 15 (1999)
109-118.
6. A. W. Bosman, H. M. Janssen, E. W. Meijer, Chemical Reviews. 99 (1999)
1665-1688.
7. D. A. Tomalia, Progress in Polymer Science, 30 (2005) 294-324.
8. N. C. B. Tan, L. Balogh, S. F. Trevino, D. A. Tomalia, J. S. Lin, Polymer. 40
(1999) 2537-2545.
9. D. A. Tomalia, A. M. Naylor, W. A. Goddard, Angewandte Chemie-
International Edition in English, 29 (1990) 138-175.
10. S. Sadekar, H. Ghandehari, Advanced Drug Delivery Reviews, 64 (2012) 571-
588.
11. R. Rajesh, R. Venkatesan, Journal of Molecular Catalysis A:Chemical, 359
(2012) 88-96.
12. L. W. Hoffman, G. G. Andersson, A. Sharma, S. R. Clarke, N. H. Voelcker,
Langmuir, 27 (2011) 6759-6767.
13. L. Campanella, G. Pistoia, Journal of the Electrochemical Society, 118 (1971)
1905-1908.

148
14. L. F. Nazar, H. Wu, W. P. Power, Journal of Materials Chemistry. 5 (1995)
1985-1993.
15. J. P. Pereiraramos, N. Kumagai, Journal of Power Sources. 56 (1995) 87-90.
16. N. Sukpirom, C. O. Oriakhi, M. M. Lerner, Materials Research Bulletin. 35
(2000) 325-331.
17. Y. S. Hu, W. Chen, Q. Xu, R. Z. Yuan, Journal of Materials Science &
Technology. 17 (2001) S124-S126.
18. C. O. Oriakhi, R. L. Nafshun, M. M. Lerner, Materials Research Bulletin. 31
(1996) 1513-1520.
19. O. Y. Posudievsky, S. A. Biskulova, V. D. Pokhodenko, Journal of Materials
Chemistry. 12 (2002) 1446-1449.
20. L. Wang, J. Schindler, C. R. Kannewurf, M. G. Kanatzidis, Journal of
Materials Chemistry. 7 (1997) 1277-1283.
21. D. M. Thomas, E. M. McCarron, Materials Research Bulletin. 21 (1986) 945-
960.
22. R. Esfand, D. A. Tomalia, in: J. M. J. Fréchet, D. A. Tomalia (Eds.),
Dendrimers and Other Dendritic Polymers, John Wiley & Sons, Ltd. Chichester, UK,
2002, pp. 587-604.
23. A. U. Liyanage, M. M. Lerner, RSC Advances. 2 (2012) 474-479.
149
24. Y. H. Zhao, M. H. Abraham, A. M. Zissimos, Journal of Organic Chemistry.
68 (2003) 7368-7373.
25. I. Grabchev, C. Petkov, V. Bojinov, Dyes and Pigments. 62 (2004) 229-234.
26. A. S. Costa, T. Imae, K. Takagi, K. Kikuta, Progress in Colloid & Polymer
Science. 128 (2004) 113-119.

150
APPENDIX B
SUPPLEMENTARY DATA: SYNTHESIS AND
CHARACTERIZATION OF LOW-GENERATION
POLYAMIDOAMINE (PAMAM) DENDRIMER – SODIUM
MONTMORILLONITE (Na-MMT) CLAY NANOCOMPOSITES
Amila U. Liyanage, Esther U. Ikhuoria,a Adeniyi A. Adenuga,
Vincent T. Remcho, and Michael M. Lerner
Department of Chemistry
Oregon State University
Corvallis, OR 97331-4003, USA
a Fulbright visiting scholar, Oregon State University, 2011/2012.
Permanent address: Department of Chemistry, University of Benin,
Benin City, Nigeria.
Inorg. Chem., 2013, 52 (8), 4603–4610.
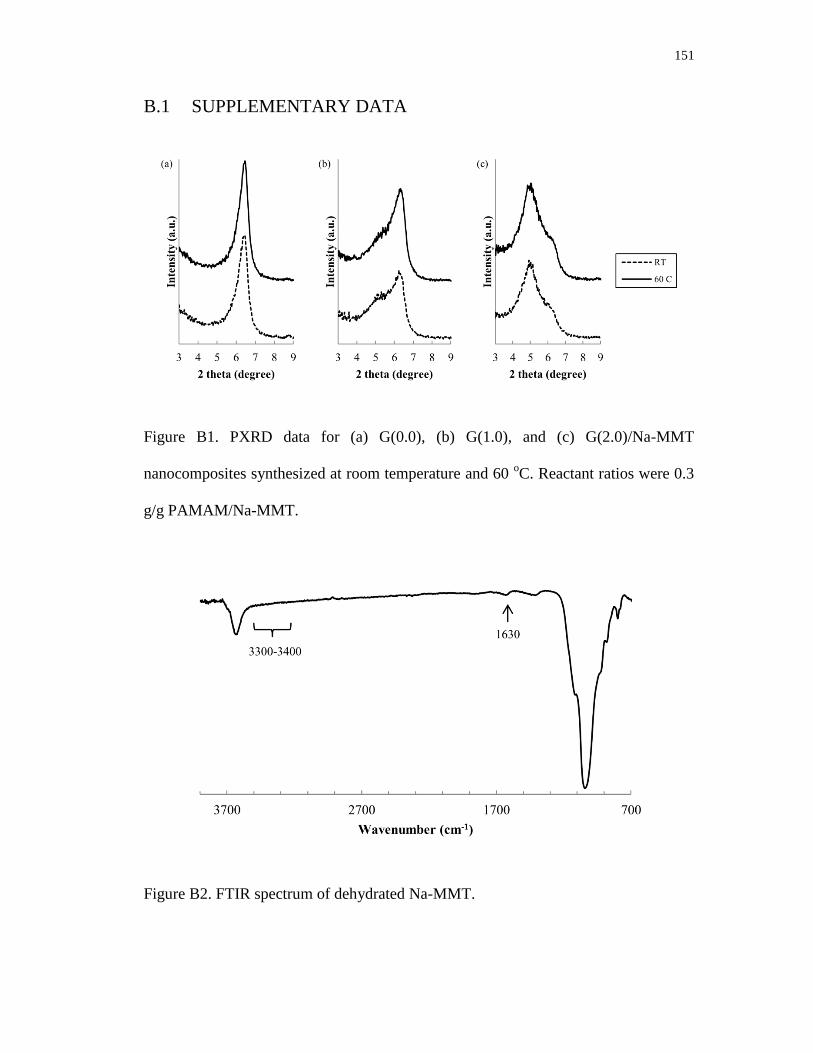
151
B.1 SUPPLEMENTARY DATA
Figure B1. PXRD data for (a) G(0.0), (b) G(1.0), and (c) G(2.0)/Na-MMT
nanocomposites synthesized at room temperature and 60 oC. Reactant ratios were 0.3
g/g PAMAM/Na-MMT.
Figure B2. FTIR spectrum of dehydrated Na-MMT.
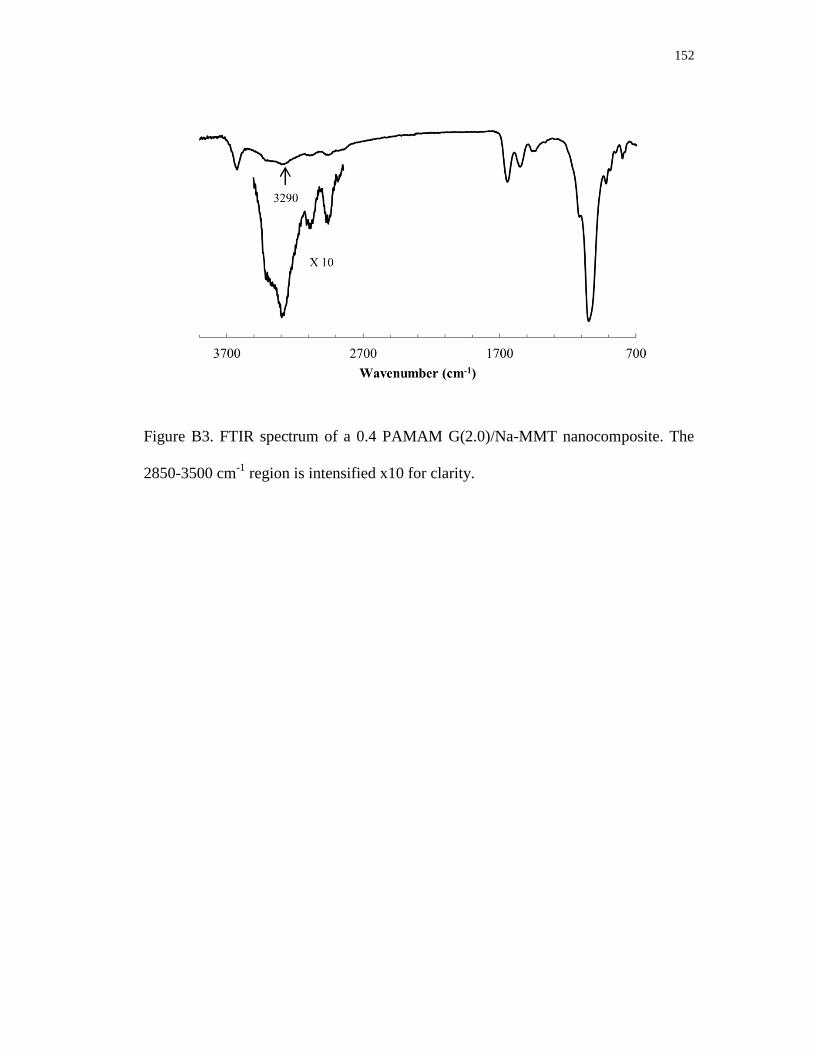
152
Figure B3. FTIR spectrum of a 0.4 PAMAM G(2.0)/Na-MMT nanocomposite. The
2850-3500 cm-1
region is intensified x10 for clarity.

153