an adjoint sensitivity analysis of the southern california current circulation and ecosystem andy...
Post on 21-Dec-2015
225 views
TRANSCRIPT

An Adjoint Sensitivity Analysis of An Adjoint Sensitivity Analysis of the Southern California Current the Southern California Current
Circulation and EcosystemCirculation and Ecosystem
Andy Moore, Andy Moore,
Emanuele DiLorenzo, Hernan Arango, Emanuele DiLorenzo, Hernan Arango,
Craig Lewis, Zack Powell, Craig Lewis, Zack Powell,
Arthur Miller, Bruce CornuelleArthur Miller, Bruce Cornuelle

OutlineOutline
MotivationMotivation Model configuration and circulationModel configuration and circulation Sensitivity and the adjointSensitivity and the adjoint Indices of interestIndices of interest Examples of sensitivitiesExamples of sensitivities Seasonal variationsSeasonal variations SummarySummary

MotivationMotivation The California Current System is controlled The California Current System is controlled
by a number of different regimes (i.e. by a number of different regimes (i.e. upwelling, instability, topographic control).upwelling, instability, topographic control).
Sensitivity analysis can help to unravel this Sensitivity analysis can help to unravel this complex system.complex system.
Test hypotheses about other potentially Test hypotheses about other potentially important processes (i.e. stochastic forcing).important processes (i.e. stochastic forcing).
Sensitivity analysis is also an important Sensitivity analysis is also an important precursor for data assimilation and precursor for data assimilation and predictability analysis.predictability analysis.

The ROMS SCB DomainThe ROMS SCB Domain
7-20km resolution; forced by NCEP climatological winds and surface fluxes.ROMS has been used before in the CCS and validated by others (Marchesiello et al, 2003; Powell et al, 2005).
Outer domain:20km res, 20 levels.
Inner domain:7-20km res, 20 levels.Derives boundaryconditions from the outer domain.

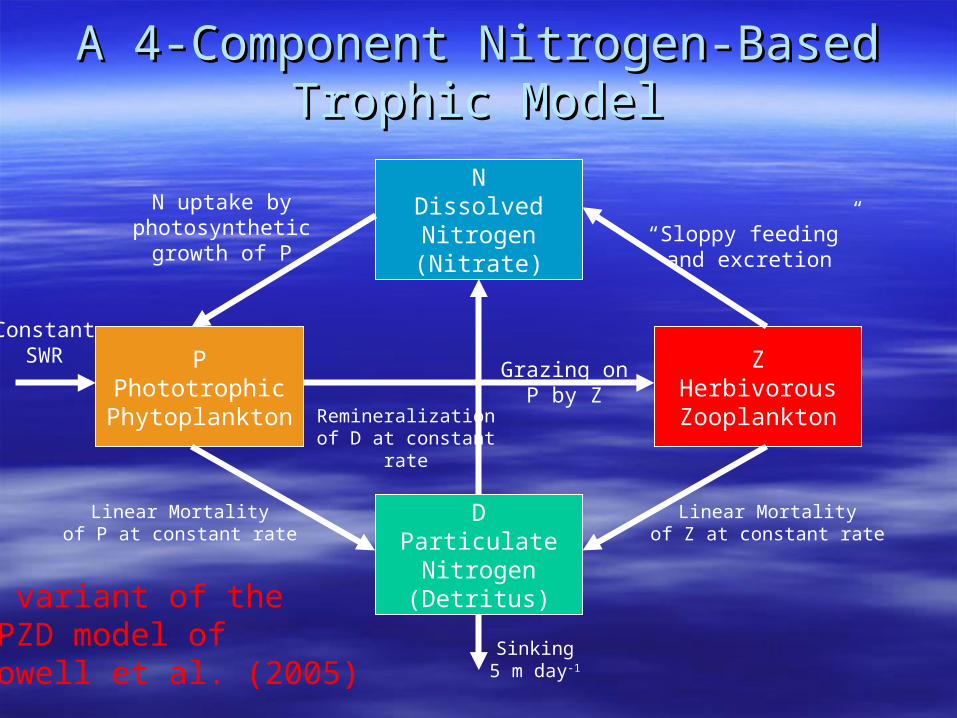
A 4-Component Nitrogen-Based Trophic A 4-Component Nitrogen-Based Trophic ModelModel
NDissolvedNitrogen(Nitrate)
DParticulateNitrogen(Detritus)
PPhototrophic
Phytoplankton
ZHerbivorous
(macro)Zooplankton
ConstantSWR
N uptake byphotosynthetic
growth of P(Michaelis-Menten)
Excretion andmetabolism
Linear Mortalityof Z at constant rate
Linear Mortalityof P at constant rate
Sinking5 m day-1
Grazing onP by Z
(saturating)Remineralizationof D at constant
rate
A variant of theNPZD model ofPowell et al. (2005)

Seasonal CirculationSeasonal Circulation
April
October
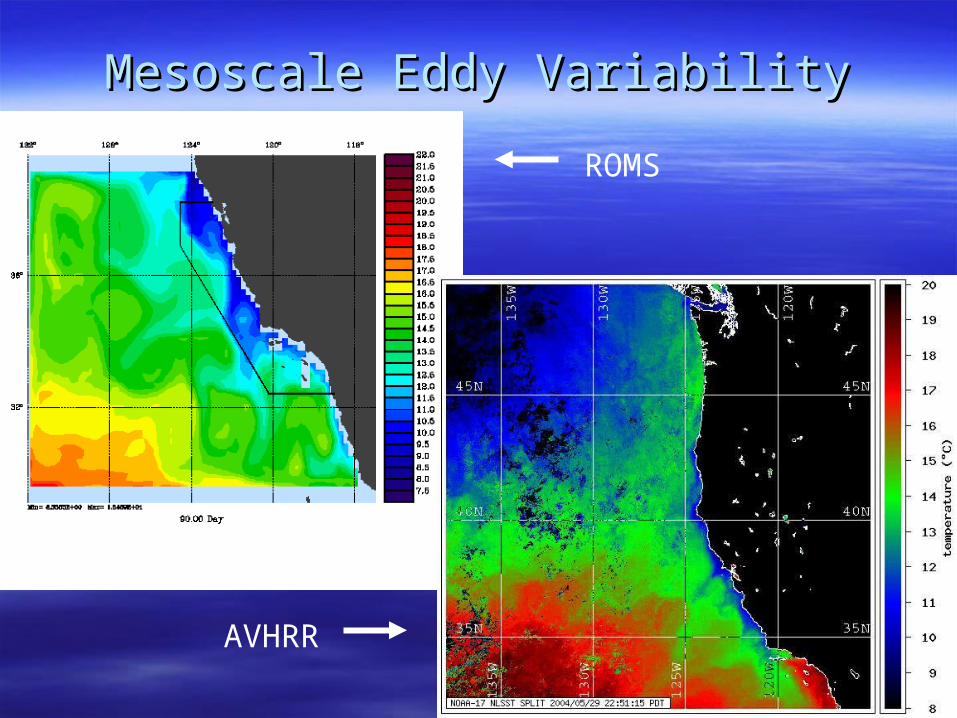
Mesoscale Eddy VariabilityMesoscale Eddy Variability
ROMS
AVHRR

Ecosystem CirculationEcosystem Circulation
Surface P April Average

Adjoint Approach to SensitivityAdjoint Approach to Sensitivity We must first define “sensitivity.”We must first define “sensitivity.” Consider the model state vector:Consider the model state vector: Consider a function or index, , defined in terms of space Consider a function or index, , defined in terms of space
and/or time integrals of .and/or time integrals of . Small changes in will lead to changes in Small changes in will lead to changes in
where:where:
We will define sensitivity as etcWe will define sensitivity as etc..
( , , , , , , , , )Tu v T S N P Z D
J
d J
J J J J JdJ du dv dT dS d
u v T S
J J J JdN dP dZ dD
N P Z D
, , ,J J J
u v T
dJ

Sensitivity AnalysisSensitivity Analysis
Consider a function Consider a function
ClearlyClearly
ButBut
So So
( )J G Φ
TJ G Φ Φ
( ) ( , ) ( )f i f it t t t Φ R Φ
( , )Tf iJ t t G Φ R Φ
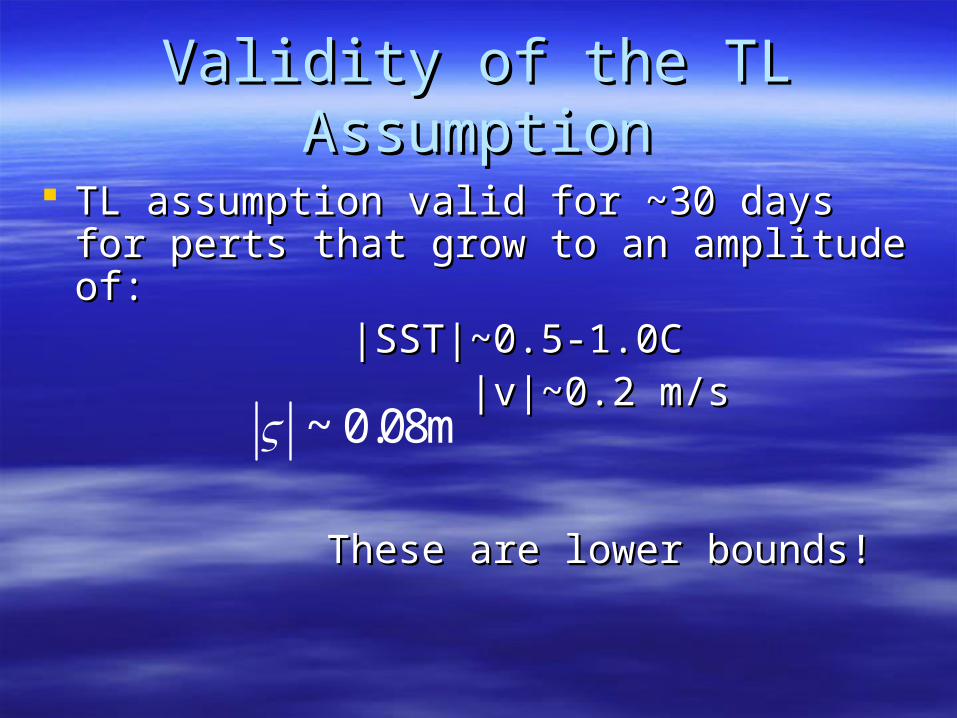
Validity of the TL AssumptionValidity of the TL Assumption
TL assumption valid for ~30 days for perts TL assumption valid for ~30 days for perts that grow to an amplitude of:that grow to an amplitude of:
|SST|~0.5-1.0C|SST|~0.5-1.0C |v|~0.2 m/s|v|~0.2 m/s
These are lower bounds!These are lower bounds!
~ 0.08m

Seasonal Circulation Index RegionsSeasonal Circulation Index Regions
JSST
JKE
J90

IndicesIndices
21 CSST
A T
J SST SST dtdATA
0.15 For ,1
2 21 C CKE
A T Z
J u u v v dtdATAZ
For , 0.005
1BI f z N v
1BI BI
A T Z
J dtdATAZ
710
“Eady Index”
An index ofbaroclinic instability
1

IndicesIndices 2
90
1N C
X Z T
J N N dtdzdxTXZ
For ,
For ,
1 9.6
2
90
1P C
X Z T
J P P dtdzdxTXZ
0.3 1

What Physical Processes are likely to What Physical Processes are likely to Influence J?Influence J?
Advection
Q, P-E+R
Advection
InstabilityLong Rossby Waves
Short Rossby Waves
CoastallyTrappedWaves &
Tides
Turbulence/wave breaking
Note: All processes indicatedcan be significantly influencedby stochastic forcing.
A 4-Component Nitrogen-Based Trophic A 4-Component Nitrogen-Based Trophic ModelModel
NDissolvedNitrogen(Nitrate)
DParticulateNitrogen(Detritus)
PPhototrophic
Phytoplankton
ZHerbivorousZooplankton
ConstantSWR
N uptake byphotosynthetic
growth of P“Sloppy feeding”
and excretion
Linear Mortalityof Z at constant rate
Linear Mortalityof P at constant rate
Sinking5 m day-1
Grazing onP by Z
Remineralizationof D at constant
rate
A variant of theNPZD model ofPowell et al. (2005)

Physical Circulation Physical Circulation SensitivitiesSensitivities

The Signature of Advection in The Signature of Advection in
Day 5 Day 10 Day 15
Day 20 Day 25 Day 30
SSTJ Q

Seasonal Variations in Sensitivities ISeasonal Variations in Sensitivities IThe change in over the target arearequired to yield one change in
for .
SSTJ1
The change in Q over the target arearequired to yield one change in
for .
SSTJ
The change in v over the target arearequired to yield one change in
for .
SSTJ1
1
Low sensitivity
Low sensitivity
Low sensitivity
High sensitivity
High sensitivity
High sensitivity
0.035
0.01
32
20
2.3
0.3

Seasonal Variations in Sensitivities IISeasonal Variations in Sensitivities II
The change in over the target arearequired to yield one change in
for .
The change in over the target arearequired to yield one change in
for .
KEJ1
BIJ
1
Low sensitivity
Low sensitivity
High sensitivity
High sensitivity
0.0045
0.002
0.003
0.0003

Seasonal Variations in Sensitivities Seasonal Variations in Sensitivities IIIIII
The change in Q over the target arearequired to yield one change in
for .
The change in v over the target arearequired to yield one change in
for .
BI
J
BIJ
1
1
Low sensitivity
Low sensitivity
High sensitivity
High sensitivity
220
15
1
< 0.01

Interdependencies: Sensitivity of KE Interdependencies: Sensitivity of KE to Baroclinic Instabilityto Baroclinic Instability
Change in required to yield a one change in when varying only v for . Recall that
BI KEJ 1 710BI
Low sensitivity
High sensitivity
Log
scal
e
910
1310

Summary for Physical CirculationSummary for Physical Circulation
SST anomaly in coastal upwelling regions SST anomaly in coastal upwelling regions equally sensitive to variations in and Q, equally sensitive to variations in and Q, with v a close second.with v a close second.
Highest (Lowest) sensitivity in Fall (Spring)Highest (Lowest) sensitivity in Fall (Spring) KE anomaly most sensitive to variations in KE anomaly most sensitive to variations in
and baroclinicity.and baroclinicity. Highest (Lowest) sensitivity Summer/Fall Highest (Lowest) sensitivity Summer/Fall
(Winter/Spring).(Winter/Spring).

Biological Circulation Biological Circulation SensitivitiesSensitivities

Adjoint Sensitivity for Ecosystem ModelAdjoint Sensitivity for Ecosystem Model
Oct: on day 13 3 day 30NO NO Oct: on day 13 day 30
NO P
3 day 30NO Z Oct: on day 1 Oct: on day 13 day 30
NO D
Mar: on day 13 day 30NO P
Jul: on day 13 day 30
NO P

Seasonal Variations in Sensitivities ISeasonal Variations in Sensitivities I
Change in required to yield a one change in for . Note the log-scale!
90PJ 1
Low sensitivity
High sensitivity
Log
scal
e
110
510
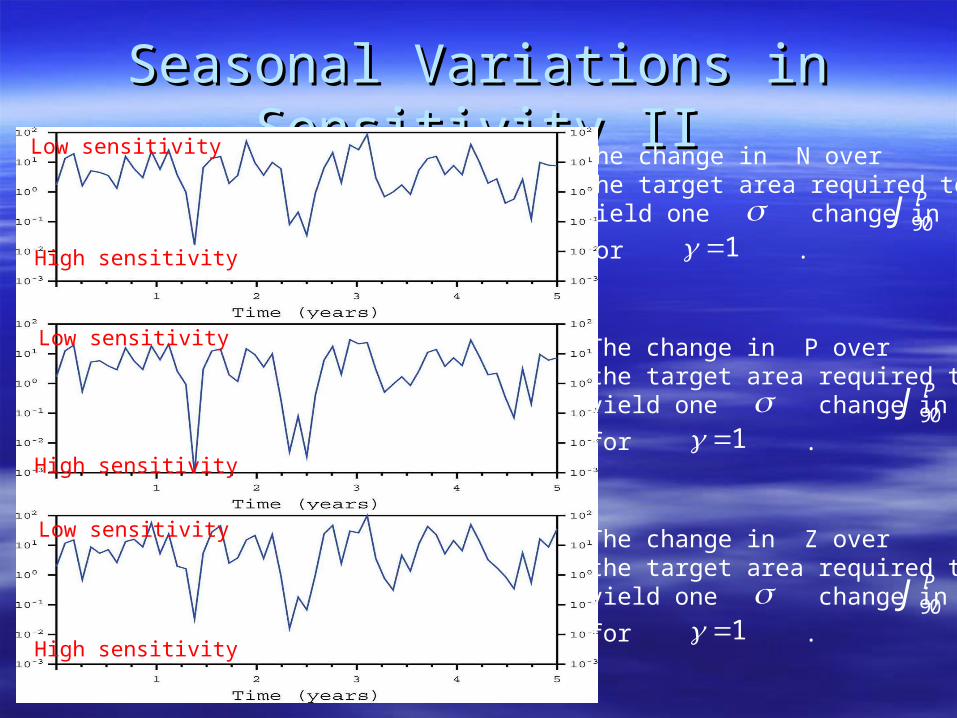
Seasonal Variations in Sensitivity IISeasonal Variations in Sensitivity IIThe change in N over the target area required to yield one change in
for .
The change in P over the target area required to yield one change in
for .
The change in Z over the target area required to yield one change in
for .
90PJ
90PJ
90PJ
1
1
1
Low sensitivity
Low sensitivity
Low sensitivity
High sensitivity
High sensitivity
High sensitivity

Summary of Biological CirculationSummary of Biological Circulation
For all NPZD-based indices, variations in are For all NPZD-based indices, variations in are found to be important.found to be important.
Variations in NPZD equally important (internal Variations in NPZD equally important (internal interactions important).interactions important).
NPZD concentrations strongly influenced by the NPZD concentrations strongly influenced by the physical environment.physical environment.
Highest (Lowest) sensitivities in Spring/Summer Highest (Lowest) sensitivities in Spring/Summer (Fall/Winter).(Fall/Winter).
Extraordinary sensitivities during some Spring Extraordinary sensitivities during some Spring periods suggestive of linear instability (i.e. we are periods suggestive of linear instability (i.e. we are perhaps the TL assumption a little too far!).perhaps the TL assumption a little too far!).

Other Ongoing ApplicationsOther Ongoing Applications
Intra-Americas SeaIntra-Americas Sea Monterey BayMonterey Bay

Intra-Americas SeaIntra-Americas Sea

Seasonal Sensitivity Dependence, JSeasonal Sensitivity Dependence, J22
1010-2-2JJ22 SST (K)SST (K) V (m sV (m s-1-1)) (N m(N m-2-2)) (m) (m) Q (W mQ (W m-2-2))
JanJan 10.810.8 2.1 (1.1)2.1 (1.1) 0.0180.018 8.88.8 148148
FebFeb 10.510.5 1.7 (0.8)1.7 (0.8) 0.0180.018 8.18.1 158158
MarMar 10.710.7 1.3 (0.6)1.3 (0.6) 0.0160.016 7.87.8 149149
AprApr 11.811.8 1.5 (0.8)1.5 (0.8) 0.0190.019 7.57.5 158158
MayMay 9.79.7 1.4 (0.7)1.4 (0.7) 0.0160.016 8.48.4 137137
JunJun 8.88.8 1.7 (0.9)1.7 (0.9) 0.0130.013 7.47.4 124124
JulJul 9.59.5 1.5 (0.7)1.5 (0.7) 0.0150.015 9.39.3 141141
AugAug 10.710.7 1.6 (0.7)1.6 (0.7) 0.0170.017 8.78.7 149149
SepSep 10.010.0 1.8 (1.0)1.8 (1.0) 0.0140.014 8.18.1 137137
OctOct 8.58.5 1.7 (1.1)1.7 (1.1) 0.0130.013 8.28.2 124124
NovNov 8.68.6 1.5 (0.9)1.5 (0.9) 0.0140.014 8.68.6 128128
DecDec 9.29.2 1.2 (0.6)1.2 (0.6) 0.0150.015 8.88.8 128128
MeanMean 9.99.9 1.6 (0.8)1.6 (0.8) 0.0160.016 8.38.3 140140
Basic State MnBasic State Mn 1010 ~1~1 ~0.1~0.1 ~0.2~0.2 ~100~100
RankRank 22 22 11 33 22
Rank based on percentage of basic state mean

Seasonal Sensitivity Dependence, JSeasonal Sensitivity Dependence, J4 4 (N)(N)
Rank based on percentage of basic state mean
NONO3 3 (mmol Nm(mmol Nm-3-3)) P P (mmol Nm(mmol Nm-3-3)) Z Z (mmol Nm(mmol Nm-3-3)) D D (mmol Nm(mmol Nm-3-3)) (N m(N m-2-2)) V (m sV (m s-1-1))
JanJan 0.0350.035 0.0720.072 0.0410.041 0.0640.064 7.5X107.5X10-4-4 0.0780.078
FebFeb 0.0340.034 0.0610.061 0.0410.041 0.0620.062 6.2X106.2X10-4-4 0.0700.070
MarMar 0.0390.039 0.0900.090 0.0460.046 0.0730.073 10.0X1010.0X10-4-4 0.0830.083
AprApr 0.0370.037 0.0070.007 0.0200.020 0.0670.067 0.8X100.8X10-4-4 0.0040.004
MayMay 0.0360.036 0.0970.097 0.0420.042 0.0660.066 9.8X109.8X10-4-4 0.0930.093
JunJun 0.0480.048 0.1120.112 0.0560.056 0.0930.093 12.1X1012.1X10-4-4 0.1120.112
JulJul 0.0400.040 0.0960.096 0.0490.049 0.0770.077 11.9X1011.9X10-4-4 0.0730.073
AugAug 0.0320.032 0.0680.068 0.0360.036 0.0540.054 6.6X106.6X10-4-4 0.0560.056
SepSep 0.0300.030 0.0760.076 0.0330.033 0.0520.052 4.8X104.8X10-4-4 0.0470.047
OctOct 0.0320.032 0.0720.072 0.0370.037 0.0590.059 6.1X106.1X10-4-4 0.0730.073
NovNov 0.0340.034 0.0820.082 0.0400.040 0.0610.061 6.7X106.7X10-4-4 0.0820.082
DecDec 0.0370.037 0.0750.075 0.0430.043 0.0680.068 7.1X107.1X10-4-4 0.0810.081
MeanMean 0.0360.036 0.0760.076 0.0400.040 0.0660.066 7.5X107.5X10-4-4 0.0710.071
Basic StateBasic State ~10~10 ~10~10 ~10~10 ~1~1 ~0.1~0.1 ~1~1
RankRank 11 11 11 22 11 22

Seasonal Sensitivity Dependence, JSeasonal Sensitivity Dependence, J4 4 (P)(P)
Rank based on percentage of basic state mean
NONO3 3 (mmol Nm(mmol Nm-3-3)) P P (mmol Nm(mmol Nm-3-3)) Z Z (mmol Nm(mmol Nm-3-3)) D D (mmol Nm(mmol Nm-3-3)) (N m(N m-2-2)) V (m sV (m s-1-1))
JanJan 3.13.1 2.82.8 3.33.3 10.710.7 6.8X106.8X10-3-3 0.450.45
FebFeb 8.48.4 6.56.5 10.710.7 17.117.1 7.9X107.9X10-3-3 0.360.36
MarMar 3.13.1 3.33.3 3.23.2 4.74.7 1.1X101.1X10-3-3 0.060.06
AprApr 1.41.4 0.090.09 2.62.6 4.74.7 0.8X100.8X10-3-3 0.0050.005
MayMay 3.03.0 3.43.4 5.55.5 5.85.8 1.1X101.1X10-3-3 0.110.11
JunJun 4.54.5 4.54.5 5.95.9 9.29.2 3.9X103.9X10-3-3 0.310.31
JulJul 2.82.8 2.72.7 4.04.0 5.25.2 2.4X102.4X10-3-3 0.230.23
AugAug 8.58.5 1.31.3 1.31.3 1.51.5 0.6X100.6X10-3-3 0.050.05
SepSep 7.17.1 7.37.3 7.97.9 11.611.6 2.3X102.3X10-3-3 0.080.08
OctOct 10.510.5 7.67.6 15.915.9 29.329.3 3.3X103.3X10-3-3 0.080.08
NovNov 2.52.5 2.72.7 3.13.1 4.84.8 6.8X106.8X10-3-3 0.110.11
DecDec 12.512.5 12.012.0 15.515.5 21.021.0 9.4X109.4X10-3-3 0.580.58
MeanMean 5.05.0 4.54.5 6.46.4 10.510.5 6.8X106.8X10-3-3 0.200.20
Basic StateBasic State ~10~10 ~10~10 ~10~10 ~1~1 ~0.1~0.1 ~1~1
RankRank 11 11 11 33 22 11

Seasonal Sensitivity Dependence, JSeasonal Sensitivity Dependence, J4 4 (Z)(Z)
Rank based on percentage of basic state mean
NONO3 3 (mmol Nm(mmol Nm-3-3)) P P (mmol Nm(mmol Nm-3-3)) Z Z (mmol Nm(mmol Nm-3-3)) D D (mmol Nm(mmol Nm-3-3)) (N m(N m-2-2)) V (m sV (m s-1-1))
JanJan 14.214.2 11.711.7 4.74.7 3232 0.030.03 1.81.8
FebFeb 12.612.6 12.612.6 7.87.8 2525 0.040.04 1.11.1
MarMar 9.09.0 7.17.1 6.46.4 1616 0.020.02 0.30.3
AprApr 0.40.4 0.250.25 0.80.8 22 0.0030.003 0.020.02
MayMay 10.910.9 6.96.9 4.14.1 3434 0.030.03 0.60.6
JunJun 26.526.5 16.816.8 9.39.3 7777 0.030.03 1.41.4
JulJul 7.57.5 7.57.5 5.45.4 1717 0.0080.008 0.20.2
AugAug 12.612.6 10.110.1 5.25.2 2525 0.010.01 0.20.2
SepSep 9.99.9 6.56.5 5.45.4 1616 0.0050.005 0.090.09
OctOct 25.425.4 15.115.1 9.29.2 6565 0.0040.004 0.10.1
NovNov 8.58.5 7.17.1 3.73.7 2222 0.020.02 0.40.4
DecDec 26.726.7 17.117.1 10.710.7 6565 0.070.07 1.81.8
MeanMean 13.713.7 9.99.9 5.65.6 3333 0.020.02 0.70.7
Basic StateBasic State ~10~10 ~10~10 ~10~10 ~1~1 ~0.1~0.1 ~1~1
RankRank 22 22 22 33 11 22

Seasonal Sensitivity Dependence, JSeasonal Sensitivity Dependence, J4 4 (D)(D)
Rank based on percentage of basic state mean
NONO3 3 (mmol Nm(mmol Nm-3-3)) P P (mmol Nm(mmol Nm-3-3)) Z Z (mmol Nm(mmol Nm-3-3)) D D (mmol Nm(mmol Nm-3-3)) (N m(N m-2-2)) V (m sV (m s-1-1))
JanJan 2525 1515 2020 88 0.030.03 1.21.2
FebFeb 2424 1717 2424 1111 0.060.06 1.81.8
MarMar 1717 1212 1717 88 0.010.01 0.70.7
AprApr 22 0.10.1 0.40.4 44 0.0020.002 0.090.09
MayMay 2424 1313 1818 66 0.010.01 0.90.9
JunJun 4646 2525 4444 1111 0.040.04 2.12.1
JulJul 1111 99 1212 55 0.010.01 0.30.3
AugAug 1212 66 1010 55 0.0070.007 0.20.2
SepSep 2121 1313 2020 77 0.0060.006 0.40.4
OctOct 5353 2222 3535 77 0.0090.009 0.30.3
NovNov 1515 1010 1414 55 0.030.03 0.70.7
DecDec 5959 3333 5353 1111 0.090.09 3.43.4
MeanMean 2626 1515 2222 77 0.020.02 1.01.0
Basic StateBasic State ~10~10 ~10~10 ~10~10 ~1~1 ~0.1~0.1 ~1~1
RankRank 33 22 33 44 11 22

The Adjoint OperatorThe Adjoint Operator
ConsiderConsider
Perturbations in given by: Perturbations in given by:
Sensitivity given by:Sensitivity given by:
is the adjoint of ROMS.is the adjoint of ROMS. The adjoint provides the Green’s functions The adjoint provides the Green’s functions
for -functions at all points in space-time.for -functions at all points in space-time.
21
A T
J SST dAdt
T T T1 2 2 2 (0) ( )
A T T T
J SST SSTdAdt dt t dt H R
1J
T2 ( )T
Jt dt
R
T ( )tR

Validity of Tangent Linear AssumptionValidity of Tangent Linear Assumption
TLM and NLM perturbedby first 10 energy SVs.(|SST|~0.5-1C; ~6cmat day 30)
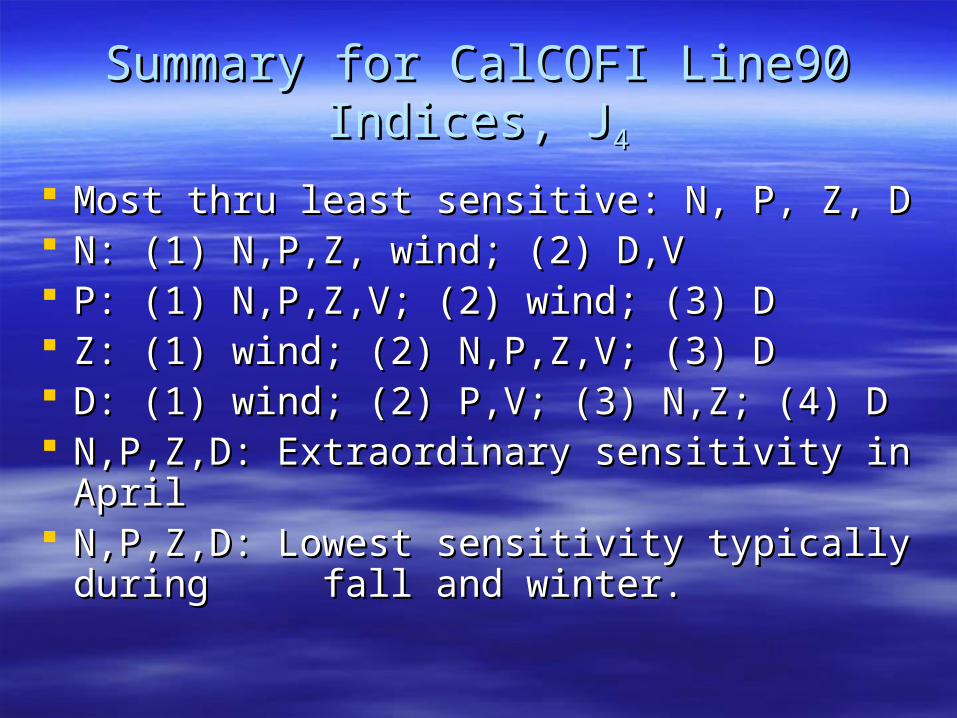
Summary for CalCOFI Line90 Indices, JSummary for CalCOFI Line90 Indices, J44
Most thru least sensitive: N, P, Z, DMost thru least sensitive: N, P, Z, D N: (1) N,P,Z, wind; (2) D,VN: (1) N,P,Z, wind; (2) D,V P: (1) N,P,Z,V; (2) wind; (3) DP: (1) N,P,Z,V; (2) wind; (3) D Z: (1) wind; (2) N,P,Z,V; (3) DZ: (1) wind; (2) N,P,Z,V; (3) D D: (1) wind; (2) P,V; (3) N,Z; (4) DD: (1) wind; (2) P,V; (3) N,Z; (4) D N,P,Z,D: Extraordinary sensitivity in AprilN,P,Z,D: Extraordinary sensitivity in April N,P,Z,D: Lowest sensitivity typically during N,P,Z,D: Lowest sensitivity typically during
fall and winter. fall and winter.

( ), ( ), ( ), ( ), ( ), ( ), ( ), ( )v t T t S t t N t P t Z t D t
J J
u u
A Reminder…A Reminder…