an agent-based model of epidemic spread using human ...to model virus spreading. specifically, we...
TRANSCRIPT

An Agent-Based Model of Epidemic Spread usingHuman Mobility and Social Network Information
Enrique Frıas-Martınez ‡, Graham Williamson 1#, Vanessa Frıas-Martınez ‡,‡ Telefonica Research, Madrid – Spain
# School of Computer Science , University College Dublin – Ireland{efm,graham,vanessa}@tid.es
Abstract— The recent adoption of ubiquitous computing tech-nologies has enabled capturing large amounts of human behav-ioral data. The digital footprints computed from these datasetsprovide information for the study of social and human dynamics,including social networks and mobility patterns, key elementsfor the effective modeling of virus spreading. Traditional epi-demiologic models do not consider individual information andhence have limited ability to capture the inherent complexityof the disease spreading process. To overcome this limitation,agent-based models have recently been proposed as an effectiveapproach to model virus spreading. However, most agent-basedapproaches to date have not included real-life data to characterizethe agents’ behavior. In this paper we propose an agent-basedsystem that uses social interactions and individual mobilitypatterns extracted from call detail records to accurately modelvirus spreading. The proposed approach is applied to study the2009 H1N1 outbreak in Mexico and to evaluate the impactthat government mandates had on the spreading of the virus.Our simulations indicate that the restricted mobility due thegovernment mandates reduced by 10% the peak number ofindividuals infected by the virus and postponed the peak of thepandemic by two days.
I. INTRODUCTION
Planning for a pandemic (e.g., H1N1, influenza, etc.) is apublic health priority of any government. Traditional epidemi-ological approaches base their solutions on using differentialequations that divide the population into subgroups basedon socio-economic and demographic characteristics. Althoughthese models fail to capture the complexity and individualityof human behavior, they have been extremely successful inguiding and designing public health policies. The recent adop-tion of agent-based modeling (ABM) approaches to simulatepandemics has allowed to capture individual human behaviorand its inherent fuzziness by representing every person asa software agent. The ABM model characterizes each agentwith a variety of variables that are considered relevant tomodel virus spreading such as mobility patterns, social net-work characteristics, socio-economic status, health status, etc.Hence, ABM approaches need realistic data to create agentsthat effectively capture human behavior. Typically this data isobtained from the census or by means of surveys [1].
The adoption of ubiquitous computing technologies by verylarge portions of the population (e.g. GPS devices, ubiquitouscellular networks or geolocated services) has enabled captur-ing large scale human behavioral data. These datasets contain
1Work done while author was an intern at Telefonica Research, Madrid.
information that is critical to accurately model the spread of avirus, such as human mobility patterns or the social networkcharacteristics of each individual [2][1].
In this paper, we propose an ABM system designed tosimulate virus spreading using agents that are characterizedby their individual mobility patterns and social networks asextracted from cell phone records. We carry out simulationswith data collected during the 2009 Mexican H1N1 outbreakand measure the impact that government calls had on themobility of individuals and the subsequent effect on the spreadof the H1N1 virus. To the best of our knowledge, this is thefirst time that this kind of real-life information is used in anABM system.
The remainder of this paper is organized as follows: SectionII discusses the related work regarding traditional diseasemodels and ABM simulation environments; Section III de-scribes the infrastructure of a cell phone network and how cellphone records are captured; our proposed ABM architectureis presented in Section IV. Section V presents a case studythat evaluates the impact that government mandates regardingmobility restrictions had on the spreading of the 2009 H1N1virus outbreak in Mexico. Finally, we describe our conclusionsand outline our future work in Section VI.
II. RELATED WORK
A. Traditional Epidemic Disease Models
Traditional epidemic disease models are based on the SIRmodel and its variations (SI, SIR, SIS, SEIR, etc.) [3]. Theseapproaches, called compartmental models, split the populationinto compartments that represent the different stages of adisease. The most general approach is the SIR model thattypifies the disease progression as follows: (1) S, representsthe susceptible (S) portion of the population i.e. those yet tobe infected; (2) I, represents those that are currently infectiveor infectious (I); and (3) R, represents individuals that haverecovered (R) from the disease and no longer take an activepart in the disease spread. Other models like the SEIR, add anintermediate stage (E) which represents a latent state in whichindividuals have been exposed to the disease but are not yetinfective, i.e. the individuals in this stage have the virus butcan not infect others. All these models represent the virustransmission by a set of nonlinear ordinary differential equa-tions (ODEs) that associate a transition rate to the mobility ofagents between compartments. These transition rates are used
by the models to define a reproductive rate R0 that representsthe number of people in a susceptible population that couldbe infected by an infective agent. In general, if R0 > 1 thedisease spreads epidemically and when R0 ≤ 1 the diseasedies out.
One of the main restrictions of the original compartmentalmodels is that they assume that all members within onecompartment are identical to each other. Recent literature hasevolved the SIR/SEIR models to overcome such homogeneityby creating metapopulation models. Metapopulation modelsextend the traditional epidemiological approaches to differen-tiate types of population within each epidemic state (S,E,I,R).For example, Balcan et al. differentiate subgroups withinthe population based on vaccinations received, symptomaticversus asymptomatic individuals, citizens that travel versusthose who do not, natural immunity to diseases, etc. [4].Similarly, Brockmann et al. define different metapopulationsbased on their mobility patterns inferred from the movementsof US bank notes[5].
B. Agent-based Epidemic Models
Compartmental models cannot capture the complexity ofhuman behavior, particularly regarding mobility patterns andsocial networks. Although metapopulation models attempt toovercome such limitations they still suffer from behavioralgeneralizations within the metapopulations. In this context,agent-based epidemic models (ABMs) are designed to capturethe behavior of each unique individual (agent). As a result,agent-based epidemiological simulations are more powerfulthan metapopulation models to represent the spreading ofviruses given their granularity and capability to model behav-ior and interactions individually [6].
Although this research line is quite novel, the literaturealready reports some relevant results. Apolloni et al. proposeSimdemics, an integrated modeling environment that aidspublic health officials in pandemic planning [7]. Simdemicsis an agent-based simulator that defines four models to evolvethe epidemic spread: (1) a statistical model of the population(based on age, gender or geographical density), (2) a socialinteraction model, (3) a disease model, that accounts for theimpact that demographic or socio-economic factors mighthave on epidemic spreading, and (4) intervention models e.g.,public policy changes, agent behavioral changes, etc. In theirconclusions, the authors advocate for the necessity to haveaccurate human behavioral models that reveal mobility andinteraction patterns.
Barrett et al. present an agent-based simulator calledEpiSimdemics [8]. The authors build a synthetic populationfrom the United States Census characterizing each individual(agent) with 163 different variables. Individuals are mapped togeographically located housing units, and their daily activitiesare modeled from a wide arrange of datasets like educationstatistics to model school attendance or transport surveys tomodel mobility patterns. The disease model consists of twoparts: the between-hosts disease transmission and the within-host disease progression. The within-hosts progression is mod-
eled as a finite state machine with probabilistic transitions(PTTS) that determines the evolution through the variousdisease states. The between-hosts transmission is modeled asfollows:
pi = 1− exp(τ∑r∈R
Nr ln(1− rsiρ)) (1)
where pi is the probability that an infection is triggered in asusceptible agent i; τ is the duration of exposure; R is the setof infective agents and Nr the number of such agents withinfectivity r; si is the susceptibility of individual i and ρ thebasic transmissibility of the disease. This equation representsan intuitive process: the probability of inter-agent transmissionincreases with the amount of time spent in the presence of aninfective individual and the number of infectious agents (andtheir infectivity) present at a given location. This approach isspecially relevant when the transmission is mainly by directcontact, which is the case of H1N1.
ABM simulations, specially if done for large populations,require large amounts of memory and time. Recent literaturehas also explored how to effectively compute ABM models.Parker et al. present the Global-Scale Agent Model, GSAM,which focuses on achieving high performance while com-puting realistic agents [9]. The GSAM system can generateover a billion distinct agents with models that include dailyinteractions. Additionally, the authors show how to use GSAMsystem to model epidemic evolutions at a planetary scale.
In general, although agent-based epidemic models improvetraditional epidemiological approaches, all the solutions imple-mented so far face the same limitation: the information usedto model human mobility and social networks is extractedfrom census data and surveys. Although these data mightapproximate real behavior, it does not account for changesin behavior due to the epidemic itself. The model proposed inthis paper aims to achieve a more realistic representation ofhuman behavior which includes the behavioral changes thatmight take place during the epidemic.
III. PRELIMINARIES
In order to capture realistic human mobility patterns andsocial dynamics, we use the ubiquitous infrastructure providedby a cell phone network. Cell phone networks are built usinga set of cell towers, called Base Transceiver Stations (BTS),that connect the cell phones to the network. Each BTS has alatitude and a longitude – its geolocation – and gives cellularcoverage to an area called a sector. We assume that the sectorof each BTS is a 2-dimensional non-overlapping polygon,and we use a Voronoi tessellation to define its coverage area.Figure 1(left) shows a set of BTSs with the original coveragearea of each cell, and Figure 1(right) presents its approximatedcoverage computed using Voronoi.
Call Detail Record (CDR) databases are generated when amobile phone connected to the network makes or receives aphone call or uses a service (e.g., SMS, MMS, etc.). In theprocess, and for invoice purposes, the information regardingthe time and the BTS tower where the user was located when

Fig. 1. (Left) Example of a set of BTSs and their coverage and (Right)Approximated coverage obtained applying Voronoi tesselation.
the call was initiated is logged, which gives an indication ofthe geographical position of a user at a given moment intime. Note that no information about the exact position ofa user in a cell is known. From all the data contained in aCDR, our study only uses the encrypted originating number,the encrypted destination number, the time and date of thecall, the duration of the call, and the BTS towers used by theoriginating and destination cell phone numbers.
We use CDR data to compute the individual mobility andsocial models that are part of the proposed ABM architectureto model virus spreading. Specifically, we build: (1) a mobilityuser model that estimates the position of each agent at eachmoment in time and (2) a social user model that identifieseach agent’s social network (in the sense of close relations).Due to the nature of the CDR data available, each agent’smobility model is computed at the BTS level i.e., the ABMsystem will be able to determine, at each moment in time, theBTS coverage area where an agent is located. The position ofthe agent within the coverage area of the BTS is unknown.As a result of that limitation, the ABM system will providemore accurate mobility models in areas with high densitiesof towers (urban areas) where coverage areas per BTS aresmaller in size. Each individual’s social network is modeledas the set of close relations obtained from the CDRs. Specificsabout its computation are explained in Section IV. Note thatthis model is critical to determine when the transmission ofthe virus takes place. We assume that two agents that are partof the same social network are more likely to be physicallyclose than two agents that do not know each other. Hence,whenever two agents are in the same coverage area (BTS),the probability of infection between the two will be higher ifthey are part of the same social network.
This approach of capturing and modeling agent behaviorfrom CDRs sets our work apart from others because: (1)we model agents from real individual data and not fromcensus or surveys as previously explained; and (2) we capturebehavioral adaptations to the spread of the disease i.e., changesin mobility patterns or in the social network of the agents asthe disease spreads over time. In fact, census or survey datagive a one snapshot view of a society’s behavioral patterns.However, cell phone data is collected in real time and providesan accurate daily representation of the agents’ behaviors andtheir changes due to external events. Finally, note that althoughthe ABM system we present is designed for cell phone records,a similar approach could be used with logs from any otherlocation-based service, such as e.g. geolocalized Twitter.
IV. ABM OF VIRUS SPREADING USING CDRS
We propose an ABM architecture with two main com-ponents: (1) a set of agents that are modeled using theinformation contained in call detail records; and (2) a discreteevent simulator (DES) that simulates the virus propagationover time based on the agents’ models.
A. Agent Generation
We define the behavior of each agent with three models:(1) a mobility model extracted from CDR data; (2) a socialnetwork model computed from CDR data; and (3) a diseasemodel that characterizes the progression of the disease throughits various states in each agent.
1) Mobility Model: The mobility model provides the po-sition (at the BTS level) where the agent is at each momentin time. This model is used by the event simulation processto predict the location of each agent at each simulation step.The temporal granularity of the mobility model determines thegranularity of the simulation steps e.g., if the mobility modelcomputes hourly distributions of locations, the simulation stepwill be one hour.
We propose a mobility model that divides each day into aset S of i non-overlapping equal-length time slots. Formally,the mobility model of agent n, Mn, is defined as:
Mn = {Mwdayn ,Mwend
n } ={{Mwday,0
n , ..,Mwday,in }, {Mwend,0
n , ..,Mwend,in }} ∀i ∈ S
Mwday,in = {pwday,i,0n , . . . , pwday,i,jn } ∀j ∈ B
Mwend,in = {pwend,i,0n , . . . , pwend,i,jn } ∀j ∈ B
(2)where B is the number of BTS towers that give coverageto a geographic area; and pwday,i,jn and pwend,i,jn denote theprobability that agent n may be found at BTS j in timesloti during a weekday or weekend, respectively. Given a CDRdataset, the mobility model is built by associating with eachtime slot i the set of BTSs where each person has beenobserved during weekdays or weekends during the period oftime under study. Note that each individual might be assignedto more than one BTS in a specific time slot i. In this case,the event simulator assigns the position of the tower with thehighest probability, i.e., the BTS that the individual has usedthe most over the training period. Since people tend to showmonotonic behaviors, an average person typically has very fewBTS towers in his/her mobility model. In the cases where atime slot contains no data, which typically happens for timeslots at night, we assume that the person did not move fromthe latest predicted location in time.
As shown by Song et al. in [10], mobility models computedfrom CDRs can accurately predict the real locations of userswith 93% accuracy. However, two pre-requisites need to befulfilled in order to achieve this level of accuracy: (1) individ-uals need to visit more than two locations (BTSs) during thetraining set; and (2) they need an average call frequency of≥ 0.5 calls per hour. Additionally, research by Candia et al.[11] indicates that there exist relevant behavioral differences
between weekend and weekday behaviors and advocate formobility models that can capture such differences. We willexplain details about the computation of our mobility modelsthat satisfy these requirements in Section V.
2) Social Network Model: The social network of an individ-ual plays a key role in virus spreading because it identifies theset of individuals with whom a person has a close relationship.This is specially relevant for viruses that are transmitted bydirect physical contact, like H1N1. We compute the socialnetwork of an agent as the set of individuals with whom therewas at least one reciprocal contact during the time period understudy. By contact, we mean any type of communication: call,SMS or MMS, and does not need to be the same type toimply bidirectionality. Note that an agent can be a member ofmore than one social network. Additionally, given that humansshow clear different behavioral patterns between weekday andweekend, we compute two social networks per agent. Formallyspeaking, the social network Sn of agent n is computed as:
Sn = {Swdayn , Swendn } =Swdayn = {list of reciprocal contacts in wdays}Swendn = {list of reciprocal contacts in wends}
where Swdayn is the social network during the weekdays andSwendsn the social network during the weekends. Given thesocial networks of an agent, we assume that the probabilityof being physically close to another agent will be higherif that other agent is part of its social network. To modelphysical proximity within a BTS coverage area we definetwo probabilities: (1) p1 is the probability that two agentsthat are in the same BTS at the same time of the simulationand are part of the same social network are physically closeenough for the virus to be possibly transmitted; and (2) p2 theprobability that two agents that are in the same BTS and arenot in the same social network at the same moment in timeare physically close for the virus to be possibly transmitted.It is expected for p1 to be larger than p2 given the socialconnection. These two probabilities are a novel contributionof our work since previous ABM approaches did not haveaccess to real behavioral data. It is important to clarify that p1and p2 define the probability of two agents being physicallyclose when they are in the same BTS at the same moment intime. The probability for the infection to occur between thoseagents will be defined by the disease model (explained below).
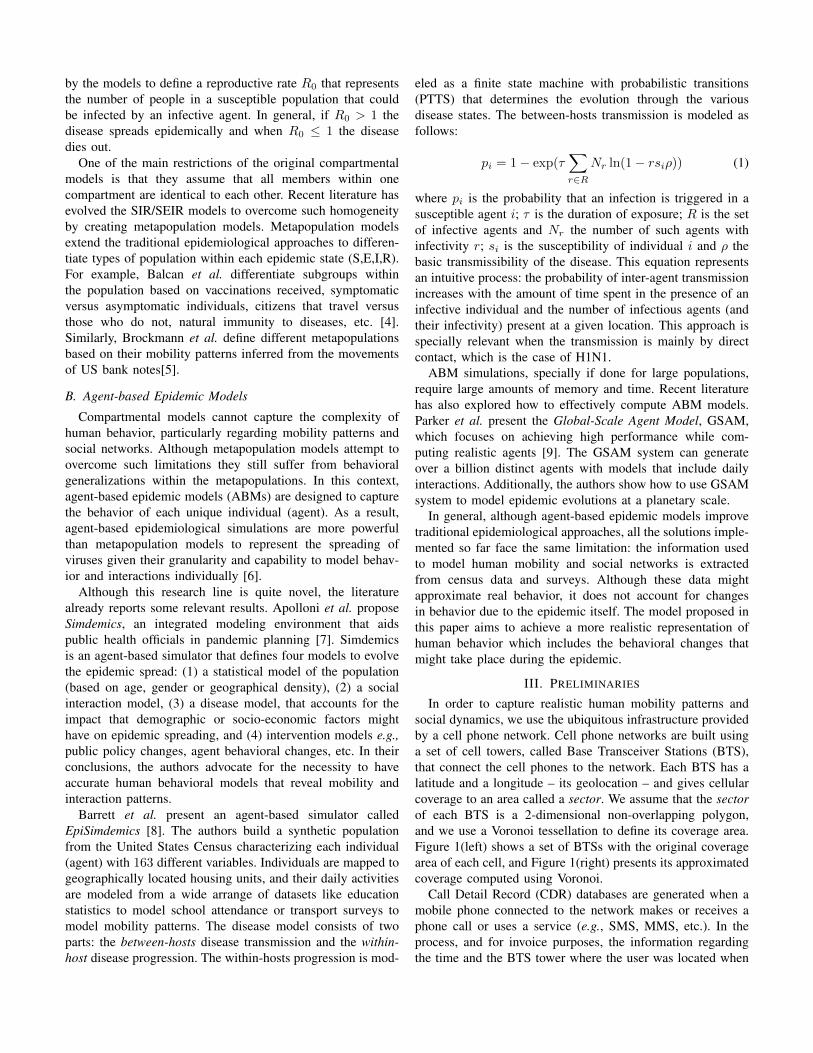
3) Disease Model: The disease model captures the pro-gression of the disease in each agent. This model, togetherwith the mobility and social models, is used by the discreteevent simulator to reproduce the evolution of the disease at aglobal scale. We follow a similar approach to that of Barretet al. [8] and define a disease model that is composed of twoparts: the between hosts transmission model and the withinhost progression model.
In Figure 2 we observe that the between hosts transmissionmodel happens at a probability pi, given by Eq. 1, andrepresents the probability that an agent goes from Susceptibleto Exposed. In our model, we assume that all agents have
the same initial susceptibility and infectivity i.e., ri = 1 andsi = 1∀i.
The within host model represents the evolution from Ex-posed to Infective in a given period of time ε, and fromInfected to Removed in period of time β.
Once an agent reaches the Removed state, it is consideredto be protected from the virus and thus is removed from thesimulation. The specific values of ε and β in Eq. 1 depend onthe disease being modeled and are determined experimentallyfrom epidemiological studies. Details about their computationare given in Section V.
Fig. 2. Disease Model composed of Between hosts and Within hosts models.
B. Discrete Event Simulator
The Discrete Event Simulator (DES) simulates the evolutionof the epidemic spreading for a set of agents over a specific pe-riod of time. To bootstrap the epidemic spreading, we assumethat an initial agent is Infected and starts the transmission.The DES has a global clock and evaluates, at each simulationstep, the state of all the agents in terms of mobility, socialnetwork and disease model. The size of the simulation step isdetermined by the temporal granularity of the mobility model(see next section for computation details). Specifically, theDES does the following consecutive tasks: (1) It identifies thegeographical area (BTS) where each agent is located using themobility model; (2) it identifies the geographical areas wherethere is, at least, one Infective agent; (3) for each Infectiveagent, it takes all the Susceptible agents of his social networkthat are located in the same geographical area (BTS coverage)and applies probability p1 that they will be physically closefor the virus to be transmitted; (4) for each Infective agent andthe rest of Susceptible agents included in its geographical area(not part of its social network), it applies the probability p2 thatthey will be physically close for the virus to be transmitted; (5)for the set of agents physically close obtained from steps (3)and (4), it applies the between hosts transmission probabilityto go from Susceptible to Exposed; (6) for the agents thatare already in the Exposed or Infective state of the diseasemodel, it applies the corresponding progression; and at last(7) it removes from the simulation all agents that have reachedthe Removed state.
These steps are repeated for each simulation step during theoverall simulation time.
V. EXPERIMENTS: THE CASE OF H1N1 IN MEXICO
In case of a pandemic, the World Health Organization(WHO) recommends authoritative bodies to consider the sus-

pension of activities in educational, government and businessunits as a measure to reduce the transmission of the disease.The actions implemented by the Mexican government tocontrol the H1N1 flu outbreak of April 2009 constitute anillustrative example. The actions consisted of alerts and/ormandates aimed at reducing mobility, and where issued inthree stages: (a) a medical alert issued on Thursday, April 16th,which was triggered by the diagnosis of the first H1N1 flucases; followed by (b) the closing of schools and universities,enacted from Monday April 27th through Thursday, April30th; and (c) the suspension of all non essential activities,implemented from Friday, May 1st to Tuesday, May 5th.
The Mexican H1N1 outbreak has been investigated in anumber of recent papers using analytical SIR models [12],agent-based approaches [13], [14] or metamodels [15]. Froma public health perspective, there are studies that focus on clin-ical features, incubation times and transmission channels [16];or on measuring the impact of interventions such as anti-viraldrugs [4], [17] or vaccination campaigns [15]. However, re-search into the impact that the Mexican government mandateshad on the spread of the H1N1 virus and on the mobilityof the population is limited [12]. This is mainly due to thelack of large scale data about social and mobility behavioralpatterns. We overcome these limitations by computing socialand mobility models using Call Detail Records collected froma Mexican urban area during the H1N1 flu outbreak. We usethese models in the ABM system previously presented andmeasure the impact that the actions taken by the Mexicangovernment had on human mobility and subsequently on thespread of the virus. Note that we assume that changes in hu-man behavior are exclusively caused by government mandates.Although it is probably the main cause, there might be otherreasons – such as fear induced by the media– that could alsohave influenced behavioral changes and that are not consideredin our simulations. Next, we describe the experimental setting,the generation of the agents and our results.
Period Date Range Descriptionpreflu 1/1 – 16/4 Period before any H1N1 case has been
discovered. Agents will move largelyunaffected and showing their usual mo-bility patterns.
alert 17/4 – 26/4 April 16th - Diagnosis of H1N1 casesand medical alert triggered the follow-ing day. People may be reacting to thenews and modify their usual mobilitypatterns.
closed 27/4 – 31/4 Schools and Universities closed. Nor-mal behavior disrupted as peoplechange their usual mobility patterns.
shutdown 1/5 – 5/5 Closure of all non-essential activities.reopened 6/5 – 31/5 Restrictions lifted.
TABLE ITIME PERIODS OF STUDY.
A. Experimental Setting
In order to examine the impact of government restrictionswe evaluate changes in the mobility and disease models infive chronological periods. Table I presents the timeline understudy. It covers from January 1st, 2009 to May 31st, 2009.Each period is related to specific events that took placeduring the outbreak i.e., preflu, alert, closed, shutdown andreopening. We generate agents (with corresponding mobilityand social models) for each of these time periods. In orderto measure behavioral changes, we define two scenarios: abaseline scenario and an intervention scenario.
The baseline scenario is built using the mobility and socialmodels obtained during the pre-flu period, when individualsshow normal – not affected by medical alerts – mobilitybehavior. The intervention scenario considers the models thatare built with data from the alert, closed, shutdown andreopened periods. In this case, depending on the moment ofthe simulation, the DES will jump from one set of modelsto the next. The evaluation is done by comparing the resultsobtained by both scenarios. Due to the inherent randomnessof the spreading process we run each scenario 10 times andaverage the results.
B. Generation of Agents
To generate realistic agent mobility and social networkmodels, we collected CDRs from January 1st to May 31st
of 2009 of one of the most affected Mexican cities. Theentire dataset contains around 1 billion CDRs and around 2.4million unique cell phone numbers. Each cell phone number isassociated with one agent and we compute the mobility, socialand disease models for both the baseline and the interventionscenarios.
The mobility models are computed using Eq. 2 with agranularity of one hour. As described in Section IV, we needto fulfill a set of requirements to guarantee that the mobilitymodels computed from CDRs are realistic representations of ahuman’s motion. Following the research carried out by Song etal. [10], we filter the individuals such that only those that (1)are assigned to at least two BTSs throughout the time periods;(2) have a minimum average calling rate of 0.25 calls/hour;and (3) have at least 20% of the hourly time slots filled,are considered. Finally, since we want to measure behavioralchanges during the outbreak, we only take into account agentsthat are active during the five time periods under study.
These requirements narrow down the final number of agentsto 25, 000.
We also build the social network models for the baseline andthe intervention scenarios. As part of these models, we neededto define values for the contact probabilities p1 and p2. In orderto compute their values, we make use of the work by Cruz-Pacheco et al. [12], where the authors examined the effect ofthe government intervention measures on the epidemic spreadusing SIR. We use their simulation to determine the optimalvalues of p1 and p2 as follows: we implement an exhaustivesearch in the range [0 − 1] over all combinations of p1 andp2, using .1 increments. For each pair of values tested, we

run the simulation and obtain a curve representing the numberof infected agents. We select as final p1 and p2 values theones that minimize the mean squared error between our curveand the one presented in Cruz-Pacheco et al. Our searchdetermined that the best values were p1 = 0.9 and p2 = 0.1,i.e., the probability that two agents that are in the same BTSand in the same social network are physically close for theinfection to be transmitted is 0.9, and 0.1 if the agents are notin the same social network.
To build each agent’s disease model, we use the parametersreported in the literature related to the H1N1 outbreak (seeTable II). These parameters are common to both scenarios.Balcan et al. [4] used maximum likelihood analysis of epi-demic simulations to derive values of R0 = 1.75, an infectiousperiod of 60 hours β = 60−1 and a latent state (Exposed) of1.1 days (ε = 26.4 hours). Finally, we compute the value ofρ using R0 as explained in [13]: R0 = ρ
β ; which gives a finalvalue of ρ = 34−1.
Parameter Value DescriptionR0 1.75 Estimated Reproduction number.ε 26.4−1 hours Expected duration latent period.β 60−1 hours Expected duration infectious period.ρ 34−1 hours Expected time before infecting another
agent.
TABLE IIPARAMETERS OF THE DISEASE MODEL.
Once all the agent models have been computed for bothscenarios, we are ready to run both simulations. We initializeour simulations with one infected agent on April 17th (the firstday a case was detected) [12] and run the simulation for 30days. The initial agent infected was chosen to have a medianconnectivity (size of its social network), and located in one ofthe coverage areas that gives service to the airport to simulatea spread started by an agent that had just arrived to the cityby air.
C. Analysis of the Results
In this Section, we compare the results of the interventionscenario with the baseline scenario from three different view-points: (1) a mobility perspective, by comparing changes inmobility; (2) a disease model perspective, by comparing thenumber of susceptible and infected agents; and (3) a spatio-temporal perspective, by comparing the geographical evolutionof the disease spread.
1) Agent Mobility: In order to measure the changes inmobility due to government mandates, we computed for eachscenario the percentage of agents that moved from one BTScoverage area to another one at each step of the simulation (1step = 1 hour). Figure 3 shows the results.
The baseline plot shows a cyclical day/night behaviorthroughout the simulation period. In general, it can be ob-served that at mid-day, more than 60% of the agents changeBTS; whereas that number decreases to less than 20% duringnight hours. We also observe a cyclical behavioral change
during the weekends, where the mobility is reduced when com-pared to weekdays. The intervention scenario shows similarcyclical changes. However, there are a number of importantdifferences when compared to the baseline. There is a signif-icant decrease in mobility on April 27th, precisely when thealert period finishes and the close period starts. This decreasein mobility continues until the beginning of the shutdownperiod. On May 1st and throughout the shutdown period, thereis an even larger decrease in mobility (< 30%) that lasts untilall restrictions are lifted on May 6th. Although the behavioralchange during the shutdown period is mainly caused by thetotal closure implemented by the government, it is importantto note the following facts: (1) The shutdown period includesa weekend, which as observed in the baseline, always impliesreduced mobility; and (2) May 1st and May 5th were nationalholidays in Mexico (Labor Day and Cinco de Mayo), whichfrom a mobility perspective should show a behavior similarto the weekends baseline. To sum up, we can conclude thatduring the intervention scenario there is a reduction in themobility of the agents of 10% during the alert period and ofup to 30% during the closing and shutdown periods, whencompared to the baseline. These differences in the agents’mobility disappear once the reopen period starts (from May6th onwards).
Fig. 3. Percentage of agents that move between BTSs for the interventionand baseline scenarios. The temporal granularity is 1 hour.
2) Disease Transmission: In this section we study the evo-lution of the disease focusing on the number of susceptible andinfected agents in the intervention and baseline simulations.Figure 4 displays the percentage of the population that is inthe susceptible stage of the disease model for a specific dateand time. Results are shown for both the intervention and thebaseline scenarios.
In both cases, we observe that at the beginning of thesimulation (April 17th) all agents are susceptible of beinginfected (except for the initial infected agent that starts thesimulation). As time passes, the evolution of susceptible agentsis described by a sigmoid function. The number of susceptibleagents decreases faster in the baseline scenario, i.e. the numberof infected agents grows faster than in the intervention sce-nario. This result supports the hypothesis that the governmentmeasures taken during the intervention scenario had an impact

on the agents’ mobility patterns and hence managed to reducethe number of infected agents (which implies a larger numberof susceptible agents) when compared to the baseline scenario.The largest difference between both sigmoid functions takesplace during the peak of the epidemic, with approximately a10% less of susceptible agents in the intervention scenario.By the end of the outbreak, the number of susceptible agentsis lower in the baseline than in the intervention scenario (i.e.,more agents were infected in the baseline scenario).
Figure 5 shows the percentage of infected agents duringthe simulation for both scenarios. We observe that the peakof the epidemic in the intervention scenario happens later intime than in the baseline, and has a smaller absolute value.Delaying the peak of epidemics is a priority in interventionstrategies, as the time gained can be used to implement actionssuch as vaccination campaigns, which have to be deliveredbefore the peak in order to be effective. The reduction inmobility and the closure of public buildings delayed the peakof the epidemic by 40 hours.
Another important objective in intervention strategies fo-cuses on limiting the incidence of a disease (measured in %of infected agents) at its peak. In our simulations, the totalnumber of infected agents was reduced by 10% in the peakof the epidemic in the intervention scenario when comparedto the baseline scenario. These results are in agreement withthe ones reported in [12]. In this case, the authors, using tra-ditional disease model techniques (SIR), reported a reductionin prevalence as a result of the government restrictive actionsof 6%− 10%.
Fig. 4. Fraction of susceptible agents in the population over time. Thesecurves are an average of all simulation runs.
3) Spatio-Temporal Evolution: The combination of the mo-bility and disease models provides us with a spatio-temporalrepresentation of the spread of the virus. In fact, we cananalyze the spread not only at a global scale – as done inthe previous section – but at a BTS level. Such analysisgives an understanding of the geographical and chronologicaltransmission of the spread throughout the city.
Figure 6(a) displays the main parts of the city under studyand some of its landmarks, namely the subway system whichconsists of two lines: L1, runs East-West and L2, which runsNorth-South (L2) with one central station in common, C. The
Fig. 5. Fraction of infected agents over time. These curves are an averageof all simulation runs.
downtown area is geographically located around C, E1, E2,E3 and E4, where there are university buildings, governmentoffices and commercial areas. Figure 6(b) shows the BTScoverage areas of the cell towers in the city, computed usinga Voronoi tessellation.
The spatio-temporal analysis allows to study the spreadof the virus in this lattice. Figure 6(c) depicts the numberof infected agents per BTS at 12am on May 2nd (at thepeak of the spreading) in the baseline scenario. Note thatthe downtown area contains the largest number of infectedagents, although residential areas located to the west of the cityare also heavily infected, specially when compared to otherresidential areas. The intervention scenario shows a similar ge-ographical distribution of heavily infected BTS areas, althoughthe number of infected agents is smaller than in the baselinescenario. Analogously, the temporal evolution of the trans-mission follows a similar trend both in the intervention andbaseline scenarios: the spread starts in the airport area (wherethe first infected agent was) and rapidly evolves towards thecity’s downtown area, where it peaks, until it dies out as agentsturn into the Removed stage. This preliminary spatio-temporalanalysis seems to indicate that although behavioral changesdue to government restrictions manage to reduce and containthe epidemic, they do not seem to affect its spatio-temporalevolution.
VI. CONCLUSIONS AND FUTURE WORK
The ability to model and predict the evolution of a virusspreading is a critical issue for governments and health or-ganizations. Although previously proposed ABM systems areable to capture the inherent individuality and randomnessof the process, they have not modeled the spatio-temporaldynamics of human behavior and its potential changes dueto the alarm situation. This limitation is mainly due to thefact that the agents’ behavior is typically built from censusor survey data. In this paper, we have introduced an ABMsystem whose agents’ mobility and social network modelsare built from human behavioral data available in call detailrecords. As a result, the agents’ behavior not only mimics apopulation’s mobility and social patterns, but also the changesof these patterns over time. These changes are critical to

(a)
(b)
(c)
Fig. 6. (a) Map of the city under study with the subway system and referencelandmarks; (b) Division of the city into the BTS coverage areas using aVoronoi tessellation; and (c) Number of infected agents (represented by theheight and color of the bars in each coverage area) in the baseline scenarioat 12am on May 2nd.
achieve realistic spread simulations that allow us to measurethe real impact of the spread.
We have applied the proposed ABM system to CDR datacaptured during the H1N1 outbreak of Mexico in 2009. Inour experiments, we have found that the spread of the viruswas both reduced (by about 10%) and postponed (by about40 hours) thanks to the government mandates. Our analysis,
which focuses on the agents’ mobility and social networks,provides a novel approach to ABM simulations based on realbehavior.
Future work will focus on enriching the agents’ characteri-zation by adding variables such as socio-economic factors andhealth status that will create even more realistic simulationenvironments. We also plan to work on formal methodsto measure changes in the spread from a spatio-temporalperspective so as to enhance the preliminary results presentedin this paper. Finally, we plan to analyze the impact that thelocation, mobility and social connectedness of the first infectedagent has on the spread of the disease.
REFERENCES
[1] J. Epstein, D. Goedecke, F. Yu, R. Morris, D. Wagener, and G. Boba-shev, “Controlling pandemic flu: the value of international air travelrestrictions,” PLoS One, vol. 2, no. 5, p. e401, 2007.
[2] S. Riley, “Large-scale spatial-transmission models of infectious disease,”Science, vol. 316, no. 5829, p. 1298, 2007.
[3] W. Kermack and A. McKendrick, “Contributions to the MathematicalTheory of Epidemics. II. The Problem of Endemicity,” Proceedings ofthe Royal society of London. Series A, vol. 138, no. 834, p. 55, 1932.
[4] D. Balcan, H. Hu, B. Goncalves, P. Bajardi, C. Poletto, J. J. Ramasco,D. Paolotti, N. Perra, M. Tizzoni, W. Van Den Broeck, V. Colizza, andA. Vespignani, “Seasonal transmission potential and activity peaks ofthe new influenza A(H1N1): a Monte Carlo likelihood analysis basedon human mobility.” BMC medicine, vol. 7, p. 45, 2009.
[5] D. Brockmann, L. Hufnagel, and T. Geisel, “The scaling laws of humantravel.” Nature, vol. 439, no. 7075, pp. 462–5, 2006.
[6] A. Apolloni, V. Kumar, M. Marathe, and S. Swarup, “Computationalepidemiology in a connected world,” Computer, vol. 42, no. 12, pp.83–86, 2009.
[7] A. Apolloni, V. A. Kumar, M. V. Marathe, and S. Swarup, “Computa-tional Epidemiology in a Connected World,” Computer, vol. 42, no. 12,pp. 83–86, 2009.
[8] C. L. Barrett, K. R. Bisset, S. G. Eubank, X. Feng, and M. V. Marathe,“EpiSimdemics: an efficient algorithm for simulating the spread of infec-tious disease over large realistic social networks,” in SC’08: Proceedingsof the 2008 ACM/IEEE conference on Supercomputing, 2008.
[9] J. Parker and J. Epstein, “Distributed Platform for Global-Scale Agent-Based Models of Disease Transmission (in press),” ACM Trans. Model.Comput. S., 2011.
[10] C. Song, Z. Qu, N. Blumm, and A.-L. Barabasi, “Limits of predictabilityin human mobility.” Science, vol. 327, no. 5968, pp. 1018–21, 2010.
[11] J. Candia, M. Gonzalez, P. Wang, T. Schoenharl, G. Madey, andA. Barabasi, “Uncovering individual and collective human dynamicsfrom mobile phone records,” Journal of Physics A: Mathematical andTheoretical, vol. 41, p. 224015, 2008.
[12] G. Cruz-Pacheco, L. Duran, L. Esteva, A. A. Minzoni, M. Lopez-Cervantes, P. Panayotaros, A. Ahued Ortega, and I. Villasenor Ruız,“Modelling of the influenza A(H1N1)V outbreak in Mexico City, April-May 2009, with control sanitary measures,” Eurosurveillance, vol. 14,no. 26, 2009.
[13] D. Brockmann, V. David, and A. M. Gallardo, Human Mobility andSpatial Disease Dynamics. Leipzig: Leipziger Universitatsverlag, 2009.
[14] J. M. Epstein, “Modelling to contain pandemics.” Nature, vol. 460, no.7256, p. 687, 2009.
[15] P. Bajardi, C. Poletto, D. Balcan, H. Hu, B. Goncalves, J. Ramasco,D. Paolotti, N. Perra, M. Tizzoni, W. Van Den Broeck, V. Colizza, andA. Vespignani, “Modeling vaccination campaigns and the Fall/Winter2009 activity of the new A(H1N1) influenza in the Northern Hemi-sphere,” Emerging Health Threats Journal, vol. 2, 2009.
[16] V. Shinde, C. B. Bridges, T. M. Uyeki, B. Shu, and et al., “Triple-reassortant swine influenza A (H1) in humans in the United States, 2005-2009.” The New England journal of medicine, vol. 360, no. 25, pp.2616–25, 2009.
[17] C. Barrett, K. Bisset, J. Leidig, A. Marathe, and M. Marathe, “Estimatingthe Impact of Public and Private Strategies for Controlling an Epidemic:A Multi-Agent Approach,” in Innovative Applications of Artificial Intel-ligence, 2009, pp. 34–39.