an analysis of competition and regulatory intervention in india’s...
TRANSCRIPT

An Analysis of Competition and Regulatory Intervention in India’s Television
Distribution and Broadcasting Services
Indian Council for Research on International Economic Relations
March 2019


Indian Council for Research on International Economic Relations
An Analysis of Competition and Regulatory
Intervention in India’s Television Distribution and
Broadcasting Services
Rajat KathuriaMansi Kedia
Richa Sekhani
March 2019

Disclaimer: Opinions and recommendations in the report are exclusively of the author(s) and not of any
other individual or institution including ICRIER. This report has been prepared in good faith on the basis of
information available at the date of publication. All interactions and transactions with industry sponsors and
their representatives have been transparent and conducted in an open, honest and independent manner as
enshrined in ICRIER Memorandum of Association. ICRIER does not accept any corporate funding that comes with
a mandated research area which is not in line with ICRIER’s research agenda. The corporate funding of an ICRIER
activity does not, in any way, imply ICRIER’s endorsement of the views of the sponsoring organization or its
products or policies. ICRIER does not conduct research that is focused on any specific product or service provided
by the corporate sponsor.

i
ACKNOWLEDGEMENT..................................................................................................................iv
EXECUTIVE SUMMARY.................................................................................................................v
1. Introduction ............................................................................................................................ 1
1.1 Broadcasting Services and the Distribution Value Chain 2
1.1.1 Distribution Platform Operators (DPOs) 3
2. Evolution of India’s Television Broadcasting and Distribution Services ................................. 7
2.1 Cable and Direct-To-Home (DTH) Markets in India 11
2.1.1 Cable TV Market in India 11
2.1.2 Direct-To-Home (DTH) Market in India 12
2.1.3 The Relevant Market for Cable TV and DTH 15
2.2 The Rise of Over –the-Top (OTT) Platforms 17
3. Consumer Preferences for TV Broadcasting and Distribution Services in India .................... 18
3.1 Survey Trends Match Secondary Data 18
3.2 Regional Preferences 20
3.3 Preference for DTH over Cable 22
3.4 OTT-an emerging trend 23
4. An Analysis of Tariff Regulation in India .............................................................................. 25
4.1 Summarising the Tariff Orders since 2004 25
4.1.1 History of Tariff Regulations for the Addressable System 26
4.1.2 Evolution of the Digital Addressable System and the Tariff Order of 2016 27
4.2 Analysing the Impact of the New Tariff Order 28
4.2.1 A Comparison of Channel Pricing Before and After the New Tariff Order 30
4.2.2 Literature and Cross-Country Analysis on Tariff Regulation and À la carte versus Bundling 34
5. Conclusions and Policy Recommendations ........................................................................... 39
BIBLIOGRAPHY .......................................................................................................................... 40
APPENDIX ............................................................................................................................... 43
Table of Contents

An Analysis of Competition and Regulatory Intervention in India’s Television Distribution and Broadcasting Services
ii
List of Tables
Table 1.1 Economic impact of the television industry 1
Table 1.2 Advertisement and subscription revenue from Pay-TV industry 2
Table 2.1 Share of revenue collection before and after digitisation of cable TV 12
Table 2.2 History of National MSOs in India 12
Table 2.3a Snapshot of DTH operators 14
Table 2.3b HHI and subscriber market share for DTH operators 14
Table 2.4 Comparison of DTH packages across select countries 15
Table 4.1 À la carte Maximum Retail Prices for general entertainment of standard definition channels reported on December 18, 2018 31
Table 4.2 Price list for base value pack by Broadcasters for DTH operators 32

iii
Figure 1.1 Market share for DPOs in India over time 4
Figure 1.2 DTH and OTT subscribers in India 5
Figure 2.1 Average daily TV viewing time per person in selected countries worldwide in 2017 (in minutes) 10
Figure 2.2 Contribution of channels in advertising revenue (%) 11
Figure 2.3 Number of Active Pay Subscribers for Private DTH Operators (in million) 13
Figure 2.4 Average revenue per user per month (USD) 15
Figure 3.1.1 Type of connection 18
Figure 3.1.2a First favourite DTH operators 19
Figure 3.1.2b Subscribers of DTH operators 19
Figure 3.1.3 Percentage of respondents subscribing to cable operators 20
Figure 3.2.1 State wise type of connections in 2018 20
Figure 3.2.2 Percentage of respondents subscribing to DTH operators across states in 2016 21
Figure 3.2.3 Percentage of respondents watching TV in different languages 22
Figure 3.3.1 Percentage of respondents who agree and completely agree that DTH offers excellent value for money and is more flexible and convenient than cable and offers more value than cable 23
Figure 3.4.1 Percentage of respondent using OTT services 23
Figure 3.4.2 Use of OTT applications in 2018 by level of education 24
List of Figures

An Analysis of Competition and Regulatory Intervention in India’s Television Distribution and Broadcasting Services
iv
We are grateful to all stakeholders for sharing their views and enriching our study.
All errors of course remain our own.
Acknowledgement

v
The television (TV) industry in India is undergoing a digital transformation, as are most other Information Technology (IT) sectors in the economy. While cable television is likely to dominate the market over the next few years, satellite television and online video are the current growth drivers. There has been significant growth of subscribers, industry revenue and availability of services. Much of this growth has been driven by digitisation of cable, higher uptake of High Definition (HD) channels and the increase in smart device penetration resulting in increased consumption through alternate platforms. With 197 million TV households, India is the second largest television market in the world, next only to China. According to the Cable and Satellite Broadcasting Association of Asia (CASBAA), China has over 378 million TV households with a multichannel penetration of 48 per cent. On the other hand, the United States (US) and the United Kingdom (UK) account for 36 per cent and 41 per cent TV households respectively.
The industry has made significant direct and indirect contributions to the economy. According to a Deloitte report titled “Economic Contribution of the Film and Television Industry in India”, the gross value addition by the TV industry in 2017 was INR 65,377 crore. The industry employed 16.44 lakh people in that year. The industry today boasts of more than 800 channels across various genres. Of the total revenue of about INR 66,000 crore, about 40 per cent is attributable to advertising and 60 per cent to distribution and subscription services. For broadcasters, however, subscription revenues (including international subscription) account for only 28 per cent of the total revenue, and the remaining share comes from advertisements. The share of advertisements is expected to increase to 75 per cent by 2020. This trend is sharply different from most other countries, where the share of subscription revenue is higher than advertisement revenue.
Content producers, broadcasters, delivery platform operators (DPOs) and end consumers are constituents of the industry. Content producers develop content for broadcasters, who “up-link” to satellites for distribution
to end consumers through DPOs. DPOs include multi-system operators (MSO), local cable operators (LCO) or direct to home (DTH) operators.
The regulation of content is divided across different authorities and self-regulatory organisations. The broadcasting and distribution segments are regulated by the Ministry of Information & Broadcasting (MIB) and the Telecom Regulatory Authority of India (TRAI) respectively. The focus of this study is DPOs and their contractual arrangements with broadcasters and the impact of regulations on both parties. In technical or regulatory jargon, this is the interconnect agreement between business entities that has a spillover impact on the retail segment.
DPOs in India comprise cable operators, direct-to-home (DTH) operators including Doordarshan’s free satellite services, Internet Protocol Television (IPTV) operators and one Headend in the Sky (HITS) operator. Cable operators are either multi-system operators (MSOs) that run multiple cable TV systems across more than one community or local cable operators (LCOs) that confine services to a single neighbourhood. According to data provided by the Broadcast Audience Research Council (BARC), about 54 per cent households have a cable connection, of which about 80 per cent are digital and the remaining are analogue. Under Section 4A of the Cable Television Networks (Regulation) Act, 1995, mandatory digitisation of cable TV services is already underway. The switch-over to digital is being implemented in a phased manner, Phase I and II of the implementation has already been completed. Recent statistics from the Subscriber Establishment Survey (SES) suggests that 70 per cent of rural India had already been digitised. Cable TV is managed and run by various business houses in India. Some of the prominent national MSOs are Siti cable, Digicable, Hathway Datacom, IndusInd Media & Communication Ltd. and DEN Networks Ltd. There are also a large number of small-sized MSOs. More than half the subscriber base is shared among the top ten MSOs.
Executive Summary

An Analysis of Competition and Regulatory Intervention in India’s Television Distribution and Broadcasting Services
vi
DTH subscribers increased by 6.2 per cent on a year-on-year basis in the quarter April-June 2018. The comparable growth rate for DTH in the quarter April-June 2016 was 52 per cent. Such sharp growth rates are now observable in the OTT video market in India. The number of OTT players increased from just nine in 2012 to 32 in 2018. In 2017, the OTT industry in India achieved phenomenal growth of 160 per cent, as the top 16 OTT platforms saw their user bases grow from 63 million to 164 million between August 2016 and August 2017. These developments are likely to influence the growth of broadcasters and DPOs in the future. There is already a trend among DTH operators and OTT platforms to enter into symbiotic partnerships that in part reflects “coopetition”, a characteristic that reflects both co-operation and competition in an environment of growing uncertainty.
Prices were high when DTH services were first launched. With the entry of new players, competition drove prices downwards. For instance, in 2006, the price for STB and service activation was approximately INR5000. In 2010, it had come down to INR1000. To simplify purchase, DTH service providers bundled channels and priced the entire service offering as a package. There was variety in the bundled offerings using different combinations of channels and interactive services. The DTH prices in India also compare favourably with operators in other countries. Among DTH operators in the country Dish TV in 2018 has the largest market share of 41% as a result of the Videocon and Dish TV merger. The other players are Tata Sky (25%), Airtel (22%) , Sun Direct(11%) and Reliance(1%).
From the perspective of competition analysis, there is tension in defining the relevant market for TV viewing. Most regulators regard DTH and cable TV services as separate markets. Despite this segregation DTH continues to be a competitive threat to cable TV operators and vice-versa. Consumers often have the option to buy either DTH or a cable connection. Consumer’s preferences are based on the quality of service, affordability, breadth of content and the convenience of customer services. For instance, DTH subscribers can relocate across India, without significant
switching costs, but a cable TV operator may not be able to provide services across the country.
Whether cable TV and DTH belong to the same market or not, analysis of data shows that DTH by itself is a competitive market. The market structure for DTH using HHIs reveals as much. Inadequate data and the degree of fragmentation in India’s cable TV market make a corresponding analysis for cable TV services impossible. If both markets are combined, the extent of competition will increase.
The recent surge in OTT platforms adds to the competitive pressure. It is disruptive for both cable and DTH operators. The estimated size of the OTT market in India was $109 million in 2017; this is expected to double to $218 million by 2020. Given the rising number of internet users in India, the OTT video market is gradually becoming a source of mainstream entertainment. As per the BCG report titled “ Entertainment Goes Online “, about 81 per cent of consumers in India have up to three video/OTT apps on their smartphones. The average time spent by Indians (especially millennial) watching videos online has grown to 52 minutes per day in 2018 from a mere two minutes per day in 2012.
In this background, we note that India’s television, broadcasting and distribution industry has been served seven tariff orders since inception. The latest is the “Telecommunication (Broadcasting and Cable) Services (Eighth) (Addressable Systems) Tariff Order”, 2017, to improve transparency, affordability and efficiency. Consumers are allowed access to 100 free-to-air channels for a base price of INR 130 (plus taxes). The consumers have the option to add as many Pay TV channels as they wanted to the basic package. The guidelines also prescribed that bouquet offers could not be priced at less than 85 per cent of the sum of the price of individual channels, preventing forced sales of hugely discounted bouquets, including ‘unwanted’ channels that generate ad revenues for distributors.
The order has been challenged on grounds of TRAIs lack of jurisdiction on content. The Madras High Court has struck down the discount cap of 15 per cent on bouquet prices. TRAI subsequently appealed to the Supreme Court

vii
against the Madras Court order with respect to the discount on bouquet plans, which was set aside by the apex court.
The intent of TRAI is noble-to provide affordable à la carte channels to consumers and a transparent display of rates by broadcasters on an Electronic Programme Guide such that stakeholders across the value chain are benefitted. Although not intended, the order gives broadcasters the power to set retail prices for channels, both à la carte and bouquet. The Order does benefit consumers who wish to watch a particular profile of channels. However, the outcome for households watching multiple profiles of channels will be ambiguous as consumers having to select from a set of almost 800 channels may face inconvenience and ‘post-choice dissatisfaction’.
At the wholesale level, negotiations and price-setting among broadcasters and DPOs is likely to become more transparent and uniform. At the same time, the cost of complying with new regulatory requirements will increase and may affect market efficiency. While competition authorities must examine and purge monopoly abuse of any form, including bundling, ex ante restrictions on bundling in a competitive market
may obviate benefits from being delivered to consumers. Economic theory has established the use of price discrimination strategies such as bundling as efficiency enhancing in competitive markets. TRAI must engage in an outcome analysis of such policy interventions that capture consumer preferences and measure welfare.
Evidence from other countries also supports the thesis of light touch regulation. In Canada, the proposed à la carte regime was estimated to cost almost $670 million of value loss from the television ecosystem. Interestingly, online streaming services are rapidly replacing TV viewership in some of the developed countries. Instead of endless browsing through channels, users of online streaming services can now pick what they want to watch, and when they want it adding to competitive pressures on the traditional TV market. OTT is growing rapidly in India. The TV market in India currently offers multiple choices to consumers. A light touch regulation approach may naturally nudge the industry towards the optimal equilibrium. Over regulation in a competitive market may force consumer choices towards a particular technology. Regulators must place trust in the invisible hand for the industry to achieve its maximum potential.


1
The television (TV) industry in India is undergoing a digital transformation, as are most other Information Technology (IT) sectors in the economy. While cable television is likely to dominate the market over the next few years, satellite television and online video are the current growth drivers. There has been significant growth of subscribers, industry revenue and availability of services. Much of this growth has been driven by digitisation of cable, higher uptake of High Definition (HD) channels and the increase in smart device penetration resulting in increased consumption through alternate platforms. With 197 million TV1 households,2 India is the second largest television market in the world, next only to China. According to the Cable and Satellite
Broadcasting Association of Asia (CASBAA), China has over 378 million TV households with a multichannel penetration3 of 48 per cent. On the other hand, the United States (US) and the United Kingdom (UK) account for 36 per cent and 41 per cent TV households respectively.4
The industry has made significant direct and indirect contributions to the economy. According to a Deloitte5 report titled “Economic Contribution of the Film and Television Industry in India”, the gross value addition by the TV industry in 2017 was INR 65,377 crore. The industry employed 16.44 lakh people in that year. Table1.1 below provides a snapshot of the economic impact of the television industry in India.
1. Introduction
____________________________________________________
1 Television households are defined as the number of television homes using one or more television sets during a specified time period.2 India has 260 million households in total 3 Availability of multichannel television affords consumer with more choices within their usual time slots4 BARC India, Road Show Presentation, May 2018. https://www.barcindia.co.in/RoadShowPresentationFinal.aspx?catid=1&subcatid=515 The impact of the selected verticals is performed by first breaking down the value chain of the vertical and identifying key participants. Then, the value
chain revenue and cost metrics are determined using a combination of secondary research and industry discussions for each part of the chain. The direct impact of an industry is quantified in the following categories: 1. gross output 2. Gross value added (Summation of Earnings before interest, tax, depreciation and amortization (EBITDA) and net indirect taxes) 3. total value added 4. employment
6 Gross Output reflects the combined revenue of all film industry participants. It is derived by adding up revenues of players across the value chain, which also includes revenues of intermediate services / products. It also includes entertainment taxes and service taxes distribution revenues)
7 The industry spends on several items that are produced by other sectors – purchase of cameras, lights and other equipment, hotel accommodation for crew, transportation to locations, etc., encouraging the production/delivery of these goods and services. Further, the industry generates core raw material for several ancillary sectors such as music (which, in turn, drives radio), magazines and books, merchandised products, amusement parks, and gaming.
Table 1.1 Economic impact of the television industry
Gross Output6 (INR crore)
Gross Value added (INR core)
Net Indirect Tax (INR crore)
Total Value Added (INR crore)
Employment (in lakh)
A B C D=B+C E
Direct 73,885 28,411 9,743 38,154 4.93
Production 5,544 3,111 380 3,491 1.51
Broadcasting 28,788 9,467 2,702 12,169 0.27
Distribution 38,523 15,833 6,661 22,494 3.15
Indirect7 80,361 36,966 804 37,770 11.51
Total (Direct + Indirect) 1,54,216 65,377 10,547 75,924 16.44
Source: Deloitte-MPA report, 2018

An Analysis of Competition and Regulatory Intervention in India’s Television Distribution and Broadcasting Services
2
The industry today boasts of more than 800 channels across various genres. Of the total revenue of about INR 66,000 crore, about 40 per cent is attributable to advertising and 60 per cent to distribution and subscription services.8 For broadcasters, however, subscription revenues (including international subscription) account for only 28 per cent of the total revenue, and the remaining share comes from advertisements. The share of advertisements is expected to increase to 75 per cent by 2020.9 This trend is sharply different from other countries, where the share of subscription revenue is higher than advertisement revenue as shown in Table 1.2 below.
1.1 Broadcasting Services and the Distribution Value ChainThe value chain consists of content producers, broadcasters, delivery platform operators (DPOs) and end consumers. Content producers develop content
for broadcasters, who “up-link” content to satellites for distribution to end consumers through DPOs that include multi-system operators (MSO), local cable operators (LCO) or direct to home (DTH) operators. Illustration 1.1 presents a diagram of the industry value chain and identifies the major stakeholders in the industry. There is a trend towards integration in parts of the value chain, reflected in TV channels producing most content in-house. Outsourced TV content usually accounts for only 4 to 5 per cent of the television industry.10 However, digitisation is expected to change the content as well as the broadcasting landscape in India.
The regulation of content is divided across different authorities and self-regulatory organisations. Standards for newspapers and news agencies are overseen by the Press Council of India and the News Broadcasting Standards Authority. The Central Board of Film Certification (CBFC) reviews content for short films, documentaries, television shows and advertisements in
____________________________________________________
8 Re-Imagining India’s M& E sector, Ernst and Young, March 2018
https://www.ey.com/Publication/vwLUAssets/ey-re-imagining-indias-me-sector-march-2018/%24File/ey-re-imagining-indias-me-sector-march-2018.pdf
9 Re-Imagining India’s M& E sector, Ernst and Young, March 2018 https://www.ey.com/Publication/vwLUAssets/ey-re-imagining-indias-me-sector-march-2018/%24File/ey-re-imagining-indias-me-sector-march-2018.pdf
10 Ciston PR news wire, December 2013, https://www.prnewswire.com/news-releases/india-media-and-entertainment-industry-radio-televi-sion-and-broadcast-237297561.html
Table 1.2 Advertisement and subscription revenue from Pay-TV industry
Countries Advertisement Revenue
Subscription Revenue (US $ billion)
Ratio of Advertisement
Revenue to Total Revenue
Ratio of Subscription Revenue to Total
Revenue
China 8.36 19.50 0.30 0.70
India 5.50 3.74 0.60 0.40
USA 70 98.90 0.41 0.59
UK 4.91 8.06 0.38 0.62
Indonesia 2.80 0.80 0.78 0.22
Source: Statista

3
theatres and broadcasting via television. CBFC, however, does not have power to issue guidelines on news and journalistic content. Programme and advertisement codes for regulating content broadcast on television are issued under the Cable Television Networks (Regulation) Act, 1995, and certain standards have been prescribed for content accessible over the internet under the IT Rules 2011.11 The broadcasting and distribution segments are regulated by the Ministry of Information & Broadcasting (MIB) and the Telecom Regulatory Authority of India (TRAI) respectively. The focus of this study is distribution platform operators (DPOs) and their contractual
arrangements with broadcasters and the impact of regulations on both parties. In technical or regulatory jargon, this is the interconnect agreement between business entities that has a spillover impact on the retail segment.
1.1.1 Distribution Platform Operators (DPOs)
DPOs in India comprise cable operators, direct-to-home (DTH) operators including Doordarshan’s free satellite services, Internet Protocol Television (IPTV)12 operators and one Headend in the Sky (HITS)13 operator. Cable operators are either multi-system operators (MSOs)
____________________________________________________
11 Regulation of Media in India, 2011, PRS Legislative Research12 Internet Protocol television (IPTV) is the delivery of television content over Internet Protocol (IP) networks. This is in contrast to delivery through tradi-
tional terrestrial, satellite, and cable television formats. Unlike downloaded media, IPTV offers the ability to stream the source media continuously. As a result, a client media player can begin playing the content (such as a TV channel) almost immediately. This is known as streaming media.
13 Headend in the Sky (HITS) is Comcast’s satellite multiplex service that provides cable channels to cable television operations.
Illustration 1.1 Value Chain of the Television Broadcasting and Distribution Industry
Broadcasters (Television channels &content creators)
Zee Entertainment and Enterprise Limited , Star India Private limited, Viacom 18 Media Private limited
Content Aggregators
Multisystem Operators (MSOs)
(DEN Network, Hathway cable)
DTH operators (Tatasky, Airtel TV)
IPTV Service providers ( MyWay, iControl)
Local cable operators (LCOs)
(Arasu cable, DIGICON)
Consumers
Headend in the Sky (HITS)
NXT DIGITAL
Source: TRAI
An Analysis of Competition and Regulatory Intervention in India’s Television Distribution and Broadcasting Services
4
____________________________________________________
14 Bansal. S (2017). “In pursuit of digitizing India,” Live Mint, https://www.livemint.com/Opinion/BxuAE4da07SbuUCfNrnbdN/In-pursuit-of-digitizing-India.html
15 Prasarbharti.gov.in; http://prasarbharati.gov.in/Free Dish.php16 In telecommunications, triple play service is a marketing term for the provisioning of broadband, television and latency-sensitive telephone over a single
broadband connection17 Broadcast Audience Research Council (BARC)
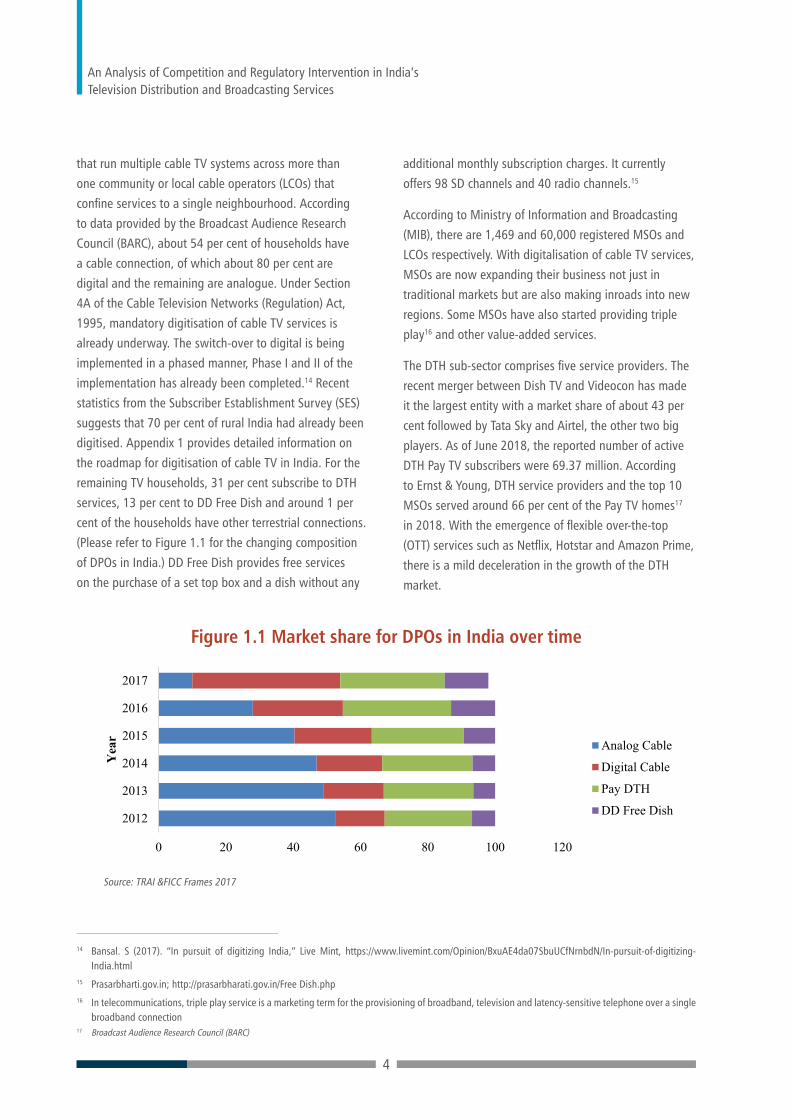
Figure 1.1 Market share for DPOs in India over time
0 20 40 60 80 100 120
2012
2013
2014
2015
2016
2017
% market share
Yea
r Analog Cable
Digital Cable
Pay DTH
DD Free Dish
Source: TRAI &FICC Frames 2017
that run multiple cable TV systems across more than one community or local cable operators (LCOs) that confine services to a single neighbourhood. According to data provided by the Broadcast Audience Research Council (BARC), about 54 per cent of households have a cable connection, of which about 80 per cent are digital and the remaining are analogue. Under Section 4A of the Cable Television Networks (Regulation) Act, 1995, mandatory digitisation of cable TV services is already underway. The switch-over to digital is being implemented in a phased manner, Phase I and II of the implementation has already been completed.14 Recent statistics from the Subscriber Establishment Survey (SES) suggests that 70 per cent of rural India had already been digitised. Appendix 1 provides detailed information on the roadmap for digitisation of cable TV in India. For the remaining TV households, 31 per cent subscribe to DTH services, 13 per cent to DD Free Dish and around 1 per cent of the households have other terrestrial connections. (Please refer to Figure 1.1 for the changing composition of DPOs in India.) DD Free Dish provides free services on the purchase of a set top box and a dish without any
additional monthly subscription charges. It currently offers 98 SD channels and 40 radio channels.15
According to Ministry of Information and Broadcasting (MIB), there are 1,469 and 60,000 registered MSOs and LCOs respectively. With digitalisation of cable TV services, MSOs are now expanding their business not just in traditional markets but are also making inroads into new regions. Some MSOs have also started providing triple play16 and other value-added services.
The DTH sub-sector comprises five service providers. The recent merger between Dish TV and Videocon has made it the largest entity with a market share of about 43 per cent followed by Tata Sky and Airtel, the other two big players. As of June 2018, the reported number of active DTH Pay TV subscribers were 69.37 million. According to Ernst & Young, DTH service providers and the top 10 MSOs served around 66 per cent of the Pay TV homes17 in 2018. With the emergence of flexible over-the-top (OTT) services such as Netflix, Hotstar and Amazon Prime, there is a mild deceleration in the growth of the DTH market.

5
Figure 1.2 DTH and OTT subscribers in India
6
Figure 1.2 DTH and OTT subscribers in India
Source: TRAI and newspaper articles
29.1
14.6
7.6
0.7
17.3
0.0
5.0
10.0
15.0
20.0
25.0
30.0
35.0
Dish TV Airtel Sun Direct Reliance Tatasky
Subs
crib
er in
mill
ion
400
75
22 11 5 5 0
50
100
150
200
250
300
350
400
450
Youtube Hotstar Voot Amazon Sony Liv NetflixSu
bscr
iber
bas
e in
Mill
ion
Source: TRAI and newspaper articles
According to industry statistics reported by TRAI, active DTH subscribers increased by 6.2 per cent on a year-on-year basis in the quarter April-June 2018. The comparable growth rate for DTH in the quarter April-June 2016 was 52 per cent. Such sharp growth rates are now observable in the OTT video market in India. The number of OTT players increased from just nine in 2012 to 32 in 2018. In 2017, the OTT industry in India achieved phenomenal growth of 160 per cent, as the top 16 OTT platforms saw their user bases grow from 63 million to 164 million between August 2016 and August 2017.18 These developments are likely to influence the growth of broadcasters and DPOs in the future. There is already a trend among DTH operators and OTT platforms to enter into symbiotic partnerships that in part reflects “coopetition”, a characteristic that reflects both co-operation and competition in an environment of growing uncertainty.19
In periods of technological uncertainty, regulation matters even more than at other times. One disruption
accompanied by another is a burden that tests even the best of firms. The extent and nature of regulatory intervention, therefore, is critical for healthy growth during periods of technological change. Technology is upending markets – the relationships between players and the way consumers watch content is changing rapidly. Trends in digitisation have led to significant changes in content packaging and applicable tariffs. TRAI in its consultation paper dated January 29, 2016,20 argued for a review of pricing strategies to check malpractices in channel pricing, and to make processes more uniform and transparent to enhance consumer welfare. In a tariff order issued by TRAI in March 2017, consumers were allowed access to 100 free-to-air channels for a base price of INR 130 (plus taxes). The consumers had the option to add as many Pay TV channels as they wanted to the basic package. The guidelines also prescribed that bouquet offers could not be priced at less than 85 per cent of the sum of the price of individual channels, preventing forced sales of hugely
____________________________________________________
18 http://www.satiitv.com/tech/it/demand-for-original-content-is-rising-growth-of-ott-market-largely-depends-on-it/19 Tata Sky and Netflix to join hands for the next innovation in content delivery https://www.Tata Sky.com/wps/portal/Tata Sky/footerpages/media room/tata-sky-and-netflix-partnership20 Consultation Paper on Tariff Issues Related to TV Services, Consultation Paper No.: 01/2016 https://trai.gov.in/sites/default/files/CP_Tariff_issues_29_
Jan_2016_final.pdf
An Analysis of Competition and Regulatory Intervention in India’s Television Distribution and Broadcasting Services
6
discounted bouquets, including ‘unwanted’ channels that generate ad revenues for distributors. Furthermore, while the price of channels was earlier negotiated in the form of an “understanding” between television broadcasters and distributors, they must now be pre-determined and announced by the broadcasters to the public. Distributors would be paid a carrying fee as a percentage of this price. These measures were introduced to enhance consumer welfare.
The order generated mixed reactions. Respondents supporting the order have upheld this as a means to improve transparency and create a level playing field for all stakeholders. On the other hand, critics find the order excessive, greatly limiting the ability of broadcasters and distributors to respond to market needs. The focus of this
study is to understand the market structure and the level of competition in India’s broadcasting and distribution services. The study will also examine conduct of service providers in the market and on that basis argue for regulatory oversight. Accordingly, the study has been structured as follows. Section 2 traces the evolution of TV broadcasting and distribution services in India with special focus on the cable and DTH industry. Section 3 analyses consumer preferences in the purchase of media content and subscription of distribution packages. This analysis is based on primary data collected by Nielsen. In Section 4, we critically analyse recent regulatory interventions in this market in India, underpinning the analysis in economic theory and international best practices. Section 5 concludes.

7
2. Evolution of India’s Television Broadcasting and Distribution Services
In 1959, television broadcasting started on an experimental basis in India. For the next 17 years, it spread haltingly. By 1976, the network consisted of eight television stations covering a population of 45 million spread over 75,000 square kilometres. Faced with the difficulty of administering such an extensive television system, the government constituted Doordarshan, the national television network, as a separate department under the Ministry of Information and Broadcasting. Terrestrial broadcasting saw a major expansion with the introduction of colour television during the 1982 Asian Games held in Delhi. Three noticeable events have been significant in the evolution of the industry. The Satellite Instructional Television Experiment (SITE) conducted between August 1975 and July 1976 was the first-time television was brought closer to the masses. The experiment broadcast educational programmes to 2,400 villages across six states21 in India. The second event was the launch of INSAT-1A in 1982, India’s first domestic communications satellite. It enabled networking across all regional stations of Doordarshan. The third significant event was the launch of satellite TV by foreign programmers like CNN and Star in the early nineties. Domestic broadcasters followed suit; Zee TV and Sun TV were soon broadcasting to Indian homes.
Liberalisation in the early 1990s enabled the entry of private and foreign broadcasters. The number of channels
began to increase very rapidly. Entrepreneurs set up small cable TV networks and began broadcasting local video channels including music videos within neighbourhoods. Satellite television and the launch of channels by CNN, Zee and STAR led to the birth of national multi-system operators (MSOs) and local cable operators (LCOs) who aggregated and distributed broadcast content to consumers. Several national and regional operators entered the sector. Siti Cable launched its services in June 1994. In 1998, the Rajan Raheja Group ventured into cable services owning 100 per cent equity in Hathway Cable & Datacom. Other prominent MSOs include Digicable, IndusInd Media & Communication Ltd. and DEN Networks Ltd. Illustration 2.1 traces the evolution of broadcasting and distribution services in India.
In its early years, cable TV distribution was driven by thousands of small scale operators. It was mostly unorganised, fragmented and unregulated. Analogue cable TV was identified with poor quality service and concerns regarding lack of transparency in revenue reporting. The government issued the Cable TV Network (Regulation) Ordinance in 1994 that set down rules for the registration of Cable TV operators. To regulate their operations further, the Cable Television Networks (Regulation) Act 22 was enacted in 1995. However, significant changes in policy were brought about by the New Telecom Policy, 1999.
____________________________________________________
21 Evaluation Report On Satellite Instructional Television Experiment (Site) - 1981 http://planningcommission.nic.in/reports/peoreport/cmpdmpeo/vol-ume2/erosi.pdf
22 The object of the Act was to regulate the ‘haphazard mushrooming of cable television networks’. Due to the lack of a licensing mechanism for cable operators, there were a large number of cable operators, broadcasting programmes without any regulation. The Act aimed at regulating the content and operation of cable networks.

An Analysis of Competition and Regulatory Intervention in India’s Television Distribution and Broadcasting Services
8
Illustration 2.1 Evolution of India’s Television Broadcasting and Distribution Services
. •Regular daily transmission started in 1965 as part of All India Radio •Cable Television Networks (Regulation) Act 1995 •TV services were separated from radio services
1960-1970
1992-95 1982
1990-91
•Emergence of MSOs with PAN-India presence •Channels go encrypted/ Pay •Boom in Number of channels (+300) •Cable Television Services were brought under the Telecom Regulatory Authority of India in 2004 •Emergence of digitisation •DEN started operation in 2007
1959
Terrestrial Television in India started with experimental telecast starting in Delhi in 1959
.
•Star, Zee, Sony and few other players established themselves •20-30 channels on air •first private TV channels in the Tamil-language; Sun TV (India) launched
1995-2010
2011-14
• Bill on digitisation of Cable TV introduced: Shift from Analogue to Digitisation Notification •DAS Phase 1 and Phase 2 digitisation achieved (27 million digital subscribers)
•Digitisation in Phase 3 and Phase 4 expected to be completed •More than 94 million digital subscribers projected by end of 2019
•Emerging new technologies like IPTV, PVR, OTT
•Liberalisation of the broadcasting industry. •Government allowed private and foreign broadcasters to engage in limited operation in India • Hathway Cable & Datacom Ventured into India in 1998
•Introduction of National Telecast •Launch of Colour TV in India
2015-2020
•Number of permitted private satellite channels : 45 in 2001 to 867 in June 2018 •Pay cable TV subscribers 102 million in 2016 •DTH subscribers 69.37 million in June 2018 •There are 48 pay broadcasters, 1,469 registered multiple system operators (MSOs) and 60,000 local cable operators (LCOs) •OTT video revenue in India has been pegged at INR 2,019 crore in 2017 and is expected to reach INR 5,595 crore by 2022
Source: Compiled by Author
____________________________________________________
23 In particular, NTP 1999 recommended that cable service providers be allowed to (a) provide last mile linkages and switched services within their areas of operation; (b) operate one-way entertainment related services; and (c) have direct interconnections and share infrastructure with any other type of service provider in their area of operation. With regard to interconnection between service providers in different service areas, the NTP 1999 recom-mended that the matter, along with other matters such as appropriate licensing for cable network operators, be reviewed in consultation with TRAI.
In view of the convergence that was likely to emerge across technologies, NTP 199923 categorised cable service providers as “access providers” – together with mobile service providers and fixed access providers. The next major change in the policy framework was brought on account of complaints received by the government on pricing of services, bundling of channels, and concealment of actual revenue earned by cable service providers. The government set up a special task force
that recommended cable operators to provide content only through conditional access systems (CAS). This was expected to address issues related to transparency and consumer welfare.
Subsequently, the government announced a series of measures to implement CAS. A 2003 notification mandated cable operators in Chennai, Mumbai, Delhi and Kolkata to transmit pay channels only through

9
____________________________________________________
24 This requirement, however, faced significant opposition from cable service providers and consumers alike, leading to the government indefinitely sus-pending the operation of the notification. The government’s decision was subsequently challenged in the Delhi High Court, leading them to ultimately refer the matter of implementing CAS to TRAI in January 2004.
25 Kathuria. R (2004). “Trade In Telecommunication Services: Opportunities and Constraints,” Working Paper No. 149. http://icrier.org/pdf/wp149.pdf26 BARC India Road Show Presentation, https://www.barcindia.co.in/RoadShowPresentationFinal.aspx?catid=1&subcatid=51
an addressable system.24 Two other notable changes that facilitated digitisation of the industry were the introduction of DTH services followed by the permission for operation of HITS services. In January 2001, the government granted permission for the reception and distribution of television signals in the “Ku band”, marking the beginning of DTH broadcasting in India. In 2003, the government permitted two companies to provide HITS services to expedite implementation of CAS. Policy guidelines for HITS services were eventually issued by the Ministry of Information and Broadcasting (MIB) in November 2009. Illustration 2.2 traces the evolution of policies for the sector from 1995 to 2017.
The series of regulations sparked an important transition in the television market in India, which had so far been limited to the services of Doordarshan, available only to a privileged 20 per cent of India. One can draw comparisons with the telecom sector in India which was owned and operated by the government until its liberalisation in the 1990s. The New Telecom Policy (NTP) 1999 altered the telecom landscape in India beyond recognition. It paved the way for unlimited entry of new players and all tariffs, except those applicable in rural areas, were brought to forbearance. Forbearance implied that service providers were free to decide retail tariffs subject to regulatory intervention in the event of anti-competitive or predatory conduct. This was a significant transformation from the policy that existed before 1999 when tariffs were tightly regulated and had to be reported to TRAI before implementation. Currently, the providers do not have to report tariffs prior to implementation, and non-discrimination in the matter of retail tariffs has been dispensed with. Bundling, segmentation across subscriber types, customisation, etc., have emerged as popular pricing strategies to compete in the market, which now boasts of serving the second
largest telecom market in the world at the lowest voice and data prices.25 Deregulation has democratised access in both the telecom and television industries and have destroyed privileges.
By 2005, India had more than 200 digital channels. A 2011 amendment of the Cable Television Networks (Regulation) Act, 1995, mandated digitisation of cable TV networks. The policy has not only enhanced viewership in India but also led to an increase in the number of channels from around 45 in 2001 to 603 in 2010 to 866 in September 2018, at a compounded annual growth rate of 19 per cent. This includes 309 pay channels of which 213 are standard definition (SD) and 96 are high definition (HD). The number of HD channels increased by 41 per cent between 2016 and 2017.26
Currently, India has one of the largest terrestrial networks in the world. The choice in channels and content available has led to a surge in the average time spent by both urban and rural TV viewers in India. According to BARC’s 2018 Broadcast India (BI) Survey, the average time spent by an individual viewing TV content is 3 hours 44 minutes. In urban areas, the average time spent per viewer is about 4 hour 06 minutes, while that for rural consumers is 3 hours and 27 minutes. Regional differences also exist; viewers in the South spend much more time viewing TV content as compared to the Hindi speaking consumers in the north. Figure 2.1 provides an international comparison of time spent viewing TV content across 15 countries. The growth in channels and viewership has also contributed to the growth in advertising revenue. The reported number of advertisers in 2017 was 12,964 with almost 70 million insertions. Advertising revenue increased from INR24, 300 crore in 2016 to INR26, 700 crore in 2017. Hindi movie channels account for the highest share of advertising revenue.

An Analysis of Competition and Regulatory Intervention in India’s Television Distribution and Broadcasting Services
10
Illustration 2.2 Policy Evolution in India’s Television Broadcasting and Distribution Services
.
1997
2004 2000
2001
1995
Cable TV Act
.
2005 2007
TRAI Act
SATCOM policy and
Uplink Guidelines
DTH and HITS Guidelines
Broadcasting Regulation
entrusted to TRAI
Downlinking Guidelines
2006
IPTV Guidelines
Sports Broadcasting
Act
2009
HITS Guidelines
2011
•Uplink/ Downlink Guidelines
Revised •Cable
Digitisation
2012
•Regulatory Framework for
Digital Cable Addressable
System •New Telecom
Policy
2014
•TRP Guidelines
• New Regulatory Framework for
Digital Cable Addressable
System
2017
Source: Compiled from TRAI
Figure 2.1 Average daily TV viewing time per person in selected countries worldwide in 2017 (in minutes)
12
Figure 2.1 Average daily TV viewing time per person in selected countries worldwide in 2017 (in minutes)
Source: Statista
Figure 2.2 Contribution of channels in advertising revenue (%)
Source: BARC
Convergence in technologies and rapid adoption of the Internet has led to the emergence of OTT and IPTV players. India has nearly 30 active OTT platforms 27 and the market is expected to grow further, doubling over the next four years, to reach US$218 million in FY2020 from US$109 million in 2017.28 OTT platforms are continuously evolving their business model following a broad strategy of “everything for everyone”. These developments are likely to have implications for the growth of the cable and DTH markets in India.
27 Deloitte (2018). “Economic Contribution of the Film and Television Industry in India, 2017”,
https://www.mpa-i.org/wp-content/uploads/2018/05/India-ECR-2017_Final-Report.pdf 28 ibid.
224 270 264 262 254 248 248 233 223 223 212 193 188 183
148
0
50
100
150
200
250
300
Ave
rage
Dai
ly T
V v
iew
ing
per
pers
on (i
n m
inut
es)
10 5
4 3 7
5 3
5 4 3
53
Hindi Movies
Hindi news regional
Telugu news
Tamil news
Hindi news
Hindi Music
Bangla News
Hindi GEC
Tamil GEC
Bangla GEC
others
Source: Statista

11
Figure 2.2 Contribution of channels in advertising revenue (%)
12
Figure 2.1 Average daily TV viewing time per person in selected countries worldwide in 2017 (in minutes)
Source: Statista
Figure 2.2 Contribution of channels in advertising revenue (%)
Source: BARC
Convergence in technologies and rapid adoption of the Internet has led to the emergence of OTT and IPTV players. India has nearly 30 active OTT platforms 27 and the market is expected to grow further, doubling over the next four years, to reach US$218 million in FY2020 from US$109 million in 2017.28 OTT platforms are continuously evolving their business model following a broad strategy of “everything for everyone”. These developments are likely to have implications for the growth of the cable and DTH markets in India.
27 Deloitte (2018). “Economic Contribution of the Film and Television Industry in India, 2017”,
https://www.mpa-i.org/wp-content/uploads/2018/05/India-ECR-2017_Final-Report.pdf 28 ibid.
224 270 264 262 254 248 248 233 223 223 212 193 188 183
148
0
50
100
150
200
250
300
Ave
rage
Dai
ly T
V v
iew
ing
per
pers
on (i
n m
inut
es)
10 5
4 3 7
5 3
5 4 3
53
Hindi Movies
Hindi news regional
Telugu news
Tamil news
Hindi news
Hindi Music
Bangla News
Hindi GEC
Tamil GEC
Bangla GEC
others
Source: Statista Source: BARC
____________________________________________________
27 Deloitte (2018). “Economic Contribution of the Film and Television Industry in India, 2017”, https://www.mpa-i.org/wp-content/uploads/2018/05/India-ECR-2017_Final-Report.pdf
28 ibid.29 Rose. J and A. Frank (2016). “The Future of Television: Where the US Industry is Heading”, BCG https://www.bcg.com/en-in/publications/2016/me-
dia-entertainment-technology-digital-future-television-where-us-industry-is-heading.aspx30 TRAI Consultation Paper on Tariff Issues Related to TV Services January 29, 2016 http://cablequest.org/pdfs/trai/trai-issues-consultation-paper-no-1-
2016-on-tariff-issues-related-to-tv-services-29-jan-16.pdf
Figure 2.2 provides the share of advertising revenue for different channel genres.
Convergence in technologies and rapid adoption of the Internet has led to the emergence of OTT and IPTV players. India has nearly 30 active OTT platforms27 and the market is expected to grow further, doubling over the next four years, to reach US$218 million in FY2020 from US$109 million in 2017.28 OTT platforms are continuously evolving their business model following a broad strategy of “everything for everyone”. These developments are likely to have implications for the growth of the cable and DTH markets in India.
2.1 Cable and Direct-To-Home (DTH) Markets in India
2.1.1 Cable TV Market in India
Cable TV has not only seen tremendous growth during the last decade, it has also fought back the growth of
alternate technologies. Even in developed countries like the US, six cable operators command 70 per cent market share in the in-home entertainment industry.29 As already highlighted, analogue dominated cable TV services in its early years. In 2017, the reported number of Indian households with a cable connection was 98.5 million; the share of analogue connections was only a meagre 12 per cent, the rest being digitised. The transition to digitised cable TV has led to an increase in revenue collection from end users (Refer Table 2.1).
Cable TV is managed and run by various business houses in India. Some of the prominent national MSOs are Siti cable, Digicable, Hathway Datacom, IndusInd Media & Communication Ltd. and DEN Networks Ltd. There are also a large number of small-sized MSOs. More than half the subscriber base is shared among the top ten MSOs.30 (Please Refer to Table 2.2 for the growth of India’s biggest MSOs).There are several regional MSOs including ACT, Fastway, GTPL, KAL Cables (Sumangali), Ortel,

An Analysis of Competition and Regulatory Intervention in India’s Television Distribution and Broadcasting Services
12
Table 2.1 Share of revenue collection before and after digitisation of cable TV
Before Digitisation After Digitisation
Consumer ARPUs 100% 100%
LCOs 65%-80% 45%-55%
MSOs 10%-20% 15%-25%
Broadcaster 10%-20% 20%-30%
Source: FICCI-EY, 2018 report
Table 2.2 History of National MSOs in India
Cable Companies/ Indicators Hathaway Den Siti
Digicable Network (inc. Fastway Transmission)
Year of Establishment 1998 2007 1994 2007
Broadband subscribers 0.7 million 0.1 million 0.2 million 0.03 million
Cable television Households
7.5 million 11.6 million 13.2 million 8.7 million
Non-Digitised cable Subscribers
0.3 million 0.3 million 1.6 million 4.5 million
Digital cable Subscribers 7.2 million 11.3 million 11.6 million 4.2 million
Monthly ARPU digital cable
US$4 US$4 US$4 US$3
Monthly ARPU* cable broadband
US$10 US$12 US$10 US$7
Annual Revenue INR 4,955 million INR 6670 million INR 1700 million NA
Geographical Presence 13 states and 350 + towns and cities
13 states and 500+ towns and cities
21 states and 580+ towns and cities
14 states and 125 locations in 46 cities
Source: Hathway Cable and Datacom Limited Investor Presentation – August 2017, Den Network Limited Investors Presentation, 2017; Siti Investors presentation, 2017 and Website of Digicable (Monthly ARPU by service is taken from MPA report, 2017).* Average revenue per user (ARPU),, is a measure used primarily by consumer communications, digital media, and networking companies, defined as the total revenue divided by the number of subscribers.
Asianet, Tamil Nadu Arasu Cable TV (TACTV) Corporation Ltd., Manthan, JAK Communications and Darsh Digital. These are mostly small-scale with a subscriber base of a few thousand.
2.1.2 Direct-To-Home (DTH) Market in India
Direct-to-home (DTH) refers to the distribution of multi-channel TV programmes by using satellites that beam directly to subscriber premises. Since its introduction

13
in 2003, DTH services have grown rapidly. One of its fastest growing segments is Pay TV. The growth in DTH is attributed to rising per capita income and quality of services delivered by the operators. The active subscriber base for DTH in the quarter ending June 2018 was 69.3731 million;32 the subscriber base has been growing at a compounded annual growth rate (CAGR) of 17 per cent since 2009 (Refer to Figure 2.3 for the growth in pay subscribers). According to Media Partners Asia (MPA), the active subscriber base for DTH is likely to grow to 76.6 million by 2020.
The merger between DishTV and Videocon has left the Indian market with only five private DTH service providers. The merger has displaced Tata Sky and Airtel from their leading positions. Dish TV and Videocon together account for 43 per cent of the market share,
while that for Tata Sky and Airtel is 25 per cent and 21 per cent respectively. The Herfindahl-Hirschman Index (HHI)33 calculations over the last four years also reflect a fairly competitive DTH industry, with the exception of the recent merger that has bumped up the HHI. However, it does not immediately establish the abuse of market power. (Please refer to Table 2.3a and 2.3b). The fact that this merger was allowed by CCI indicates that the market was competitive to begin with and, in the opinion of the competition regulator, will remain adequately competitive after the merger.
Among DTH operators in the country, DD Free Dish has grown to become the largest with about 30 million subscribers (mostly rural) as of 2017. The current offering is about 80 channels; DD Free Dish intends to increase the count to 256 channels by 2020. According to EY
____________________________________________________
31 This is in addition the subscribers of free DTH services of Doordarshan32 TRAI performance Indicator Report , 2018 https://trai.gov.in/sites/default/files/PIReport27062018_0.pdf33 The Herfindahl-Hirschman Index (HHI) is measured using the formula H = where si is the market share of firm i in the market and N is the number of
firms. While it takes into account all firms in the industry, it assigns greater weight to the larger sized firms in an industry. The value of the index varies between 0 to 1 or (0 to 10000). The index takes the value 1/n to 0 in the case of many equal sized firms under perfect competition and 1 for monopoly. HHI = s1^2 + s2^2 + s3^2 + ... + sn^2 (where s is the market share of each firm expressed as a whole number, not a decimal)
Figure 2.3 Number of Active Pay Subscribers for Private DTH Operators (in million)
15
Figure 2.3 Number of Active Pay Subscribers for Private DTH Operators (in million)
Source: Compiled from TRAI performance Indicator Report
The merger between DishTV and Videocon has left the Indian market with only five private DTH service providers. The merger has displaced Tata Sky and Airtel from their leading positions. Dish TV and Videocon together account for 43 per cent of the market share, while that for Tata Sky and Airtel is 25 per cent and 21 per cent respectively. The Herfindahl-Hirschman Index (HHI)33 calculations over the last four years also reflect a fairly competitive DTH industry, with the exception of the recent merger that has bumped up the HHI. However, it does not immediately establish the abuse of market power. (Please refer to Table 2.3a and 2.3b). The fact that this merger was allowed by CCI indicates that the market was competitive to begin with and, in the opinion of the competition regulator, will remain adequately competitive after the merger.
Table 2.3a Snapshot of DTH operators
Company Established Owners ARPU (2018)
Revenue (INR Crore) (March
2018) 1 Dish TV 2004 Essel Group 214 1,655.6 Videocon D2H 2009 Videocon 2 Tata Sky 2006 Tata Sons 270-300 5719 3 Airtel Digital 2008 Bharti Airtel 175 NA 4 Reliance Digital TV 2008 Reliance ADAG 233 958.5 5 Sun Direct 2008 Sun TV 105 1139 6 DD Free Dish 2004 Prasar Bharti NA NA
Source: Compiled from TRAI and newspaper articles
33 The Herfindahl-Hirschman Index (HHI) is measured using the formula H = where si is the market share of
firm i in the market and N is the number of firms. While it takes into account all firms in the industry, it assigns greater weight to the larger sized firms in an industry. The value of the index varies between 0 to 1 or (0 to 10000). The index takes the value 1/n to 0 in the case of many equal sized firms under perfect competition and 1 for monopoly. HHI = s1^2 + s2^2 + s3^2 + ... + sn^2 (where s is the market share of each firm expressed as a whole number, not a decimal)
01020304050607080
2009 2010 2011 2012 2013 2014 2015 2016 2017 2018
Subs
crib
ers i
n m
illio
n
Source: Compiled from TRAI performance Indicator Report

An Analysis of Competition and Regulatory Intervention in India’s Television Distribution and Broadcasting Services
14
____________________________________________________
34 This is the strategy in which new services are introduced at high prices. DTH services are positioned as high-quality premium products. The pricing strategy supports the perception of high-quality services.
Table 2.3a Snapshot of DTH operators
Table 2.3b HHI and subscriber market share for DTH operators
Company Established Owners ARPU (2018) Revenue(INR Crore) (March 2018)
Dish TV 2004 Essel Group214 1,655.6
Videocon D2H 2009 Videocon
Tata Sky 2006 Tata Sons 270-300 5719
Airtel Digital 2008 Bharti Airtel 175 NA
Reliance Digital TV 2008 Reliance ADAG 233 958.5
Sun Direct 2008 Sun TV 105 1139
DD Free Dish 2004 Prasar Bharti NA NA
Source: Compiled from TRAI and newspaper articles
Market Share for 2018
Market Share for 2017
Market Share for 2016
Market Share for 2015
Tata Sky 25 23 23 21.52
Reliance 1 2 2 3.19
Sun Direct 10 9 10 10.18
Airtel 21 21 20 20.26
Dish TV43
25 25 24.92
Videocon 20 20 19.93
HHI 3016 1680 1658 1608.39
Source: Author Estimates based on data from TRAI
estimates, assuming that the new tariff order and Digital Addressable system (DAS) phase IV are implemented as per schedule, the subscriber base for DD Free Dish could increase to 46 million by 2020. The discontinuation of analogue cable transmission will require consumers, particularly those in DAS III and IV markets, to make a choice – opt for more expensive cable TV options, DTH or terrestrial TV options such as Free Dish. Given that they would have to invest in hardware, a set top box
(STB) and perhaps a dish, price sensitive consumers are likely to choose free TV services in the immediate term. This will significantly affect the uptake of Pay TV channel subscriptions and the accrual of subscription income.
A price skimming strategy was visible when DTH services were first launched.34 With the entry of new players, competition drove prices downwards. For instance, in 2006, the price for an STB and service activation was

15
approximately INR5000. In 2010, it had come down to INR1000. To simplify purchase, DTH service providers bundled channels and priced the entire service offering as a package. There was variety in the bundled offerings using different combinations of channels and interactive services. Appendix 2 provides details on some of the packages offered by various DTH operators.
The DTH prices in India compare favourably with operators in other countries. Table 2.4 provides a comparison of DTH bundles, including number of channels and pricing, offered by operators in select
countries.
2.1.3 The Relevant Market for Cable TV and DTH
Cable TV networks and DTH platforms are the two most widely used distribution channels in India’s television viewing market, with cable currently being the dominant platform. While the platforms vary by technology and quality of service delivered, they are similar with respect to content delivered. Moreover, the average revenue per user (ARPU) collected by cable TV operators has increased over time while that for DTH operators is range bound. Payment cycles for the two sets of operators also differ – while most cable TV subscriptions are post-paid, DTH is largely a prepaid service.
Table 2.4 Comparison of DTH packages across select countries
DTH provider Country Pack names Channels Monthly Price (USD PPP) as of December 2017
Tata Sky India My99 channel pack 248 5.53
Astro Malaysia Family (without mini package) 40 26.3
True Vision Thailand Happy Family 109 24.3
Sky UK Entertainment 350 22
DirectTV USA Select 155 35
Source: The pack name and channels and prices are compiled from the respective operator’s website. All prices in US dollars at prevailing PPP
Figure 2.4 Average revenue per user per month (USD)
00.5
11.5
22.5
33.5
44.5
5
2013 2014 2015 2016 2017 2018p
AR
PU (U
SD)
Digital Cable
DTH
Source: IBEF, Media and Entertainment 2018

An Analysis of Competition and Regulatory Intervention in India’s Television Distribution and Broadcasting Services
16
Whether cable and DTH services belong to the same market is deeply contested. For example, competition analysis defines the relevant market as a building block for the purpose of inquiry. The relevance extends to the product and geography. In the case of DTH, the relevant product market comprises all those products and/or services that are regarded as interchangeable or substitutable by the consumer by reason of the products’ characteristics, their prices and their intended use and the relevant geographic market comprises the area in which the firms concerned are involved in the supply of products or services and in which the conditions of competition are sufficiently homogeneous.
The tension in defining the relevant market is illustrated in the Jak Communications vs. Sun Direct case in 2011. Sun Direct was alleged to have engaged in predatory pricing by subsidising subscription charges to DTH consumers. It was contended that the subscription price of INR99 per month charged by Sun Direct was far below the basic price of the channels offered. Subsidising the set top box and monthly subscription charges was in contravention of the provisions of the Competition Act.35 As per the Director General (DG) investigation, the relevant market for DTH services offered by Sun Direct came under the geographic market of India, while that for the MSO was regional. Secondly, from the product market perspective, it was noted that DTH services were very different from cable services. In terms of the quality of signal transmission, picture quality, gaming and educational services offered as part of the package, DTH seemed to ostensibly cover many more areas as
compared to the narrow base covered by cable services.36 It was concluded that Sun Direct did not, in fact, enjoy any dominant position in the relevant market for DTH services in India.
A similar order was issued by the Competition Commission of India (CCI), dated July 3, 2012. Stakeholders in their comments to TRAI’s consultation paper titled “Monopoly/Market dominance in cable TV services” (2013) noted that the relevant product market for cable TV and DTH services was different, making interchangeability between them negligible from the subscriber point of view.37 Similarly, from the relevant geographic market perspective, cable TV networks operate on a state/regional basis and can choose specific channels to be supplied. On the other hand, DTH services operate on a national basis and transmit the same channel throughout the country, irrespective of variations in demand.38 Several international regulators including the European Commission have concluded that DTH and cable TV services do not fall within the same relevant market.39
Despite the segregation of markets, DTH continues to be a competitive threat to cable TV operators and vice-versa. Consumers often have the option to buy either DTH or a cable connection. The consumer’s preferences are then based on the quality of service, affordability, breadth of content and the convenience of customer services. For instance, DTH subscribers can relocate across India, without significant switching costs, but a cable TV operator may not be able to provide services across the country.
____________________________________________________
35 Sun was accused of attempting to eliminate all other players in its area of operation by indulging in predatory pricing, charging lower fees per channel than that permitted by the TRAI circular for subscription rates of channels. It was also accused, in doing so, of having an anti-competitive agreement with the consumers that caused foreclosure of competition, thus, abrogating Section 3 (4) and 4 (2) (ii) of the Competition Act, 2002 respectively. Finally, it was also accused of using its dominant position in one market (i.e. broadcasting) to make itself dominant in the DTH sector (S. 4 (2) (e).
36 Ravi. S (2014). “Relevant Market in Cable And DTH Market: A Case Law Formulated Opinion”, Paper presented at panel Policy Analysis of Television Distribution IAMCR, Hyderabad, July 16-19, 2014, https://indianmedialogue.com/2014/07/24/relevant-market-in-cable-and-dth-market-a-case-law-for-mulated-opinion-a-draft-paper/
37 Order under section 27 of the Competition Act, 2002. https://www.cci.gov.in/sites/default/files/362011_0.pdf pg 1138 Recommendations on Monopoly/Market dominance in cable TV services November 26, 2013 https://main.trai.gov.in/sites/default/files/Recommenda-
tions__Cable_monopoly__final__261113%20%281%29.pdf39 Regulation (EC) No 139/2004 Merger Procedure, European Commission Dg Competition. http://ec.europa.eu/competition/mergers/cases/decisions/
m7000_4325_3.pdf
17
Whether cable TV and DTH belong to the same market or not, by itself, DTH is a competitive market. We examine the market structure for DTH using HHIs (2.1.2). Inadequate data and the degree of fragmentation in India’s cable TV market make a corresponding analysis for cable TV services impossible. If both markets are combined, the extent of competition will increase. The adoption of price discrimination strategies, such as bundling, are efficiency enhancing in markets with high levels of competition.
2.2 The Rise of Over –the-Top (OTT) Platforms The market for TV viewership and content has changed dramatically. The recent surge in OTT platforms is disruptive for both cable and DTH operators. The estimated size of the OTT market in India was $109 million in 2017; this is expected to double to $218 million by 2020.40 Given the rising number of internet users in India, the OTT video market is gradually becoming a source of mainstream entertainment. As per the BCG report titled “ Entertainment Goes Online “, about 81 per cent of consumers in India have up to three video/OTT apps on their smartphones.41 The average time spent by Indians (especially millennial) watching videos online has grown to 52 minutes per day in 2018 from a mere two minutes per day in 2012.42
The commoditisation of data and ongoing price wars between internet service providers has made online
video streaming more affordable than ever before. According to data from Jana, a mobile advertising company, the reported market shares of OTT platforms in the first quarter of 2018 was as follows: Hotstar (70 per cent), SonyLIV (13 per cent), Viacom 18’s Voot (11 per cent), Amazon Prime (5 per cent) and Netflix (1.4 per cent). According to PwC’s Global Entertainment & Media Outlook Report 2018-2022, India’s OTT video segment is likely to become one of the top 10 largest markets by 2022. The growing preference for video on demand especially by youth has led to over 70 per cent subscription income for OTT in 2017. According to a report on the state of online video,43 Indian viewers consume video content for an average of 8 hours 28 minutes each week, significantly exceeding the global average of 6 hours 45 minutes. The report further stated that millennials are leading the global shift to online video. A contemporaneous study on OTT consumption44 revealed that in 2017, the average daily time spent by youth on online content consumption was 44 minutes higher than the average daily time spent on television. This trend is likely to continue and by 2022, the share of subscription income is likely to increase up to 79.4 per cent of total revenue.
The issue of competition and its regulation will also evolve in keeping with the growing complexities of a digitally converging TV broadcasting and distribution industry.
____________________________________________________
40 This data was shared at the 2018 Fast Track India: Reimaging the Content Ecosystem, a Knowledge Series forum by the Federation of Indian Chambers of Commerce (FICCI) in association with CreativeFirst, which was hosted in Mumbai on November 1, 2018.
41 Entertainment Goes Online: A $5-billion Opportunity, BCG Report 42 Online Video Forecasts 2018, Zenith Report 43 The state of Online Video 2018, Limelight Networks. https://img03.en25.com/Web/LLNW/%7B2176b31c-97a2-41b8-9cc8-f860619cabbc%7D_SOOV_
MR_2018.pdf44 Chrome Data Analytic report “Now Streaming: OTT”, 2018.

An Analysis of Competition and Regulatory Intervention in India’s Television Distribution and Broadcasting Services
18
Technological developments and service innovations have brought about a revolution in the viewing experience of consumers. With the introduction of DTH and digital cable connections, the sound and picture quality of TV content has improved dramatically. Additional services such as music, movies and gaming have made the entertainment experience through these platforms significantly more valuable. Nielsen’s Brand Tracker Survey captures annual data for almost 30,000 respondents on TV viewership and consumer preference for DPOs including cable, DTH and OTT in India (see appendix 13a for the research design adopted by Nielsen for the survey data used in our report and for its ongoing market survey). In this section, we use their data for 2016, 2017 and the first three quarters of 2018 to analyse changes in consumer preferences for broadcasting and distribution services in India. The analysis has been divided into four sub-sections. In the first sub-section, we compare the results of the survey to
trends visible in secondary data reported by TRAI, among others. In the second sub-section, we look at regional trends in TV viewership. In the third sub-section, we examine the preference for cable TV vis-à-vis DTH and, in the final sub-section, we cover emerging trends such as OTT.
3.1 Survey Trends Match Secondary Data With the government mandate on making set top boxes mandatory for watching cable TV, the share of analogue and ordinary antenna connections have rapidly declined over time. Among the individuals surveyed, the number with analogue connections (cable without set top boxes) witnessed a sharp decrease, while respondents using digital cable increased. The percentage of respondents subscribing to DTH connections has remained almost unchanged.45
3. Consumer Preferences for TV Broadcasting and Distribution Services in India
____________________________________________________
45 The year 2018 includes data for only three quarters
Figure 3.1.1 Type of connection
20
3. Consumer Preferences for TV Broadcasting and Distribution Services in India
Technological developments and service innovations have brought about a revolution in the viewing experience of consumers. With the introduction of DTH and digital cable connections, the sound and picture quality of TV content has improved dramatically. Additional services such as music, movies and gaming have made the entertainment experience through these platforms significantly more valuable. Nielsen‟s Brand Tracker Survey captures annual data for almost 30,000 respondents on TV viewership and consumer preference for DPOs including cable, DTH and OTT in India (see appendix 13a for the research design adopted by Nielsen for the survey data used in our report and for its ongoing market survey). In this section, we use their data for 2016, 2017 and the first three quarters of 2018 to analyse changes in consumer preferences for broadcasting and distribution services in India. The analysis has been divided into four sub-sections. In the first sub-section, we compare the results of the survey to trends visible in secondary data reported by TRAI, among others. In the second sub-section, we look at regional trends in TV viewership. In the third sub-section, we examine the preference for cable TV vis-à-vis DTH and, in the final sub-section, we cover emerging trends such as OTT.
3.1 Survey Trends Match Secondary Data
With the government mandate on making set top boxes mandatory for watching cable TV, the share of analogue and ordinary antenna connections have rapidly declined over time. Among the individuals surveyed, the number with analogue connections (cable without set top boxes) witnessed a sharp decrease, while respondents using digital cable increased. The percentage of respondents subscribing to DTH connections has remained almost unchanged.45
Figure 3.1.1 Type of connection
45 The year 2018 includes data for only three quarters
010203040506070
2016 2017 2018
% o
f res
pond
ents
usi
ng
vari
ous t
ype
of c
onne
ctio
n
Cable without set top box Cable with set top box DTH

19
____________________________________________________
46 Note, the survey has treated Dish and Videocon as separate service providers. The dynamics might change if the merger between Dish TV and Videocon is captured.
47 See Question 21d in Appendix 1348 TVP Bureau (2018). “DD Free Dish traction reducing day by day: Dish TV’s Jawahar Goel”, Television Post, February 22, 2018. https://www.television-
post.com/dd-free-dish-traction-reducing-day-by-day-dish-tvs-jawahar-goel/
In a question on indicating their recommended DTH operator, the respondents mostly rank Tata Sky, Airtel and Dish TV46 as their first favourite (Refer to Figure 3.1.2a).
The subscribership for these DTH operators has also increased overtime, while that for Reliance Digital, DD Free Dish and Sun Direct have decreased since 2016.
(Figure 3.1.2b) While the survey responses match the secondary data trends for Reliance Digital and Sun Direct, for DD Free Dish, the reported numbers actually find a significant increase in 2018. In fact, some analysts have projected robust growth for DD Free Dish in the future but recent media reports worry about its declining traction after huge success.48
Figure 3.1.2a First favourite DTH operators47
Figure 3.1.2b Subscribers of DTH operators
21
In a question on indicating their recommended DTH operator, the respondents mostly rank Tata Sky, Airtel and Dish TV46 as their first favourite (Refer to Figure 3.1.2a).
Figure 3.1.2a First favourite DTH operators47
The subscribership for these DTH operators has also increased overtime, while that for Reliance Digital, DD Free Dish and Sun Direct have decreased since 2016. (Figure 3.1.2b) While the survey responses match the secondary data trends for Reliance Digital and Sun Direct, for DD Free Dish, the reported numbers actually find a significant increase in 2018. In fact, some analysts have projected robust growth for DD Free Dish in the future but recent media reports worry about its declining traction after huge success.48
Figure 3.1.2b Subscribers of DTH operators
The survey also finds that Den and Siti Cable followed by Fastway, GTPL and Hathaway are some of prominent cable TV services respondents subscribed to. DEN, Hathaway and Siti Cable are prominent MSOs operating nationally while Fastway and GTPL operate in regional markets. The survey indicates that the share of each of these operators has increased 46 Note, the survey has treated Dish and Videocon as separate service providers. The dynamics might change
if the merger between Dish TV and Videocon is captured. 47 See Question 21d in Appendix 13 48 TVP Bureau (2018). “DD Free Dish traction reducing day by day: Dish TV‟s Jawahar Goel”, Television
Post, February 22, 2018. https://www.televisionpost.com/dd-free-dish-traction-reducing-day-by-day-dish-tvs-jawahar-goel/
05
101520253035
Airtel DD FreeDish
Dish Tv RelianceDigital
Sun Direct Tatasky Videocon
%of
res
pond
ents
and
th
eir p
refe
renc
e fo
r D
TH su
bscr
iber
s
201620172018
05
1015202530
Airtel DTH DD Direct/ DD Free
Dish
Dish TV RelianceDigital TV
Sun DirectDTH
Tata Sky VideoconD2H
subs
crib
ers o
f DTH
op
erat
ors
201820172016

An Analysis of Competition and Regulatory Intervention in India’s Television Distribution and Broadcasting Services
20
The survey also finds that Den and Siti Cable followed by Fastway, GTPL and Hathaway are some of prominent cable TV services respondents subscribed to. DEN, Hathaway and Siti Cable are prominent MSOs operating nationally while Fastway and GTPL operate in regional markets. The survey indicates that the share of each of these operators has increased overtime. Respondents subscribing to DEN increased significantly from 1.6 per cent in 2016 to 11.19 per cent in 2018. The survey trends indicate a response by consumers to services being offered in the market that cater to their evolving needs.
3.2 Regional Preferences We also find a shift from analogue to digital cable or DTH connections at the level of each state. In 2018, 3.97 per cent of the respondents across states subscribed to analogue cable connections. The corresponding numbers for digital cable connections and DTH were 58.3 per cent and 37.9 per cent respectively. The decline in analogue has been gradual since 2016 (See Appendix 3 for more details).
Figure 3.1.3 Percentage of respondents subscribing to cable operators
Figure 3.2.1 State wise type of connections in 2018
22
overtime. Respondents subscribing to DEN increased significantly from 1.6 per cent in 2016 to 11.19 per cent in 2018. The survey trends indicate a response by consumers to services being offered in the market that cater to their evolving needs.
Figure 3.1.3 Percentage of respondents subscribing to cable operators
3.2 Regional Preferences
We also find a shift from analogue to digital cable or DTH connections at the level of each state. In 2018, 3.97 per cent of the respondents across states subscribed to analogue cable connections. The corresponding numbers for digital cable connections and DTH were 58.3 per cent and 37.9 per cent respectively. The decline in analogue has been gradual since 2016 (See Appendix 3 for more details).
Figure 3.2.1 State wise type of connections in 2018
However, the percentage of respondents using analogue cable in Tamil Nadu is still significantly high. This is largely attributed to the Ministry of Information and Broadcasting (MIBs) lenience of Arasu Cable TV Corporation. On the recommendation of the TRAI, the ministry provided them provisional registration, approving the request for extension of deadline for digitisation. This was despite complaints received from LCOs and registered MSOs in Tamil Nadu that they were being forced to take signals from the state-owned Arasu
02468
1012
% o
f res
pond
ents
su
bscr
ibin
g to
cab
le
oper
ator
s
2016
2017
2018
0.0020.0040.0060.0080.00
100.00120.00
Andh
raAs
sam
Biha
rCh
andi
garh
Chha
tisga
rhDe
lhi
Goa
Gujar
atHa
ryan
aHi
mac
hal…
Jhar
khan
dKa
rnat
aka
Kera
laM
adhy
a…M
ahar
asht
raOr
issa
Punj
abRa
jasth
anTa
mil N
adu
Telan
gana
Utta
r Pra
desh
Wes
t Ben
gal
Meg
halay
aNa
galan
d
%of
res
pond
ents
and
type
of
con
nect
ion
acro
ss s
tate
s
Cable without set top box Cable with set top box DTH

21
However, the percentage of respondents using analogue cable in Tamil Nadu is still significantly high. This is largely attributed to the Ministry of Information and Broadcasting (MIBs) lenience of Arasu Cable TV Corporation. On the recommendation of the TRAI, the ministry provided them provisional registration, approving the request for extension of deadline for digitisation. This was despite complaints received from LCOs and registered MSOs in Tamil Nadu that they were being forced to take signals from the state-owned Arasu Cable TV Corporation.49 As a result, only 33 per cent digitisation has been achieved in Tamil Nadu.50 Rajasthan is the other state with a relatively high proportion of analogue connections.
A quantitative analysis of competition among cable operators is neither useful nor possible given the paucity of data and the difficulty in defining the relevant geographical market. Qualitatively, we find that competition among MSOs is uneven across the country. Certain states (e.g. Delhi, Maharashtra, Uttar Pradesh, and Rajasthan) have a large number (five to seven) of MSOs. DEN cable, Siti Cable and Hathaway, for instance,
are prominent MSOs who have their presence across these states (See Appendix 4 for more details). On the other hand, certain states like Tamil Nadu and Punjab are characterised by regional monopolies, where close to 90 per cent of the market is dominated by a single MSO. The survey revealed that approximately 97.5 per cent of the respondents in Punjab subscribe to Fastway as their cable service provider. Similarly, other regionally focused operators like Ashiana Cable largely cater to a cohort of three southern states. Thirty-three per cent of their respondents belong to Maharashtra, 30 per cent belong to Andhra Pradesh and about 17 per cent were from Telangana.
Regional preferences, however, are not typical of DTH subscribers. The market for DTH has a national character and reflects a subscriber distribution that is reasonably uniform across states, with the exception of a few (Refer Figure 3.2.2). For example, the percentage of respondents subscribing to DD Free Dish in Jharkhand is extremely high (12.07 per cent). Similarly, the data show that Tata Sky is preferred across states, except Punjab and Tamil Nadu where a majority of respondents subscribed to Airtel or Dish TV (see Appendix 5 for more details)
____________________________________________________
49 Sixteenth Lok Sabha Ministry of Information And Broadcasting: Status Of Cable TV Digitisation And Interoperability of Set Top Boxes, Forty-Fourth Report http://164.100.47.193/lsscommittee/Information%20Technology/16_Information_Technology_44.pdf
50 IT committee asks MIB to take steps to ensure complete digitisation in TN, TVP Bureau January 2, 2018, https://www.televisionpost.com/it-committee-asks-mib-to-take-steps-to-ensure-complete-digitisation-in-tn/
Figure 3.2.2 Percentage of respondents subscribing to DTH operators across states in 2016
23
Cable TV Corporation.49 As a result, only 33 per cent digitisation has been achieved in Tamil Nadu.50 Rajasthan is the other state with a relatively high proportion of analogue connections.
A quantitative analysis of competition among cable operators is neither useful nor possible given the paucity of data and the difficulty in defining the relevant geographical market. Qualitatively, we find that competition among MSOs is uneven across the country. Certain states (e.g. Delhi, Maharashtra, Uttar Pradesh, and Rajasthan) have a large number (five to seven) of MSOs. DEN cable, Siti Cable and Hathaway, for instance, are prominent MSOs who have their presence across these states (See Appendix 4 for more details). On the other hand, certain states like Tamil Nadu and Punjab are characterised by regional monopolies, where close to 90 per cent of the market is dominated by a single MSO. The survey revealed that approximately 97.5 per cent of the respondents in Punjab subscribe to Fastway as their cable service provider. Similarly, other regionally focused operators like Ashiana Cable largely cater to a cohort of three southern states. Thirty-three per cent of their respondents belong to Maharashtra, 30 per cent belong to Andhra Pradesh and about 17 per cent were from Telangana.
Regional preferences, however, are not typical of DTH subscribers. The market for DTH has a national character and reflects a subscriber distribution that is reasonably uniform across states, with the exception of a few (Refer Figure 3.2.2). For example, the percentage of respondents subscribing to DD Free Dish in Jharkhand is extremely high (12.07 per cent). Similarly, the data show that Tata Sky is preferred across states, except Punjab and Tamil Nadu where a majority of respondents subscribed to Airtel or Dish TV (see Appendix 5 for more details)
Figure 3.2.2 Percentage of respondents subscribing to DTH operators across states in 2016
49 Sixteenth Lok Sabha Ministry of Information And Broadcasting: Status Of Cable TV Digitisation And
Interoperability of Set Top Boxes, Forty-Fourth Report http://164.100.47.193/lsscommittee/Information%20Technology/16_Information_Technology_44.pdf
50 IT committee asks MIB to take steps to ensure complete digitisation in TN, TVP Bureau January 2, 2018, https://www.televisionpost.com/it-committee-asks-mib-to-take-steps-to-ensure-complete-digitisation-in-tn/
0.005.00
10.0015.0020.0025.0030.0035.0040.00
Andh
ra P
rade
shAs
sam
Biha
rCh
andi
garh
Chha
tisga
rhDe
lhi
Goa
Gujar
atHa
ryan
aHi
mac
hal P
rade
shJh
arkh
and
Karn
atak
aKe
rala
Mad
hya P
rade
shM
ahar
asht
raOr
issa
Punj
abRa
jasth
anTa
mil N
adu
Telan
gana
Utta
r Pra
desh
Wes
t Ben
gal
% o
f res
pind
ents
subs
crib
ing
to D
TH o
pera
tors
acr
oss
stat
es i
n 20
16
VideoconTataskySun DirectReliance DigitalDish TVAirtelDD Free Dish

An Analysis of Competition and Regulatory Intervention in India’s Television Distribution and Broadcasting Services
22
____________________________________________________
51 Based on Q 13 in Appendix 13b. The questions used in the study have been provided in the Appendix. For reference to other you can reach out to Nielsen
Figure 3.2.3 Percentage of respondents watching TV in different languages
24
In terms of language, the survey in 2018 revealed that about 55.6 per cent of respondents view TV content in Hindi followed by Gujarati (8.7 per cent), Bengali (7.3 per cent) and English (6.9 per cent). This reflects the regionalisation of the Indian sub-continent and the preference for vernacular content. Hindi is popular in Madhya Pradesh, Maharashtra, Uttar Pradesh, Rajasthan, Chhattisgarh and Haryana. Marathi is preferred in Maharashtra; 4.3 per cent of respondents from Karnataka watch Kannada channels. TV channels in Telugu are most watched in Andhra Pradesh and Telangana. Content in Bengali is most popular in West Bengal and Assam. Appendix 6 provides details on the language in which TV is watched across states.
Figure 3.2.3 Percentage of respondents watching TV in different languages
3.3 Preference for DTH over Cable
The survey finds that digital cable connections continue to dominate the TV industry as is also confirmed by secondary data. However, the survey responses indicate an increasing preference for DTH. Of the 16 per cent who responded to the survey question on an intent to buy a new TV connection in next one year in the first three quarters of 2018, 57.75 per cent indicated their preference for a DTH connection, while only 39.57 per cent indicated a preference for digital cable51. This is attributed to the picture quality, package variety and flexibility offered by DTH connections. Moreover, DTH connections can be easily moved across the country, while cable connections lack such portability. The same cable operator may not provide services across the country. Besides, DTH currently is the only connection that offers 4K resolution picture quality. The Nielsen survey reflects such preferences with consumers stating that DTH connections are good value for money, offers more value than cable and is more flexible and convenient when compared to cable. The bucket of responses under „agree‟, „somewhat agree‟ and „completely agree‟ is much higher than „disagree‟ or „completely disagree‟. This pattern is found to exist across the three years of the survey. 51 Based on Q 13 in Appendix 13b. The questions used in the study have been provided in the Appendix. For reference to other you can reach out to Nielsen
55.7
0.2
8.7
6.3
4.3
7.3
2.8 6.9
2.3 1.2 1.4 1.7 0.6
0.5 Hindi
English
Marathi
Tamil
Kannada
Bengali
Malayalam
Telugu
Gujarati
Oriya
In terms of language, the survey in 2018 revealed that about 55.6 per cent of respondents view TV content in Hindi followed by Gujarati (8.7 per cent), Bengali (7.3 per cent) and English (6.9 per cent). This reflects the regionalisation of the Indian sub-continent and the preference for vernacular content. Hindi is popular in Madhya Pradesh, Maharashtra, Uttar Pradesh, Rajasthan, Chhattisgarh and Haryana. Marathi is preferred in Maharashtra; 4.3 per cent of respondents from Karnataka watch Kannada channels. TV channels in Telugu are most watched in Andhra Pradesh and Telangana. Content in Bengali is most popular in West Bengal and Assam. Appendix 6 provides details on the language in which TV is watched across states.
3.3 Preference for DTH over Cable The survey finds that digital cable connections continue to dominate the TV industry as is also confirmed by secondary data. However, the survey responses indicate
an increasing preference for DTH. Of the 16 per cent who responded to the survey question on an intent to buy a new TV connection in next one year in the first three quarters of 2018, 57.75 per cent indicated their preference for a DTH connection, while only 39.57 per cent indicated a preference for digital cable.51 This is attributed to the picture quality, package variety and flexibility offered by DTH connections. Moreover, DTH connections can be easily moved across the country, while cable connections lack such portability. The same cable operator may not provide services across the country. Besides, DTH currently is the only connection that offers 4K resolution picture quality. The Nielsen survey reflects such preferences with consumers stating that DTH connections are good value for money, offers more value than cable and is more flexible and convenient when compared to cable. The bucket of responses under ‘agree’, ‘somewhat agree’ and ‘completely agree’ is much higher than ‘disagree’ or ‘completely disagree’. This pattern is found to exist across the three years of the survey.

23
An analysis across DTH operators in Figure 3.3.1 below shows that Tata Sky, Airtel and Dish TV are the top three DTH operators stated to offer more value than cable, more flexible and convenient than cable and offer excellent value for money. (See Appendix 7.1, 7.2 and 7.3 for more details)
3.4 OTT-an emerging trendOver-the-top (OTT) services are a rapidly evolving space in India. New innovative platforms are entering the market on the back of cheaper data bundles. Content genres like entertainment, sports, and regional TV are
emerging as the key focus areas for OTT platforms. The tremendous growth of these platforms is driven by their unique position to offer personalised entertainment to consumers at their convenience. However, the market is still nascent. Although users have increased over the period, on an average, only 6 per cent of respondents were found using OTT applications in the 2018 survey. Hotstar and Jio TV were the most widely used OTT platforms.
Respondents who were aware of and/or using these applications were either college going students, graduates or professionals (Figure 3.4.2). The 2018 survey
Figure 3.3.1 Percentage of respondents who agree and completely agree that DTH offers excellent value for money and is more flexible and convenient than
cable and offers more value than cable
Figure 3.4.1 Percentage of respondent using OTT services
25
An analysis across DTH operators in Figure 3.3.1 below shows that Tata Sky, Airtel and Dish TV are the top three DTH operators stated to offer more value than cable, more flexible and convenient than cable and offer excellent value for money. (See Appendix 7.1, 7.2 and 7.3 for more details)
Figure 3.3.1 Percentage of respondents who agree and completely agree that DTH offers excellent value for money and is more flexible and convenient than cable and offers
more value than cable
3.4 OTT-an emerging trend
Over-the-top (OTT) services are a rapidly evolving space in India. New innovative platforms are entering the market on the back of cheaper data bundles. Content genres like entertainment, sports, and regional TV are emerging as the key focus areas for OTT platforms. The tremendous growth of these platforms is driven by their unique position to offer personalised entertainment to consumers at their convenience. However, the market is still nascent. Although users have increased over the period, on an average, only 6 per cent of respondents were found using OTT applications in the 2018 survey. Hotstar and Jio TV were the most widely used OTT platforms.
Figure 3.4.1 Percentage of respondent using OTT services
01020304050607080
2016 2017 2018 2016 2017 2018 2016 2017 2018Excellent value for money Flexible and convenient
than cableoffers more value than cable
VideoconTataskyAirtelDsh TVRelianceSun Direct
0.42 0.7 1.81
0.39 1.01 0.04
2.85
5.44
15.85
2.59
8.37
0.22 0
2
4
6
8
10
12
14
16
18
Netflix Amazon Prime Hotstar Voot Jio TV Alt Balaji
% o
f res
pond
ents
usi
ng O
TT
se
rvic
es
2016
2018
Average 5.88% 25
An analysis across DTH operators in Figure 3.3.1 below shows that Tata Sky, Airtel and Dish TV are the top three DTH operators stated to offer more value than cable, more flexible and convenient than cable and offer excellent value for money. (See Appendix 7.1, 7.2 and 7.3 for more details)
Figure 3.3.1 Percentage of respondents who agree and completely agree that DTH offers excellent value for money and is more flexible and convenient than cable and offers
more value than cable
3.4 OTT-an emerging trend
Over-the-top (OTT) services are a rapidly evolving space in India. New innovative platforms are entering the market on the back of cheaper data bundles. Content genres like entertainment, sports, and regional TV are emerging as the key focus areas for OTT platforms. The tremendous growth of these platforms is driven by their unique position to offer personalised entertainment to consumers at their convenience. However, the market is still nascent. Although users have increased over the period, on an average, only 6 per cent of respondents were found using OTT applications in the 2018 survey. Hotstar and Jio TV were the most widely used OTT platforms.
Figure 3.4.1 Percentage of respondent using OTT services
01020304050607080
2016 2017 2018 2016 2017 2018 2016 2017 2018Excellent value for money Flexible and convenient
than cableoffers more value than cable
VideoconTataskyAirtelDsh TVRelianceSun Direct
0.42 0.7 1.81
0.39 1.01 0.04
2.85
5.44
15.85
2.59
8.37
0.22 0
2
4
6
8
10
12
14
16
18
Netflix Amazon Prime Hotstar Voot Jio TV Alt Balaji
% o
f res
pond
ents
usi
ng O
TT
se
rvic
es
2016
2018
Average 5.88%

An Analysis of Competition and Regulatory Intervention in India’s Television Distribution and Broadcasting Services
24
covered 29,051 individuals of which 9 % were college going but not graduates, 18% belonged to graduate general, 3% were post graduate general and 1% was graduate professional and post graduate professionals respectively. However, a large percentage within this low base of post graduate general and graduate professional subscribed to OTT applications.
With original content and a growing regional focus, OTT players are trying to find their place in this market. A recent report by BCG titled “Entertainment Goes Online”estimates that the industry in India, which currently stands at $0.5 billion, will grow to be $5 billion by 2023.52 OTT operators have also entered into B2B tie-ups with DTH operators. For instance, Videocon d2h had signed a deal with SonyLIV for its HD Smart
Connect set top box. It also has a similar arrangement with Netflix.53 Similarly, Tata Sky and Netflix entered into a strategic partnership for content delivery.54
Although consumption of video on digital platforms is on the rise, television continues to score in terms of penetration. In the near future, both TV and digital video are likely to grow in parallel. In the short run at least, OTT video is likely to grow as a second screen. The growth of digital media, of course, will raise competition and regulatory challenges, including those related to quality of content and subscription charges. The next section summarises the history of tariff regulations in India’s broadcasting and distribution services sector and an assessment of its impact on the growth of the industry and consumer welfare.
Figure 3.4.2 Use of OTT applications in 2018 by level of education
____________________________________________________
52 Samtani. K and Jindal. G (2018). “Entertainment Goes Online: A $5 Billion Opportunity”, Boston Consultancy Group. http://image-src.bcg.com/Imag-es/Entertainment-Goes-Online_tcm21-208006.pdf
53 Menon. B (2018). “OTT players tie up with DTH operators, TV-makers to distribute digital content”, Hindu Business Line, January 09, 2018. https://www.thehindubusinessline.com/companies/ott-players-tie-up-with-dth-operators-tvmakers-to-distribute-digital-content/article9969957.ece
54 Press Trust of India (2018). “Tata Sky, Netflix tie up for content delivery, Business Line, April 24, 2018, https://www.thehindubusinessline.com/compa-nies/tata-sky-netflix-tie-up-for-content-delivery/article23656883.ece
26
Respondents who were aware of and/or using these applications were either college going students, graduates or professionals (Figure 3.4.2). The 2018 survey covered 29,051 individuals of which 9 % were college going but not graduates, 18% belonged to graduate general, 3% were post graduate general and 1% was graduate professional and post graduate professionals respectively. However, a large percentage within this low base of post graduate general and graduate professional subscribed to OTT applications.
Figure 3.4.2 Use of OTT applications in 2018 by level of education
With original content and a growing regional focus, OTT players are trying to find their place in this market. A recent report by BCG titled “Entertainment Goes Online”estimates that the industry in India, which currently stands at $0.5 billion, will grow to be $5 billion by 2023.52 OTT operators have also entered into B2B tie-ups with DTH operators. For instance, Videocon d2h had signed a deal with SonyLIV for its HD Smart Connect set top box. It also has a similar arrangement with Netflix.53 Similarly, Tata Sky and Netflix entered into a strategic partnership for content delivery.54
Although consumption of video on digital platforms is on the rise, television continues to score in terms of penetration. In the near future, both TV and digital video are likely to grow in parallel. In the short run at least, OTT video is likely to grow as a second screen. The growth of digital media, of course, will raise competition and regulatory challenges, including those related to quality of content and subscription charges. The next section summarises the history of tariff regulations in India‟s broadcasting and distribution services sector and an assessment of its impact on the growth of the industry and consumer welfare.
52 Samtani. K and Jindal. G (2018). “Entertainment Goes Online: A $5 Billion Opportunity”, Boston
Consultancy Group. http://image-src.bcg.com/Images/Entertainment-Goes-Online_tcm21-208006.pdf 53 Menon. B (2018). “OTT players tie up with DTH operators, TV-makers to distribute digital content”, Hindu
Business Line, January 09, 2018. https://www.thehindubusinessline.com/companies/ott-players-tie-up-with-dth-operators-tvmakers-to-distribute-digital-content/article9969957.ece
54 Press Trust of India (2018). “Tata Sky, Netflix tie up for content delivery, Business Line, April 24, 2018, https://www.thehindubusinessline.com/companies/tata-sky-netflix-tie-up-for-content-delivery/article23656883.ece
0
10
20
30
40
50
60
70
Netflix AmazonPrime
Hotstar Voot AltBalaji
%of
res
pond
ents
usi
ng O
TT
appl
icat
ion
by le
vel o
f edu
cati
on
Some college but not graduateGraduate GeneralPost Graduate GeneralGraduate ProfessionalPost Graduate profess

25
4. An Analysis of Tariff Regulation in India
4.1 Summarising the Tariff Orders since 2004The Telecom Regulatory Authority of India has a mandate to regulate tariff, interconnection and quality of services pertaining to the broadcasting and distribution sector. A notification issued by the central government in 2004 entrusted TRAI with the following:
• Regulation of interconnection that broadly covers agreements between broadcasters, direct to home (DTH) operators, MSOs and LCOs
• Regulation of quality of service or infrastructure sharing that covers aspects pertaining to connection, disconnection, and transfer and shifting of cable and satellite services. It also handles and redresses consumer complaints. The regulation also looks at technical parameters of set top boxes.
• Issue of tariff orders that prescribe wholesale tariff, retail tariff and revenue share amongst service providers
India’s television, broadcasting and distribution industry has been served seven tariff orders since inception. The first tariff order, issued on October 1, 2004, was a two-point regulation merely fixing charges payable, based on the prevalent rate on December 26, 2003, and defining the territorial scope of application of regulations to extend “throughout the territory of India as also those originating in India or outside India and terminating in India.55” TRAI specified the ceiling rate for charges payable56 for both free to air (FTA) and pay channels in
the conditional access system (CAS) and non-CAS57 areas between (i) cable subscribers and cable operators, (ii) cable operators and MSOs/ broadcasters and (iii) MSOs and broadcasters. The sector at the time used analogue and non-addressable technologies. It was mostly unregulated and lacked operational transparency. There were frequent price fluctuations and stakeholders were at loggerheads on matters related to the price of content. While broadcasters held that distributors of television channels underreported the total number of subscribers, distributors argued that the demand for annual increases in subscriber numbers was unjustified.
The second tariff order, issued on October 26, 2004, replaced the first tariff order adding provisions for new pay channels or FTA channels converted to a pay channel, providing an option to MSOs to reduce the ceiling charge. This order provided flexibility to breach the ceiling in case a new pay channel was launched after December 26, 2003, or an existing FTA channel as on December 26, 2003, was converted to a pay channel, provided they were offered on a standalone basis. Increase over the ceiling was limited to the rate of the new/converted channel. The order also provided guidance on similarity of rates for similar channels on grounds of genre, language, etc. Tariff determination of new pay channels was tricky and, therefore, deeply contested. Tariff orders in 2004 were followed by amendments that provided inflation-linked adjustment to tariff ceilings. Further amendments in 2007 brought changes and clarifications in channel offerings by broadcasters for non-addressable systems. It also introduced reporting requirements for
____________________________________________________
55 Naik. A (2017). “TRAI Tariff Orders – Effect on Broadcasting Sector.” http://ijlt.in/wp-content/uploads/2018/07/03_ameet_naik.pdf56 Charges’ mean and include the charges/tariff rates payable by one party to the other by virtue of the formal/informal agreement prevalent on December
26, 2003.57 It is pertinent to note that when the first tariff order was issued, only four metropolitan areas were CAS areas and the rest of the country was consid-
ered to be a non-CAS area. However, due to widespread protests by consumer groups and political parties, the government suspended the mandatory operation of CAS. As a result, the distinction between CAS and non-CAS area ceased to exist. Subsequently, the first amendment was brought to the tariff order removing the words “both for CAS and non-CAS” areas.

An Analysis of Competition and Regulatory Intervention in India’s Television Distribution and Broadcasting Services
26
____________________________________________________
58 The two options as described in the schedule offer a choice to the customer to opt for schemes of maximum rent per month of the set top box, security deposit, installation charges, activation charges, repair and maintenance cost and deductions from the security deposit.
59 The standard tariff packages (STPs) for STBs prescribed vide tariff order dated August 31, 2006, were primarily based on the then prevailing market prices of set top boxes.
60 Telecommunication (Broadcasting And Cable) Services (Third) (CAS Areas) Tariff (Third Amendment) Order, 2008 http://digitalindiamib.com/torder26dec-08no5.pdf
61 Appeal No. 10 (C) of 2006, decided on 27-2-2007 (TDSAT).62 Telecommunication (Broadcasting And Cable) Services (Third) (CAS Areas) Tariff (Third Amendment) Order, 2008 http://digitalindiamib.com/torder26dec-
08no5.pdf
broadcasters including the name, genre and language of all FTA or pay channels offered, list of all bouquets offered, revenue sharing arrangements, target audience, advertisement revenue and any other related information. TRAI also prescribed twin conditions at the wholesale level, the association between à la carte and bouquet rates to address perverse pricing of bouquets vis-à-vis individual channels by broadcasters. The twin conditions also applied to the addressable system and are discussed below.
4.1.1 History of Tariff Regulations for the Addressable System
Implementation of the conditional access system (CAS) was crucially dependent on the supply of set top boxes (STBs) to cable TV subscribers. In its initial phase, the implementation of CAS was limited by access to STBs, which were available but at unaffordable prices. Packages requiring large upfront payments acted as an ‘entry barrier’ to subscriber adoption. The third tariff order of 2006 regulated carriage for digital and analogue in CAS areas. It fixed tariffs for the ‘basic service tier’ in CAS areas at INR77, with an obligation on cable operators to offer at least 30 FTA channels in the bouquet. The maximum retail price for individual pay channels and a scheme for the supply of set top boxes were also proposed. The third tariff order made it mandatory for all MSOs and cable operators in a CAS area to offer all subscribers two standard packages. The first package included a security deposit of INR999/- and a monthly rental of INR30 for five years. The second included a security deposit of INR250/- with a monthly rental of INR45 for five years.59 60
TRAI, however, did not propose regulations for STBs supplied by DTH operators. TRAI clarified that CAS and DTH were not comparable services and that the delivery systems varied in several respects. Operators challenged the price ceiling of INR5 per month for a pay channel. In Set Discovery (P) Ltd. v. Telecom Regulatory Authority of India,61 it was held that such a low rate would render the business model for several broadcasters unviable. As a result, TRAI increased the rate from INR5 to INR5.35.62
DTH operators requested TRAI to provide a level playing field with regard to channel tariffs set by broadcasters for DTH operators. The fourth tariff order of 2006 modified the definition of “addressable system” to include DTH, HITS & IPTV but excluded cable TV. It also categorised tariff into three heads – wholesale tariff, retail tariff and a tariff for those offering equipment at a customer’s premises. The order also mandated the provision of all pay channels on an à la carte basis to consumers. Wholesale rates of pay TV channels and bouquets for all addressable systems were fixed at 42 per cent of the rate corresponding to channels and bouquets in non-addressable cable TV systems.
In the spirit of light touch regulation, TRAI did not mandate any conditions for pricing of à la carte channels vis-à-vis the pricing of bouquets of which these channels formed a part. Subsequently, on examining the prevalent market conditions, it was observed that though the platform operators were allowed to package and price the offerings as bouquets in addition to offering them on an à la carte basis, the uptake of channels on an à la carte basis remained negligible as compared to bouquet subscriptions. As per TRAI, the primary reason

27
for such poor uptake on an à la carte basis was the disproportionate difference between the prices of these channels when included in a bouquet and when offered on a standalone basis.63 For instance, a platform operator offered a bouquet containing pay channels at INR 290, while the sum of à la carte rates of the same set of channels was INR 1605. The discount on a bouquet amounted to 82 per cent.64 The sixth amendment introduced the reference interconnect offer (RIO). RIOs relate to matters of price and other terms and conditions under which a carrier will permit the interconnection of another carrier to its network.
In 2012, TRAI issued an amendment to the tariff order for all addressable systems including cable TV. It permitted forbearance for retails tariffs. However, to prevent misuse of this provision, TRAI prescribed preventive measures in the form of twin conditions, both at the wholesale and retail levels. In its tariff order dated September 20, 2013, TRAI introduced the twin conditions, wherein the ceiling for the à la carte rate of a pay channel was linked to the ‘ascribed’ 65 value of a channel instead of the earlier prescribed flat average value of the channel in the bouquet.
The fifth, sixth and seventh orders also focused on regulating tariff for the supply and installation of set top boxes. The fifth order mandated MSOs to offer every ordinary subscriber a standard tariff package for supply and installation of set top boxes that conformed to Indian standards. The sixth order was applied to DTH operators for supply and installation of equipment at a customer’s premises.66 The seventh order (2015) consolidated the tariff for customer premises equipment, providing even
for repair and maintenance. Appendix 8 provides a summary of the orders.
4.1.2 Evolution of the Digital Addressable System and the Tariff Order of 2016
The principal tariff order for addressable systems dated July 27, 2010, was amended on April 30, 2012, to accommodate provisions for the implementation of the digital addressable cable TV systems (DAS). While digitisation improved the addressability, capacity and quality of cable TV networks, other benefits such as the choice of selecting individual channels and the availability of multimedia services had not reached subscribers. Digital addressability by itself was unable to resolve transparency in pricing, consumer choice and discriminatory practices across distributor platforms.67 There were also concerns relating to the transparent flow of subscription revenues across the value chain. In order to address these complex and conflicting issues, TRAI issued a consultation paper on “Tariff Issues Related to TV Services” on January 29, 2016. The issues for consultation included tariff, interconnection, quality of services (QoS) and measures facilitating the move towards a consolidated technology neutral regulatory framework for DAS. The objectives of the consultation were:
(i) To carry out a review of the existing tariff framework and develop a comprehensive tariff structure for addressable TV distribution across digital broadcasting delivery platforms (DTH/cable TV/HITS/IPTV) at the wholesale and retail levels.
____________________________________________________
63 The Telecommunication (Broadcasting And Cable) Services (Fourth) (Addressable Systems) Tariff (Sixth Amendment) Order, 2015 https://www.trai.gov.in/sites/default/files/Tele_BnC_Services_4th_AS_TariffOrder_6th_Amend_29Dec15.pdf
64 The Telecommunication (Broadcasting And Cable) Services (Fourth) (Addressable Systems) Tariff (Sixth Amendment) Order, 201565 The ascribed value of a channel in a bouquet is essentially its à la carte, rationalised with respect to the overall bouquet rate. The ceiling on the à la
carte rates for pay channels, therefore, could be arrived at in a more rational manner and allowed flexibility to operators to package channels as per their business plans, while ensuring that the à la carte prices were not rendered illusory for consumers.
66 The term, ‘customer premises equipment’ is defined as the equipment, components and accessories installed at the premises of the subscriber to enable the reception of any broadcasting service offered through an addressable system
67 The Telecommunication (Broadcasting and Cable) Services (Eighth) (Addressable Systems) Tariff Order, 2017 https://trai.gov.in/sites/default/files/Tar-iff_Order_English_3%20March_2017.pdf

An Analysis of Competition and Regulatory Intervention in India’s Television Distribution and Broadcasting Services
28
(ii) To ensure that the tariff structure is simplified and rationalised so as to ensure transparency and equity across the value chain
(iii) To reduce the incidence of disputes amongst stakeholders across the value chain encouraging healthy growth in the sector
(iv) To ensure that subscribers have adequate choice while they are also protected against irrational tariff structures and price hikes
(v) To encourage investment in the TV sector
(vi) To encourage production of good quality channels across different genres
TRAI issued the Draft Telecommunication Tariff Order on October 10, 2016. Based on comments from various stakeholders, TRAI issued the Telecommunication (Broadcasting and Cable) Services (Eighth) (Addressable Systems) Tariff Order, 2017. The key highlights of the tariff order were the following:
(i) Broadcasters should declare the maximum retail prices (MRP) (excluding taxes) per month for individual pay channels
(ii) DPOs are entitled to a “distributor fee” of 20 per cent of the MRP of pay channels or a bouquet of pay channels.
(iii) The “carriage fee”, the fee payable by a broadcaster to a DPO for the purpose of carrying its channels through the DPO’s network, will be regulated and a ceiling of 20 paisa per subscriber per month has been prescribed for SD channels and 40 paisa per subscriber per month has been prescribed for HD channels. Fur-ther, the maximum discount that can be offered by a DPO to a broadcaster has been capped at 35 per cent of their entire channel carrying capacity.
(iv) The network capacity fee will be completely regulated and for the first 100 SD channels, a DPO could charge INR130l for each additional 25 SD channels, an extra INR20 can be charged.
(v) A bouquet of channels should not be priced at less than 85 per cent of the sum of their à la carte pricing.
(vi) The maximum retail price (MRP) per month for a bouquet of pay channels shall be uniform for all distribution platforms
(vii) A bouquet shall not include any free-to-air channel
(viii) A bouquet shall not contain both HD and SD variants of the same channel.
Through the order, TRAI mandated all broadcasters to report their à la carte and bouquet rates on their website. Any changes in the rates or conversion of FTA channels into pay channel would need to be reported to TRAI at least 30 days prior to the proposed date of implementation. TRAI illustrated the use of three different pricing models at the wholesale level – a) price forbearance model b) cost-based model and c) RIO based model. Details of the model have been provided in Appendix 9. The tariff order adopted the distribution network model. Under the previous regime, retail tariffs followed price forbearance. DPOs used their discretion to fix prices and package products. According to TRAI, DPOs misused the flexibility provided to them. The deals are allegedly non-transparent and discriminatory. To resolve issues at the wholesale and retail levels, integrated pricing models were proposed by TRAI in its consultation paper. Details of the integrated pricing models are provided in Appendix 10.
4.2 Analysing the Impact of the New Tariff Order TRAI has recurrently championed the idea of à la carte pricing. Through subsequent tariff orders, TRAI has mandated the provisioning of individual channels to consumers at reasonable prices. The details of the orders have been summarised in the sections above. The new tariff order reflects the same principles of allowing consumers a wider choice set and giving them the opportunity to pay for what they wish to watch. Salient features of the order have been summarised in Section 4.2 above. Due for implementation from February 1, 2019, the order has been challenged by several stakeholders.

29
The tariff order was challenged by Star India and Vijay Television through two writ petitions.68 According to the petitioners, TRAI’s jurisdiction to regulate and fix tariff is limited to carriage or ‘means of transmission’ and, therefore, cannot be extended to ‘content’. It is also contended that the order constrained broadcasters to negotiate contracts on mutually acceptable terms under Section 19(3) of the Act.69 With its imposed restrictions on the price of channels, discount and commission thresholds, the petitioners contend that the order is a violation of the Copyright Act, 1957.70 The Copyright Act is claimed to be a complete code of governance as far as broadcast organisations are concerned. The Madras High Court ruled in favour of TRAI with the exception of the clause mandating a discount cap of 15 per cent on bouquet prices. The court ruled that the MRP on a bouquet is arbitrary71 and struck down the provision to not price bouquet channels at a price less than 85 per cent of the sum of individual channels. TRAI subsequently appealed to the Supreme Court against the Madras Court order with respect to the discount on bouquet plans, which was set aside by the apex court.72
After the announcement of the Madras High Court judgement, most broadcasters published their Reference Interconnect Offer (RIO) declaring MRP and bouquet rates. As per the new tariff order, broadcasters were mandated to declare the maximum retail price (MRP) within 60 days and distribution platform operators to declare network capacity fee and distribution retail price (DRP) within 180 days. Zee Entertainment Enterprise
Ltd (ZEEL), Sony Pictures Networks India Pvt. Ltd., TV18 Broadcast Ltd., Disney India, Turner International and Sun TV Network were some of the broadcasters who declared the RIO rates after the outcome of the case filed by Star TV and Vijay TV was announced. However, the order still could not be implemented as a parallel petition was filed by Bharti Telemedia, Tata Sky and Discovery, challenging the tariff order and the Telecommunication (Broadcasting and Cable Services) Interconnection Regulations 2017.73
The petitioners challenged the order in the Delhi High Court, questioning the need to fix distributor margins and carriage fees and to eliminate the possibility of mutually negotiated deals between broadcasters and DTH operators. The petition highlighted the following:
• The new tariff order has given unbridled power to the broadcasters and has regulated every aspect of the DPO business including margins on the price paid by subscribers.74 The tariff order has resulted in a structural change to the industry from being business to business, when broadcasters sold channel bouquets to DPOs, to business to consumer, selling channels directly to the consumer.
• The order is applicable to all the DPOs and it provides no distinction between a DTH operator and various other DPOs (broadcast/terrestrial television, cable television, HITS, and IPTV). The input costs incurred by DTH operators are significantly higher in comparison to that incurred by LCOs. DTH operators invest more in technology, quality of
____________________________________________________
68 TRAI vs. STAR and Vijay TV Madras High Court Judgment https://barandbench.com/wp-content/uploads/2018/03/TRAI-JUDGEMENT-W_P_-Nos_44126-and-44127-of-2016-1-1-watermark.pdf
69 The assignment of copyright in any work shall also specify the amount of royalty payable, if any, to the author or his legal heirs during the currency of the assignment and the assignment shall be subject to revision, extension or termination on terms mutually agreed upon by the parties.
70 The Copyright Act comprehensively covers all aspects of licensing, assignment, payment of royalties and other considerations, tariff fixation and distribution schemes by copyright societies, provisions for enforcement against infringements/piracy and implementation of technological protection measures in respect of works of authors and BRR of Broadcast organisation.
71 Madras High Court Verdict https://barandbench.com/wp-content/uploads/2018/05/Madras-HC-TRAI-May-23-2018.pdf72 TRAI vs. STAR and Vijay TV Madras High Court https://barandbench.com/wp-content/uploads/2018/05/Madras-HC-TRAI-May-23-2018.pdf73 Saxena. N (2018) . “Why TRAI still cannot implement tariff order
https://www.exchange4media.com/media-tv-news/why-trai-still-cannot-implement-tariff-order-90155.html74 Response of Indian Broadcasting Foundation (IBF) to the Consultations of Telecom Regulatory Authority India on Draft: https://main.trai.gov.in/sites/
default/files/Indian_Broadcasting_Foundation_RC_10102016.pdf

An Analysis of Competition and Regulatory Intervention in India’s Television Distribution and Broadcasting Services
30
service, innovation, operational efficiency, etc., and are mandated to pay an annual licence fee to the Ministry of Information and Broadcasting (MIB) (10 per cent of their gross revenue), unlike other DPOs.75
• The petition also claimed that the order, instead of providing more choice to consumers, is likely to increase bills for them.
A careful examination of the order finds that the regulation attempted to remedy distortions at both the wholesale and retail levels. Wholesale prices negotiated between broadcasters and DPOs are confidential and often concluded in the absence of complete information. Despite digitisation of distribution, broadcasters and sometimes distributors were at the losing end of a bargain. Broadcasters negotiated deals with some distributors to carry channel bouquets at discounted rates, while some others were left with broadcast signals only at the RIO rates, resulting in discrimination across DPOs.76 On the other hand, MSOs demanded significant carriage fees from new broadcasters, raising entry barriers for new channel operators. Moreover, new channels while available on a distributor’s platform were not visible on the electronic programme guide (EPG) for an individual consumer, unless subscribed to. The new order has made it compulsory for the broadcaster to disclose package rates and channel prices offered to all DPOs. Under the new regime, the pricing by broadcasters will become more uniform. The MRP declared by the broadcasters will be available on the electronic programme guide (EPG) of each distributor.77 Such regulations can penalise efficiency. Regulatory price caps limit the ability of broadcasters and distributors
to maximise gain and consequently affect their ability to invest and innovate.78 Market failures, such as those faced by the broadcasting industry, are often addressed by imposing anti-abuse measures on the defaulting parties. Moreover, the impact of such regulations on consumers is ambiguous. In the following sections, we illustrate examples from other countries to elaborate on this point.
4.2.1 A Comparison of Channel Pricing Before and After the New Tariff Order
There are currently 332 pay channels of which 232 are transmitted in SD and 100 are HD. After the New Tariff Order, 57 of the 232 SD channels are priced at INR10 or more while the remaining 175 channels are priced at INR9 or lower. Twenty-five SD channels are priced at the upper price limit of INR19. Among the HD channels, only 31 are priced less than INR10. Of the remaining 69 HD channels, 44 are priced at INR19 per month.79 A comparison of the new MRP rates vis-à-vis the old à la carte rates for select broadcasters across different genres of channels has been summarised in Table 4.2 below. The order has increased channel prices for staple channels across broadcasters. The average price for SD channels before the order was INR5.56; it has now increased to INR6.05. Channels with inelastic demand, such as those providing general entertainment, movies and sports content have increased by over 100 per cent in several cases. Premium content and HD channels have seen a price cut. The average price of HD channels before the order was INR48.2; it has now declined to INR30.60. This is perhaps a survival strategy, especially for broadcasters such as Discovery, which provide premium infotainment.
____________________________________________________
75 Tata Sky petition 76 Consultation on the draft Telecommunication (Broadcasting and Cable Services) (Eighth) (Addressable Systems) Tariff Order, 2016.https://main.trai.
gov.in/sites/default/files/Draft_tariff_Order_10_Oct_2016.pdf77 New channel tariff regime aims to increase transparency in Indian TV market, December 19, 2018, HIS Markit. https://technology.ihs.com/609738/
india-to-implement-new-tv-tariff-regime78 Bauer. J (2012). “Regulation and Innovation in Telecommunications,” Quello Center for Telecommunication Management and Law, Working Paper
01-2012. https://pdfs.semanticscholar.org/8d1e/d6d2c8d8a6199e04fadf804db7d7c9803ba8.pdf79 MRP of pay channels , offered by broadcasters to subscriber as reported to TRAI http://main.trai.gov.in/sites/default/files/PayChannels18122018_0.pdf

31
Given the complexity involved in implementing the order, there have been several iterations in the pricing decisions of broadcasters. Since the announcement of the new order, broadcasters have revised the rate for 83 individual channels and 33 bouquet packs. A hundred and thirty-two new bouquets have been added by broadcasters. The list is available in Appendix 11.
In the immediate aftermath of the tariff order, there is an observed tendency for broadcasters to price several channels at the ceiling price of INR19. Of its package of 51 pay channels, Star India has priced 23 channels at INR19 each. Only five are priced at INR1 each. A consumer subscribing to all pay channels provided by Star individually would have to pay a total of INR604
Table 4.1 À la carte Maximum Retail Prices for general entertainment of standard definition channels reported on December 18, 2018
Channel Name GenreMRP per80
subscriber per month
Old à-la-carte rate for addressable systems as
offered by broadcasters to DPOs as of June 201881
Difference in the rates (% increase/ decrease)
Colors SD General Entertainment 19 8.99 111.35
Colors HD General Entertainment 19 30.00 -36.67
Zee TV SD General Entertainment 19 5.83 225.90
Zee TV HD General Entertainment 19 30.00 -36.67
Sony SET General Entertainment 19 8.99 111.35
Star Plus General Entertainment 19 7.87 141.42
Zee Cinema Movies 19 5.83 225.90
Star Movies Movies 12 7.42 61.73
Set Max Movies 15 7.64 96.34
TEN 1 Sports 19 6.74 181.90
Star Sports HD 1 Sports 19 14.89 27.60
Star Sports HD 1 Sports 19 35.00 -45.71
Cartoon Network Infotainment 4.5 5.62 -19.93
Fox Life Infotainment 1.0 1.0 0.00
National Geographic Infotainment 2 2.58 -22.48
National Geographic HD Infotainment 10 16.00 -37.5
Disney Channel Infotainment 4 4 0.00
NDTV 24*7 News 3 3.82 -21.47
Aaj Tak News 1 3.15 -68.25
Discovery Infotainment 4 6.74 -40.65
Source: Compiled from websites of the broadcasters
____________________________________________________
80 MRP rates or RIO rates are not real, given that the rates at which deals were done on a negotiated basis were much lower 81 Rate for addressable systems as offered by broadcasters to DPOs; https://main.trai.gov.in/sites/default/files/PayChannel30062018.pdf

An Analysis of Competition and Regulatory Intervention in India’s Television Distribution and Broadcasting Services
32
plus distributor margins, carriage fees and applicable taxes. Zee Entertainment, which has a total of 41 pay channels, has priced 19 channels at INR19 each. The average price of a Zee Entertainment Pay channel is INR12.32 per month. The average price of a Viacom18 pay channel is only INR7.80 per month. If all channels of Zee Entertainment (41 channels), Sony Entertainment (25 channels) and Viacom 18(32 channels) are bought individually, the total price paid by consumers would be INR505, INR301 and INR250 per month respectively. These costs do not include distributor margins, service fees, taxes, etc.82 The sum of prices for the entire set of channels for every broadcaster when aggregated individually is higher than what it was before the new tariff order.
In a comparison of bouquet packs, we find that the average price per channel has not changed significantly under the new regime. The discount on bundles continue to be in the range of 50 per cent upwards and for smaller packs, the sum of individual channel prices is 1.7 times that of the pack. (Please refer to Table 4.3). Consumers are purchasing packs announced by broadcasters and to the extent it is a regulatory obligation, the issue of discounting continues to fester. The courts have dismissed TRAI’s ceiling on the maximum discount permissible for bundles. These packs predictably combine heterogeneous channels, a mix of popular channels with high impressions and those which are relatively unknown. For instance, the viewership data provided by BARC for May 2018, finds that Living Foods, a channel included in Zee’s
Table 4.2 Price list for base value pack by Broadcasters for DTH operators
Pack NameNumber of Channels in
Bouquet
MRP of Bouquet (in INR)
(excluding taxes)
Average Price
per channel
À-la-carte MRP of Channel
(in INR) (excluding taxes)
Discount on Bundles (à la carte MRP of Channels MRP of Bouquet/ MRP of
Bouquet)
Star IndiaHindi / Star Value Pack
12 49 4.08 73.00 48.9%
Zee Entertainment
Zee Family Pack Hindi SD
24 45 1.88 76.60 70.2%
Sony Pictures Network
Sony Silver Pack 9 31 3.44 63.00 103%
Disney Broadcasting India Limited
Universal Bouquet 7 10 1.43 27.00 170%
Discovery Networks
Basic Infotainment Pack
8 8 1.00 18.00 125%
Times Network Bouquet 1 4 5 1.25 8.50 70%
Turner International
Pvt. Ltd.Turner Kids Pack 2 4.25 2.13 8.50 100%
NDTV NDTV ULTRA 4 3.50 0.88 6.50 85.7%
TV 18 Hindi Budget 17 22 1.29 34.50 56.8%
Total 87 177.75 315.6
Source: Compiled from websites of the broadcasters
____________________________________________________
82 Krishna. K.P (2018). “Pay Channel rates list under new TRAI Tariff Order – December 29 Deadline”, Preview Tech News, December 22, 2018. https://previewtech.net/pay-channel-rate-list-trai-tariff-order-2393/

33
Family pack, records an average of 1000 impressions83 while Zee TV records 1751000 impressions.84 The issues of deep discount and bundling of undesirable content, the primary concerns of TRAI, do not seem to have been resolved under the new regime. Broadcasters are alluding to general principles of bundling, a value pricing strategy to monetise popular content and promote new and relatively less popular content through packaging at discounted rates. The outcomes are not very different from before the new tariff order or practices across the world and across industries.
In a comparison of bouquet purchase from broadcasters versus bouquets announced by distributors, we find that the cost to consumers for a similar basket of channels is expected to increase. We simulate a scenario using comparative data before and after the new tariff order. Under the new regime, a consumer will have to pay a base fee of INR130 plus taxes for the primary set of 100 channels. This set will mainly comprise free-to-air (FTA) channels and will not include popular ones offered by major broadcasters. If the consumer chooses to buy all basic value packs illustrated in Table 4.3, it will cost INR 178 for 87 additional channels offered by nine broadcasters. For every 20 additional channels, a network fee of INR 25 will be charged. As a result, consumer would have to pay INR 130 (FTA) + INR 178 (87 pay channels) + INR 109 (network capacity fee).85 This adds up to INR 420 per month, excluding taxes. The basic value pack for most broadcasters includes only SD channels. For HD users, the costs will be higher. Under the old tariff regime, consumer paid an average monthly
bill of INR250-300 for a cable connection and INR300-INR450 for a DTH connection and discounts were offered for those opting for a biannual or annual package.86 The Dhamaka pack offered by Tata Sky is priced at INR220 per month with 245 channels, with a discount for annual subscriptions. Similarly, the Bharat pack offered by Dish TV costs INR85 a month, with an average price of INR0.52 per channel. It is clear that bundling affords economies to the consumer, although the channels in a specific bundle are determined by the providers.
Overall, the success or failure of tariff regulation depends on how much entertainment is consumed. The à la carte offering is likely to benefit those who can pick a set of channels across one or multiple genres, the sum of which is lower than a combination available in any bundle or across bundles offered by the broadcaster/service provider. Consumers often appreciate the resulting simplification of the purchase decision offered by bundles.87 For consumers accustomed to bundled purchase, the new tariff order may become overly inconvenient and tedious. Consumers will have to shortlist from a pool of more than 800 channels available for subscription. A recent media report found that the tardy progress in implementation of the new order was partly on account of DPOs, but could also be attributed to significant consumer inertia to migrate.88 A recent report by CRISIL also states that the current pricing regime will result in an increase of 25 per cent in the monthly TV bill for consumers who opt for the top 10 channels. However, consumers opting for up to five top channels will observe lower bills.89
____________________________________________________
83 Number of individuals in 000s of a target audience who viewed an “Event”, averaged across minutes.84 BARC85 87 channels/20=4.2*25=108.75, assuming that network capacity fee is added proportionately. Otherwise, the cost would be Rs. 10086 Panjari. S (2018). “In-depth: Decoding the impact of new tariff regime on consumers, channels, cable and DTH player, Best Media Info, December 26,
2018.,.https://bestmediainfo.com/posts.php?year=2018&month=12&title=decoding-the-impact-of-new-tariff-regime-on-consumers-channels-ca-ble-and-dth-players/
87 Consumer Behaviour And Marketing Action, http://www.pondiuni.edu.in/storage/dde/downloads/markiii_cb.pdf88 https://www.business-standard.com/article/economy-policy/implement-new-tariff-order-by-feb-1-or-face-blackout-trai-warns-dpos-119012300155_1.
html89 CRISIL (2019). “New TRAI regime unlikely to reduce TV bills for most Popular channels and OTT platforms will gain from new rules”, https://www.crisil.
com/content/dam/crisil/pr/press-release/2017/12/new-trai-regime-unlikely-to-reduce-tv-bills-for-most.pdf.

An Analysis of Competition and Regulatory Intervention in India’s Television Distribution and Broadcasting Services
34
Research over the past two decades has established that having too many choices can hurt a consumer’s ability to make decisions and their satisfaction with their eventual choice. According to Iyengar and Lepper, 2000, having too many options to choose from may cause post-choice dissatisfaction.90 On the other hand, Chernev & Hamilton in 200991 found that consumer preference for a larger set of choices decreases as the attractiveness of the products they are interested in increases. This may imply that the marginal utility from a bundle of 400 channels may not be very different from that of 200 channels or may in fact decline as the choice set increases dramatically. This conclusion however, may not hold for a smaller pack of channels. The new tariff order needs examination on consumer preferences before assuming its impact on consumer welfare. Section 4.3.1 reviews the literature on the subject and provides a cross country comparison on regulation of tariffs in the broadcasting sector as an input for the design of an appropriate regulatory framework for India.
4.2.2 Literature and Cross-Country Analysis on Tariff Regulation and À la carte versus Bundling
4.2.2.1 The Economic Theory behind Bundling
Bundling takes place when goods or services that could be sold separately are sold as a package. A codification of bundling practices and definitions of selling strategies is:
Pure bundling: products are sold only as bundles;
Mixed-bundling: products are sold both separately and as a bundle; and
Unbundling: products are sold separately;
Bundling has become a popular selling strategy for many television, telecommunications and information products in India. It is not always clear that bundling will
be used to the advantage of sellers and the detriment of consumers. Besides, while a service provider may practice bundling to its own advantage, the use of bundling in an increasingly competitive market may produce advantages for both buyers and sellers.
For example, Microsoft Office is a mixed bundle as Microsoft Word and Microsoft Excel are each available as an individual product, although there is a significant discount for purchasing them together as a part of the Office Suite. A related concept is that of tying which refers to an intermediate situation where a firm makes conditional the purchase of a second service when a customer wishes to buy a first service. In this situation, only the first service cannot be bought separately.
The theoretical literature on bundling highlights several motives to engage in bundling. For example, second-degree price discrimination or charging a different price for different quantities is relevant to the current situation. Quantity discounts for bulk purchases is a common pricing strategy in this field. Stigler (1963) showed that bundling can be profitable even without demand complementarity or scope economies. He also found that when there are high fixed costs of production and consumers prefer varieties of a product, economic efficiency increases. For instance, let there be two TV channels, “sports” and “news” and each costs INR10 to produce.92 Let us assume this is the cost for broadcast to two consumers. Consumer 1 is willing to pay INR7 and INR4 for the sports and news channels respectively, and consumer 2 is willing to pay INR4 and INR7 for the sports and news channel respectively. If each of the channels is offered at INR10, none of the consumers will buy the channels. If each is offered at Rs 7, revenue would be INR7 for each channel and loss accrued would be INR3. If each is offered at INR4 and purchased by both consumers, revenue would be INR8 and each channel
____________________________________________________
90 Iyengar, S.S. & Iepper, M.R. (2000). “When choice is demotivating: can one desire too much of a good thing?” Journal of Personality and Social Psychol-ogy, 79 (6), 995-1006
91 Chernev, A. & Hamilton, R. (2009). “Assortment size and option attractiveness in consumer choice among retailers,” Journal of Marketing Research, 46 (3), 410-420.
92 This example is adapted from Gandal et al, 2012, “Ain’t it Suite? Bundling in the PC Office Software Market”

35
would lose Rs 2. The producers are unlikely to adopt any of the pricing strategies illustrated above. However, if bundling is allowed, both channels could be offered in a bundle for INR10 and both consumers, willing to pay a total of INR11 will purchase. Revenue for the producers would be INR 20, covering costs for both channels, and consumers gain INR1 as surplus. Bundling, therefore, can be economically efficient.
Others have expanded Stigler’s view and found that bundling improves economic efficiency in a variety of situations, including when there are economies of scope and scale. A key insight is that bundling works best when the values attached to the bundled goods are negatively correlated.93 A study by Salinger94 found that bundling two goods tends to be profitable when consumer valuation is negatively correlated and high, relative to marginal costs.95 His study offered the cost savings argument to justify bundling as a way to generate a product with more value. This cost synergy is based on the capacity of a firm to combine products into a bundle vis-à-vis the consumer. Using this perspective, bundling is typically pro-competitive and consumer friendly and therefore, does not require any regulatory intervention. Kobayashi (2005b) astutely summarises the arguments on bundling. In many cases where bundling is observed, the reason why separate goods are sold in a package is easily explained on efficiency grounds. This is certainly the presumptive explanation for bundling when it occurs in highly competitive markets. However, the efficiencies-based explanations also apply with equal force to the use of bundling by firms with market power. In addition, firms with market power can use bundling as a price discrimination device, or as a way to internalise pricing externalities in the presence of complementary goods. However, in markets where firms can exercise monopoly power, bundling can have anti-competitive uses that may
be scrutinised under anti-trust laws. Because bundling can also be an efficient practice when firms possess market power, any rational antitrust evaluation of bundling must consider simultaneously both the strategic and efficiency reasons for bundling.96
From our analysis in Section 2, we find that the market for DTH and cable TV, individually as well combined, is significantly competitive. A recently approved merger immediately before the TRAI tariff order suggests that CCI did not find or envisage market abuse by the remaining providers. In general, in competitive markets, bundling of channels can in fact increase efficiency for broadcasters and distributors and be welfare enhancing for consumers. Competition authorities, however, must oversee the anti-competitive uses of bundling and guard against any abuse of monopoly power. The proposed remedies are ex post rather than ex ante.
4.2.2.2 Cross-country comparisons of bundling versus à la carte pricing
The welfare inducing effects of bundling vis-à-vis single pricing or à la carte pricing has been examined for TV broadcasting and distribution services across several countries. Various countries including the United States and Canada had proposed and implemented an à la carte regulation for TV broadcasting and distribution. In the United States, both politicians and consumers proposed elimination of the cable bundling model because they believed offering channels in this manner effectively forces people to pay for products they do not want. Consumers also believed that an à la carte mandate has the potential to lower consumer bills, since they would pay only for channels they actually want to watch. However, evidence on the à la carte model reducing consumer bills is highly disputed.
____________________________________________________
93 McAfee, R. P., J. McMillan, M. D. Whinston. 1989. Multiproduct monopoly, commodity bundling, and correlation of values. Quarterly Journal of Eco-nomics 114 (May) 71–84
94 Salinger, M. A. 1995. A graphical analysis of bundling. Journal of Business 68(1) 85–98.95 Salinger, M. A. 1995. A graphical analysis of bundling. Journal of Business 68(1) 85–9896 Kobayashi, B.H., 2005a, Does Economics Provide a Reliable Guide to Regulating Commodity Bundling by Firms? A Survey of the Economic Literature,
Journal of Competition Law & Economics, 1: 707-746.

An Analysis of Competition and Regulatory Intervention in India’s Television Distribution and Broadcasting Services
36
The Media Bureau of the Federal Communications Commission (FCC) in 2004 studied the efficacy of ‘à la carte pricing in the pay-television service industry. The report found that for most pay TV households, an à la carte regime would not produce the desired result of lower multi-channel video programming distributor (MVPD) rates. The report concluded that if the average household purchased channels under an à la carte regime, it was likely to face a monthly increase of payments of between 14 per cent and 30 per cent.97,98 Their report also concluded that mandatory à la carte distribution would very likely harm new and niche networks, which would result in fewer viewing options for consumers. However, the 2006 FCC report reached the opposite finding, concluding that consumers would see “substantial benefits” from an à la carte model.99 Senator John McCain attempted to pass the Consumers Having Options in Cable Entertainment (CHOICE) Act in 2006 to mandate an à la carte model.100 The bill ultimately failed and cable prices continued to soar.
Another independent study by Rennhoff and Serfes in 2008 concluded that while the average cable bill would
fall by 15 to 20 per cent under an à la carte regime, the profits of cable companies would also fall. The authors used a policy simulation model that explicitly studied the strategic interaction between cable providers and programming networks. The same study found that some programming networks would benefit while others would be harmed. The study used industry data and hypothesised how content producers and cable providers would react to market conditions under an à la carte system.101 A subsequent paper in 2009 used numerical simulations of firm pricing strategies, using willingness-to-pay values derived from a logit model of demand. The paper concluded that while an à la carte regulation brings benefits to consumers; its net impact on consumer welfare is ambiguous and could differ across channel genres. They also found that cable operator profits fall under such a regime.102 Similar conclusions were made by Crawford and Cullen in 2008.103
In 2011, Crawford and Yurukoglu, in their paper titled “The Welfare Effects of Bundling in a Multichannel Television Market,”104 examined the welfare consequences of bundling in the short run. Through their
____________________________________________________
97 The average cable household watches approximately 17 channels, including broadcast stations98 Media Bureau Releases Report on Cable À la carte Pricing Model. https://www.fcc.gov/document/media-bureau-releases-report-cable-la-carte-pricing-
mode99 CRS Report for Congress The FCC’s “à la carte” Reports March 30, 2006 100 Detlantic, May 9, 2013, http://www.theatlantic.com/business/archive/2013/05/can-johnmccain-break-up-the-cable-bundle-forever-no-probably-
not/275735.101 Adam D. Rennhoff & Konstantinos Serfes, Estimating the Effects of à la carte Pricing: The Case of Cable Television 1, 2 (January 18, 2008), available
at http://papers.ssrn.com/sol3/papers.cfm?abstract_id= 1085392; Washington Post, À la carte Cable Served Up as Solution, Pittsburgh Tribune. Review., March 27, 2004,
http://triblive.com/x/pittsburghtrib/business/s_186582.html#axzz2wGzY5aLg.102 Rennhoff, Adam D. and Serfes, Konstantinos, Estimating the Effects of à la carte Pricing: The Case of Cable Television (January 18, 2008). Available at
SSRN: https://ssrn.com/abstract=1085392. or http://dx.doi.org/10.2139/ssrn.1085392”.103 Crawford, G., “The Discriminatory Incentives to Bundle in the Cable Television Industry,” Quantitative Marketing and Economics, 2008, 6 (1), 41–78104 The authors have modelled viewership, demand, pricing, bundling, and input market bargaining of multi-channel television services. They first
combine television viewership (ratings) data with bundled market shares and prices to estimate the distribution of household preferences for each of fifty cable television channels. They estimated the input costs that distributors, such as Comcast or DirecTV, currently pay to content conglomerates, such as ABC Disney (which owns ESPN and The Disney Channel, among others) or Viacom (which owns MTV and Comedy Central, among others), for each of these channels using aggregate cost data and observed pricing and bundling decisions. The central innovation of the model is accounting for the change in distributors’ input costs that result from bargaining between content and distribution in an à la carte world. To do so, the authors have used the demand and cost estimates to estimate the parameters of a bilateral oligopoly bargaining model of the input market. Holding the estimated demand and bargaining parameters fixed, the paper has simulated a world where distributors are forced to unbundle channels, critically allowing for the renegotiation of contracts between channel conglomerates and distributors.
37
modelling of viewership, demand, pricing, bundling and input market bargaining, they find that for fixed input costs, unbundling unlocks consumer welfare. If input market renegotiation is not allowed, consumer welfare increased by 19.2 per cent and industry profits decline by 12.7 per cent. Allowing renegotiation, input costs increased by almost 103 per cent. Prices follow suit, making the average consumers indifferent. The study also estimated that for higher equilibrium input costs, consumer welfare changes between -5.4 per cent and 0.2 per cent and total welfare changes between (-)1.7 per cent and 6.0 per cent in the short-run.
Needham Insights, in its 2013 report titled “Valuing Consumers’ TV Choices” estimated the consumer value destruction from TV unbundling.105 Their study revealed that à la carte pricing could adversely impact consumer value by approximately $80-$113 billion due to a loss of channel choice.106 Additionally, $45 billion of TV advertising revenue and 1.4 million jobs would be at risk. The report has also established a similar impact on taxes paid, and market capitalisation. In a recent news item on the TV industry in the United States,107 reporters claimed that the industry was not still open to selling channels individually. À la carte TV arguably does not make financial sense. For such a model to work, TV networks would either have to charge more for each channel or gain significantly more subscribers overall. The former would probably wipe out any cost savings for consumers, and the latter seems unlikely. However, direct to consumer streaming services, which are practically à la carte, are gradually replacing traditional TV, but a complete transformation is not going to happen overnight.
The impact of an à la carte regulation has also been examined in Canada. In a 2014 report by Oliver
Wyman,108 the authors studied the impact of unbundled packaging options for specialty and pay TV services in Canada. It evaluated the proposed approach of the Canadian Radio-television and Telecommunications Commission (CRTC) to maximise consumer choice and flexibility by proposing
a) Offer a “small basic” package with just a selection of Canadian services and
b) Offer all other programming services on a 1) pick and-pay basis (i.e., choose channels on an individual, à la carte basis); and 2) a build-your-own-package basis (also known as “pick-packs”, consisting of pay and specialty channels).
An evaluation of these changes found that a relatively small number of Canadian consumers interested in a limited number of programming services would enjoy lower bills through small basic packs or a build your own package (BYOP) option. However, a majority of consumers would experience higher bills (up to 12 per cent depending on the scenario). Additionally, consumers opting for à la carte/BYOP options would lose much of the option value and potential enjoyment of discovering (or being directed to discover) new and diverse programming. The unbundling approach would also have an adverse impact on the broadcasting sector. The study finds that as many as 26 per cent of the current channels could be at a risk of becoming commercially unviable in one of the modelled scenarios. Given the potential loss of programming services and declining revenues experienced by broadcasters and broadcasting distribution undertakings (BDUs), there would be a reduction in funding to the Canadian production sector. The CRTC’s proposed approach could result in a reduction of $39 million of funding to Canadian production businesses and a cumulative negative impact of $93
____________________________________________________
105 Valuing Consumers’ TV Choices , NEEDHAM Insights. December 1, 2013; http://www.capknowledge.com/research_reports/media_theme_research_re-ports/old_reports/2013_12_01_Valuing_Consumers_TV_Choices_final.pdf
106 The firm based its estimates on the assumption that the average annual operating cost of an entertainment cable channel is $280 million, which would require at least 165,000 viewers to break even.
107 https://www.techhive.com/article/3296376/streaming-services/why-à-la-carte-tv-still-isnt-happening.html108 Oliver Wyman (2014) “TV Unbundling- An economic and consumer experience impact assessment of the Canadian Radio-television and Telecommuni-
cations Commission’s (CRTC’s) proposed approach

An Analysis of Competition and Regulatory Intervention in India’s Television Distribution and Broadcasting Services
38
____________________________________________________
109 https://business.financialpost.com/telecom/pick-and-pay-tv-system-a-hit-with-canadians-nearly-one-third-bought solo-channels-report110 Television à la carte 206, Media –monitor https://www.mediamonitor.nl/tvpakketten/televisie-a-la-carte-2016/#111 Indian consumers value conscious, more demanding
https://www.financialexpress.com/industry/banking-finance/indian-consumers-value-conscious-more-demanding/202029/112 Statista 113 International Communications Market Report 2017, OFCOM
million on both independent and non-independent Canadian production. Overall, the CRTC’s proposed approach could result in up to almost $670 million of value loss from the television ecosystem. Despite the research, when the regime was mandated in Canada, less than 100,000 people signed up for smaller packages, less than 1 per cent of Canada’s 11 million TV subscribers. Most subscribers continued to buy larger packs and some consumers noted that the ability to select individual channels did not result in better deals.109 The mandate did not regulate the pricing of individual stations.
The Growth for Knowledge (GFK) research bureau in Netherlands conducted a survey to test the consumer preference for an à la carte mandate. Their sample consisted of 2010 respondents. The survey indicated that viewers were satisfied with their current television packages. Although they indicated their preference for choosing their own channels using an à la carte menu, the majority would drop out if the prices of the package were to increase as a result. In addition, if viewers were to compile their package themselves, fewer channels would be chosen in the package and diversity would be compromised.110
Appendix 12 cites tariff regulations as reported by the Asia Video Industry Association (AVIA) (previously known as the Cable and Satellite Broadcasting Association of Asia (CASBAA) for several countries including Australia, China, Hong Kong, Malaysia, the United Kingdom and Japan. Most countries do not mandate à la carte regimes. The examples from different countries suggest that the implications of an à la carte regime are complex and in no way unambiguously welfare enhancing. A BCG-CII research carried out with consumers in more than 10 countries found that Indian consumers are
more demanding and price sensitive than some of their global peers.111 Price cap regulations and price sensitive consumers have led to distortions in revenue collections for the industry. The share of advertisement revenue for Indian broadcasters is close to 60 per cent of their total revenue, while that for US and UK hover around 40 per cent.112 This also ties in with an upper limit of 12 minutes per hour of ad time allowed to broadcasters in India as against seven minutes in the UK.113 With regulated pricing for content, broadcasters may be tempted to monetise through other means.
As stated above, most broadcasters have bumped up the à la carte price for popular channels following the new tariff order. On the one hand, this could drive up the bills for consumers with inelastic TV viewing preferences, but it may also impact the uptake of channels for price sensitive consumers. This would consequently affect the profitability of broadcasters and distributors. The demand for reporting and building transparency across the value chain is overriding, but the implementation would involve huge compliance costs. Moreover, a significant part of the industry has been excluded from the ambit of the tariff order. Approximately 36 per cent of DAS III (9 million analogue homes) and 80 per cent of DAS IV (27 million analogue subs) are still pending. Any order of such a transformative nature must be preceded by a thorough analysis of its economic impact, including a consumer survey to identify preferences among users for a change in the regime. Simultaneously, a simulation of the impact on the overall industry would be necessary. It also ought to include the role of emerging OTT players and video streaming preferences. There is little doubt that such an analysis would be very complex and informationally demanding.

39
5. Conclusions and Policy RecommendationsTechnology and content innovation have led to robust growth in India’s TV broadcasting and distribution industry. Regulatory interventions such as implementation of the digital addressable systems have enabled the growth of a diverse and rapidly evolving multi-platform industry with cable, DTH, IPTV and OTT operators. Our analysis finds that India is the second largest television market in the world and is adequately competitive in the DTH sub-segment. Competition in cable TV services, however, is not uniform across the country. MSOs and LCOs are mostly regional operators; while some regions (mostly North India) benefit from the service of multiple cable operators, states in the South see some monopolisation by cable operators. DTH services, on the other hand, are mostly delivered across the country.
In an attempt to address alleged malpractices adopted by broadcasters and DPOs, TRAI recently ordered and implemented the “Telecommunication (Broadcasting and Cable) Services (Eighth) (Addressable Systems) Tariff Order”, 2017, to provide affordable à la carte channels to consumers and a transparent display of rates by broadcasters on an Electronic Programme Guide such that stakeholders across the value chain are benefitted. The order has inadvertently given broadcasters the power to set retail prices for channels, both à la carte and bouquet. The order was met with mixed reactions. The order, implemented on February 1, 2019, will clearly benefit consumers who wish to watch a particular profile of channels. However, the outcome for families watching multiple profiles of channels will be ambiguous as consumers having to select wisely from a set of 800 channels may be faced with inconvenience and ‘post-choice dissatisfaction’.
At the wholesale level, negotiations and price-setting among broadcasters and DPOs is likely to become more transparent and uniform. At the same time, the cost of complying with new regulatory requirements will increase and may affect market efficiency. While competition authorities must examine and purge monopoly abuse of any form, including bundling, ex ante restrictions on bundling in a competitive market may obviate benefits from being delivered to consumers. Economic theory has established the use of price discrimination strategies such as bundling are efficiency enhancing in competitive markets. TRAI must engage in an outcome analysis of such policy interventions that capture consumer preferences and measure welfare.
Evidence from other countries also supports the thesis of light touch regulation. In Canada, the proposed à la carte regime was estimated to cost almost $670 million of value loss from the television ecosystem. Interestingly, online streaming services are rapidly replacing TV viewership in some of the developed countries. Instead of endless browsing through channels, users of online streaming services can now pick what they want to watch, and when they want it. OTT pay TV services are packaged to offer à la carte. OTT is growing rapidly in India, a service differentiator in terms of user interface, flexibility, technology, etc.
The TV market in India currently offers multiple choices to consumers. A light touch regulation approach may naturally nudge the industry towards the optimal equilibrium. Over regulation in a competitive market may force consumer choices towards a particular technology. Regulators must place trust in the invisible hand for the industry to achieve its maximum potential.

An Analysis of Competition and Regulatory Intervention in India’s Television Distribution and Broadcasting Services
40
BibliographyAdams. W. J and Yellen. J.L (1976). “Commodity bundling and the burden of monopoly”. Quarterly Journal of Economics. 90 (August) 475–498
Adam D. Rennhoff & Konstantinos Serfes (2008). “Estimating the effects of à la carte pricing: The case of cable television” 1, 2 (January 18, 2008), available at http://papers.ssrn.com/sol3/papers.cfm?abstract_id= 1085392; Washington Post, à la carte cable served up as solution, Pittsburgh Tribune Review., March 27, 2004,
Bansal. S (2017). “In pursuit of digitizing India,” Live Mint, September 21, 2017. https://www.livemint.com/Opinion/BxuAE4da07SbuUCfNrnbdN/I.n-pursuit-of-digitizing-India.html. Last accessed March 5, 2019
BARC India, Road Show Presentation, May 2018.
Bauer. J (2012). “Regulation and Innovation in Telecommunications,” Quello Center for Telecommunication Management and Law, Working Paper 01-2012.
CRS Report for Congress. The FCC’s further report on à la carte pricing of cable television” Reports March 30, 2006
Chernev, A. & Hamilton, R. (2009). “Assortment size and option attractiveness in consumer choice among retailers,” Journal of Marketing Research, 46 (3), 410-420.
Cision PR news wire (2013). “India Media and Entertainment Industry; Radio, Television and Broadcast”, December 2013. https://www.prnewswire.com/news-releases/india-media-and-entertainment-industry-radio-television-and-broadcast-237297561.html. Last accessed March 5, 2019
Consultation Paper on Tariff Issues related to TV Services, Consultation Paper No.: 01/2016.https://trai.gov.in/sites/default/files/CP_Tariff_issues_29_Jan_2016_final.pdf
Crawford, G (2008) “The Discriminatory Incentives to Bundle in the Cable Television Industry,” Quantitative Marketing and Economics, 2008, 6 (1), 41–78
Deloitte (2018). “Economic Contribution of the Film and Television Industry in India”, March 2018. https://www.mpa-i.org/wp-content/uploads/2018/05/India-ECR-2017_Final-Report.pdf. Last accessed March 5, 2019
Evaluation Report on Satellite Instructional Television Experiment (Site) – 1981, PEO Study No.119.http://planningcommission.nic.in/reports/peoreport/cmpdmpeo/volume2/erosi.pdf
Iyengar, S. S. & Iepper, M. R. (2000). “When choice is demotivating: can one desire too much of a good thing?” Journal of Personality and Social Psychology, 79 (6), 995-1006
Kathuria. R (2004). “Trade In Telecommunication Services: Opportunities and Constraints,” ICRIER Working Paper No. 149. http://icrier.org/pdf/wp149.pdf
Khandekar. V (2017). “What is happening at Discovery India?”, Business Standard, July 28, 2017. https://www.business-standard.com/article/companies/what-is-happening-at-discovery-india-117072800061_1.html. Last accessed March 5, 2019

41
Krishna. K.P (2018). “Pay Channel rates list under new TRAI Tariff Order – December 29 Deadline”, Preview Tech News, December 22, 2018. https://previewtech.net/pay-channel-rate-list-trai-tariff-order-2393/
McAfee, R. P., McMillan. J and Whinston, M. D. (1989). “Multiproduct monopoly, commodity bundling, and correlation of values”. Quarterly. Journal of economics. 114 (May) 71–84
Menon. B (2018). “OTT players tie up with DTH operators, TV-makers to distribute digital content”, Hindu Business Line, January 09, 2018. https://www.thehindubusinessline.com/ companies/ott-players-tie-up-with-dth-operators-tvmakers-to-distribute-digital-content/article9969957.ece. Last accessed March 5, 2019
MRP of pay channels, offered by broadcasters to subscriber as reported to TRAI http://main.trai.gov.in/sites/default/files/PayChannels18122018_0.pdf
Naidu. R (2018). “Cable companies ARPU gains a plus for TV broadcasters”, Economic Times, March 15, 2018 . https://economictimes.indiatimes.com/markets/stocks/news/cable-companies-arpu-gains-a-plus-for-tv-broadcasters/articleshow/63313069.cms. Last accessed March 5, 2019
Naik. A (2017). “TRAI Tariff Orders – Effect on Broadcasting Sector.” New channel tariff regime aims to increase transparency in Indian TV market, IHS Markit, December 19, 2018. https://technology.ihs.com/609738/india-to-implement-new-tv-tariff-regime
International Communications Market Report 2017, OFCOM. https://www.ofcom.org.uk/__ data/assets/pdf_file/0032/108896/icmr-2017.pdf. Last accessed March 5, 2019
Kobayashi, B.H. (2005a). “Does Economics Provide a Reliable Guide to Regulating Commodity Bundling by Firms? A Survey of the Economic Literature”, Journal of Competition Law & Economics, 1: 707-746.
Oliver Wyman (2014) “TV Unbundling – An economic and consumer experience impact assessment of the Canadian Radio-television and Telecommunications Commission’s (CRTC’s) proposed approach
Panjari. S (2018). “In-depth: Decoding the impact of new tariff regime on consumers, channels, cable and DTH player, Best Media Info, December 26, 2018. , .https://bestmediainfo.com/posts.php?year=2018&month=12&title=decoding-the-impact-of-new-tariff-regime-on-consumers-channels-cable-and-dth-players/. Last accessed February 2, 2019
Prasarbharti.gov.in; http://prasarbharati.gov.in/Free DishFree Dish.php
Press Trust of India (2018). “Tata Sky, Netflix tie up for content delivery, Business Line, April 24, 2018, https://www.thehindubusinessline.com/companies/tata-sky-netflix-tie-up-for-content-delivery/article23656883.ece. Last accessed January 18, 2019
Ravi. S (2014). “Relevant Market’ In Cable And DTH Market: A Case Law Formulated Opinion Paper” presented at panel Policy Analysis of Television Distribution IAMCR, Hyderabad, 16-19 July, 2014, https://indianmedialogue.com/2014/07/24/ relevant-market-in-cable-and-dth-market-a-case-law-formulated-opinion-a-draft-paper/. Last accessed January 21, 2019
Recommendations on Monopoly/Market dominance in cable TV services November 26, 2013
Re-Imagining India’s M & E sector, Ernst and Young, March 2018.
Response of Indian Broadcasting Foundation (IBF) to the Consultations of Telecom Regulatory Authority India on Draft:https://main.trai.gov.in/sites/default/files/Indian_ Broadcasting_Foundation_RC_10102016.pdf

An Analysis of Competition and Regulatory Intervention in India’s Television Distribution and Broadcasting Services
42
Rose. J and A. Frank (2016). “The Future of Television: Where the US Industry Is Heading”, BCG https://www.bcg.com/en-in/publications/2016/media-entertainment-technology-digital-future-television-where-us-industry-is-heading.aspx. . Last accessed December, 2019
Salinger, M. A. (1995). “A graphical analysis of bundling”. J. Bus. 68(1) 85–98
Samtani. K and Jindal. G (2018). “Entertainment Goes Online – A $5 Billion Opportunity”, Boston Consultancy Group. http://image-src.bcg.com/Images/Entertainment-Goes-Online_tcm 21-208006.pdf. . Last accessed November 2018.
Saxena. N (2018). “Why TRAI still cannot implement tariff order, Exchange 4 Media https://www.exchange4media.com/media-tv-news/why-trai-still-cannot-implement-tariff-order-90155.html. Last accessed January 2019..
Schmalensee, Richard (1984), ‘Gaussian demand and commodity bundling’, Journal of Business, 57 (1), S211–S230.
Sixteenth Lok Sabha Ministry Of Information And Broadcasting Status Of Cable TV Digitisation And Interoperability Of Set Top Boxes Forty-Fourth Report, http://164.100.47.193/lsscommittee/Information%20Technology/16_Information_Technology_44.pdf. Last accessed March 2019.
Stigler. J (1963). “United States v. Loew’s Inc.: A Note on Block-Booking,” The Supreme Court Review 1963 (1963): 152-157.https://doi.org/10.1086/scr.1963.3108731. Last accessed March 2019.
Telecommunication (Broadcasting And Cable) Services (Third) (CAS Areas) Tariff (Third Amendment) Order, 2008
The Telecommunication (Broadcasting and Cable) Services (Fourth) (Addressable Systems) Tariff (Sixth Amendment) Order, 2015.
TRAI Consultation Paper on tariff issues related to TV services, January 29, 2016
The Telecommunication (Broadcasting and Cable) Services (Eighth) (Addressable Systems) Tariff Order, 2017 TRAI vs. STAR and Vijay TV Madras High Court Judgement. https://barandbench.com/wp-content/uploads/2018/03/trai-judgement-w_p_-nos_44126-and-44127-of-2016-1-1-watermark.pdf. Last accessed February2019.
TRAI performance Indicator Report, 2018
Valuing Consumers’ TV Choices, NEEDHAM Insights. December 1, 2013; http://www.capknowledge.com/research_reports/media_theme_research_reports/old_reports/2013_12_01_Valuing_Consumers_TV_Choices_final.pdf. Last accessed February2019.
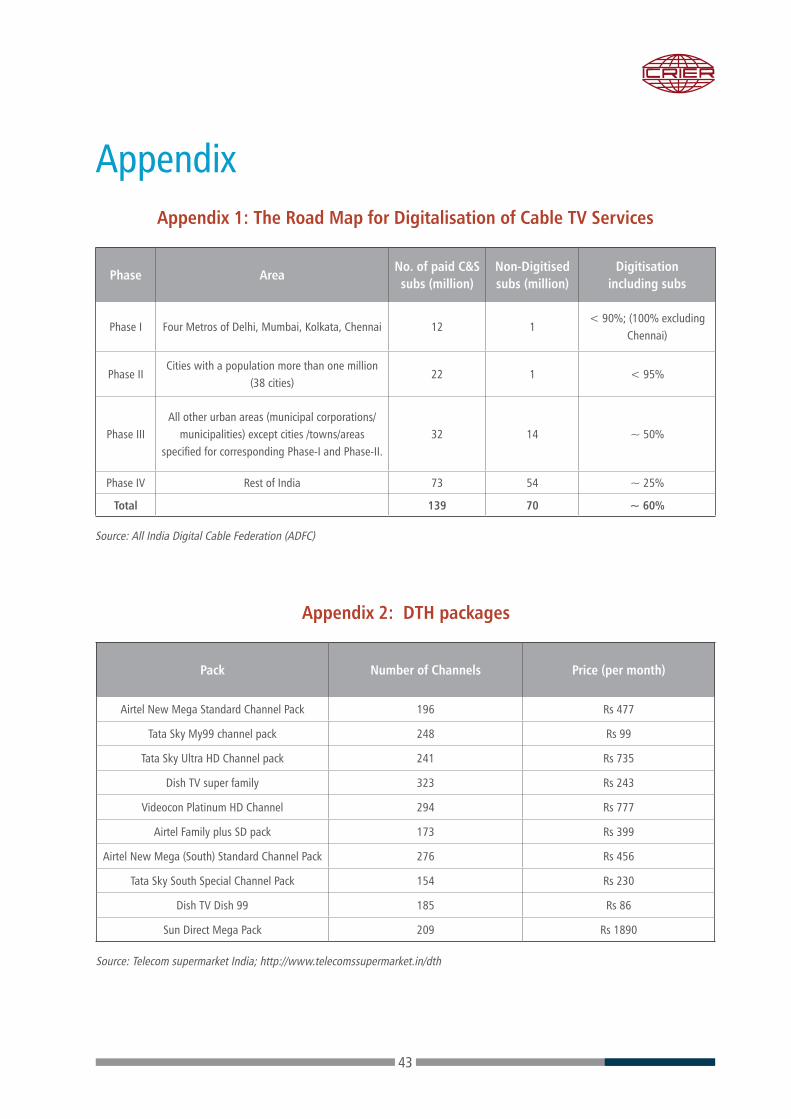
43
AppendixAppendix 1: The Road Map for Digitalisation of Cable TV Services
Appendix 2: DTH packages
Phase AreaNo. of paid C&S subs (million)
Non-Digitised subs (million)
Digitisation including subs
Phase I Four Metros of Delhi, Mumbai, Kolkata, Chennai 12 1< 90%; (100% excluding
Chennai)
Phase IICities with a population more than one million
(38 cities)22 1 < 95%
Phase IIIAll other urban areas (municipal corporations/
municipalities) except cities /towns/areas specified for corresponding Phase-I and Phase-II.
32 14 ~ 50%
Phase IV Rest of India 73 54 ~ 25%
Total 139 70 ~ 60%
Source: All India Digital Cable Federation (ADFC)
Pack Number of Channels Price (per month)
Airtel New Mega Standard Channel Pack 196 Rs 477
Tata Sky My99 channel pack 248 Rs 99
Tata Sky Ultra HD Channel pack 241 Rs 735
Dish TV super family 323 Rs 243
Videocon Platinum HD Channel 294 Rs 777
Airtel Family plus SD pack 173 Rs 399
Airtel New Mega (South) Standard Channel Pack 276 Rs 456
Tata Sky South Special Channel Pack 154 Rs 230
Dish TV Dish 99 185 Rs 86
Sun Direct Mega Pack 209 Rs 1890
Source: Telecom supermarket India; http://www.telecomssupermarket.in/dth

An Analysis of Competition and Regulatory Intervention in India’s Television Distribution and Broadcasting Services
44
Appendix 3: Percentage of respondents and State wise type of connection from 2016-2018
States Cable without Set Top Box Cable with Set Top Box DTH Connection
2016 2017 2018 2016 2017 2018 2016 2017 2018
Andhra Pradesh 21.78 11.51 0.55 54.55 56.40 67.28 23.94 32.52 32.44
Assam 23.13 4.29 1.38 52.47 63.29 66.80 24.56 32.42 31.82
Bihar 6.69 0.38 0.82 61.66 34.96 66.39 31.82 65.23 33.14
Chandigarh 0.00 0.00 0.44 74.53 64.07 69.30 25.47 35.59 30.70
Chhattisgarh 19.92 2.59 1.20 55.20 60.75 59.33 25.51 36.74 40.07
Delhi 0.00 0.40 0.17 65.05 61.18 61.28 35.70 38.02 38.54
Goa 42.17 0.34 0.45 30.03 60.48 68.64 28.75 39.18 30.91
Gujarat 5.31 5.03 2.28 66.54 58.83 62.82 28.92 36.25 34.71
Haryana 13.85 4.12 0.69 60.19 59.11 61.06 27.83 37.46 38.94
Himachal Pradesh 9.90 0.61 0.19 59.54 52.91 50.10 30.56 45.86 49.90
Jharkhand 18.00 1.96 2.40 55.01 33.77 66.07 27.81 64.49 31.53
Karnataka 23.33 3.65 0.69 51.53 61.05 67.57 28.75 35.55 31.74
Kerala 4.06 5.34 2.93 71.90 59.77 63.33 24.41 34.48 33.99
Madhya Pradesh 15.17 3.92 2.70 50.76 52.94 54.17 34.45 43.15 42.89
Maharashtra 9.55 7.92 0.85 64.71 57.92 65.26 27.16 34.31 33.81
Orissa 32.29 2.23 0.28 40.44 63.78 68.10 27.35 33.91 32.18
Punjab 0.00 1.43 0.72 69.09 58.87 58.54 33.40 41.75 42.18
Rajasthan 1.97 5.93 10.88 65.56 40.93 38.96 33.30 52.79 50.54
Tamil Nadu 64.31 54.69 36.69 8.33 4.38 34.62 28.29 41.78 28.86
Telangana 5.79 0.18 0.92 64.86 66.00 68.58 29.79 33.45 30.62
Uttar Pradesh 6.44 1.95 1.58 59.20 51.18 46.82 35.12 46.73 51.13
West Bengal 18.46 1.51 0.20 55.19 65.01 69.61 26.82 34.82 31.67
Meghalaya 8.51 1.20 63.83 69.40 27.66 29.40
Nagaland 1.12 70.00 69.10 30.00 29.78
% of Respondents who said yes for the type of connection
15.25 7.12 3.97 56.14 52.94 58.28 29.59 40.19 37.94
Respondents who said Yes 5,605 2,376 1,152 20,635 17,663 16,932 10,876 13,409 11,021

45
Appe
ndix
4: S
tate
wis
e di
strib
utio
n of
cab
le s
ervi
ce p
rovi
ders
201
8
53
App
endi
x 4:
Sta
te w
ise
dist
ribu
tion
of c
able
serv
ice
prov
ider
s 201
8
State
Ashi
ana
Comm
unica
tions
/ A
shian
a Cab
le
Bhav
ani
Rajes
h Ca
ble
Dars
h Di
gital
Delh
i Di
strib
utio
n Co
mpan
y (DD
C)
DEN
Digic
able
Fastw
ayGT
PLHa
thwa y
Home
Ca
ble
Home
Sy
stem
Indu
sind /
In
Digit
al /In
Ca
ble
Nova
base
/ No
va
Digit
al
Satel
lite
Chan
nel
s Pvt
Ltd.
(SCP
L)
Sea T
V /S
ea
Digit
al
Siti
Cabl
eUC
N Ca
ble
Othe
r1Ot
her2
Othe
r3Ot
her4
Not
Awar
e
No
Resp
onse
Total
Andh
ra Pr
ades
h21
8312
52
312
639
4022
21
013
438
11
00
160
350
1,085
Assa
m2
00
00
00
760
130
00
34
871
51
590
208
231
726
Biha
r0
022
10
160
70
310
16
00
01
104
09
23
243
279
851
Chan
diga
rh0
00
00
013
80
00
00
00
04
00
00
160
7022
8Ch
hatis
garh
09
02
00
10
980
01
00
314
33
127
411
010
833
583
6De
lhi
00
01
254
33
023
00
02
02
520
50
01
822
257
6Go
a0
00
00
13
019
500
10
00
120
170
048
168
220
Gujar
at0
21
170
133
901
33
012
01
018
03
00
1411
566
1,622
Hary
ana
01
00
179
040
030
20
10
10
264
02
01
310
334
868
Hima
chal
Prad
esh
00
00
00
191
00
00
00
00
580
00
04
325
951
5Jh
arkh
and
03
10
191
074
217
00
00
528
09
02
625
105
333
Karn
ataka
00
64
308
75
624
87
212
70
17
140
015
10
193
550
31,5
85Ke
rala
40
13
149
323
12
221
10
80
391
261
1514
983
277
818
Madh
ya Pr
ades
h1
20
02
124
121
296
110
00
02
153
199
31
4011
528
1,224
Maha
rash
tra23
68
539
530
2421
943
113
45
269
511
116
724
551
107
305
146
1,280
3,777
Oriss
a0
00
00
01
049
00
00
00
60
460
137
612
230
721
Punj
ab0
00
01
463
90
10
00
00
03
00
00
61
457
1,112
Rajas
than
46
2233
351
6920
4682
3618
62
511
443
144
430
247
1,076
2,133
Tami
l Nad
u1
00
10
171
131
3112
10
11
441
253
316
689
350
31,7
36Te
langa
na12
104
53
361
99
124
111
613
41
1282
02
00
00
266
872
Uttar
Prad
esh
10
03
1,245
8711
20
797
06
10
5617
620
81
098
702,1
354,1
05W
est B
enga
l0
01
011
426
130
636
80
00
00
342
30
263
040
468
764
2,507
Megh
alaya
10
00
00
02
00
10
00
017
026
21
204
3812
341
5Na
galan
d0
00
00
00
10
10
00
00
340
50
014
7053
178
No Re
spon
se0
00
00
00
00
00
00
00
00
00
00
08
8To
tal70
216
278
613,2
5251
31,1
971,7
001,9
2548
612
843
015
3212
12,5
3629
431
638
472,3
732,0
0111
,022
29,05
1

An Analysis of Competition and Regulatory Intervention in India’s Television Distribution and Broadcasting Services
46
Appendix 5: Percentage of respondents using DTH connection across various operators including cable and others (2016 )
DD Free Dish Airtel Dish TVReliance Digital
Sun Direct Tata Sky Videocon
Andhra Pradesh 0.09 4.13 4.88 0.75 4.79 3.47 1.88
Assam 0.00 10.05 3.59 0.64 0.00 5.58 1.28
Bihar 0.26 5.40 2.40 0.26 0.09 12.44 1.97
Chandigarh 0.00 4.40 1.57 0.63 0.00 6.92 6.29
Chhattisgarh 1.57 2.28 8.11 0.63 0.00 6.69 1.42
Delhi 0.37 4.85 6.09 0.37 0.12 7.59 3.73
Goa 0.00 3.19 5.75 0.32 0.00 7.35 5.11
Gujarat 0.96 7.74 4.59 0.96 0.19 5.31 4.97
Haryana 2.85 5.83 6.02 0.52 0.13 6.08 3.30
Himachal Pradesh 3.44 3.59 4.73 1.15 0.00 9.33 1.58
Jharkhand 12.07 14.31 4.70 0.00 0.41 1.64 1.64
Karnataka 0.23 4.10 1.87 2.05 6.74 3.23 3.87
Kerala 0.15 4.35 2.80 1.11 5.83 2.43 4.13
Madhya Pradesh 5.37 3.41 5.18 1.07 0.76 4.17 6.13
Maharashtra 1.82 2.73 3.62 0.73 0.25 4.83 5.58
Orissa 1.96 4.08 4.47 0.47 0.78 8.70 4.94
Punjab 3.70 6.82 6.76 0.38 0.00 2.68 4.14
Rajasthan 2.49 4.40 3.83 1.50 0.16 5.75 4.04
Tamil Nadu 0.04 3.33 8.66 0.33 5.41 1.59 1.83
Telangana 0.52 1.26 7.58 1.93 9.36 2.60 0.45
Uttar Pradesh 5.85 4.95 3.75 0.42 0.06 5.83 4.97
West Bengal 0.08 5.38 3.48 0.15 0.08 6.00 4.57
Total 2.12 4.69 4.61 0.76 1.60 5.13 3.87

47
Appe
ndix
6: L
angu
age
TV is
wat
ched
55
App
endi
x 6:
Lan
guag
e T
V is
wat
ched
Stat
e
Hind
iEn
glis
hM
arat
hiTa
mil
Kann
ada
Beng
ali
Mal
ayal
amTe
lugu
Guja
rati
Ori
ya
Assa
mes
e P
unja
bi
Ur
du
Oth
ers
No R
espo
n
Tota
l
Andh
ra2
01
00
00
933
00
00
260
123
1,08
5As
sam
931
00
019
51
00
035
40
00
8272
6Bi
har
741
10
00
20
00
00
06
794
851
Chan
diga
rh20
20
00
00
00
00
02
00
2422
8Ch
hatis
garh
736
01
00
00
00
00
00
099
836
Delh
i51
41
02
10
00
00
00
00
5857
6Go
a13
24
581
00
00
00
00
01
2422
0Gu
jara
t93
90
20
10
01
480
00
00
519
41,
622
Hary
ana
773
00
00
01
00
00
20
092
868
Him
acha
l Pra
desh
459
10
00
00
00
00
00
055
515
Jhar
khan
d30
80
00
00
01
00
00
00
2433
3Ka
rnat
aka
332
810
11,
110
45
511
00
087
118
21,
585
Kera
la0
10
10
272
60
00
00
00
8881
8M
adhy
a Pra
desh
1,09
22
00
00
00
00
00
00
130
1,22
4M
ahar
asht
ra1,
020
82,
178
42
41
2710
40
01
202
406
3,77
7O
riss
a31
51
12
12
011
031
10
00
077
721
Punj
ab55
40
00
00
00
00
043
70
012
11,
112
Raja
stha
n1,
869
11
00
00
00
00
00
026
22,
133
Tam
il Na
du2
01
1,51
81
00
40
00
02
820
01,
736
Tela
ngan
a1
00
00
01
761
00
00
100
9987
2Ut
tar P
rade
sh3,
683
20
10
00
00
00
01
041
84,
105
Wes
t Ben
gal
596
00
11
1,63
40
00
10
62
026
62,
507
Meg
hala
ya25
014
00
021
00
00
110
074
4541
5Na
gala
nd98
250
00
160
00
01
00
1919
178
No R
espo
nse
30
10
00
01
00
10
00
28
Tota
l14
,415
642,
252
1,63
11,
117
1,88
073
51,
790
585
312
367
448
154
117
3,18
429
,051

An Analysis of Competition and Regulatory Intervention in India’s Television Distribution and Broadcasting Services
48
Appe
ndix
7.1
: Pro
port
ion
of re
spon
dent
s w
ho fi
nds
DTH
offe
ring
mor
e va
lue
than
cab
le
Appe
ndix
7.2
: Pro
port
ion
of re
spon
dent
s w
ho fi
nds
DTH
offe
rs e
xcel
lent
val
ue fo
r mon
ey
56
App
endi
x 7.
1: P
ropo
rtio
n of
res
pond
ents
who
find
s DT
H o
ffer
ing
mor
e va
lue
than
cab
le
A
ppen
dix
7.2:
Pro
port
ion
of r
espo
nden
ts w
ho fi
nds D
TH
off
ers e
xcel
lent
val
ue fo
r m
oney
Video
con
Tatas
kyAir
telDi
sh TV
Relia
nce
Sun
Direc
tVid
eoco
nTa
tasky
Airtel
Dish
TVRe
lianc
e Su
n Di
rect
Video
con
Tatas
kyAir
telDi
sh TV
Relia
nce
Sun
Direc
tCo
mplet
ely
Disag
ree2.1
41.6
32.3
72.4
83.1
52.4
51.5
61.1
91.5
31.7
52.1
81.9
11.7
71.7
62.5
43.1
14.8
22.4
6Di
sagree
7.66
6.47
7.37
8.15
11.01
9.39
6.14
5.34
6.08
5.35
8.61
10.09
10.92
7.79
9.26
9.36
12.74
10.75
Some
what
Agree
28.1
23.45
27.39
27.95
33.67
27.44
27.38
23.21
27.43
2934
.0525
.132
.5423
.6929
.1833
35.45
27.39
Agree
37.74
40.43
39.17
38.73
33.81
36.27
40.31
40.9
42.04
41.44
36.12
37.2
33.99
38.33
36.99
34.8
31.35
38.89
Comp
letely
Ag
ree21
.1825
.4520
.7419
.8614
.5821
.5920
.9225
.9120
.1119
.2115
.4621
.6117
.125
.6519
.1917
.0911
.2316
.36Ca
n't Sa
y3.1
82.5
72.9
62.8
33.7
72.8
73.6
93.4
42.8
13.2
43.5
94.0
93.6
82.7
72.8
42.6
54.4
14.1
5To
tal26
,399
33,44
529
,363
30,21
816
,011
12,61
525
,657
30,64
727
,022
27,64
313
,527
10,43
722
,431
26,81
825
,487
24,16
810
,838
9,857
2016
2017
2018
Excel
lent
value
for
mone
yVid
eoco
nTa
tasky
Airtel
Dsh T
VRe
lianc
e Su
n Dire
ct Vid
eoco
nTa
tasky
Airtel
Dsh T
VRe
lianc
e Su
n Di
rect
Video
con
Tatas
kyAir
telDs
h TV
Relia
nce
Sun
Direc
t
Comp
letely
Di
sagree
2.06
1.67
2.13
2.63.3
2.49
1.77
1.33
1.54
1.62.1
52.0
31.9
61.8
82.5
52.5
34.1
32.3
5
Disag
ree7.5
36.5
58.3
48.5
211
.39.2
5.44
5.03
5.85
5.63
8.21
9.62
9.31
7.06
8.36
10.12
12.75
9.06
Some
what
Agree
28.68
24.45
28.11
28.1
34.23
27.92
29.68
23.96
28.68
30.56
34.97
26.24
32.34
23.56
28.54
32.74
33.64
29.26
Agree
38.28
39.71
37.59
38.77
33.52
35.82
37.69
41.62
39.68
38.92
35.51
36.27
33.55
39.53
37.31
33.42
32.69
36.8
Comp
letely
Ag
ree20
.5425
.0821
.0219
.2914
.3521
.8621
.3724
.0620
.8919
.6115
.2821
.2418
.6224
.5720
.2618
.3412
.0618
.57
Can't
Say
2.91
2.54
2.79
2.73
3.32.7
14.0
64
3.36
3.68
3.87
4.64.2
23.4
12.9
82.8
64.7
23.9
7To
tal26
,399
33,44
529
,363
30,21
816
,011
12,61
525
,657
30,64
727
,022
27,64
313
,527
10,43
722
,431
26,81
825
,487
24,16
810
,838
9,857
2016
2017
2018

49
Appe
ndix
7.3
: Pro
port
ion
of re
spon
dent
s w
ho fi
nds
DTH
is m
ore
flexi
ble
and
conv
enie
nt th
an c
able
57
App
endi
x 7.
3: P
ropo
rtio
n of
res
pond
ents
who
find
s DT
H is
mor
e fle
xibl
e an
d co
nven
ient
than
cab
le
Flexib
le an
d co
nven
ient
than c
able
Vide
ocon
Tatas
kyAi
rtel
Dish
TVRe
lianc
e Su
n Di
rect
Vide
ocon
Tatas
kyAi
rtel
Dish
TVRe
lianc
e Su
n Di
rect
Vide
oco
nTa
tasky
Airte
lDi
sh TV
Relia
nce
Sun
Direc
t
Comp
letely
Di
sagre
e1.6
91.7
92.0
72.4
22.5
2.12
1.48
1.41
1.58
2.04
2.45
3.17
2.11
2.05
2.33.3
4.64
2.3
Disa
gree
7.36.5
87.5
58.4
9.58
8.03
6.53
5.04
6.27
5.61
8.24
7.67
10.53
6.72
9.71
10.52
12.7
9.56
Some
what
Agree
29.33
24.51
27.92
28.46
35.84
28.7
29.17
25.09
26.71
29.55
36.84
28.24
30.97
25.69
27.71
30.44
37.32
30.9
Agree
37.97
39.44
38.66
37.81
33.81
36.14
37.78
40.7
39.38
38.19
34.31
33.94
32.97
37.21
36.58
34.62
29.64
34.07
Comp
letely
Ag
ree21
.4825
.8121
.7420
.7615
.7122
.9321
.8824
.6623
.5721
.7514
.7622
.9819
.4725
.4120
.8818
.2511
.4319
.06
Can't
Say
2.23
1.89
2.06
2.14
2.55
2.08
3.15
3.09
2.49
2.86
3.44
3.94
2.92
2.82
2.87
4.27
4.11
Total
26,39
933
,445
29,36
330
,218
16,01
112
,615
25,65
730
,647
27,02
227
,643
13,52
710
,437
22,43
126
,818
25,48
724
,168
10,83
89,8
57
2016
2017
2018
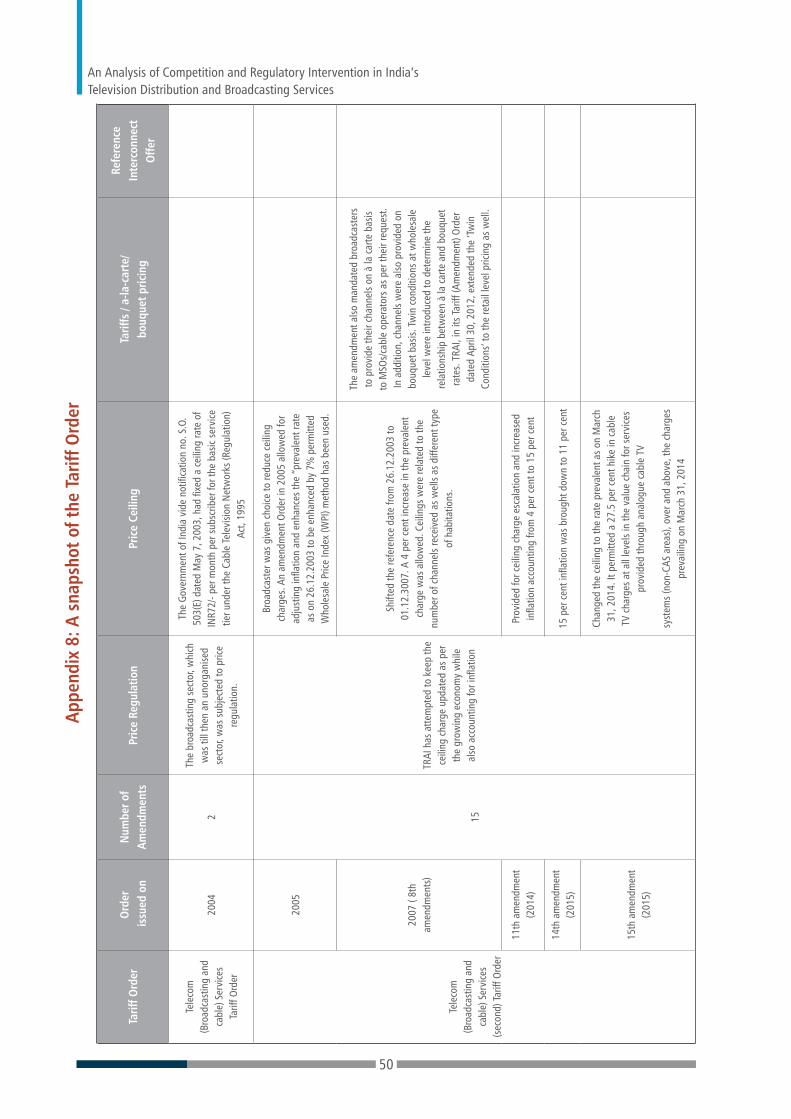
An Analysis of Competition and Regulatory Intervention in India’s Television Distribution and Broadcasting Services
50
Appe
ndix
8: A
sna
psho
t of t
he T
ariff
Ord
er
Tarif
f Ord
erO
rder
is
sued
on
Num
ber o
f Am
endm
ents
Pric
e Re
gula
tion
Pric
e Ce
iling
Tarif
fs /
a-la
-car
te/
bouq
uet p
ricin
g
Refe
renc
e
Inte
rcon
nect
O
ffer
Tele
com
(B
road
cast
ing
and
cabl
e) S
ervi
ces
Ta
riff O
rder
2004
2
The
broa
dcas
ting
sect
or, w
hich
w
as ti
ll th
en a
n un
orga
nise
d se
ctor
, was
sub
ject
ed to
pric
e re
gula
tion.
The
Gove
rnm
ent o
f Ind
ia v
ide
notifi
catio
n no
. S.O
. 50
3(E)
dat
ed M
ay 7
, 200
3, h
ad fi
xed
a ce
iling
rate
of
INR7
2/- p
er m
onth
per
sub
scrib
er fo
r the
bas
ic se
rvice
tie
r und
er th
e Ca
ble
Tele
visio
n N
etw
orks
(Reg
ulat
ion)
Ac
t, 19
95
Tele
com
(B
road
cast
ing
and
cabl
e) S
ervi
ces
(sec
ond)
Tarif
f Ord
er
2005
15
TRAI
has
atte
mpt
ed to
kee
p th
e ce
iling
cha
rge
upda
ted
as p
er
the
grow
ing
econ
omy
whi
le
also
acc
ount
ing
for i
nflat
ion
Broa
dcas
ter w
as g
iven
cho
ice to
redu
ce c
eilin
g ch
arge
s. A
n am
endm
ent O
rder
in 2
005
allo
wed
for
adju
stin
g in
flatio
n an
d en
hanc
es th
e “p
reva
lent
rate
as
on
26.1
2.20
03 to
be
enha
nced
by
7% p
erm
itted
W
hole
sale
Pric
e In
dex
(WPI
) met
hod
has
been
use
d.
2007
( 8t
h am
endm
ents
)
Shift
ed th
e re
fere
nce
date
from
26.
12.2
003
to
01.1
2.30
07. A
4 p
er c
ent i
ncre
ase
in th
e pr
eval
ent
char
ge w
as a
llow
ed. C
eilin
gs w
ere
rela
ted
to th
e nu
mbe
r of c
hann
els
rece
ived
as
wel
ls as
diff
eren
t typ
e of
hab
itatio
ns.
The
amen
dmen
t also
man
date
d br
oadc
aste
rs
to p
rovi
de th
eir c
hann
els
on à
la c
arte
bas
is to
MSO
s/ca
ble
oper
ator
s as
per
thei
r req
uest
. In
add
ition
, cha
nnel
s w
ere
also
pro
vide
d on
bo
uque
t bas
is. T
win
con
ditio
ns a
t who
lesa
le
leve
l wer
e in
trodu
ced
to d
eter
min
e th
e re
latio
nshi
p be
twee
n à
la c
arte
and
bou
quet
ra
tes.
TRA
I, in
its
Tarif
f (Am
endm
ent)
Orde
r da
ted
April
30,
201
2, e
xten
ded
the
‘Twin
Co
nditi
ons’
to th
e re
tail
leve
l pric
ing
as w
ell.
11th
am
endm
ent
(201
4)Pr
ovid
ed fo
r cei
ling
char
ge e
scal
atio
n an
d in
crea
sed
infla
tion
acco
untin
g fro
m 4
per
cen
t to
15 p
er c
ent
14th
am
endm
ent
(201
5)15
per
cen
t infl
atio
n w
as b
roug
ht d
own
to 1
1 pe
r cen
t
15th
am
endm
ent
(201
5)
Chan
ged
the
ceili
ng to
the
rate
pre
vale
nt a
s on
Mar
ch
31, 2
014.
It p
erm
itted
a 2
7.5
per c
ent h
ike
in c
able
TV
cha
rges
at a
ll le
vels
in th
e va
lue
chai
n fo
r ser
vice
s pr
ovid
ed th
roug
h an
alog
ue c
able
TV
syst
ems
(non
-CAS
are
as),
over
and
abo
ve, t
he c
harg
es
prev
ailin
g on
Mar
ch 3
1, 2
014

51
Tarif
f Ord
erO
rder
is
sued
on
Num
ber o
f Am
endm
ents
Pric
e Re
gula
tion
Pric
e Ce
iling
Tarif
fs /
a-la
-car
te/
bouq
uet p
ricin
g Re
fere
nce
In
terc
onne
ct O
ffer
The
Tele
com
mun
icatio
n (B
road
cast
ing
and
Cabl
e) S
ervi
ces
(Thi
rd) (
cond
ition
al
acce
ss s
yste
m (C
AS)
Area
s
2006
1
Appl
icabi
lity
of C
AS a
rea
and
char
ges
paya
ble
by M
SOs
to b
road
cast
ers
and
cabl
e op
erat
ors
to M
SOs
in th
e CA
S ar
ea
The
max
imum
pric
e of
the
pay
chan
nel w
as
decla
red
by th
e br
oadc
aste
rs a
nd th
e ce
iling
of ra
tes
fixed
for t
he b
asic
serv
ice ti
er in
CAS
ar
eas
was
pro
pose
d at
INR7
7 pe
r mon
th p
er
subs
crib
er i.
e., I
NR7
2 pl
us IN
R5 o
n ac
coun
t of
the
7 pe
r cen
t inc
reas
e fo
r infl
atio
n
2 op
tions
of t
he s
tand
ard
tarif
f pac
kage
(STP
) w
ere
pres
crib
ed fo
r STB
s fo
r CAS
are
as. T
he fi
rst
STP
prov
ides
for a
sec
urity
dep
osit
of IN
R999
/- w
ith a
mon
thly
rent
al o
f IN
R30/
- for
five
yea
rs.
The
seco
nd S
TP p
rovi
des
for a
sec
urity
dep
osit
of IN
R250
/- w
ith a
mon
thly
rent
al o
f IN
R45/
- for
fiv
e ye
ars
The
Firs
t Am
endm
ent i
n th
e Th
ird Ta
riff O
rder
(2
008)
The
ceili
ngs
on c
harg
es fo
r bas
ic tie
r hav
e be
en
incr
ease
d fro
m IN
R 77
/-to
INR8
2/-
(exc
ludi
ng ta
xes)
and
the
ceili
ng o
n th
e m
axim
um re
tail
price
per
pay
cha
nnel
per
m
onth
hav
e be
en in
crea
sed
from
INR5
/- to
IN
R5.3
5/- (
exclu
ding
taxe
s).
The
Four
th
Tarif
f Ord
er (T
he
Tele
com
mun
icatio
n (B
road
cast
ing
and
Cabl
e)
Serv
ices
(Fou
rth)
(Add
ress
able
Sy
stem
s) Ta
riff O
rder
2006
6
Dive
rsifi
ed ta
riff i
nto
thre
e he
ads
– w
hole
sale
ta
riff,
reta
il ta
riff a
nd th
ose
offe
ring
of c
usto
mer
pr
emise
s eq
uipm
ent.
Who
lesa
le ra
tes
of p
ay T
V ch
anne
ls an
d bo
uque
ts
for a
ll ad
dres
sabl
e sy
stem
s w
ere
fixed
at 4
2 pe
r ce
nt o
f cor
resp
ondi
ng c
hann
els
and
bouq
uets
in
cabl
e TV
ser
vice
s in
non
-add
ress
able
sys
tem
s
Refe
renc
e In
terc
onne
ct
Offe
r (RI
O) w
as p
rovi
ded
The
Tele
com
mun
icatio
n (B
road
cast
ing
and
Cabl
e) S
ervi
ces
(Fift
h)
(Dig
ital A
ddre
ssab
le
Cabl
e TV
Sys
tem
2013
Regu
late
d th
e ta
riff f
or s
uppl
y an
d in
stal
latio
n of
Set
Top
Box
(S
TB)
Optio
n I.
Rent
per
mon
th p
er S
TB fo
r firs
t thr
ee
year
s IN
R55.
66 (e
xclu
sive
of ta
xes)
and
INR4
00 s
ecur
ity d
epos
its
(Ref
unda
ble)
.
Opt
ion
II Re
nt p
er m
onth
per
STB
for fi
rst t
hree
ye
ars
INR5
0.66
(exc
lusiv
e
of ta
xes)
and
INR8
00 s
ecur
ity d
epos
its
(Ref
unda
ble)
.
Optio
n III
Ren
t per
mon
th p
er S
TB fo
r firs
t thr
ee
year
s IN
R46.
80 (e
xclu
sive
of ta
xes)
and
INR4
00 s
ecur
ity d
epos
its (A
djus
tabl
e).
Optio
n IV
. Ren
t per
mon
th p
er S
TB fo
r firs
t thr
ee
year
s IN
R32.
93 (e
xclu
sive
of
taxe
s) a
nd IN
R800
sec
urity
dep
osits
(Adj
usta
ble)
.

An Analysis of Competition and Regulatory Intervention in India’s Television Distribution and Broadcasting Services
52
Tarif
f Ord
erO
rder
is
sued
on
Num
ber o
f Am
endm
ents
Pric
e Re
gula
tion
Pric
e Ce
iling
Tarif
fs /
a-la
-car
te/
bouq
uet p
ricin
g Re
fere
nce
In
terc
onne
ct O
ffer
The
Tele
com
mun
icatio
n (B
road
cast
ing
and
Cabl
e) S
ervi
ces
(six
th)
(Dig
ital A
ddre
ssab
le
Cabl
e TV
Sys
tem
2013
Regu
late
d th
e st
anda
rd ta
riff
pack
age,
for s
uppl
y an
d in
stal
latio
n of
the
cust
omer
pr
emise
s eq
uipm
ent
Optio
n I.
Rent
per
mon
th p
er c
usto
mer
pre
mise
s
equi
pmen
t for
the
first
thre
e ye
ars
INR7
1.75
(e
xclu
sive
of ta
xes)
and
INR5
00 s
ecur
ity d
epos
its
(Ref
unda
ble)
.
Optio
n II.
Ren
t per
mon
th p
er c
usto
mer
pre
mise
s
equi
pmen
t for
the
first
thre
e ye
ars
INR6
5.50
(e
xclu
sive
of ta
xes)
and
INR1
000
secu
rity
depo
sits
(Ref
unda
ble)
.
Optio
n III
. Ren
t per
mon
th p
er c
usto
mer
pre
mise
s
equi
pmen
t for
the
first
thre
e ye
ars
INR6
0.66
(e
xclu
sive
of ta
xes)
and
INR5
00 s
ecur
ity d
epos
its
(Adj
usta
ble)
.
Optio
n IV
. Ren
t per
mon
th p
er c
usto
mer
prem
ises
equi
pmen
t for
the
first
thre
e ye
ars
INR4
3.33
( ex
clusiv
e of
taxe
s) a
nd
INR1
000
secu
rity
depo
sits
(Adj
usta
ble)
The
Tele
com
mun
icatio
n (B
road
cast
ing
and
Cabl
e) S
ervi
ces
(Sev
enth
) (Th
e Di
rect
to
Hom
e Se
rvice
s)
Tarif
f Ord
er
2015
Regu
late
d ta
riff f
or s
uppl
y of
inst
alla
tion
of c
usto
mer
pr
emise
equ
ipm
ent
Cons
ulta
tion
on th
e Dr
aft
Tele
com
mun
icatio
n (B
road
cast
ing
and
Cabl
e
Serv
ices)
(Eig
hth)
(A
ddre
ssab
le
Syst
ems)
Tarif
f Ord
er,
2016
2016
Ceili
ng o
n m
axim
um re
tail
price
s fo
r pay
ch
anne
ls fo
r add
ress
able
sys
tem
s.
INR1
30 a
s m
onth
ly re
ntal
for 1
00 s
tand
ard
defin
ition
cha
nnel
s on
set
top
box
from
Apr
il 20
17. A
bou
quet
of c
hann
els
shou
ld n
ot b
e pr
iced
at le
ss th
an 8
5 pe
r cen
t of
the
sum
of à
la c
arte
pric
ing.
Sour
ce: C
ompi
led
for T
RAI’s
Tarif
f ord
ers
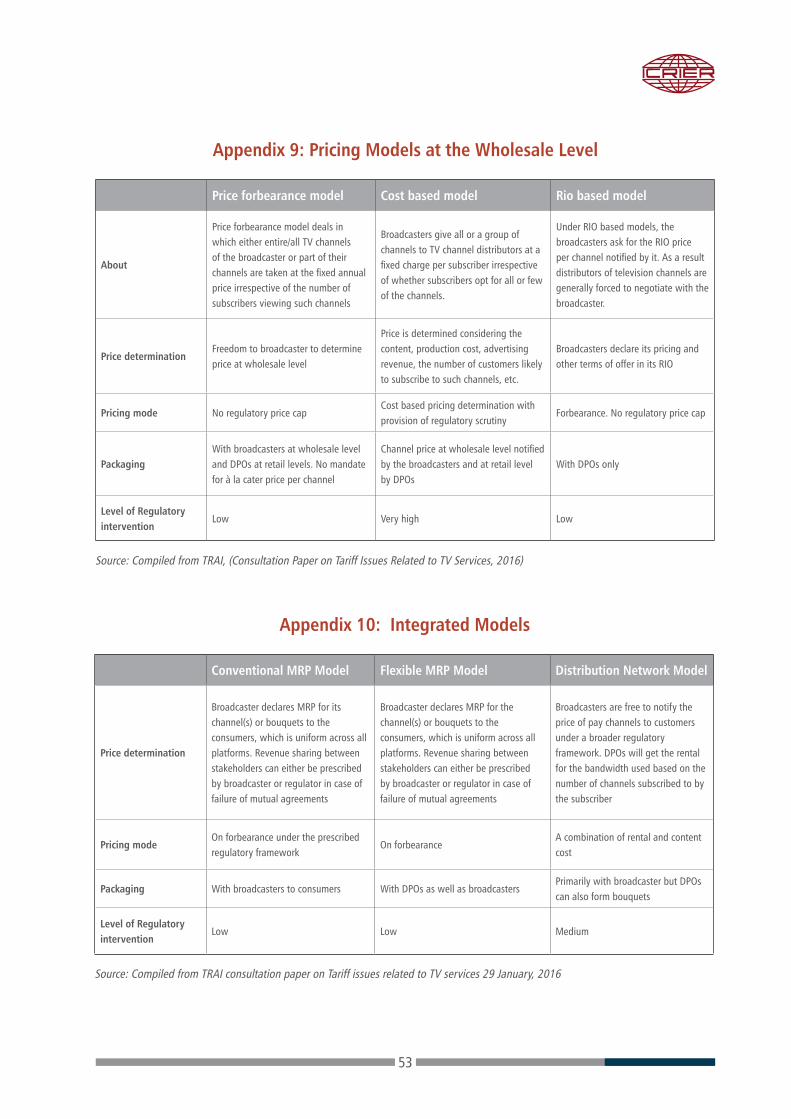
53
Appendix 9: Pricing Models at the Wholesale Level
Appendix 10: Integrated Models
Price forbearance model Cost based model Rio based model
About
Price forbearance model deals in which either entire/all TV channels of the broadcaster or part of their channels are taken at the fixed annual price irrespective of the number of subscribers viewing such channels
Broadcasters give all or a group of channels to TV channel distributors at a fixed charge per subscriber irrespective of whether subscribers opt for all or few of the channels.
Under RIO based models, the broadcasters ask for the RIO price per channel notified by it. As a result distributors of television channels are generally forced to negotiate with the broadcaster.
Price determinationFreedom to broadcaster to determine price at wholesale level
Price is determined considering the content, production cost, advertising revenue, the number of customers likely to subscribe to such channels, etc.
Broadcasters declare its pricing and other terms of offer in its RIO
Pricing mode No regulatory price capCost based pricing determination with provision of regulatory scrutiny
Forbearance. No regulatory price cap
PackagingWith broadcasters at wholesale level and DPOs at retail levels. No mandate for à la cater price per channel
Channel price at wholesale level notified by the broadcasters and at retail level by DPOs
With DPOs only
Level of Regulatory intervention
Low Very high Low
Source: Compiled from TRAI, (Consultation Paper on Tariff Issues Related to TV Services, 2016)
Conventional MRP Model Flexible MRP Model Distribution Network Model
Price determination
Broadcaster declares MRP for its channel(s) or bouquets to the consumers, which is uniform across all platforms. Revenue sharing between stakeholders can either be prescribed by broadcaster or regulator in case of failure of mutual agreements
Broadcaster declares MRP for the channel(s) or bouquets to the consumers, which is uniform across all platforms. Revenue sharing between stakeholders can either be prescribed by broadcaster or regulator in case of failure of mutual agreements
Broadcasters are free to notify the price of pay channels to customers under a broader regulatory framework. DPOs will get the rental for the bandwidth used based on the number of channels subscribed to by the subscriber
Pricing modeOn forbearance under the prescribed regulatory framework
On forbearanceA combination of rental and content cost
Packaging With broadcasters to consumers With DPOs as well as broadcastersPrimarily with broadcaster but DPOs can also form bouquets
Level of Regulatory intervention
Low Low Medium
Source: Compiled from TRAI consultation paper on Tariff issues related to TV services 29 January, 2016

An Analysis of Competition and Regulatory Intervention in India’s Television Distribution and Broadcasting Services
54
Appendix 11: Changes in MRP of channels offered by broadcasters (in INR)
Broadcaster Name
Channel NameOld à la carte
Price2nd Revision
New à la carte price
Price Changed
Zee Zee TV 19.0 19.0 No
Zee &TV 12.0 12.0 No
Zee Zee Cinema 19.0 19.0 No
Zee &pictures 10.0 10.0 No
Zee Zee Bollywood 2.0 2.0 No
Zee Zee Action 1.0 1.0 No
Zee Living Foodz 1.0 1.0 No
Zee Zee Café 15.0 15.0 No
Zee &flix 15.0 15.0 No
Zee WION 1.0 1.0 No
Zee Zee Marathi 19.0 19.0 No
Zee Zee Bangla 19.0 19.0 No
Zee Zee Sarthak 19.0 19.0 No
Zee Zee Kannada 19.0 19.0 No
Zee Zee Telugu 19.0 19.0 No
Zee Zee Cinemalu 10.0 10.0 No
Zee Zee Tamil 12.0 12.0 No
Zee Ezmall.com 0.1 0.1 No
Zee Zee Keralam 0.1 0.1 No
Zee Colors 19.0 19.0 No
Zee &TV HD 19.0 19.0 No
Zee Zee Cinema HD 19.0 19.0 No
Zee &pictures HD 19.0 19.0 No
Zee Living Foodz HD 10.0 10.0 No
Zee Zee Café HD 19.0 19.0 No
Zee &flix HD 19.0 19.0 No
Zee &prime HD 19.0 19.0 No
Zee Zee Marathi HD 19.0 19.0 No
Zee Zee Talkies HD 19.0 19.0 No
Zee Zee Bangla HD 19.0 19.0 No
Zee Zee Kannada HD 19.0 19.0 No
Zee Zee Telugu HD 19.0 19.0 No
Zee Zee Cinemalu HD 16.0 16.0 No
Zee Zee Tamil HD 19.0 19.0 No
Zee Zee Keralam HD 8.0 8.0 No
Disney Disney International HD 15.0 15.0 12.0 Yes

55
Broadcaster Name
Channel NameOld à la carte
Price2nd Revision
New à la carte price
Price Changed
Indiacast Colors 19.0 19.0 No
Indiacast Colors Infinity 7.0 7.0 No
Indiacast Comedy Central 7.0 7.0 No
Indiacast Sonic 2.0 2.0 No
Indiacast CNBC TV18 4.0 4.0 No
Indiacast MTV 3.0 3.0 No
Indiacast Nick 6.0 6.0 No
Indiacast CNBC Awaaz 1.0 1.0 No
Indiacast Vh1 1.0 1.0 No
Indiacast Colors Kannada 19.0 19.0 No
Indiacast Colors Kannada Cinema 2.0 2.0 No
Indiacast Colors Oriya 6.0 6.0 No
Indiacast Rishtey Cineplex 3.0 3.0 No
Indiacast MTV Beats 0.5 0.5 No
Indiacast CNBC Bajaar 1.0 1.0 No
Indiacast Colors Tamil 3.0 3.0 No
Indiacast Rishtey 1.0 1.0 No
Indiacast News18 India 1.0 1.0 No
Indiacast Colors HD 19.0 19.0 No
Indiacast CNBC TV18 Prime HD 1.0 1.0 No
Indiacast Colors Infinity HD 9.0 9.0 No
Indiacast Vh1 HD 2.0 2.0 No
Indiacast Comedy Central HD 9.0 9.0 No
Indiacast Nick HD+ 10.0 10.0 No
Indiacast Colors Bangla HD 14.0 14.0 No
Indiacast Colors Kannada HD 19.0 19.0 No
Indiacast Colors Tamil HD 7.0 7.0 No
Indiacast FYI TV 18 (HD) 1.0 1.0 No
Indiacast MTV Beats HD 1.0 1.0 No
Indiacast MTV HD+ 5.0 5.0 No
Indiacast Cineplex HD 5.0 5.0 No
Indiacast Colors Gujarati Cinema 1.0 1.0 No
Times ET Now 3.0 3.0 No
Times MN+ HD 10.0 10.0 No
Zee Zee Anmol 1.0 0.1 Yes
Zee Big Magic 1.0 0.1 Yes

An Analysis of Competition and Regulatory Intervention in India’s Television Distribution and Broadcasting Services
56
Broadcaster Name
Channel NameOld à la carte
Price2nd Revision
New à la carte price
Price Changed
Zee Zee Anmol Cinema 1.0 0.1 Yes
Zee Zee News 0.5 0.1 Yes
Zee Zee Hindustan 0.5 0.1 Yes
Zee Zee Business 0.5 0.1 Yes
Zee Zee ETC 1.0 0.1 Yes
Zee Zing 1.0 0.1 Yes
Zee Zee Salaam 1.0 0.1 Yes
Zee Zee Talkies 17.0 12.0 Yes
Zee Zee Yuva 10.0 4.0 Yes
Zee Zee 24 Taas 0.5 0.1 Yes
Zee Zee Bangla Cinema 8.0 5.0 Yes
Zee 24 Ghanta 0.5 0.1 Yes
Zee Zee Kalinga 0.5 0.1 Yes
Zee Big Ganga 2.0 0.5 Yes
Zee Zee Bihar Jharkhand 0.5 0.1 Yes
Zee Zee Punjab Haryana Himachal Pradesh 0.5 0.1 Yes
Zee Zee Madhya Pradesh Chhattisgarh 0.5 0.1 Yes
Zee Zee Rajasthan News 0.5 0.1 Yes
Zee Zee Uttar Pradesh Uttarakhand 0.5 0.1 Yes
Zee Zee 24 Kalak 0.5 0.1 Yes
TV Today Aaj Tak 3.0 0.8 Yes
TV Today India Today 2.0 1.0 Yes
TV Today Aaj Tak Tez 0.5 0.3 Yes
TV Today Aaj Tak HD 3.5 1.5 Yes
Disney Disney Junior 10.0 4.0 Yes
Disney UTV Movies 10.0 2.0 Yes
Disney UTV Bindass 5.0 1.0 Yes
Disney UTV Action 5.0 2.0 Yes
Disney Hungama TV 10.0 6.0 Yes
Disney Disney 10.0 8.0 Yes
Disney Disney XD 8.0 4.0 Yes
Disney UTV HD 15.0 10.0 8.0 Yes
ABP ABP Ananda 5.0 0.5 0.0 Yes
ABP ABP Majha 5.0 0.5 0.0 Yes
Indiacast The History Channel 4.0 3.0 Yes
Indiacast FYI TV 18 1.0 0.3 Yes

57
Broadcaster Name
Channel NameOld à la carte
Price2nd Revision
New à la carte price
Price Changed
Indiacast Nick Jr 8.0 1.0 Yes
Indiacast CNN News18 2.0 0.5 Yes
Indiacast Colors Marathi 15.0 10.0 Yes
Indiacast Colors Bangla 11.0 7.0 Yes
Indiacast Colors Gujarati 8.0 5.0 Yes
Indiacast News18 Lokmat 0.5 0.3 Yes
Indiacast News18 Bihar/Jharkhand 0.5 0.3 Yes
IndiacastNews18 Uttar Pradesh/
Uttarakhand 0.5 0.3 Yes
IndiacastNews18 Madhya Pradesh/
Chhattisgarh 0.5 0.3 Yes
Indiacast News18 Rajasthan 0.5 0.3 Yes
Indiacast News18 Kannada 0.5 0.3 Yes
Indiacast News18 Bangla 0.5 0.3 Yes
Indiacast News18 Gujarati 0.5 0.3 Yes
Indiacast News18 Urdu 0.5 0.3 Yes
IndiacastNews18 Punjab/Haryana/
Himachal Pradesh 0.5 0.3 Yes
Indiacast News18 Odia 0.5 0.3 Yes
Indiacast Colors Super 8.0 3.0 Yes
Indiacast News18 Tamil Nadu 0.5 0.3 Yes
Indiacast News18 Kerala 0.5 0.3 Yes
Indiacast News18 Assam/North East 0.5 0.3 Yes
Indiacast History TV18 HD 9.0 7.0 Yes
Indiacast Colors Marathi HD 19.0 17.0 Yes
Times Times Now 5.0 3.0 Yes
Times Zoom 1.0 0.5 Yes
Times Movies Now 12.0 10.0 Yes
Times Movies Now HD 15.0 12.0 Yes
Times Romedy Now 8.0 6.0 Yes
Times Romedy Now HD 10.0 9.0 Yes
Times Mirror Now 3.0 2.0 Yes
Times MNX 8.0 6.0 Yes
Times MNX HD 10.0 9.0 Yes
Times Times Now HD 7.0 5.0 Yes
Turner Cartoon Network 6.0 4.3 Yes
Turner Pogo 6.0 4.3 Yes
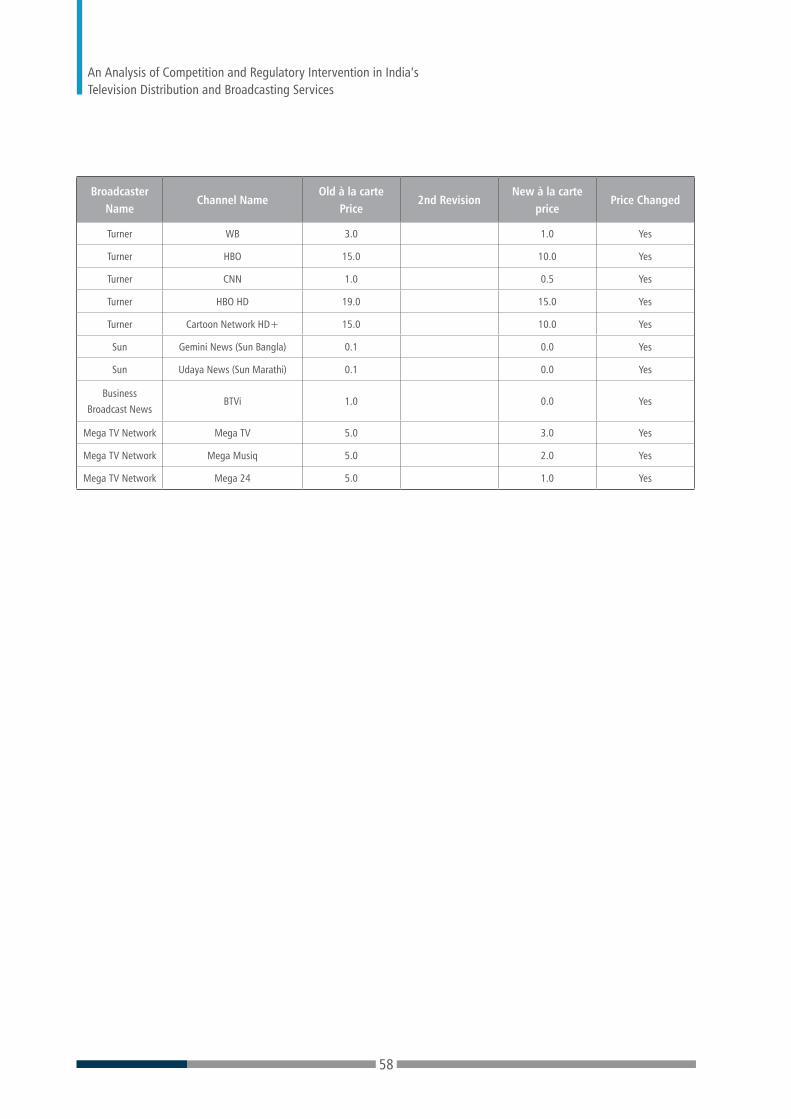
An Analysis of Competition and Regulatory Intervention in India’s Television Distribution and Broadcasting Services
58
Broadcaster Name
Channel NameOld à la carte
Price2nd Revision
New à la carte price
Price Changed
Turner WB 3.0 1.0 Yes
Turner HBO 15.0 10.0 Yes
Turner CNN 1.0 0.5 Yes
Turner HBO HD 19.0 15.0 Yes
Turner Cartoon Network HD+ 15.0 10.0 Yes
Sun Gemini News (Sun Bangla) 0.1 0.0 Yes
Sun Udaya News (Sun Marathi) 0.1 0.0 Yes
Business Broadcast News
BTVi 1.0 0.0 Yes
Mega TV Network Mega TV 5.0 3.0 Yes
Mega TV Network Mega Musiq 5.0 2.0 Yes
Mega TV Network Mega 24 5.0 1.0 Yes

59
Appendix 11.1 Changes in MRP of bouquets offered by broadcasters in INR
Broadcaster Name
Bouquet Name Old MRP 2nd Revision New MRP Date of change
Zee Zee Family Pack Marathi SD 60 50 19-Dec-18
Zee Zee All in One Pack Marathi SD 75 65 19-Dec-18
Zee Zee Family Pack Bangla SD 50 45 19-Dec-18
Zee Zee All in One Pack Bangla SD 65 60 19-Dec-18
Zee Zee Family Pack Odia SD 50 45 19-Dec-18
Zee Zee All in One Pack Odia SD 65 60 19-Dec-18
Zee Zee Prime Pack Tamil HD 22 25 19-Dec-18
DiscoveryDiscovery Basic Infotainment
HD Pack 9.0 10 21-Dec-18
DiscoveryDiscovery Infotainment and
Sports HD Pack8.5 9 21-Dec-18
DiscoveryDiscovery Kids Infotainment
HD Pack7.5 8 21-Dec-18
Times Bouquet 1 7 5 21-Dec-18
Times Bouquet 2 15 13 21-Dec-18
Times Bouquet 3 22 20 21-Dec-18
Disney Universal Bouquet 10 10 07-Dec-18
Disney HD Bouquet 15 10 8 14-Dec-18
ABP ANN 1 8.5 1.0 FTA 21-Dec-18
Sun Sun Telegu Basic No Price Change 15-Jan-19
Sun Sun Telegu Prime No Price Change 15-Jan-19
Sun Sun Telegu Super No Price Change 15-Jan-19
Sun Sun Kannada Basic No Price Change 15-Jan-19
Sun Sun Kannada Prime No Price Change 15-Jan-19
Sun Sun Kannada Super No Price Change 15-Jan-19
Sun Sun Ultimate No Price Change 15-Jan-19
Sun Sun Telegu Basic HD No Price Change 15-Jan-19
Sun Sun Telegu Prime HD No Price Change 15-Jan-19
Sun Sun Telegu Super HD No Price Change 15-Jan-19
Sun Sun Kannada Basic HD No Price Change 15-Jan-19
Sun Sun Kannada Prime HD No Price Change 15-Jan-19
Sun Sun Kannada Super HD No Price Change 15-Jan-19
Sun Sun Ultimate HD No Price Change 15-Jan-19
Mega TV Mega Bouquet 1 12 3.6 24-Dec-18
Mega TV Mega Bouquet 2 8 3.5 24-Dec-18
Mega TV Mega Bouquet 3 8 3.3 24-Dec-18

An Analysis of Competition and Regulatory Intervention in India’s Television Distribution and Broadcasting Services
60
Appendix 12: Price Regulations on Pay TV market in selected countries
How regulated? Details of regulator/
Rate regulation including wholesale and retail rate regulation and whether
there are any price controls on e.g., basic tier
Programme packaging including tiering bundling,
mandatory à la carte
Australia
The Australian Communications and Media Authority (ACMA) is an impartial
and independent regulator, but key policy decisions are made by the federal ministry.
None, other than under general competition law.
No restrictions
China
Overlapping, government-controlled regulatory agencies including Ministry of Industry and Information Technology
(telecommunications and broadcast satellite and internet infrastructure) (“MIIT”), the
State Administration of Press, Publication, Radio, Film and Television (“SAPPRFT”)
(television and radio content and coaxial cable infrastructure) and the Ministry of
Culture (online content).
Administrative review (by a higher level administrative body) and judicial review of
regulatory decisions technically available but rarely sough
Basic cable prices determined by local bureaus of National Development and Reform
Commission (NDRC) in consultation with SAPPRFT. • Pricing of value-added cable services or digital TV services above the
basic level can be solely determined by the TV Channel Operators. • No wholesale rate
regulation
No specific restrictions on tiering or bundling; however, customers must be able to subscribe to basic cable packages only and not be forced to subscribe to additional channels or
value-added services.
Hong Kong
A single body oversees separate regimes for both broadcasting and telecommunications – the Communications Authority (“CA”), the executive arm of which is the Office of the
Communications Authority (“OFCA”).
None No restrictions
IndiaTwo entities regulate pay TV services in India - (i) Ministry of Information and Broadcasting (MIB); and (ii) Telecom Regulatory Authority of India (TRAI).
Every channel must be offered on an “à la carte” basis; • Maximum retail price (MRP) payable by subscribers for each à la carte
channel must be more than INR0 per month; • MRP must be uniform for all distribution
platforms; • A bouquet cannot contain any pay channel for which the MRP is more than INR19; MRP of a bouquet of pay channels cannot be
less than 85 per cent of the sum of the monthly MRPs of the à la carte channels in that bouquet; • Broadcasters can offer promotional schemes on monthly MRPs of à la carte channels subject to certain conditions. Additionally, the prices for
the broadcasters are also regulated.
Distributors must offer at least one bouquet, referred to as basic service
tier, of 100 free-to-air channels including all channels that are
mandatorily provided by the central government. Such bouquets must contain at least five channels of
each genre, i.e. devotional, general entertainment, infotainment, kids, movies, music, news and current affairs, sports, and miscellaneous
Indonesia
Two main bodies regulate the pay TV sector: The Ministry of Communication and
Informatics of the Republic of Indonesia (“MOCI”) and the Indonesian Broadcasting Commission (Komisi Penyiaran Indonesia – “KPI”). MOCI and KPI play separate role in administering the broadcasting industry
There is no government regulation regarding filing or control of retail rates or wholesale
rates.
Tiering/bundling is allowed. An “à la carte” offer of channels is not mandatory. • In practice,
tiering arrangement is less popular compared to the bundling arrangement, which most pay TV
operators use.

61
How regulated? Details of regulator/
Rate regulation including wholesale and retail rate regulation and whether
there are any price controls on e.g., basic tier
Programme packaging including tiering bundling, mandatory à la carte
Japan
The Japanese government Ministry of Internal Affairs and Communications (the “MIC”)
administers the Broadcast Law and the Radio Wave Law. MIC
formulates policies through consultative councils, which may include industry representatives
Basic broadcasters (Kikan Housou Jigyousha) are required to submit their pay TV terms and conditions to the Minister of MIC and disclose
them publicly (e.g., on their websites); however, MIC does not specifically regulate retail/
wholesale rates. • There are no price controls on any tier of pay TV service
Tiering/bundling of channels is allowed and utilised in practice.
Malaysia
The principal regulator is the Malaysian Communications and Multimedia Commission
(“MCMC”), an agency under the Ministry of Communications and
Multimedia.
Filing of retail rates only (after which an “investigation” could be opened by MCMC). • Technically, the minister may intervene to set
rates for good cause or in the public interest but currently no intervention in respect of pay TV.
No restrictions.
Singapore
The Info-communications Media Development Authority (IMDA)
was formed on October 1, 2016, as a result of a restructuring combining the former Media Development Authority with
the Info-communications Development Authority. IMDA
is the statutory board that regulates the converging info-communications and media
sectors
There is no wholesale or retail rate regulation.
Cross-carriage rules apply for content offered on relevant platforms (cable, DSL and fibre). Tiering and bundling of channels are allowed, but if a bundle contains a channel that is considered “qualified content” under the Code of Practice for Market Conduct (“CMC”), then the entire
bundle would be subject to the cross-carriage requirements. • So far, these restrictions have
been applied only to a limited number of sporting competitions – most prominently the English
Premier League.
United Kingdom
OFCOM is the communications regulator in the UK.
In general, there is no regulation of pricing of pay television content in the United Kingdom.
However, Ofcom has the power to regulate pricing where there are specific competition
concerns.
Packaging and bundling of pay television content, or content together with services such
as telephony, is not subject to specific regulation in the United Kingdom, but must comply with
general competition law. • Nonetheless, market practice typically is for pay television providers
to bundle a basic tier package with tiered subscriptions to premium content such as movies and sports. • Ofcom also imposes rules relating to “minimum carriage requirements”, which limit the ability of channel providers to dictate packaging terms to platforms. These requirements are rarely
triggered in practice.
USA
FCC is an independent, bipartisan, transparent federal agency with a long history of
regulating video programming services.
In most areas, there is no rate regulation of MVPDs. The FCC has adopted a rebuttable
presumption that cable operators are subject to “effective competition” from satellite networks.
State and local regulatory authorities must demonstrate to the FCC that there is no effective
competition, i.e., competitors with more than 15% of the market share, before they can
regulate cable rates.
Few restrictions. Content providers can file complaints against MVPDs if they can show that
the MVPD prioritised its own channels on the basis of affiliation over the content providers’ channels, such as by placing unaffiliated but similar channels on worse tiers. However, the
content provider must show adequate evidence of unlawful discrimination
Source: CASBAA

An Analysis of Competition and Regulatory Intervention in India’s Television Distribution and Broadcasting Services
62
Appendix 13 a. Research Design adopted by Nielsen for Survey
CAPI Face-to-face House to House interviews FW done only in selected 40L+ and 5-40L
towns .Random interviews done with a skipping pattern of 3 HH's after every successful interview.
METHODOLOGY
TARGET RESPONDENTS
DATA COLLECTION
HH with TV & Cable (with or without STB) Connection. (In rural , DD Direct or Cable)
NCCS A,B, C, D CWE and Other Influencers ( Key Decision
Makers at the time of DTH purchase, Payment maker, Channel Choice maker)
FW pattern: Monthly
Sample Size to be covered (Yearly- Oct 2018-Sept 2019)
Prospects Segment Any DTH HH
Owners of DTH connection- DTH subscribers NCCS A,B, C, D
CWE and Other Influencers ( Key Decision Makers at the time of DTH purchase, Payment maker, Channel Choice maker)
CAPI Face-to-face House to House interviews Urban and Rural areas across all town classes
covered. Random interviews done with a skipping pattern of 3 HH's after every successful interview for Urban areas and Purposive for rural.
Total Prospects Subscribers
37360 26152 11208

63
Appendix 13 b. Nielsen Survey Question
75
Appendix 13 b. Nielsen Survey Question
Q1 Please code state of the fieldwork [SA] Code
(129)
Route
Andhra 1
Assam 2
Bihar 3
Chandigarh 4
Chhatisgarh 5
Delhi 6
Goa 7
Gujarat 8
Haryana 9
Himachal Pradesh 10
Jharkhand 11
Karnataka 12
Kerala 13
Madhya Pradesh 14
Maharashtra 15
Orissa 16
Punjab 17
Rajasthan 18
Tamil Nadu 19
Telangana 20
Uttar Pradesh 21
West Bengal 22

An Analysis of Competition and Regulatory Intervention in India’s Television Distribution and Broadcasting Services
64
76
Q10z ASK ALL
PHOTO SHOWCARD
Show picture card to display how each connection look like.
Please tell me what TV connection do you have at home?[MA]
TV 1 Tv2 Tv 3 TV 4
Cable without Set-top-Box ....................................................................................................................
Cable with Set-Top Box ..............................................................................................................
Direct to Home (DTH) ...........................................................................................................................
Ordinary Antenna ..................................................................................................................................
IP TV
Others (Specify)
NONE OF THESE (TERMINATE INTERVIEW)
Q10b INTERVIEWER : SHOWCARD, READ OUT IF REQUIRED
Please look at the showcard and tell me, how do you OR someone in the household pay/recharge for watching the TV channels?
By Paying money, I mean a daily, monthly, semi-annual, annual recharge paid to watch TV channels. [SA]
TV1 TV2 TV 3 TV 4
I/WE pay/recharge EVERY MONTH for watching TV channels .................................................................. 1 1 1 1
I / WE pay/recharge EVERY 2 – 3 MONTHS for watching TV ................................................................... 2 2 2 2
I/ WE pay/recharge EVERY 4 – 6 MONTHS for watching TV channels 3 3 3 3
I/WE pay/recharge EVERY 7 – 12 MONTHS for watching TV channels 4 4 4 4
I/WE pay/recharge AS PER MY CONVENIENCE for watching TV channels 5 5 5 5
I /WE do not pay/recharge for watching TV channels 6 6 6 6

65
77
Q11 PROGRAMMER INSTRUCTION:ASK IF CODED 3 IN Q10
Since when do you have current DTH connection at your home? [SA]
Code
(139)
Route
Less than 1 month ....................................................................................................................................... 1
2-6 months .................................................................................................................................................. 2
7 months - 11 months ................................................................................................................................. 3
1 year or more ............................................................................................................................................. 4
Q12a Are you planning to change your current TV connection in next one year? [SA]
Q12b Are you planning to buy additional TV connection in next one year? [SA]
Q12a Q12b
(H1)
Yes
(H1)
NO
(220-221) (222-223)
(R1) Change current TV connection in 1 year ........................................................................................................ 01 02
(R2) Buy additional TV connection in 1 year ......................................................................................................... 01 02

An Analysis of Competition and Regulatory Intervention in India’s Television Distribution and Broadcasting Services
6678
Q13 <<Ask if coded 1 in Q12A OR Q12B>>
<PROGRAMMER INSTRUCTION : Hide “None of these” option in Q13 if coded 01 in 12 a or 12b
PHOTO SHOWCARD
You said, you are planning to buy new TV connection in next one year. Which new TV connection/s you are considering to buy? [MA]
Code
(141)
Route
Cable TV without Set top Box ....................................................................................................................... 1
Cable TV with Set top Box ............................................................................................................................ 2
Direct to Home (DTH) ................................................................................................................................... 3
Ordinary Antenna ........................................................................................................................................... 4
IP TV
Others (Specify) ..............................................................................................................................................
None Of These 9
Q16 Please tell me the highest education qualification of Chief Wage Earner? Say-" By Chief wage earner I mean the person contributing maximum to the household expenditure"
Code
(171)
Route
Illiterate ................................................................................................................................................... 1
Literate but no formal schooling .............................................................................................................. 2
School-Upto4 years ................................................................................................................................. 3
School-5 to 9 years .................................................................................................................................. 4
SSC/ HSC ................................................................................................................................................ 5
Some College (includes a Diploma) but not Graduate ............................................................................... 6
Graduate/ Post Graduate: General ........................................................................................................... 7
Graduate/ Post Graduate: Professional .................................................................................................... 8

67
79
Q20a INTERVIEWER INSTRUCTION:DO NOT READ LIST. RECORD FIRST MENTION
Can you tell me which ONE brand comes to your mind when you think of DTH service provider? [SA]
Q20b PROGRAMMER INSTRUCTION:DO NOT DISPLAY BRAND CODED IN Q20 A
IF CODED 11 (DON'T KNOW) in Q20 a, DO NOT ASK Q20 b
Still thinking about Direct to Home(DTH) service providers, which other brands can you think of? [MA]
Q20a Q20b
(H1)
TOM
(H1)
SPONT
(179-180) (217-218)
(R1) Airtel DTH ...................................................................................................................................................... 01 01
(R2) DD Direct /DD Free Dish ................................................................................................................. 02 02
(R3) Dish TV ............................................................................................................................................... 03 03
(R4) Reliance Digital TV ........................................................................................................................ 04 04
(R5) Sun Direct DTH .............................................................................................................................. 05 05
(R6) Tata Sky ............................................................................................................................................... 06 06
(R7) Videocon D2H ......................................................................................................................................... 07 07
(R8) Zing Digital .................................................................................................................................................... 08 08
(R12) Jio DTH ..........................................................................................................................................
(R9) Others (Please Specify______________) ................................................................................................ 09 09
(R10) Others (Please Specify______________) ................................................................................................ 10 10
(R11) Don't Know ( PROGRAMMER INSTRUCTION:SINGLE ANSWER) ................................................ 11 11

An Analysis of Competition and Regulatory Intervention in India’s Television Distribution and Broadcasting Services
68
80
Q21a PROGRAMMER INSTRUCTION:
DISPLAY BRANDS CODED IN Q20 a/b. ALWAYS DISPLAY OPTION 11(NONE)
INTERVIEWER INSTRUCTION:DO NOT READ LIST
Which DTH service provider would you say is your favorite? [SA]
Q21b PROGRAMMING INSTRUCTION:
DISPLAY BRANDS CODED IN Q20 A/B. IF CODED 11 (NONE) IN Q21 A AUTOCODE 11 (NONE) IN Q21 B AND DO NOT DISPLAY IF AUTO-CODED
DO NOT DISPLAY BRAND CODED IN Q21 A
INTERVIEWER INSTRUCTION: DO NOT READ LIST.
And, which DTH service provider is your second favorite? [SA
Q21c PROGRAMMING INSTRUCTION:DO NOT DISPLAY BRANDS CODED IN Q20a/b. IF ALL OPTIONS (1-7) ARE CODED IN Q20a/b, DO NOT ASK THIS QUESTION.
INTERVIEWER INSTRUCTION: READ LIST.
As I read out few DTH service providers' name, please let me know if you are aware of it? [MA
Q21d PROGRAMMER INSTRUCTION:<<DISPLAY BRANDS CODED IN Q20 A/B and Q21 C >>
INTERVIEWER INSTRUCTION:DO NOT READ LIST
If you had to recommend one DTH service provider to somebody for TV connection, which one would it be? [SA]
Q21a Q21b Q21c Q21d
(H1)
First favorite
(H1)
Second favourite
(H1)
Aware
(H1)
Recommend
(225-226) (227-228) (229-230) (231-232)
(R1) Airtel DTH ...................................................................................................................................................... 01 01 01 01
(R2) DD Direct /DD Free Dish ................................................................................................................. 02 02 02 02
(R3) Dish TV ............................................................................................................................................... 03 03 03 03
(R4) Reliance Digital TV ........................................................................................................................ 04 04 04 04
(R5) Sun Direct DTH .............................................................................................................................. 05 05 05 05
(R6) Tata Sky ............................................................................................................................................... 06 06 06 06
(R7) Videocon D2H ......................................................................................................................................... 07 07 07 07
(R8) Zing Digital ..................................................................................................................................................... 08 08 08 08
(R12) Jio DTH
81
PROGRAMMER : ASK Q10C, Q10D, Q10E, Q10, Q10G, Q10A, Q10B AND .Q10F FOR THE NUMBER OF TV
Q10a PROGRAMMING INSTRUCTION:<<ASK ONLY If CODED 3 (DTH) in Q10
AUTOCODE FROM Q10E FOR THE TV SET CODED „2‟ IN Q10C, ALLOW THE INTERVIEWER TO CODE. If coded „2‟ in Q10C and coded „3‟ in Q10 and coded „6‟ in Q10b, autocode „2‟ in Q10a If coded „2‟ in Q10c and coded „3‟ in Q10 and coded „1/2/3/4/5‟ in Q10b, hide „2‟ in Q10a
INTERVIEWER INSTRUCTION: DO NOT READ LIST
You said, you have subscribed to DTH connection. Can you tell me the name of the DTH service provider you have subscribed to? [MA]
Current DTH Connection TV2 TV 3 TV 4
(339) 1
(R1) Airtel DTH ..................................................................................................................................................... 01 2
(R2) DD Direct /DD Free Dish ............................................................................................................ 02
(R3) Dish TV ............................................................................................................................................. 03
(R4) Reliance Digital TV ................................................................................................................... 04
(R5) Sun Direct DTH ......................................................................................................................... 05
(R6) Tata Sky .......................................................................................................................................... 06
(R7) Videocon D2H .................................................................................................................................... 07
(R8) Zing Digital .............................................................................................................................................. 08
(R11) Jio DTH
(R9) Others (specify) ....................................................................................................................................... 09
(R10) Not Aware (PROGRAMMER INSTRUCTION: SINGLE ANSWER) ..................................................................................................................................... 10
(R9) Others (Please Specify______________) ................................................................................................ 09 09 09 09
(R10) Others (Please Specify______________) ................................................................................................ 10 10 10 10
(R11) None ............................................................................................................................................................. 11 11 11 11

69
81
PROGRAMMER : ASK Q10C, Q10D, Q10E, Q10, Q10G, Q10A, Q10B AND .Q10F FOR THE NUMBER OF TV
Q10a PROGRAMMING INSTRUCTION:<<ASK ONLY If CODED 3 (DTH) in Q10
AUTOCODE FROM Q10E FOR THE TV SET CODED „2‟ IN Q10C, ALLOW THE INTERVIEWER TO CODE. If coded „2‟ in Q10C and coded „3‟ in Q10 and coded „6‟ in Q10b, autocode „2‟ in Q10a If coded „2‟ in Q10c and coded „3‟ in Q10 and coded „1/2/3/4/5‟ in Q10b, hide „2‟ in Q10a
INTERVIEWER INSTRUCTION: DO NOT READ LIST
You said, you have subscribed to DTH connection. Can you tell me the name of the DTH service provider you have subscribed to? [MA]
Current DTH Connection TV2 TV 3 TV 4
(339) 1
(R1) Airtel DTH ..................................................................................................................................................... 01 2
(R2) DD Direct /DD Free Dish ............................................................................................................ 02
(R3) Dish TV ............................................................................................................................................. 03
(R4) Reliance Digital TV ................................................................................................................... 04
(R5) Sun Direct DTH ......................................................................................................................... 05
(R6) Tata Sky .......................................................................................................................................... 06
(R7) Videocon D2H .................................................................................................................................... 07
(R8) Zing Digital .............................................................................................................................................. 08
(R11) Jio DTH
(R9) Others (specify) ....................................................................................................................................... 09
(R10) Not Aware (PROGRAMMER INSTRUCTION: SINGLE ANSWER) ..................................................................................................................................... 10
(R9) Others (Please Specify______________) ................................................................................................ 09 09 09 09
(R10) Others (Please Specify______________) ................................................................................................ 10 10 10 10
(R11) None ............................................................................................................................................................. 11 11 11 11

An Analysis of Competition and Regulatory Intervention in India’s Television Distribution and Broadcasting Services
70
82
Q14 PROGRAMMER INSTRUCTION:
IF For at least 1 TV set CODED [1 OR 3-9] IN Q10A AND CODED 3 IN Q10 AND CODED 1/2/3/4/5 in Q10b, CODE 2 (SUBSCRIBER) in Q14
Else code Prospect of DTH
INTERVIEWER INSTRUCTION:CHECK QUOTA [SA]
Code
(142)
Route
Prospect of DTH ........................................................................................................................................ 1
Subscriber of DTH .................................................................................................................................... 2
Q28a PROGRAMMING INSTRUCTION:<Autocode from Q10a if coded „3‟ in Q10‟>
You said, you have subscribed to DTH connection. Can you tell me the name of the DTH service provider you have subscribed to? [MA]
Q28a
(H1)
Current Usage
(339)
(R1) Airtel DTH ..................................................................................................................................................... 01
(R2) DD Direct /DD Free Dish ............................................................................................................. 02
(R3) Dish TV ........................................................................................................................................... 03
(R4) Reliance Digital TV .................................................................................................................... 04
(R5) Sun Direct DTH ......................................................................................................................... 05
(R6) Tata Sky .......................................................................................................................................... 06
(R7) Videocon D2H .................................................................................................................................... 07
(R8) Zing Digital .............................................................................................................................................. 08
Jio DTH
(R9) Others (specify) ....................................................................................................................................... 09
(R10) Not Aware (PROGRAMMER INSTRUCTION: SINGLE ANSWER) .................................................. 10

7183
Q29 <<ASK for the TV sets which are CODED 1 or 2 in Q10>>
Display brands coded in Q22E1 or Q22E2 or Q22E3. Always display option 18 and 19
You said, you have subscribed to Cable connection. Can you tell me the service provider name? [SA]
Current Usage TV1
TV2 TV3 TV4
(260-261)
(R1) Ashiana Communications / Ashiana Cable .................................................................................................... 01
(R2) Bhavani Rajesh Cable .................................................................................................................................... 02
(R3) Darsh Digital .................................................................................................................................................. 03
(R4) Delhi DistributionCompany (DDC) ............................................................................................................... 04
(R5) DEN ............................................................................................................................................................... 05
(R6) Digicable ........................................................................................................................................................ 06
(R7) Fastway ......................................................................................................................................................... 07
(R8) GTPL ............................................................................................................................................................. 08
(R9) Hathway ......................................................................................................................................................... 09
(R10) Home Cable ................................................................................................................................................... 10
(R11) Home System ................................................................................................................................................. 11
(R12) Indusind / In Digital /In Cable 12
(R13) Novabase / Nova Digital 13
(R14) Satellite Channels Pvt Ltd. (SCPL) 14
(R15) Sea TV /Sea Digital 15
(R16) Siti Cable 16
(R17) UCN Cable 17
(R18) Others (specify) 18
(R19) Don't Know (single select answer) 19

An Analysis of Competition and Regulatory Intervention in India’s Television Distribution and Broadcasting Services
72
84
Q36 PROGRAMMER INSTRUCTION: ASK FOR BRANDS CODED IN Q20 a/b or Q21 c
REPEAT HEADER AFTER EVERY FIVE ATTRIBUTES.
ROTATE ORDER OF BRANDS & ATTRIBUTES
PLEASE PROVIDE BOXES- NUMERIC AND VALIDATE FOR DIGITS 1 TO 5 AND 9.
I will see some statements that other people have said about DTH brands. Though you may not use them, your perception towards them is what matters. I would like to know how strongly you associate each statement with the brand.
Please use a scale from 1 to 5, where
(1) is Completely Disagree
(2) is Disagree
(3) is Somewhat Agree
(4) is Agree
(5) is Completely Agree
(9) Can‟t Say
Thinking first about (READ OUT BRAND), can you please tell me how strongly you associate (READ OUT BRAND) with (READ OUT ATTRIBUTE) (ASK HORIZONTALLY).
Airtel DTH
Dish TV Reliance Digital
TV
Sun Direct DTH
Tata Sky Videocon D2H
Jio DTH
(R1) Excellent customer support ......................................................................................................................
(R2) Simple recharge methods .........................................................................................................................
(R3) Easy to log complaint & resolve ..............................................................................................................
(R4) Simple & convenient to use .....................................................................................................................
(R5) Flexible & convenient than cable
(R6) Excellent quality of picture ......................................................................................................................
(R7) Excellent quality of sound .......................................................................................................................
(R8) It has channels my family likes ................................................................................................................
(R9) More than just channels (experience) ........................................................................................................................................................................
(R10) Range of interactive services [Display only if coded 1 in Q35b] ..................................................................................................................
85
(R11) New & relevant products .........................................................................................................................
(R12) First to bring latest technology ................................................................................................................
(R13) Innovative value added services [Display only if coded 1 in Q35C] ..................................................................................................................
(R14) Technology leader of DTH industry
(R15) Excellent value for money .......................................................................................................................
(R16) Offers more value than cable ...................................................................................................................
(R17) Reputed & trusted brand ..........................................................................................................................
(R18) Brand I am proud to own .........................................................................................................................
(R19) Brand I'd recommend to others ................................................................................................................
(R20) Best suited for me & my family ...............................................................................................................
(R21) Most preferred brand by children
(R22) Leader of DTH industry
(R23) Modern brand
(R24) Offers maximum number of channels
Q50 (DemoQ7a)
SHOW CARD
Could you please tell me your highest education qualification? [SA]
Code
(659)
Route
Illiterate ................................................................................................................................... 1
Literate but no formal schooling ............................................................................................. 2
School up to 4 years ................................................................................................................ 3
School 5 to 9 years .................................................................................................................. 4
SSC / HSC .............................................................................................................................. 5
Some college but not graduate ................................................................................................ 6
Graduate/Post graduate - General ........................................................................................... 7
Graduate/Post graduate - Professional .................................................................................... 8

73
85
(R11) New & relevant products .........................................................................................................................
(R12) First to bring latest technology ................................................................................................................
(R13) Innovative value added services [Display only if coded 1 in Q35C] ..................................................................................................................
(R14) Technology leader of DTH industry
(R15) Excellent value for money .......................................................................................................................
(R16) Offers more value than cable ...................................................................................................................
(R17) Reputed & trusted brand ..........................................................................................................................
(R18) Brand I am proud to own .........................................................................................................................
(R19) Brand I'd recommend to others ................................................................................................................
(R20) Best suited for me & my family ...............................................................................................................
(R21) Most preferred brand by children
(R22) Leader of DTH industry
(R23) Modern brand
(R24) Offers maximum number of channels
Q50 (DemoQ7a)
SHOW CARD
Could you please tell me your highest education qualification? [SA]
Code
(659)
Route
Illiterate ................................................................................................................................... 1
Literate but no formal schooling ............................................................................................. 2
School up to 4 years ................................................................................................................ 3
School 5 to 9 years .................................................................................................................. 4
SSC / HSC .............................................................................................................................. 5
Some college but not graduate ................................................................................................ 6
Graduate/Post graduate - General ........................................................................................... 7
Graduate/Post graduate - Professional .................................................................................... 8
86
Q52a new
TV Watched Language
Tell me in which language TV is watched in your household most often? [SA]
Q52a
Languages Read
(661)
Hindi .................................................................................................................................................... 01
English .................................................................................................................................................... 02
Marathi ................................................................................................................................................ 03
Tamil ................................................................................................................................................... 04
Kannada ............................................................................................................................................... 05
Bengali ................................................................................................................................................. 06
Malayalam ........................................................................................................................................... 07
Telugu .................................................................................................................................................. 08
Gujarati ................................................................................................................................................ 09
Oriya .................................................................................................................................................... 10
Assamese ............................................................................................................................................. 11
Punjabi ................................................................................................................................................. 12
Urdu ........................................................................................................................................................ 13
Others(Pls Specify)_______________________________________________ .................................... 14

An Analysis of Competition and Regulatory Intervention in India’s Television Distribution and Broadcasting Services
74
87
Q23a
SHOW CARD
INTERVIEWER INSTRUCTION:READ LIST
As I read out few new forms of video streaming platforms. Please tell me if you are aware of it? [MA]
Q23a
AWARENESS
(R2) Netflix ......................................................................................................................................................... 1
Amazon Prime
Hotstar
Voot
Jio TV (246)
ALT Balaji 1
Ditto TV ....................................................................................................................................................... 1
None of the above(PROGRAMMER INSTRUCTION: MULTIPLE ANSWER) .................................. 1
Q23b <<PROGRAMMER INSTRUCTION : Show Aware Brands from 23a , do not ask Q23b if coded “none of the above “ at Q23a >>
Do any of your family member including you use any of the following applications?
INTERVIEWER INSTRUCTION:READ LIST[MA]
Q23b
USAGE
Netflix ......................................................................................................................................................... (244)
(R1) Amazon Prime 1
Hotstar (245)
(R2) Voot 1
Jio TV (246)
ALT Balaji
Ditto TV .......................................................................................................................................................
None of the above(PROGRAMMER INSTRUCTION: SINGLE ANSWER) ........................................ 1


Indian Council for Research on International Economic RelationsCore 6A, 4th Floor, India Habitat Centre, Lodhi Road, New Delhi - 110 003, India
T: +91 11 43112400 www.icrier.org