an analysis of human fatalities from …riskfrontiers.com/pdf/flood_fatality_report_final.pdf · an...
TRANSCRIPT

AN ANALYSIS OF HUMAN FATALITIES FROM FLOODS IN AUSTRALIA 1900-2015
Katharine Haynes, Lucinda Coates, Felipe Dimer de Oliveira, Andrew
Gissing, Deanne Bird, Rob van den Honert, Deirdre Radford,
Rebecca D’Arcy, Chloe Smith
Risk Frontiers, Macquarie University
Bushfire and Natural Hazards CRC

AN ANALYSIS OF HUMAN FATALITIES FROM FLOODS IN AUSTRALIA 1900-2015 | REPORT NO. 166.2016
i
Version Release history Date
1.0 Initial release of document 24/05/2016
This work is licensed under a Creative Commons Attribution-Non Commercial 4.0
International Licence.
Disclaimer:
Risk Frontiers and the Bushfire and Natural Hazards CRC advise that the
information contained in this publication comprises general statements based
on scientific research. The reader is advised and needs to be aware that such
information may be incomplete or unable to be used in any specific situation.
No reliance or actions must therefore be made on that information without
seeking prior expert professional, scientific and technical advice. To the extent
permitted by law, Risk Frontiers and the Bushfire and Natural Hazards CRC
(including its employees and consultants) exclude all liability to any person for
any consequences, including but not limited to all losses, damages, costs,
expenses and any other compensation, arising directly or indirectly from using
this publication (in part or in whole) and any information or material contained in
it.
Acknowledgments:
This research would not have been possible without the services and assistance
of the Victorian Public Archives Services, the National Coronial Information
System based in Melbourne, the Public Records Office of Tasmania, the coronial
office and State Records Authority New South Wales, Queensland State Archives
and State Records of South Australia. Thank you for the retrieval of coronial
reports and all the help and assistance given. Thank you to Kerrie Sydee, Justin
Hendry and Avianto Amri who assisted with data entry. Thank you is also due to
Michael Rumsewicz of the Bushfire and Natural Hazards CRC, the NSW State
Emergency Service, Tasmanian State Emergency Service and Chas Keys for
comments and advice on earlier drafts.
Publisher:
Bushfire and Natural Hazards CRC
May 2016
Citation: Haynes, K., Coates, L., Dimer de Oliveira, F., Gissing, A., Bird, D., van den
Honert, R., Radford, D., D’Arcy, R, Smith, C. (2016). An analysis of human fatalities
from floods in Australia 1900-2015. Report for the Bushfire and Natural Hazards
CRC
Cover: A word cloud of the most dominant words within the PerilAus flood
database.

AN ANALYSIS OF HUMAN FATALITIES FROM FLOODS IN AUSTRALIA 1900-2015 | REPORT NO. 166.2016
ii
TABLE OF CONTENTS
EXECUTIVE SUMMARY 1
Results 1
INTRODUCTION 5
LITERATURE REVIEW 7
Global flood mortality 7
Vehicle related flood mortality 9
METHODOLOGY 11
Data Sources 11
Data Analysis 15
RESULTS 18
Demographics 18
Activity and reason behind action 26
Capacity and awareness 32
Fatalities by catchment 38
Fatalities associated with flood type and flood severity 39
Clusters of 20 or more fatalities 40
An exploration of the fatalities between 2000 – 2015 44
DISCUSSION AND RECOMMENDATIONS 49
Salient results 49
Management insights 50
Future research 59
REFERENCES 61
APPENDIX – ANALYSIS OF FATALITIES AMONGST OCCUPANTS OF VEHICLES 64

AN ANALYSIS OF HUMAN FATALITIES FROM FLOODS IN AUSTRALIA 1900-2015 | REPORT NO. 166.2016
1
EXECUTIVE SUMMARY
This report examines the socio-demographic and environmental circumstances
surrounding flood fatalities in Australia between 1900 and 2015. It is the first
major milestone from the Bushfire and Natural Hazards Cooperative Research
Centre funded project “An analysis of human fatalities and building losses from
natural disasters in Australia”.
The foundation for this work is the use of the Risk Frontiers’ database PerilAUS,
which contains historical data on the incidence (magnitude, affected
locations, etc.) and consequences (property damage and fatalities, etc.) of
natural hazard events in Australia. PerilAUS contains many of the names of the
deceased, which, during the course of this project has enabled the collection
of more detailed information on the circumstances of many of the fatalities
from coronial inquest reports. Since project commencement, the Flood
Database has increased in total number of flood events by 75%. The number of
fatal flood events has increased by 100% over the length of the project.
Importantly, the percentage of named fatalities has increased from 50% to 90%,
in addition to an increase in the overall numbers of fatalities.
The data has been analysed in relation to informing the understanding of the
circumstances surrounding the deaths and how this information could best be
utilised for emergency management policy and practice. This has included an
examination of the data around the following themes: demographics, cause of
death, location of the fatality and transport, activity and reason behind action
prior to death, capacity and awareness, and flood type and severity.
RESULTS
Demographics
The total number of recorded deaths is 1859 with an average national
annual death rate of 2.91 fatalities per 100,000 people per year. Death
rates have steadily declined through time.
The majority of people died from drowning (54.9%, n=1020), followed by
those who were likely to have died from drowning or where drowning
was an associated cause (33.1%, n=615).
The majority of the deaths have occurred in events where two or less
people have died (67.1%, n=1248; 1076 flood events).
79.1% of the fatalities have been males. However, since the 1960s the
proportion of female to male fatalities has increased.
Children and young adults (< 29 years of age) make up the greatest
proportion of deaths (43.4%, n=806). The highest proportion of males are
in the 10-29 age brackets (30.1%, n=443) and the highest proportion of
females in the younger 0-19 age brackets (45.6%, n=166). For both
genders the proportion of fatalities then decreases steadily with age.

AN ANALYSIS OF HUMAN FATALITIES FROM FLOODS IN AUSTRALIA 1900-2015 | REPORT NO. 166.2016
2
An analysis of the average age of the fatalities through time follows the
Australian average. However, the average age for females is much
lower than the Australian average in the years between 1920 and 1960.
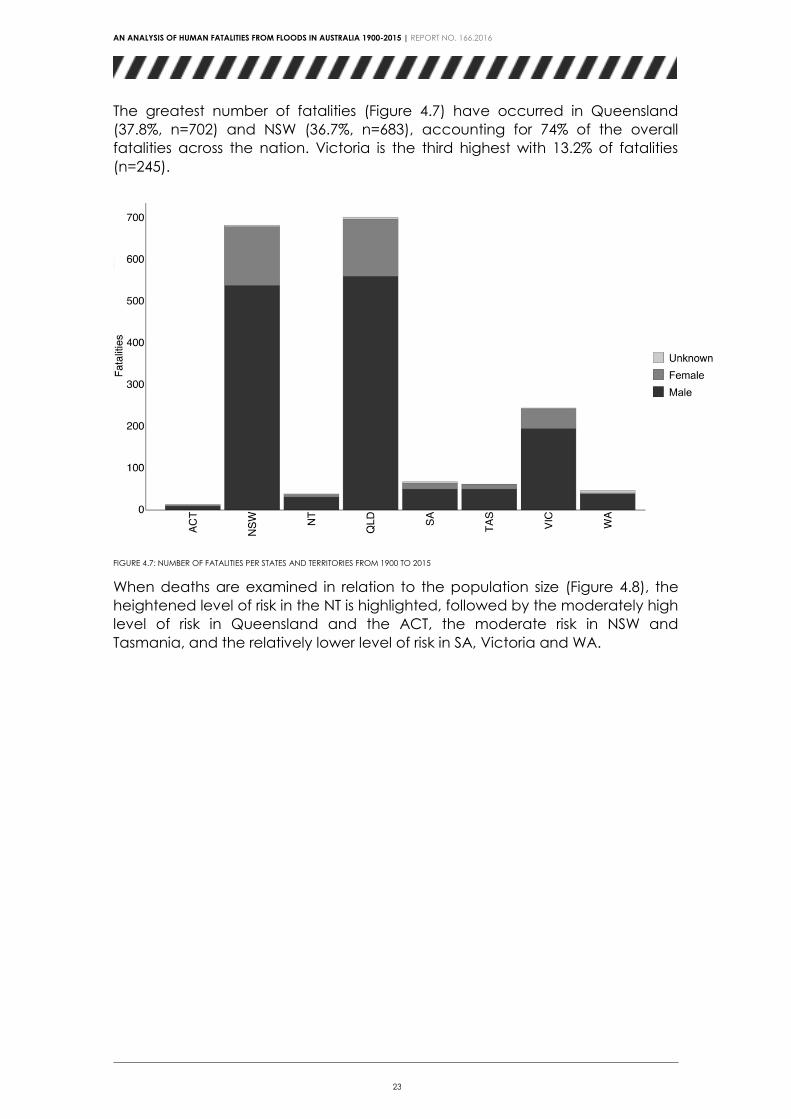
The greatest number of fatalities overall have occurred in Queensland
(37.8%, n=702) and NSW (36.7%, n=683), together accounting for 74.5% of
the fatalities across the nation.
When deaths are examined in relation to the per capita population, the
heightened level of risk in the NT is highlighted.
Activity and reason behind action
The highest proportions of women died while attempting to cross a
bridge, causeway, culvert, road, etc. (38.2%, n=139), followed by those
engaged in an activity not near a usual watercourse, e.g. in their home
or driving through town (22.5%, n=82).
The highest proportions of men died while attempting to cross a bridge,
causeway, culvert, road, etc. (men: 43.4%, n=639) followed by those
engaged in an activity near the water (bank) (11.8%, n=173).
Of the total of both men and women engaged in an activity not near a
usual watercourse (n=226), 46.9% (n=106) were in a house, 13.3% (n=30)
were on a house, and 23.9% (n=54) were outside. Prior to death,
because of the rapid nature of the flooding or their particular
circumstances the majority of these people were engaged in an
evacuation, awaiting a planned rescue / evacuation or were in their
home and unaware.
Being engaged in an activity near the water (bank) was the second
highest cause of death for men (11.8%, n=173) and the third highest for
women (11.3%, n=41). The majority of these victims were recreating
(40.0%, n=86).
For those attempting to cross a bridge, causeway, culvert, road, etc. the
risk is broadly split across all age ranges although the highest number of
fatalities is seen within the 10-29 year age range (32.4%, n=255).
Children and young people (0-19 years) accounted for the greatest
proportion of fatalities engaged in activities near the water and in or
near stormwater drains (48.4%, n=104; 69.4%, n=34, respectively). The
highest proportion of those 0-19 years were recreating prior to death
(32.5%, n=181).
Young people and young adults (10-29 years) made up the majority of
fatalities engaged in activities in the water (67.3%, n=78).
The greatest proportion of fatalities among females occurred while
recreating (19.8%, n=72) while the greatest proportion of fatalities among
males occurred while en route (15.4%, n=227).

AN ANALYSIS OF HUMAN FATALITIES FROM FLOODS IN AUSTRALIA 1900-2015 | REPORT NO. 166.2016
3
Capacity and awareness
The majority of fatalities were capable of independent action (53.6%,
n=997) and, of these, 59.5% (n=593) were aware of the flood but the
depth and / or speed of the water took them by surprise.
The second highest proportion in terms of capacity, were those following
the decision making of others (such as children or passengers in a car)
(15.7%, n=292) followed by a child or group of children on their own who
are under the age of 11 (9.3%, n=173). Of those following the decision
making of others, 37.0% (n=108) were aged between 0-9 years and
21.2% (n=62) are aged 10-19 years.
There were a considerably higher proportion of males that were capable
of independent action (59.5%, n=875) than any other capacity
category. In comparison, the highest proportions of females were
following the decision making of others (36.3%, n=136) and capable of
independent action (32.7%, n=119). In terms of children who were on
their own or in a group of children, 69.4% were male (n=120) and 28.9%
were female (n=50).
The highest proportion of fatalities (36.6%, n=681) occurred in daylight. Of
those who were aware of the flood risk but the depth and / or speed
took them by surprise, the greatest proportion occurred in daylight hours
(38.5%, n=312).
In terms of transport, the highest proportions were on foot (25.9%, n=482)
and in a vehicle/ 4WD/ horse drawn vehicle (24.4%, n=462). However,
there is a decrease in fatalities on foot, horses and horse drawn vehicles
and an increase of those in motorised vehicles, over time. In particular,
fatalities associated with 4WD vehicles have dramatically increased over
the last 15 years.
Fatalities associated with catchments and flood type
The top two catchments in terms of the great number of fatalities are
both in Queensland: the Fitzroy River Basin (28.0%, n=125) and Brisbane
River (23.5%, n=105). The remaining three of the top five are located in
NSW: Murrumbidgee River (16.6%, n=78), Hunter River (17.4%, n=74) and
Georges River (14.5%, n=65).
The highest proportion of women (36.6%, n=52 of a total of 142) died in
urban settings in relation to a local flash flood or low-level short duration
flood.
Clusters of fatalities
Seven cases were identified where 20 or more clusters of fatalities
occurred: December 1916, Queensland; February 1927, Queensland;
April 1929, Tasmania; October-November 1934, Victoria; February 1954,
New South Wales; February 1955, New South Wales; December 2010-
January 2011, Queensland.

AN ANALYSIS OF HUMAN FATALITIES FROM FLOODS IN AUSTRALIA 1900-2015 | REPORT NO. 166.2016
4
A closer look at fatalities between 2000 and 2015
50.0% of the 178 fatalities that occurred in the period from 2000-2015
were aware of the flood risk but the depth and / or speed took them by
surprise. Of this group, 48.3% (n=43) were capable of independent
action and 31.5% (n=28) were influenced by drugs or alcohol.
The largest proportion of male fatalities occurred in the 10-19 year age
group (19.3%, n=23).
The majority of people (male and female) aged between 10-19 years
were either on foot or swimming (71.0%, n=22) and recreating (64.5%,
n=20) prior to perishing in/near floodwater.
A higher proportion of people in the 20-29 year age group died while on
foot or swimming (55.0%, n=11) than being in a vehicle (30.0%, n=6).
The detailed data for 121 of the 178 cases allowed for a spatial analysis
of location of fatality compared to home. Results showed 26.5% (n=32)
of fatalities occurred within 5 km of their home and 57.9% (n=70) were
within 20 km of their home.
The implications of these results are discussed in Section 5 in regards to potential
changes to emergency management policy and practice.

AN ANALYSIS OF HUMAN FATALITIES FROM FLOODS IN AUSTRALIA 1900-2015 | REPORT NO. 166.2016
5
INTRODUCTION
The Bushfire and Natural Hazards Cooperative Research Centre has been set
up to conduct applied research to reduce the risks and consequences of
natural disasters and to build a disaster-resilient Australia. The Scenarios and
Loss Analysis cluster project entitled “An analysis of human fatalities and
building losses from natural disasters in Australia”1 aims to measure and
understand the impacts of natural hazards in terms of the toll on human health
and the built environment.
This examination is a fundamental first step to providing an evidence base for
future emergency management policy, practice and resource allocation and
to enable efficient and strategic risk reduction strategies. Outputs will also feed
into other ongoing research projects in the CRC and elsewhere. The analysis
underpinning the project will be based on an examination of the historical
record of losses caused by natural hazards in Australia since 1900.
The overall objectives of the project are:
1. An analysis of fatalities, in terms of demographics, social and
environmental circumstances surrounding deaths.
2. An analysis of people otherwise affected by natural hazards – injured,
near-misses, rescued.
3. An analysis of building damage and losses arising from natural hazard
events over the last century.
The hazards to be studied include: floods, cyclones, earthquakes, heatwaves,
severe storms and bushfires2.
This report focuses on the first deliverable of the project which is a detailed
longitudinal analysis of Australian flood fatalities. The foundation for this work is
the use of the Risk Frontiers’ database PerilAUS. The database contains historical
data (dating back to the earliest days of European settlement in Australia) on
the incidence (magnitude, affected locations, etc.) and consequences
(property damage and fatalities, etc.) of such events. PerilAUS was deemed a
good basis for this project due to the length of period covered, the wealth of
descriptive detail concerning the hazard impact and the inclusion of data
about any fatalities caused by that hazard. As part of this project this data has
been augmented through extensive data collection from the print media,
coronial and archive offices. In particular, the original data contained many of
the names of the deceased, which has enabled the collection of more
detailed information on the circumstances of the death from coronial records.
Since project commencement, the Flood Database has increased in total
number of flood events by 75%. The number of fatal flood events has increased
1 http://www.bnhcrc.com.au/research/economics-policy-and-decision-making/235
2 Bushfire loses will be investigated for building loses only. A detailed analysis of bushfire fatalities
has already been conducted in previous projects and will only be included here in terms of an
overall analysis and comparison of the fatalities from all hazard events.

AN ANALYSIS OF HUMAN FATALITIES FROM FLOODS IN AUSTRALIA 1900-2015 | REPORT NO. 166.2016
6
by 100% over the length of the project. Importantly, the percentage of named
fatalities has increased from 50% to 90%, in addition to an increase in the overall
numbers of fatalities. This allows a far greater percentage of fatalities to be
verified and a more detailed picture of the circumstances surrounding their
death to be gleaned from coronial inquests.
The social and environmental factors of interest include:
Social - Age, gender, occupation, preparation, risk reduction activities,
knowledge and warnings received, activities and decisions leading up to and
at the time of death, capacity to act, mode of transport, medical cause of
death etc.
Environmental - Details of the location and particular hazard: e.g. flood type,
flood height and intensity (such as “a one in 100 event”). This will also include,
where possible, details on the location of the deceased with respect to the
hazard.
The report will begin with a literature review in order to explore and present
relevant international research on flood fatalities. A detailed methodology will
be presented followed by the results. The findings will then be discussed in
relation to policy and practice recommendations. These recommendations are
based on expert opinion and also wider findings and discussion within the
literature.

AN ANALYSIS OF HUMAN FATALITIES FROM FLOODS IN AUSTRALIA 1900-2015 | REPORT NO. 166.2016
7
LITERATURE REVIEW
GLOBAL FLOOD MORTALITY
According to the International Federation of Red Cross and Red Crescent
Societies (2015), some 59,092 flood fatalities have occurred worldwide between
2005 and 2014, with the large majority of these occurring in Asia. Despite the
significance of flood mortality, few studies have explored trends and
characteristics associated with flood fatalities (Jonkman and Vrijling 2008) and
those that have generally focus on western contexts.
Globally, flooding is a significant cause of drowning (World Health Organization
2014, Jonkman and Kelman 2005), with drowning being a significant cause of
flood deaths (Diakakis and Deligiannakis 2015, Haynes et al. 2009, Jonkman
2014, Jonkman and Kelman 2005, 2009, Jonkman et al. 2009). Other causes of
death include physical trauma, heart attack, electrocution, carbon monoxide
poisoning, fire (Jonkman and Kelman 2005) and hypothermia (Vinet et al. 2012).
Most commonly, the circumstances of the fatality involve people taking risks
and entering floodwater either on foot or in a vehicle, of which vehicle related
fatalities are most frequent (Ashley and Ashley 2008, Diakakis and Deligiannakis
2013, Jonkman and Kelman 2005, Jonkman and Vrijling 2008, Kundzewicz and
Kundzewicz 2005, Špitalar et al. 2014). Other circumstances include being
trapped within a building, being in a boat or a failed rescue attempt (Jonkman
and Kelman, 2005).
A significant number of flood fatalities have been attributed to unnecessary risk
taking behaviors (Jonkman and Kelman 2005). Where people have deliberately
entered floodwaters, reasons for doing so have been to continue their
intended travel; engage in recreational pursuits; continue their work; and
evacuate or carry out a rescue of a person or pet (Haynes et al. 2009).
In the United States, studies have concluded that between 56% and 68% of
fatalities were vehicle related (Ashley and Ashley 2008, Kundzewicz and
Kundzewicz 2005, Špitalar et al. 2014). Jonkman and Vrijling (2008), in a review
of flood fatalities within Europe and the United States, found that 32.8% of
deaths were related to vehicles. In Greece, vehicle related deaths have been
identified as constituting approximately 40% of all flood fatalities (Diakakis and
Deligiannakis 2015). In the Australian context, FitzGerald et al. (2010) found that
48.5% of fatalities were vehicle related, and Haynes et al. (2009) found that 31%
of Australian flash flood deaths were related to vehicles.
Not surprisingly, a significant proportion of flood rescues performed by rescue
agencies are also of people from vehicles. Haynes et al. (2009) analysed flood
rescues performed during New South Wales’ Hunter Valley June 2007 floods,
and found that 36% had been from vehicles.
In regards to other circumstances of fatalities, FitzGerald et al. (2010) found that
26% of fatalities were associated with people engaged in swimming or surfing in
flooded streams, and 16% were associated with attempts to swim or wade
across flooded areas.

AN ANALYSIS OF HUMAN FATALITIES FROM FLOODS IN AUSTRALIA 1900-2015 | REPORT NO. 166.2016
8
When considering gender in western societies, males are over represented in
fatality statistics (Ashley and Ashley 2008, Coates 1999, FitzGerald et al. 2010,
Haynes et al. 2009, Jonkman 2014, Jonkman and Kelman 2005, Jonkman and
Vrijling 2008, Kundzewicz and Kundzewicz 2005) and injury statistics (Haynes et
al. 2009). Jonkman and Vrijling (2008) found that 70% of flood fatalities were
male, Coates (1999) 80.6%, FitzGerald et al. (2010) 71.2%, and Diakakis and
Deligiannakis (2015) 62.9%. The over representation has been attributed to the
high proportion of males who drive vehicles (Jonkman and Kelman 2005),
occupations held by males and the risk taking behavior of males (Coates 1999,
Haynes et al. 2009, Jonkman and Kelman 2005).
The over-representation of males is not apparent in South East Asian flood
events, with Yeo and Blong (2010) finding that analysis of Asian flood disasters
reveals that women are more likely to be at risk. For example in the 1991
Bangladesh Cyclone four times more women died in the storm surge then men
(Chowdhury et al. 1993). Reasons given for the trend are: women are more
likely not to evacuate as they are often care providers; the way women dress
restricts movement; possible cultural shame if women escape to public areas if
their clothing is ripped; inability to swim; and malnourishment (Yeo and Blong
2010).
The age of flood victims varies across studies. In Poland, Kundzewicz and
Kundzewicz (2005) found that the majority of victims were aged between 20
and 59 and similarly in Greece, Diakakis and Deligiannakis (2015) found
fatalities to be concentrated between people 20 to 69 years old. However in
Australia, Haynes et al. (2009) found that mortality was greatest between 0-29
and 60-69 years, and FitzGerald et al. (2010) found mortality was concentrated
between 10-29 years and over 70 years. Likewise in the United States, Ashley
and Ashley (2008) found fatalities were most prevalent in people aged
between 10 and 29 and over 60 years. In the aftermath of Hurricane Katrina,
Jonkman et al. (2009) found that the majority of deaths were elderly people,
with only 15% of victims being aged less than 51 years. Similarly, Vinet et al.
(2012), in an analysis of two flood events in France, found that two-thirds of
victims were aged over 60 years.
Fatalities associated with specific floods can be related to the magnitude of
the impact, and the potential for warning (Jonkman 2014). Flood fatalities tend
to cluster in a small number of big events. Coates (1999) found that 20 percent
of Australian fatalities occurred in just 10 events and in India, Singh and Kumar
(2013) found that severe floods were responsible for some 50% of all fatalities.
Jonkman and Vrijling (2008) concluded that flash flooding was associated with
the highest rates of mortality, likely due to the associated characteristics of flash
flooding including its sudden and destructive nature and limited opportunity to
effectively warn and evacuate residents. During flash flood events, the
availability of suitable shelter which will not be destroyed or fully submerged has
been identified as a key factor for enhancing safety (Haynes et al. 2009,
Jonkman and Vrijling 2008). When exposed to severe and sudden flash
flooding, children, the elderly (Jonkman and Vrijling, 2008) and people with
limited mobility (Haynes et al., 2009) are considered the most vulnerable.

AN ANALYSIS OF HUMAN FATALITIES FROM FLOODS IN AUSTRALIA 1900-2015 | REPORT NO. 166.2016
9
Time of day has been identified as a contributing factor, with nighttime found
to be the peak period for fatalities to occur (Diakakis and Deligiannakis, 2015,
Špitalar et al. 2014). Analysis of vehicle related fatalities in Greece and the
United States showed that most deaths had occurred at night (Diakakis and
Deligiannakis 2013, 2014, Maples and Tiefenbacher 2009, Špitalar et al. 2014),
with it hypothesised that drivers are not able to see flooded roads and
therefore enter floodwater by accident (Špitalar et al. 2014), or that drivers are
not able to assess the depth and velocity of water due to poor visibility (Maples
and Tiefenbacher 2009). Alcohol and drugs may also contribute (Jonkman and
Kelman 2005), as well as social pressures caused by passengers (Pearson and
Hamilton 2014).
In Australia the greatest number of fatalities has occurred in NSW and
Queensland (Coates 1999, FitzGerald et al. 2010). Some international studies
have identified that fatalities occur more frequently in rural areas rather than
urban areas (Diakakis and Deligiannakis 2015, Špitalar et al. 2014). Possible
reasons provided for this trend include greater distance for emergency services
to respond and lower population density may mean there is a lower chance
someone may be rescued by a passer-by (Špitalar et al. 2014).
VEHICLE RELATED FLOOD MORTALITY
Floodwaters can inundate vehicles, or wash them away. Some 30cm of
floodwater is enough for a small passenger vehicle to float (Shand et al. 2011).
Moreover, motorists may be unable assess what lies beneath flooded
roadways.
Research indicates that people drown in their vehicle as a result of the vehicle
being inundated, being swept away (Drobot et al. 2007, Kellar and Schmidlin
2012, Yale et al. 2003), trying to escape a vehicle by attempting to swim or walk
to safety (Drobot et al. 2007, Kellar and Schmidlin 2012, Yale et al. 2003) or by
being thrown from a vehicle (Kellar and Schmidlin 2012). Vehicles can either be
willingly driven into floodwaters, enter floodwater without warning (Yale et al.
2003) or be parked and suddenly surrounded by floodwater (Diakakis and
Deligiannakis 2013).
Motorists often willingly enter floodwater to reach a destination (Coates 1999,
Diakakis and Deligiannakis 2013), to rescue someone, recover something
(Diakakis and Deligiannakis 2013) or to evacuate (Becker et al. 2011).
Explanations for motorists deliberately entering floodwater include: not taking
warnings seriously (Drobot et al. 2007), not understanding the dangers (Drobot
et al. 2007), underestimating the risk (Diakakis and Deligiannakis 2013, Maples
and Tiefenbacher 2009), being impatient and thinking that they are invincible
(Franklin et al. 2014). Drivers may develop a false sense of security whilst inside a
vehicle (Diakakis and Deligiannakis 2013, Jonkman and Kelman 2005, Maples
and Tiefenbacher 2009) and it is possible that motorists may not fully appreciate
flood conditions such as the depth and speed of floodwaters, and the
influence such conditions may have on safety (Diakakis and Deligiannakis 2013,
Yale et al. 2003,). It has also been suggested that motorists may recognise the
risk but fail to personalise it, believing that the risk does not apply to them
(Pearson and Hamilton 2014).

AN ANALYSIS OF HUMAN FATALITIES FROM FLOODS IN AUSTRALIA 1900-2015 | REPORT NO. 166.2016
10
Ruin et al. (2007) found that motorists with the longest itineraries and those with
no prior flash flood experience were more likely to underestimate the level of
risk associated with entering floodwater. Previous flood experience has,
however, been associated with a greater likelihood of motorists entering
floodwater (Pearson and Hamilton 2014).

AN ANALYSIS OF HUMAN FATALITIES FROM FLOODS IN AUSTRALIA 1900-2015 | REPORT NO. 166.2016
11
METHODOLOGY
The project was completed in two steps: 1) updating the data held within
PerilAUS relating to human fatalities from flood events, and 2) statistical analysis
to determine the lives lost and the environmental and social circumstances
surrounding those fatalities.
PerilAUS is a database of impacts and consequences of natural hazards in
Australia held by Risk Frontiers. It was deemed a good basis for this project due
to the length of period covered, the wealth of descriptive detail concerning
the hazard impact and the inclusion of data about any fatalities caused by
that hazard. To meet the needs of this project, however, it was recognized that
the database needed to be enriched in breadth and detail. The following
material describes PerilAUS prior to the commencement of the CRC project
and how the data has been updated.
DATA SOURCES
PerilAUS prior to project commencement
PerilAUS contains detailed information on natural hazard events impacting
Australia from European settlement (1788) and before, but with good
confidence from 1900. The data includes information relating to fatalities,
injuries, building damage, costs and event characteristics.
Each event report in PerilAUS contains, where available, data on location –
state/territory, nearest town, postcode, latitude, longitude and dates – year,
month, day, hour and duration. Where available, physical attributes of each
event are recorded, and every attempt is made to give some notion of the
event magnitude and/ or the intensity.
Fatality data includes, where available, the demographics of the deceased;
date, time and cause of death; occupation and circumstances at time of
death – for example, what the deceased was doing at the time of/ just before
death.
The data is based on material collected from news media, government
departments and the published literature. A total of 21,777 references have
been included in PerilAUS thus far for the total of 14,965 event records from the
year 1900. The data covers 12 peril types: bushfire, earthquake, flood,
hailstorm, extreme heat, landslide, lightning strike, rainstorm, tornado, tropical
cyclone, tsunami and windstorm. The database has served to underpin some
twenty other hazard- and risk-related studies: for example, Blong (2004), Coates
et al. (1993), Coates (1996), Coates (1999), Coates et al. (2014), Crompton et al.
(2010), Haynes et al. (2009), Haynes et al. (2010) and Blanchi et al. (2014).
The dominant sources used initially for PerilAUS were The Sydney Gazette and
the Sydney Morning Herald (the colony’s first newspapers, dating from 1803 and
1831 respectively). In more recent years events drawn from the main
newspaper of each Australian state and the Australian Capital Territory (ACT)
from the mid-1990s have been included via Factiva - an online search tool and

AN ANALYSIS OF HUMAN FATALITIES FROM FLOODS IN AUSTRALIA 1900-2015 | REPORT NO. 166.2016
12
current international news database that provides access to sources such as
newspapers, newswires, journals, industry publications, websites, company
reports, television and radio transcripts and more.
The increase in the availability of scanned newspaper reports available online
through such information resources as Trove (National Library of Australia) and
the advent of the World Wide Web has ensured that PerilAUS now includes at
least the major hazard impacts in all states and territories. In recent years,
Factiva has included local news media in its available online resources of event
coverage – often these data sources provide valuable detail around human
health impacts.
Depending on the hazard type and data availability, government and other
official reports have been accessed. This has included publications by
Geoscience Australia, the Australian Bureau of Statistics (ABS) and the
Australian Institute of Health and Welfare (AIHW), and the Bureau of
Meteorology (BoM). In particular, historical state meteorological accounts,
published from 1839 to 1950 (depending on the state or territory), provided
much information for the first half of last century. For the latter half, the severe
weather summaries of Laurier Williams’ News Archive as well as the BoM
Significant Weather Summaries and Monthly Weather Reviews were employed.
In addition, case reports and historical and topical reports, inquiries and case
studies have been consulted. Articles on floodplain management, specific
events and general information on flooding in Australia were searched from the
available literature for more substantive information. Furthermore, a search was
undertaken of the historical literature on a national, state-wide and local basis.
In order to make a scientific analysis for policy and emergency management
reform the existing PerilAUS data needed to be further augmented and verified
as detailed below (3.1.2).
Updating PerilAUS
Since project commencement, the Flood Database has increased in total
number of flood events by 75%. The number of fatal flood events has increased
by 100% over the length of the project. Importantly, the percentage of named
fatalities has increased from 50% to 90%, in addition to an increase in the overall
numbers of fatalities. This allows a far greater percentage of fatalities to be
verified and a more detailed picture of the circumstances surrounding their
death to be gleaned from coronial inquests.
The PerilAUS Flood Database now includes, from 1900, 2487 flood event records,
528 of which have one or more concomitant deaths, and 1859 flood fatalities.
Coronial inquests
An important component of the current project was the examination, where
possible, of coronial data relating to flood fatalities. A coronial inquest may be
carried out if a death is sudden or untimely (amongst other reasons), but it
should be understood that inquests will not be carried out for every flood
fatality that has occurred.

AN ANALYSIS OF HUMAN FATALITIES FROM FLOODS IN AUSTRALIA 1900-2015 | REPORT NO. 166.2016
13
The data required in order to locate an inquest file are generally the name of
the deceased and the date of death, although sometimes other data such as
location of death are helpful.
A number of archives offices were accessed: those of Victoria (Vic), South
Australia (SA), Queensland (Qld), New South Wales (NSW), Tasmania (Tas) and
the Northern Territory (NT).
Coronial inquests were found to be a crucial means of verification and adding
further detail to the circumstances surrounding flood fatalities, especially by
enabling a better determination of the social, demographic and environmental
circumstances of the deceased.
Almost all the inquests located revealed additional data, including
confirmation of a flood-related fatality rather than a non-natural hazard-related
drowning.
In general, inquests include a coroner’s report and witness statements. The
coroner’s report lists the correct name, occupation, the location of the
deceased, the people who were with the deceased and other witnesses and
the time and date of death and when found. The witness statements give a
fuller account of the deceased and details up to the time of death, including
age, name of relatives, where the deceased came from, the reasoning behind
decisions made which led to the death, the actions of the deceased and their
knowledge or forewarning about the flood dangers, details of weather and the
state of the river (e.g. speed and depth of flood waters), type of flood and
distance from entering the river to where the body was found and its location
(e.g. in a tree).
Each State and Territory of Australia has a unique set of policies and procedures
around the public availability of inquests. This includes the holding period – the
length of time between when an inquest is carried out and when it becomes
publicly available. This information is summarised in Table 1.1.
State Publicly available? Holding period Other comments
Qld Yes 35 yrs State Archives: 1900-1978 files held and available. Coroner’s: 1979
onwards by application for Genuine Researcher status: did not hear
back in time for analysis.
NSW Yes None Records Office: 1900-1915: inquest registers only; 1916-1939: <10% files
kept; Jul 1942-Jun 1963: files held and available. Coroner’s: 1963-2014
records available via application; did not hear back in time for
analysis.
ACT Yes NA but… Archives/ Coroner: 1900-2014 generally publicly accessible BUT staff
extract the required records and Coroner decides whether permission
is granted to view on a case by case basis. No response was given by
the office to our enquiries.
Vic Yes 75 yrs from 1986
but…
Public Records Office: 1900-1985 files held and available. Coroner’s/
ethics committee:1986-2000 accessible via application. NCIS: records
for all states 2000-2014 available on application.
Tas Yes 75 yrs Records Office: 1900-1940 files held and available. Coroner’s: 1941-
2014 records available via application.
SA Yes 70 yrs at Records
Office
Records office: 1900-1953 files held and available. Coroner’s: 1954-
2014 via application; did not hear back in time for analysis.

AN ANALYSIS OF HUMAN FATALITIES FROM FLOODS IN AUSTRALIA 1900-2015 | REPORT NO. 166.2016
14
WA Possibly, with the
permission of Ethics
Committee
Applications for access to all files are referred to an Ethics Committee.
Records of non-natural death are normally destroyed after 30 years
but inquests are kept indefinitely: however, no records exist prior to the
late 1970s. Very late responses meant analysis could only be carried
out on NCIS-held files 2000-2014.
NT No NA Coroner’s: a modest number of records available via application; we
were able to access the majority of records we wished to.
TABLE 1.1: DATA AVAILABLE FROM ARCHIVES OFFICES (1900 ONWARDS ONLY)
The NSW State Records centre exemplifies one of the challenges in locating
inquest files, in that even when an inquest has been carried out, the files are not
always available. Inquest files in NSW have been disposed of for the period
1900 to 1915, and decimated for the period 1916 to 1939.
It is possible, by applying directly to the relevant Coroner, to obtain inquest
reports after the holding period by applying to the Coroner and/ or, sometimes,
an ethics committee, so access is by no means assured. Even when such
applications are successful, there is often a significant period of time between
when an application is submitted and when access is granted.
Weather data
The Australian Bureau of Meteorology (BoM) has proved a most valuable
source of information for PerilAUS. Of the 21,777 references included in PerilAUS
thus far, a total of 6082 BoM references have been utilized.
Despite the employment of these references, at the start of this project the
PerilAUS database was deficient in some of the physical characteristics data
from flood events. These events were originally researched and entered from
the mid to late 1990s and, at that stage, records available via the internet were
quite limited. Notwithstanding the relative abundance of such freely available
data sources now, there is limited availability of specific physical characteristic
information through BoM for, mainly, events distant in time and minor in impact
and/ or intensity.
Supplementary information was sought from the earliest fatal flood records of
interest – that is, from 1900. This and the paucity of information available from
the usual BoM sources meant that the majority of data was sourced from Trove.
This presented a number of difficulties as flood events are mainly reported and
discussed in terms of human effects rather than precise physical aspects: there
has been a high incidence of events which exist purely to record the deaths of
individuals. This is particularly the case for lesser known (generally more
moderate to minor) events. Trove-sourced media articles generally make no
mention of information such as duration, flood type, flood severity, maximum
height and other comments on flood intensity. Factiva was utilized to gain
further physical characteristic data for the more recent events.
Biases and data limitations
Newspaper articles, while containing valuable narrative detail, can contain
inaccuracies and bias towards newsworthy events and the early part of the
PerilAUS record contains a certain spatial bias towards New South Wales (NSW),
especially Sydney (as the main newspaper from only one of Australia’s capital

AN ANALYSIS OF HUMAN FATALITIES FROM FLOODS IN AUSTRALIA 1900-2015 | REPORT NO. 166.2016
15
cities was examined), and other long-established, well-populated areas having
the means and inclination to communicate with the media.
The inclusion of government, scientific, historical and other reports has
balanced the bias. In particular, the verification of the data through the
searching of inquest reports has allowed the majority of inaccuracies from the
news media to be identified and removed.
Access to some of these sources has proved difficult, despite having ethics
approval from Macquarie University. For example, access to the Western
Australian archives offices was not granted until it was too late to include the
data in our analysis; access to those of the ACT has still not been granted. In a
few cases, it has been impossible to source data in the format required. For
example, neither ABS nor AIHW will release unit record death data.
It is impossible to assert that PerilAUS has captured every detail of every flood
event that has impacted Australia since 1900. It can be asserted, though, that it
represents the best collection of such data in Australia, in both length and
breadth of record and event coverage. It can be stated with good confidence
that coverage includes the majority of the Insurance Council of Australia-listed
insurance loss events and other major and moderate events and the majority of
flood events that included one or more fatalities.
DATA ANALYSIS
The data was analysed in relation to informing the understanding of the
circumstances surrounding the deaths and how this information could best be
utilised for emergency management policy and practice. The data was
grouped into the following broad themes (the full coding scheme is available in
the appendix):
Demographics
Division into age and gender groups allowed the analysis to consider whether
certain groups possess a heightened vulnerability and how this has changed
through time.
Cause of death
This covered an assessment of the actual cause of death: that is, was the death
caused by drowning, exposure, an injury or a heart attack. Many of the earlier
deaths are noted within the media and official documentation to have been
caused by drowning while a number of the recent deaths, where full autopsies
have been performed, are noted as being due to heart attacks. It is therefore
likely that drowning deaths are overrepresented in our data. However, the
heart attacks are certainly associated with drowning and in some cases the
coroner assigns both as the cause of death.
Location of the fatality and transport
This determines where the deceased was i.e. were they outside in a flooded
watercourse, other floodwaters or inside or on a house or structure. The
deceased were also categorised in terms of their transport at the time of death

AN ANALYSIS OF HUMAN FATALITIES FROM FLOODS IN AUSTRALIA 1900-2015 | REPORT NO. 166.2016
16
in terms of being in a car or another form of closed or open transport and if
they exited from the vehicle.
Activity and reason behind action prior to death
This category defined people in terms of what they were doing (attempting to
cross a watercourse or engaged in an activity in their home etc) and why they
were doing it (attempting to evacuate, en route to work or home, recreating,
looking after livestock etc). The reasons behind the actions taken were divided,
if different, into actions prior to death and also at the time of death.
Capacity and awareness
Understanding the level of awareness of the flood risk, any warnings received or
visible signs and capacity to take action is crucial in terms of interpreting why
people took a particular course of action and how policy and practice can
best be amended to have the greatest impact. Although the available
information is limited, particularly for the early deaths, we have tried where
possible to categorise people’s decision-making. For awareness this involved
dividing the data between those who were aware of the flood but did not
expect to encounter it (e.g. walking their dog on the riverbank), those where
the depth, speed and/ or debris took them by surprise (e.g. driving through
floodwaters) and those who were unaware and taken by surprise (e.g. in their
home when flash flooding hit).
The coding for capacity involved categorising the data into those who were
capable of independent action and those who were not because of a number
of reasons including: a disability, inability to swim, under the influence of drugs
or alcohol, looking after dependants and being encumbered with clothing and
possessions. This code also recognised those who were likely to have followed
the decision making of others such as passengers in a vehicle.
The varying levels of detail available for each fatality sometimes required a
small number of assumptions to be made. This made the coding a balance
between the need to maximise the usefulness of the information extracted
without diminishing the accuracy of the interpretation of the data. For
example, unless otherwise stated all those who entered floodwaters in order to
perform a rescue or continue their journey were coded as “Awareness
category 2: knew there was a flood but depth, speed, debris took them by
surprise”. It is likely that a majority of those who were entering floodwaters at
night were not aware and therefore this data is presented in relation to the
timing of the event and potential visibility.
In terms of capacity, unless otherwise stated the fatality was coded as
“Capacity category 1: capable of independent action. However, many of
those labelled in this way may well have been influenced by unknown factors.
Furthermore it has been assumed that all drivers were capable of independent
action: however, it is likely that they were influenced by passengers. All children
who were with their parents or guardian were assumed to have followed the
instructions of adults and were not in control of the decisions taken that led to
their deaths. Children on their own who were less than 11 years old were coded
in their own category. Following consultation with child disaster experts the age

AN ANALYSIS OF HUMAN FATALITIES FROM FLOODS IN AUSTRALIA 1900-2015 | REPORT NO. 166.2016
17
of 11 was considered to be the most appropriate age cut off although it is
understood that children younger than 11 are more than capable of
independent decision.
Flood type and severity
Data was categorized according to flood type (flash flooding, coastal or inland
riverine, dam failure etc) and flood severity (minor, major, record etc).
AN ANALYSIS OF HUMAN FATALITIES FROM FLOODS IN AUSTRALIA 1900-2015 | REPORT NO. 166.2016
18
RESULTS
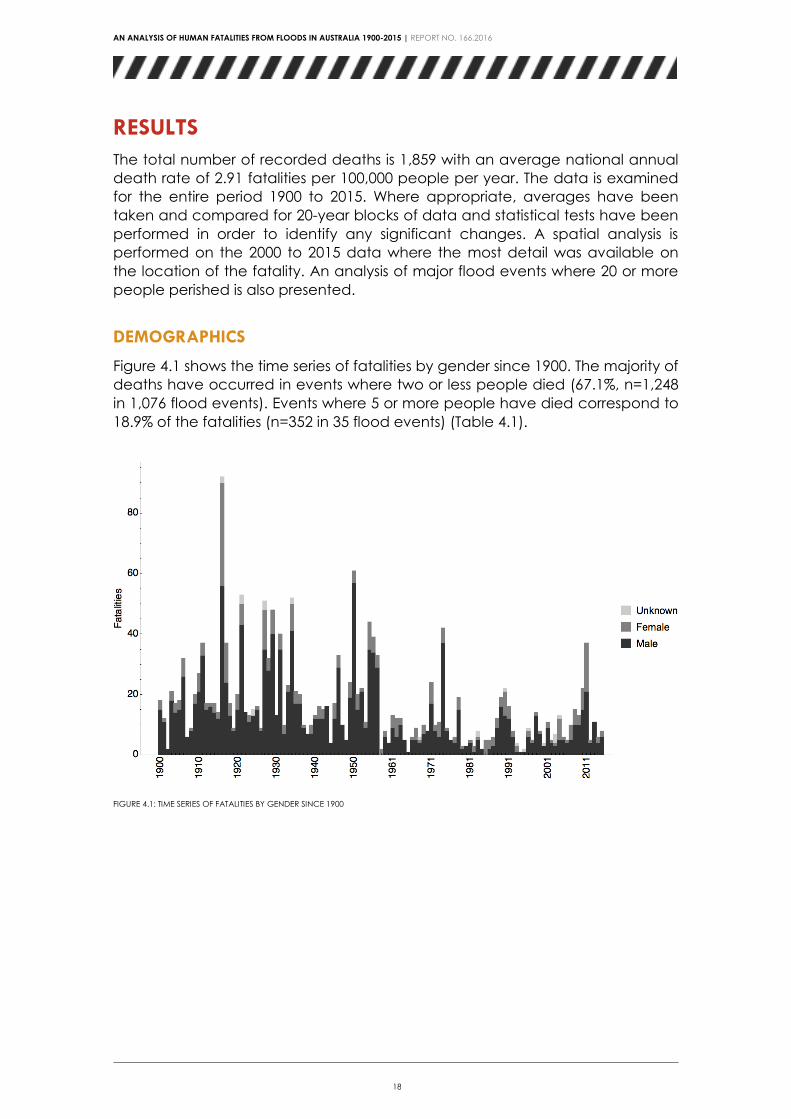
The total number of recorded deaths is 1,859 with an average national annual
death rate of 2.91 fatalities per 100,000 people per year. The data is examined
for the entire period 1900 to 2015. Where appropriate, averages have been
taken and compared for 20-year blocks of data and statistical tests have been
performed in order to identify any significant changes. A spatial analysis is
performed on the 2000 to 2015 data where the most detail was available on
the location of the fatality. An analysis of major flood events where 20 or more
people perished is also presented.
DEMOGRAPHICS
Figure 4.1 shows the time series of fatalities by gender since 1900. The majority of
deaths have occurred in events where two or less people died (67.1%, n=1,248
in 1,076 flood events). Events where 5 or more people have died correspond to
18.9% of the fatalities (n=352 in 35 flood events) (Table 4.1).
FIGURE 4.1: TIME SERIES OF FATALITIES BY GENDER SINCE 1900

AN ANALYSIS OF HUMAN FATALITIES FROM FLOODS IN AUSTRALIA 1900-2015 | REPORT NO. 166.2016
19
N (Number of fatalities
in the event)
Total number of fatalities for events
with N or more fatalities
Number of
events
1 1859 1186
2 969 282
3 611 110
4 452 59
5 352 35
6 267 19
10 159 7
TABLE 4.1: DISTRIBUTION OF FLOOD EVENTS BY NUMBER OF FATALITIES
Death rates have steadily declined over the years (Figure 4.2). Table 4.2 clearly
shows that the majority of these deaths have been males (79.1%, n=1471 out of
1859). Figure 4.3 show that the ratio of male-to-female fatalities has steadily
decreased over time, with a statistically significant decline (p<0.01) from the
1960s, indicating a greater proportion of female fatalities in more recent times.
A total of 35 people of Australian indigenous heritage are listed within the data
set, making up 1.9% of the total fatalities. However, it is likely that a large
proportion of indigenous deaths have been unrecorded and their deaths are
underrepresented.
FIGURE 4.2: NATIONAL DEATH RATES DUE TO FLOOD 1900-2015

AN ANALYSIS OF HUMAN FATALITIES FROM FLOODS IN AUSTRALIA 1900-2015 | REPORT NO. 166.2016
20
Male Female Unknown Total
1900-1909 132 (9.0%) 23 (6.3%) 0 (0.0%) 155 (8.3%)
1910-1919 212 (14.4%) 70 (19.2%) 2 (8.3%) 284 (15.3%)
1920-1929 222 (15.1%) 41 (11.3%) 8 (33.3%) 271 (14.6%)
1930-1939 174 (11.8%) 30 (8.2%) 2 (8.3%) 206 (11.1%)
1940-1949 131 (8.9%) 22 (6.0%) 0 (0.0%) 153 (8.2%)
1950-1959 210 (14.3%) 34 (9.3%) 0 (0.0%) 244 (13.1%)
1960-1969 52 (3.5%) 21 (5.8%) 1 (4.2%) 74 (4.0%)
1970-1979 110 (7.5%) 27 (7.4%) 0 (0.0%) 137 (7.4%)
1980-1989 45 (3.1%) 21 (5.8%) 2 (8.3%) 68 (3.7%)
1990-1999 64 (4.4%) 21 (5.8%) 4 (16.7%) 89 (4.8%)
2000-2009 58 (3.9%) 26 (7.1%) 5 (20.8%) 89 (4.8%)
2010-2015 61 (4.1%) 28 (7.7%) 0 (0.0%) 89 (4.8%)
Total 1471 (100.0%) 364 (100.0%) 24 (100.0%) 1859 (100.0%)
TABLE 4.2: GENDER BREAKDOWN 1900-2015 (% OF COLUMN TOTALS)
FIGURE 4.3: MALES TO FEMALE DEATH RATES 1900-2015
The breakdown by age (Table 4.3, Figure 4.4) demonstrates the distinct high-risk
groups of children and young adults (< 29 years of age) who make up the
greatest proportion of deaths (43.4%, n=806 out of 1859). The gender
breakdown by age shows the highest proportion of males in the 10-29 age
brackets (30.1%, n=443) and the highest proportion of females in the younger 0-
19 age brackets (45.6%, n=166). For both genders the proportion of fatalities
then decreases steadily with age. Over 50% of the female deaths occur in
those under 29 years (56.3%, n=205) and over 50% of the male deaths occur in
those under 39 years (51.2%, n=753).

AN ANALYSIS OF HUMAN FATALITIES FROM FLOODS IN AUSTRALIA 1900-2015 | REPORT NO. 166.2016
21
Male Female Unknown Total
0-9 153 (10.4%) 88 (24.2%) 4 (16.7%) 245 (13.2%)
10-19 233 (15.8%) 78 (21.4%) 1 (4.2%) 312 (16.8%)
20-29 210 (14.3%) 39 (10.7%) 0 (0.%) 249 (13.4%)
30-39 157 (10.7%) 30 (8.2%) 1 (4.2%) 188 (10.1%)
40-49 144 (9.8%) 19 (5.2%) 1 (4.2%) 164 (8.8%)
50-59 117 (8.0%) 22 (6.0%) 1 (4.2%) 140 (7.5%)
60-69 100 (6.8%) 17 (4.7%) 0 (0.0%) 117 (6.3%)
70-79 53 (3.6%) 12 (3.3%) 0 (0.0%) 65 (3.5%)
80-89 12 (0.8%) 6 (1.6%) 0 (0.0%) 18 (1.0%)
Unknown 293 (19.9%) 53 (14.6%) 16 (66.7%) 362 (19.4%)
Total 1471 (100.0%) 364 (100.0%) 24 (100.0%) 1859 (100.0%)
TABLE 4.3: BREAKDOWN OF THE FATALITIES BY AGE AND GENDER (% OF COLUMN TOTALS)
Age
FIGURE 4.4: BREAKDOWN OF FATALITIES BY AGE AND GENDER
A detailed examination of the fatalities under 18 by gender (Figure 4.5) shows
the heightened vulnerability of males, particularly among 2 year olds, children
(8-11 years) and young adults (18 years). Interestingly, we see increased
numbers of fatalities for two year old and also six and seven year old females.

AN ANALYSIS OF HUMAN FATALITIES FROM FLOODS IN AUSTRALIA 1900-2015 | REPORT NO. 166.2016
22
FIGURE 4.5: DISTRIBUTION OF FATALITIES BY AGE AND GENDER FOR PEOPLE 18 YEARS AND YOUNGER.
When the age breakdown of fatalities is examined over time (Figure 4.6), a
trend is seen of an increasing average age of the fatalities for both males and
females. This mirrors Australia’s ageing population rate over time. However, the
average age of flood fatalities for females is much lower than the Australian
average in the years between 1920 and 1960. In comparison, the average age
of male flood fatalities has, throughout the last century, more or less followed
the Australian average.
FIGURE 4.6: AVERAGE AGE OF FLOOD FATALITIES IN AUSTRALIA BY GENDER AND AGE. THE LINE LABELLED ‘PERSONS’ REPRESENTS THE NATIONAL
MEAN POPULATION AGE OVER TIME.
AN ANALYSIS OF HUMAN FATALITIES FROM FLOODS IN AUSTRALIA 1900-2015 | REPORT NO. 166.2016
23
The greatest number of fatalities (Figure 4.7) have occurred in Queensland
(37.8%, n=702) and NSW (36.7%, n=683), accounting for 74% of the overall
fatalities across the nation. Victoria is the third highest with 13.2% of fatalities
(n=245).
FIGURE 4.7: NUMBER OF FATALITIES PER STATES AND TERRITORIES FROM 1900 TO 2015
When deaths are examined in relation to the population size (Figure 4.8), the
heightened level of risk in the NT is highlighted, followed by the moderately high
level of risk in Queensland and the ACT, the moderate risk in NSW and
Tasmania, and the relatively lower level of risk in SA, Victoria and WA.

AN ANALYSIS OF HUMAN FATALITIES FROM FLOODS IN AUSTRALIA 1900-2015 | REPORT NO. 166.2016
24
FIGURE 4.8: FATALITY RATE PER 100,000 PEOPLE BY STATE
When fatalities in the various states and territories are examined longitudinally
(Table 4.4), we see an expected downward trend in deaths over time, apart
from in the Northern Territory.
ACT NSW NT QLD SA TAS VIC WA Total
1900-1909 0 (0.0%) 49 (7.2%) 0 (0.0%) 32 (4.6%) 11 (16.2%) 8 (12.9%) 49 (20.0%) 6 (12.8%) 155 (8.3%)
1910-1919 0 (0.0%) 73 (10.7%) 1 (2.6%) 138 (19.7%) 9 (13.2%) 4 (6.5%) 52 (21.2%) 7 (14.9%) 284 (15.3%)
1920-1929 1 (7.7%) 71 (10.4%) 1 (2.6%) 138 (19.7%) 9 (13.2%) 27 (43.5%) 22 (9.0%) 2 (4.3%) 271 (14.6%)
1930-1939 0 (0.0%) 68 (10.0%) 0 (0.0%) 76 (10.8%) 15 (22.1%) 1 (1.6%) 40 (16.3%) 6 (12.8%) 206 (11.1%)
1940-1949 0 (0.0%) 54 (7.9%) 2 (5.1%) 66 (9.4%) 7 (10.3%) 3 (4.8%) 14 (5.7%) 7 (14.9%) 1573(8.2%)
1950-1959 1 (7.7%) 154 (22.5%) 2 (5.1%) 47 (6.7%) 5 (7.4%) 5 (8.1%) 29 (11.8%) 1 (2.1%) 244 (13.1%)
1960-1969 1 (7.7%) 54 (7.9%) 1 (2.6%) 9 (1.3%) 5 (7.4%) 3 (4.8%) 1 (0.4%) 0 (0.0%) 74 (4.0%)
1970-1979 8 (61.5%) 57 (8.3%) 8 (20.5%) 45 (6.4%) 2 (2.9%) 4 (6.5%) 12 (4.9%) 1 (2.1%) 137 (7.4%)
1980-1989 2 (15.4%) 24 (3.5%) 4 (10.3%) 25 (3.6%) 1 (1.5%) 1 (1.6%) 3 (1.2%) 8 (17.%) 68 (3.7%)
1990-1999 0 (0.0%) 32 (4.7%) 5 (12.8%) 34 (4.8%) 4 (5.9%) 3 (4.8%) 7 (2.9%) 4 (8.5%) 89 (4.8%)
2000-2009 0 (0.0%) 32 (4.7%) 6 (15.4%) 32 (4.6%) 0 (0.0%) 3 (4.8%) 11 (4.5%) 5 (10.6%) 89 (4.8%)
2010-2015 0 (0.0%) 15 (2.2%) 9 (23.1%) 60 (8.5%) 0 (0.0%) 0 (0.0%) 5 (2.0%) 0 (0.0%) 89 (4.8%)
Total 13 (100%) 683 (100%) 39 (100%) 702 (100%) 68 (100%) 62 (100%) 245 (100%) 47 (100%) 1859 (100%)
TABLE 4.4: FATALITIES BY STATES AND TERRITORIES BY DECADE, 1900-2015 (% OF COLUMN TOTALS)
The seasonal breakdown of deaths by states and territories (Table 4.5) shows
that the majority of fatalities in Queensland, NSW and Northern Territory
occurred during the summer/monsoon season, predominantly in December,

AN ANALYSIS OF HUMAN FATALITIES FROM FLOODS IN AUSTRALIA 1900-2015 | REPORT NO. 166.2016
25
January, February and March, although there is a fairly high proportion of NSW
deaths in June that are associated with winter storms. In contrast, the SA,
Victoria, WA and Tasmanian deaths are more evenly distributed throughout the
year.
ACT NSW NT QLD SA TAS VIC WA Total
January 7 (53.8%) 102 (14.9%) 14 (35.9%) 176 (25.1%) 9 (13.2%) 1 (1.6%) 12 (4.9%) 4 (8.5%) 325 (17.5%)
February 1 (7.7%) 131 (19.2%) 7 (17.9%) 183 (26.1%) 10 (14.7%) 1 (1.6%) 15 (6.1%) 7 (14.9%) 355 (19.1%)
March 1 (7.7%) 64 (9.4%) 14 (35.9%) 83 (11.8%) 1 (1.5%) 2 (3.2%) 15 (6.1%) 9 (19.1%) 189 (10.2%)
April 1 (7.7%) 46 (6.7%) 3 (7.7%) 59 (8.4%) 3 (4.4%) 22 (35.5%) 10 (4.1%) 3 (6.4%) 147 (7.9%)
May 1 (7.7%) 39 (5.7%) 0 (0.0%) 21 (3.%) 4 (5.9%) 6 (9.7%) 4 (1.6%) 3 (6.4%) 78 (4.2%)
June 1 (7.7%) 79 (11.6%) 0 (0.0%) 19 (2.7%) 5 (7.4%) 9 (14.5%) 23 (9.4%) 8 (17.0%) 144 (7.7%)
July 0 (0.0%) 51 (7.5%) 0 (0.0%) 21 (3.%) 4 (5.9%) 6 (9.7%) 25 (10.2%) 5 (10.6%) 112 (6.0%)
August 0 (0.0%) 53 (7.8%) 0 (0.0%) 1 (0.1%) 8 (11.8%) 6 (9.7%) 35 (14.3%) 1 (2.1%) 104 (5.6%)
Septembe
r 0 (0.0%) 24 (3.5%) 0 (0.0%) 2 (0.3%) 7 (10.3%) 4 (6.5%) 39 (15.9%) 2 (4.3%) 78 (4.2%)
October 0 (0.0%) 30 (4.4%) 0 (0.0%) 11 (1.6%) 8 (11.8%) 1 (1.6%) 20 (8.2%) 3 (6.4%) 73 (3.9%)
November 0 (0.0%) 32 (4.7%) 0 (0.0%) 17 (2.4%) 3 (4.4%) 4 (6.5%) 27 (11.%) 1 (2.1%) 84 (4.5%)
December 1 (7.7%) 32 (4.7%) 1 (2.6%) 109 (15.5%) 6 (8.8%) 0 (0.0%) 20 (8.2%) 1 (2.1%) 170 (9.1%)
Total 13 (100%) 683 (100%) 39(100%) 702 (100%) 68 (100%) 62 (100%) 245(100%) 47 (100%) 1859 (100%)
TABLE 4.5: FATALITIES BY STATES AND TERRITORIES BY MONTH (% OF COLUMN TOTALS)
In terms of cause of death, the majority died from drowning (54.9%, n=1020),
followed by those who were likely to have died from drowning (33.1%, n=616)
(Table 4.6). The latter group cannot be accurately categorized as drowning
due to lack of specific data about whether or not injury, exposure or heart
attack was the root cause. As many of the early deaths were often classified as
drowning without a proper autopsy it would be most correct to state that 88%
of deaths were caused by drowning with injury, exposure or heart attack likely
to be a contributing factor in many of these.
Cause of death Total
Drowning 1020 (54.9%)
Exposure 4 (0.2%)
Drowning/injury/exposure/heart attack 615 (33.1%)
Injury - other 2 (0.1%)
Injury - Hit: by flood debris or hit a rock etc 8 (0.4%)
Injury - Flood-or rain-induced washaway / landslide 4 (0.2%)
Injury - Vehicle accident 9 (0.5%)
Injury - Flood-or rain-induced building collapse 1 (0.1%)
Injury – Tree fall, tree limb fall 3 (0.2%)
Heart attack, over-exertion, shock, collapse 20 (1.1%)
Electrocution (fallen power lines etc) 7 (0.4%)
Missing presumed dead (cause unknown) 41 (2.2%)
Unknown 125 (6.7%)
Total 1859 (100%)
TABLE 4.6: CAUSE OF DEATH

AN ANALYSIS OF HUMAN FATALITIES FROM FLOODS IN AUSTRALIA 1900-2015 | REPORT NO. 166.2016
26
ACTIVITY AND REASON BEHIND ACTION
The highest proportions of both men and women died while attempting to cross
a bridge, causeway, culvert, road, etc. (men: 43.4%, n=639; women: 38.2%,
n=139) (Table 4.7). For females, the second highest activity at the time of death,
accounting for nearly a quarter of all female fatalities, was being engaged in
an activity not near a usual watercourse, e.g. driving through town or in their
home and unaware of the flood waters (22.5%, n=82). This group do not
attempt to cross floodwaters but are surprised by flash flooding outside of a
usual water channel. For men this was the third highest cause of death (9.6%,
n=141). Of the total number involved in this activity (n=226), 46.9% (n=106) were
in a house (70.8%, n=75 of these were in a house that was destroyed), 13.3%
(n=30) were on a house (86.7%, n=26 of these were on a house that was
destroyed), and 23.9% (n=54) were outside. Prior to death, the majority of these
people were engaged in an evacuation, awaiting a planned rescue /
evacuation or in their home and taken by surprise (n=138) (Table 4.8).
Male Female Unknown Total
Attempting to cross bridge/ causeway/ crossing/
culvert/ ford/ watercourse 639 (43.4%) 139 (38.2%) 9 (37.5%) 787 (42.3%)
Attempting to cross floodwaters away from
watercourses (water over fields / town) 67 (4.6%) 10 (2.7%) 0 (0.0%) 77 (4.1%)
Engaged in an activity near the water
(on the bank / bridge) 173 (11.8%) 41 (11.3%) 1 (4.2%) 215 (11.6%)
Engaged in an activity in/ near
stormwater drain 37 (2.5%) 12 (3.3%) 0 (0.0%) 49 (2.6%)
Engaged in an activity in the water
(rescue, swimming) 94 (6.4%) 22 (6.0%) 0 (0.0%) 116 (6.2%)
Engaged in an activity on the water (boat) 77 (5.2%) 16 (4.4%) 0 (0.0%) 93 (5.0%)
Engaged in an activity not near usual watercourse
(e.g. in their home) 141 (9.6%) 82 (22.5%) 3 (12.5%) 226 (12.2%)
Other 5 (0.3%) 1 (0.3%) 0 (0.0%) 6 (0.3%)
Unknown 238 (16.2%) 41 (11.3%) 11 (45.8%) 290 (15.6%)
Total 1471 (100%) 364 (100%) 24 (100%) 1859 (100%)
TABLE 4.7: FATALITIES BY ACTIVITY PRIOR TO DEATH AND GENDER (% OF COLUMN TOTALS)

AN ANALYSIS OF HUMAN FATALITIES FROM FLOODS IN AUSTRALIA 1900-2015 | REPORT NO. 166.2016
27
Attempting to cross
bridge/ causeway/
crossing/ culvert/
ford/ road/
watercourse
Attempting
to cross
floodwaters
Engaged in
an activity
near the
water (bank/
bridge)
Engaged in
an activity
in/ near
stormwater
drain
Engaged in an
activity in the
water (rescue,
swimming,
joyride etc)
Engaged in
an activity
on the
water
(boat)
Engaged in
an activity
not near
usual
watercourse
Other Unknown Total
Attempting vertical evacuation 0 (0.0%) 0 (0.0%) 0 (0.0%) 0 (0.0%) 0 (0.0%) 0 (0.0%) 41 (18.1%) 0 (0.0%) 0 (0.0%) 41 (2.2%)
Being rescued/ evacuated 0 (0.0%) 8 (10.4%) 2 (0.9%) 0 (0.0%) 0 (0.0%) 11 (11.8%) 9 (4.0%) 0 (0.0%) 1 (0.3%) 31 (1.7%)
Awaiting a planned rescue/
evacuation 0 (0.0%) 0 (0.0%) 0 (0.0%) 0 (0.0%) 0 (0.0%) 0 (0.0%) 4 (1.8%) 0 (0.0%) 0 (0.0%) 4 (0.2%)
Refused to be evacuated 1 (0.1%) 0 (0.0%) 0 (0.0%) 0 (0.0%) 0 (0.0%) 0 (0.0%) 6 (2.7%) 0 (0.0%) 1 (0.3%) 8 (0.4%)
Evacuating 7 (0.9%) 8 (10.4%) 2 (0.9%) 0 (0.0%) 1 (0.9%) 0 (0.0%) 24 (10.6%) 0 (0.0%) 3 (1.0%) 45 (2.4%)
Late evacuation 0 (0.0%) 0 (0.0%) 0 (0.%) 4 (8.2%) 0 (0.0%) 0 (0.0%) 5 (2.2%) 0 (0.0%) 0 (0.0%) 9 (0.5%)
No attempt at evacuation as
unaware 0 (0.0%) 1 (1.3%) 15 (7.0%) 0 (0.0%) 0 (0.0%) 0 (0.0%) 55 (24.3%) 0 (0.0%) 0 (0.0%) 71 (3.8%)
En route 231 (29.4%) 13 (16.9%) 8 (3.7%) 4 (8.2%) 0 (0.0%) 13 (14.0%) 4 (1.8%) 0 (0.0%) 7 (2.4%) 280 (15.%)
En route from home 89 (11.3%) 2 (2.6%) 7 (3.3%) 2 (4.1%) 0 (0.0%) 1 (1.1%) 2 (0.9%) 0 (0.0%) 0 (0.0%) 103 (5.5%)
En route to home 159 (20.2%) 8 (10.4%) 3 (1.4%) 1 (2.0%) 2 (1.7%) 2 (2.2%) 1 (0.4%) 5 (45.5%) 5 (1.7%) 181 (9.7%)
Recreating/ visiting 38 (4.8%) 2 (2.6%) 86 (40.0%) 25 (51.0%) 90 (77.6%) 27 (29.0%) 8 (3.5%) 1 (9.1%) 3 (1.0%) 280 (15.1%)
Carrying out repairs due to flood
damage etc 4 (0.5%) 0 (0.0%) 11 (5.1%) 2 (4.1%) 0 (0.0%) 2 (2.2%) 1 (0.4%) 0 (0.0%) 1 (0.3%) 21 (1.1%)
Collecting provisions 18 (2.3%) 2 (2.6%) 1 (0.5%) 0 (0.0%) 0 (0.0%) 2 (2.2%) 0 (0.0%) 0 (0.0%) 0 (0.0%) 23 (1.2%)
Attempting to retrieve flotsam 0 (0.0%) 0 (0.0%) 5 (2.3%) 0 (0.0%) 1 (0.9%) 0 (0.0%) 0 (0.0%) 0 (0.0%) 0 (0.0%) 6 (0.3%)
Collecting people 2 (0.3%) 0 (0.0%) 1 (0.5%) 0 (0.0%) 0 (0.0%) 0 (0.0%) 0 (0.0%) 0 (0.0%) 0 (0.0%) 3 (0.2%)
Rescuing People, Property
Livestock 13 (1.7%) 9 (11.7%) 12 (5.6%) 1 (2.0%) 13 (11.2%) 14 (15.1%) 5 (2.2%) 1 (9.1%) 0 (0.0%) 68 (3.7%)
Working, attending livestock or
livelihood 107 (13.6%) 14 (18.2%) 28 (13.0%) 3 (6.1%) 4 (3.4%) 9 (9.7%) 19 (8.4%) 0 (0.0%) 7 (2.4%) 191 (10.3%)
Other 2 (0.3%) 0 (0.0%) 4 (1.9%) 0 (0.0%) 1 (0.9%) 3 (3.2%) 0 (0.0%) 1 (9.1%) 0 (0.0%) 11 (0.6%)
Unknown 116 (14.7%) 10 (13.%) 30 (14.0%) 7 (14.3%) 4 (3.4%) 9 (9.7%) 42 (18.6%) 3 (27.3%) 262 (90.3%) 483 (26.0%)
Total 787 (100%) 77 (100%) 215 (100%) 49 (100%) 116 (100%) 93 (100%) 226 (100%) 6 (100%) 290 (100%) 1859 (100%)
TABLE 4.8: FATALITIES BY REASON BEHIND ACTION AND ACTIVITY PRIOR TO DEATH (% OF COLUMN TOTALS)

AN ANALYSIS OF HUMAN FATALITIES FROM FLOODS IN AUSTRALIA 1900-2015 | REPORT NO. 166.2016
28
Being engaged in an activity near the water (bank) was the second highest
cause of death for men (11.8%, n=173) and the third highest for women (11.3%,
n=41) (see Table 4.7). The majority of these victims were recreating (40.0%,
n=86) (see Table 4.8).
For those attempting to cross a bridge, causeway, culvert, road, etc. the risk is
broadly split across all age ranges, although the highest number of fatalities are
seen within the 10-29 year age range (32.4%, n=255) (Table 4.9). When the
distinct age ranges are examined the data shows that although high numbers
of those in the 0-9 and 10-19 age range are attempting to cross a watercourse
the proportions engaged in this activity are smaller than for all the other age
ranges. In particular, those in the 0-9 age range are relatively evenly split, with
25.3% (n=62) attempting to cross a watercourse, and 23.7% (n=58) engaged in
an activity near the bank. In the 10-19 age range a higher proportion are
attempting to cross a watercourse. However, within this age group is the
highest proportion of those engaged in an activity in the water (17.3%, n=54).
Overall in terms of activities the highest number of fatalities engaged in
activities near the water (bank) and in or near a stormwater drain are within the
0-19 year age ranges (48.4%, n=104; 69.4%, n=34, respectively). For those
engaged in activities in the water, the majority of 67.3% (n=78) are in the 10-29
year age range. The highest proportion of those engaged in an activity not
near a usual watercourse is in the 0-9 year age range (17.7%, n=40).
Please note the percentages in the above paragraph are taken across the row
i.e within a specific age range of Table 4.9 and do not correspond to the down
column percentages reported in the table.

AN ANALYSIS OF HUMAN FATALITIES FROM FLOODS IN AUSTRALIA 1900-2015 | REPORT NO. 166.2016
29
Attempting to
cross bridge/
causeway/
crossing/
culvert/ ford/
road/
watercourse
Attempting to
cross
floodwaters
(fields, town)
Engaged in
an activity
near the
water (bank)
Engaged in
an activity
in/ near
stormwater
drain
Engaged in
an activity in
the water
(rescue,
swimming,)
Engaged in
an activity
on the
water
(boat)
Engaged in
an activity
not near
usual
watercourse
Other Unknown Total
0-9 62 (7.9%) 5 (6.5%) 58 (27.0%) 18 (36.7%) 11 (9.5%) 13 (14.0%) 40 (17.7%) 2 (33.3%) 36 (12.4%) 245 (13.2%)
10-19 121 (15.4%) 13 (16.9%) 46 (21.4%) 16 (32.7%) 54 (46.6%) 12 (12.9%) 15 (6.6%) 1 (16.7%) 34 (11.7%) 312 (16.8%)
20-29 134 (17.0%) 9 (11.7%) 20 (9.3%) 6 (12.2%) 24 (20.7%) 16 (17.2%) 16 (7.1%) 1 (16.7%) 23 (7.9%) 249 (13.4%)
30-39 96 (12.2%) 11 (14.3%) 16 (7.4%) 1 (2.0%) 13 (11.2%) 15 (16.1%) 11 (4.9%) 1 (16.7%) 24 (8.3%) 188 (10.1%)
40-49 92 (11.7%) 10 (13.0%) 19 (8.8%) 1 (2.0%) 5 (4.3%) 5 (5.4%) 15 (6.6%) 0 (0.0%) 17 (5.9%) 164 (8.8%)
50-59 77 (9.8%) 10 (13.0%) 12 (5.6%) 1 (2.0%) 4 (3.4%) 2 (2.2%) 20 (8.8%) 0 (0.0%) 14 (4.8%) 140 (7.5%)
60-69 48 (6.1%) 4 (5.2%) 12 (5.6%) 3 (6.1%) 2 (1.7%) 9 (9.7%) 16 (7.1%) 1 (16.7%) 22 (7.6%) 117 (6.3%)
70-79 37 (4.7%) 3 (3.9%) 6 (2.8%) 1 (2.%) 0 (0.0%) 2 (2.2%) 8 (3.5%) 0 (0.0%) 8 (2.8%) 65 (3.5%)
80-89 6 (0.8%) 1 (1.3%) 4 (1.9%) 0 (0.0%) 0 (0.0%) 2 (2.2%) 4 (1.8%) 0 (0.0%) 1 (0.3%) 18 (1.0%)
Unknown 114 (14.5%) 11 (14.3%) 22 (10.2%) 2 (4.1%) 3 (2.6%) 17 (18.3%) 81 (35.8%) 0 (0.0%) 111 (38.3%) 361 (19.4%)
Total 787 (100%) 77 (100%) 215 (100%) 49 (100%) 116 (100%) 93 (100%) 226 (100%) 6 (100%) 290 (100%) 1859 (100%)
TABLE 4.9: FATALITIES BY ACTIVITY AND AGE (% OF COLUMN TOTALS)

AN ANALYSIS OF HUMAN FATALITIES FROM FLOODS IN AUSTRALIA 1900-2015 | REPORT NO. 166.2016
30
When the reasons behind the actions taken prior to death are examined in detail
(Table 4.10), the highest numbers of fatalities occurred en route to a destination
(30.3%, n=564). Of these, where information was known, the greatest proportion was
on their way home (9.7%, n=181), followed by those who were en route from home
(5.5%, n=103). When this data is examined by gender, a very similar proportion of
fatalities are seen for both men and women (men 30.1%, n=443 and women 30.8%,
n=112). The second highest reason behind death for both genders is recreating
(15.1%, n=280). However, the highest proportion of these deaths is seen among
females with 19.8% (n=72) compared to 14.1% males (n=208). For men, the third
highest reason leading to flood deaths is working, attending to livestock or
livelihoods (12.3%, n=181). The third highest reason for women is evacuating
(including vertical evacuation, being rescued, awaiting a rescue and late
evacuation), which accounts for 15.4% (n=56), followed by those who were in their
homes and unaware and therefore made no attempt at evacuation (8.2%, n=30).
Male Female Unknown Total
Attempting vertical evacuation 20 (1.4%) 21 (5.8%) 0 (0.0%) 41 (2.2%)
Being rescued/ evacuated 15 (1.0%) 16 (4.4%) 0 (0.0%) 31 (1.7%)
Awaiting a planned rescue/ evacuation 4 (0.3%) 0 (0.0%) 0 (0.0%) 4 (0.2%)
Refused to be evacuated 7 (0.5%) 1 (0.3%) 0 (0.0%) 8 (0.4%)
Evacuating 24 (1.6%) 18 (4.9%) 3 (12.5%) 45 (2.4%)
Late evacuation 8 (0.5%) 1 (0.3%) 0 (0.0%) 9 (0.5%)
No attempt at evacuation as unaware 41 (2.8%) 30 (8.2%) 0 (0.0%) 71 (3.8%)
En route 227 (15.4%) 48 (13.2%) 5 (20.8%) 280 (15.1%)
En route from home 70 (4.8%) 29 (8.0%) 4 (16.7%) 103 (5.5%)
En route to home 146 (9.9%) 35 (9.6%) 0 (0.0%) 181 (9.7.%)
Recreating 208 (14.1%) 72 (19.8%) 0 (0.%) 280 (15.1%)
Carrying out repairs due to flood
damage 21 (1.4%) 0 (0.0%) 0 (0.0%) 21 (1.1%)
Collecting provisions 21 (1.4%) 2 (0.5%) 0 (0.0%) 23 (1.2%)
Attempting to retrieve flotsam 6 (0.4%) 0 (0.0%) 0 (0.0%) 6 (0.3%)
Collecting people 1 (0.1%) 2 (0.5%) 0 (0.0%) 3 (0.2%)
Rescuing people, property, pets 62 (4.2%) 6 (1.6%) 0 (0.0%) 68 (3.7%)
Working, attending to livestock or
livelihood 181 (12.3%) 9 (2.5%) 1 (4.2%) 191 (10.3%)
Other 8 (0.5%) 3 (0.8%) 0 (0.0%) 11 (0.6%)
Unknown 401 (27.3%) 71 (19.5%) 11(45.8%) 483 (26.0%)
Total 1471 (100%) 364 (100%) 24 (100%) 1859 (100%)
TABLE 4.10: FATALITIES BY REASON PRIOR TO ACTION AND GENDER (% OF COLUMN TOTALS)
When this data is explored by age ranges (Table 4.11), the highest proportions of
those in the 0-19 year age groups were recreating (32.5%, n=181), followed by those
en route to a destination (24.8%, n=138). For all other age groups the highest
proportions are recorded in the en route category.

AN ANALYSIS OF HUMAN FATALITIES FROM FLOODS IN AUSTRALIA 1900-2015 | REPORT NO. 166.2016
31
0-9 10-19 20-29 30-39 40-49 50-59 60-69 70-79 80-89 Unknown Total
Attempting vertical
evacuation 6 (2.4%) 1 (0.3%) 0 (0.0%) 1 (0.5%) 5 (3.0%) 3 (2.1%) 0 (0.0%) 1 (1.5%) 2 (11.1%) 22 (6.1%) 41 (2.2%)
Being rescued/
evacuated 14 (5.7%) 4 (1.3%) 2 (0.8%) 1 (0.5%) 2 (1.2%) 1 (0.7%) 2 (1.7%) 2 (3.1%) 1 (5.6%) 2 (0.6%) 31 (1.7%)
Awaiting a planned
rescue/ evacuation 0 (0.0%) 0 (0.0%) 1 (0.4%) 0 (0.%) 0 (0.0%) 0 (0.0%) 2 (1.7%) 0 (0.0%) 0 (0.0%) 1 (0.3%) 4 (0.2%)
Refused to be
evacuated 0 (0.0%) 0 (0.0%) 0 (0.0%) 0 (0.0%) 0 (0.0%) 3 (2.1%) 1 (0.9%) 1 (1.5%) 0 (0.0%) 3 (0.8%) 8 (0.4%)
Evacuating 8 (3.3%) 3 (0.9%) 7 (2.8%) 5 (2.7%) 2 (1.2%) 6 (4.3%) 3 (2.6%) 3 (4.6%) 0 (0.0%) 8 (2.2%) 45 (2.4%)
Late evacuation 5 (2.0%) 1 (0.3%) 1 (0.4%) 1 (0.5%) 0 (0.0%) 0 (0.0%) 1 (0.9%) 0 (0.0%) 0 (0.0%) 0 (0.0%) 9 (0.5%)
No attempt at
evacuation as unaware 18 (7.3%) 8 (2.5%) 4 (1.6%) 4 (2.1%) 5 (3.0%) 6 (4.3%) 6 (5.1%) 2 (3.1%) 1 (5.6%) 17 (4.7%) 71 (3.8%)
En route 23 (9.4%) 35 (11.2%) 46 (18.5%) 32 (17.0%) 31 (18.9%) 24 (17.1%) 23 (19.7%) 11 (16.9%) 4 (22.2%) 51 (14.1%) 280 (15.1%)
En route from home 14 (5.7%) 23 (7.4%) 14 (5.6%) 11 (5.9%) 8 (4.9%) 12 (8.6%) 2 (1.7%) 6 (9.2%) 2 (11.1%) 11 (3.0%) 103 (5.5%)
En route to home 22 (9.0%) 21 (6.7%) 28 (11.2%) 21 (11.2%) 23 (14.0%) 18 (12.9%) 17 (14.5%) 12 (18.5%) 2 (11.1%) 17 (4.7%) 181 (9.7%)
Recreating 78 (31.8%) 103 (33.0%) 39 (15.7%) 20 (10.6%) 14 (8.5%) 6 (4.3%) 9 (7.7%) 1 (1.5%) 3 (16.7%) 7 (1.9%) 280 (15.1%)
Carrying out repairs due
to flood damage etc 0 (0.0%) 3 (1.0%) 4 (1.6%) 2 (1.1%) 2 (1.2%) 2 (1.4%) 3 (2.6%) 1 (1.5%) 0 (0.0%) 4 (1.1%) 21 (1.1%)
Collecting provisions 2 (0.8%) 8 (2.5%) 4 (1.6%) 3 (1.6%) 0 (0.0%) 0 (0.0%) 1 (0.9%) 1 (1.5%) 0 (0.0%) 4 (1.1%) 23 (1.2%)
Attempting to retrieve
flotsam 2 (0.8%) 4 (1.3%) 0 (0.0%) 0 (0.0%) 0 (0.0%) 0 (0.0%) 0 (0.0%) 0 (0.0%) 0 (0.0%) 0 (0.0%) 6 (0.3%)
Collecting people 1 (0.4%) 0 (0.0%) 0 (0.0%) 1 (0.5%) 1 (0.6%) 0 (0.0%) 0 (0.0%) 0 (0.0%) 0 (0.0%) 0 (0.0%) 3 (0.2%)
Rescuing People,
Property Livestock 2 (0.8%) 15 (4.8%) 11 (4.4%) 11 (5.9%) 9 (5.5%) 5 (3.6%) 4 (3.4%) 1 (1.5%) 1 (5.6%) 9 (2.5%) 68 (3.7%)
Working, attending
livestock or livelihood 0 (0.0%) 23 (7.4%) 47 (18.9%) 26 (13.8%) 23 (14.0%) 26 (18.6%) 9 (7.7%) 7 (10.8%) 1 (5.6%) 29 (8.0%) 191 (10.3%)
Other 1 (0.4%) 3 (1.0%) 0 (0.0%) 3 (1.6%) 1 (0.6%) 0 (0.0%) 0 (0.0%) 0 (0.0%) 0 (0.0%) 3 (0.8%) 11 (0.6%)
Unknown 49 (20.0%) 57 (18.3%) 41 (16.5%) 46 (24.5%) 38 (23.2%) 28 (20.0%) 34 (29.1%) 16 (24.6%) 1 (5.6%) 174 (47.9%) 484 (26.0%)
Total 245 (100%) 312 (100%) 249 (100%) 188 (100%) 164 (100%) 140 (100%) 117 (100%) 65 (100%) 18 (100%) 361 (100%) 1859 (100%)
TABLE 4.11: FATALITIES BY REASON BEHIND ACTION AND AGE (% OF COLUMN TOTALS)

AN ANALYSIS OF HUMAN FATALITIES FROM FLOODS IN AUSTRALIA 1900-2015 | REPORT NO. 166.2016
32
CAPACITY AND AWARENESS
In terms of capacity and awareness (Table 4.12), the majority of fatalities (53.6%)
were considered to be capable of independent action (n=997) and, of these, 59.5%
(n=593) of victims were aware of the flood but the depth and/ or speed of the water
took them by surprise. For capacity, the second highest proportion were those
following the decision making of others (such as children or passengers in a car)
(15.7%, n=292), followed by a child or group of children on their own who are under
the age of 11 (9.3%, n=173).
When the age ranges (Table 4.13) of those following the decision making of others
are examined, 37.0% (n=108) are in the 0-9 category and 21.2% (n=62) are in the 10-
19 category (percentages here run across the row). The breakdown of capacity by
gender (Table 4.14) shows that the majority of male victims (59.5%, n= 875) were
capable of independent action, a far higher proportion than for any of the other
categories. In comparison, the highest proportion of female victims were following
the decision making of others (36.3%, n=132), although this is followed closely by
females who were capable of independent action (32.7%, n=119). In terms of
children who were on their own or in a group of children, 69.4% were male (n=120)
and 28.9% were female (n=50).
Aware but
did not
expect to
encounter
the flood
Aware but
depth and
or speed
took them
by surprise
Unaware
and taken
by surprise
N/A – child
< 11
N/A –
other Unknown Total
Capable of independent
action 158 (66.4%) 593 (73.2%) 148 (60.4%) 2 (0.7%) 10 (58.8%) 86 (33.0%) 997 (53.6%)
Physically and or mentally
disabled or incapable 3(1.3%) 13 (1.6%) 4 (1.6%) 1 (0.3%) 3 (17.6%) 4 (1.5%) 28 (1.5%)
Cannot swim 14 (5.9%) 27 (3.3%) 7 (2.9%) 1 (0.3%) 2 (11.8%) 2 (0.8%) 53 (2.9%)
Influenced by drugs or
alcohol 9 (3.8%) 49 (6.0%) 20 (8.2%) 0 (0.0%) 0 (0.0%) 7 (2.7%) 85 (4.6%)
Following the decision
making of others 39 (16.4%) 81 (10.0%) 39 (15.9%) 126 (43.8%) 2 (11.8%) 5 (1.9%) 292 (15.7%)
A child or group of
children on their own < 11
years old
6 (2.5%) 6 (0.7%) 1 (0.4%) 156 (54.2%) 0 (0.0%) 4 (1.5%) 173 (9.3%)
Unfamiliar with the area 1 (0.4%) 13 (1.6%) 11 (4.5%) 0 (0.0%) 0 (0.0%) 1 (0.4%) 26 (1.4%)
Encumbered with
clothing, possessions or
equipment
2 (0.8%) 11 (1.4%) 2 (0.8%) 0 (0.0%) 0 (0.0%) 0 (0.0%) 15 (0.8%)
Looking after dependents 0 (0.0%) 5 (0.6%) 3 (1.2%) 0 (0.0%) 0 (0.0%) 0 (0.0%) 8 (0.4%)
N/A 0 (0.0%) 0 (0.0%) 3 (1.2%) 0 (0.0%) 0 (0.0%) 0 (0.0%) 3 (0.2%)
Unknown 6 (2.5%) 12 (1.5%) 7 (2.9%) 2 (0.7%) 0 (0.0%) 152 (58.2%) 179(9.6%)
Total 238 (100%) 810 (100%) 245 (100%) 288 (100%) 17 (100%) 261(100%) 1859 (100%)
TABLE 4.12: FATALITIES BY CAPACITY AND AWARENESS (% OF COLUMN TOTALS)

AN ANALYSIS OF HUMAN FATALITIES FROM FLOODS IN AUSTRALIA 1900-2015 | REPORT NO. 166.2016
33
0-9 10-19 20-29 30-39 40-49 50-59 60-69 70-79 80-89 Unknown Total
Capable of independent action 0 (0.0%) 165 (52.9%) 170 (68.3%) 123 (65.4%) 118 (72.0%) 93 (66.4%) 74 (63.2%) 38 (58.5%) 7 (38.9%) 209 (57.9%) 997 (53.6%)
Physically and or mentally disabled or
incapable 0 (0.0%) 2 (0.6%) 0 (0.0%) 4 (2.1%) 4 (2.4%) 4 (2.9%) 6 (5.1%) 4 (6.2%) 2 (11.1%) 2 (0.6%) 28 (1.5%)
Cannot swim 0 (0.0%) 16 (5.1%) 14 (5.6%) 7 (3.7%) 3 (1.8%) 5 (3.6%) 1 (0.9%) 1 (1.5%) 0 (0.0%) 6 (1.7%) 53 (2.9%)
Influenced by drugs or alcohol 0 (0.0%) 7 (2.2%) 11 (4.4%) 15 (8.%) 13 (7.9%) 14 (10.%) 11 (9.4%) 8 (12.3%) 3 (16.7%) 3 (0.8%) 85 (4.6%)
Following the decision making of others 108 (44.1%) 62 (19.9%) 35 (14.1%) 16 (8.5%) 7 (4.3%) 11 (7.9%) 5 (4.3%) 5 (7.7%) 2 (11.1%) 41 (11.4%) 292 (15.7%)
A child or group of children on their
own < 11 years old 135 (55.1%) 33 (10.6%) 0 (0.0%) 0 (0.0%) 0 ( 0.0%) 0 (0.0%) 0 (0.0%) 0 (0.0%) 0 (0.0%) 5 (1.4%) 173 (9.3%)
Unfamiliar with the area 0 (0.0%) 7 (2.2%) 4 (1.6%) 2 (1.1%) 3 (1.8%) 2 (1.4%) 1 (0.9%) 0 (0.0%) 0 (0.0%) 7 (1.9%) 26 (1.4%)
N/A 0 (0.0%) 0 (0.0%) 0 (0.0%) 0 (0.0%) 0 (0.0%) 1 (0.7%) 1 (0.9%) 0 (0.0%) 0 (0.0%) 1 (0.3%) 3 (0.2%)
Encumbered with clothing, possessions
or equipment 0 (0.0%) 3 (1.0%) 2 (0.8%) 2 (1.1%) 3 (1.8%) 1 (0.7%) 1 (0.9%) 0 (0.0%) 0 (0.0%) 3 (0.8%) 15 (0.8%)
Looking after dependents 0 (0.0%) 2 (0.6%) 2 (0.8%) 1 (0.5%) 2 (1.2%) 0 (0.0%) 0 (0.0%) 0 (0.0%) 0 (0.0%) 1 (0.3%) 8 (0.4%)
Unknown 2 (0.8%) 15 (4.8%) 11 (4.4%) 18 (9.6%) 11 (6.7%) 9 (6.4%) 17 (14.5%) 9 (13.8%) 4 (22.2%) 83 (23.0%) 179 (9.6%)
Total 245 (100%) 312 (100%) 249 (100%) 188 (10.1%) 164 (100%) 140 7.5%) 117 (100%) 65 (3.5%) 18 (100%) 361 (100%) 1859 (100%)
TABLE 4.13: FATALITIES BY CAPACITY AND AGE RANGE (% OF COLUMN TOTALS)

AN ANALYSIS OF HUMAN FATALITIES FROM FLOODS IN AUSTRALIA 1900-2015 | REPORT NO. 166.2016
34
Male Female Unknown Total
Capable of independent action 875 (59.5%) 119 (32.7%) 3 (12.5%) 997 (53.6%)
Physically and or mentally disabled or
incapable 24 (1.6%) 4 (1.1%) 0 (0.0%) 28 (1.5%)
Cannot swim 47 (3.2%) 6 (1.6%) 0 (0.0%) 53 (2.9%)
Influenced by drugs or alcohol 64 (4.4%) 20 (5.5%) 1 (4.2%) 85 (4.6%)
Following the decision making of
others 150 (10.2%) 136 (36.3%) 10 (41.7%) 292 (15.7%)
A child or group of children on their
own < 11 years old 120 (8.2%) 50 (13.7%) 3 (12.5%) 173 (9.3%)
Unfamiliar with the area 20 (1.4%) 6 (1.6%) 0 (0.0%) 26 (1.4%)
N/A 3 (0.2%) 0 (0.0%) 0 (0.0%) 3 (0.2%)
Encumbered with clothing, possessions
or equipment 13 (0.9%) 1 (0.3%) 1 (4.2%) 15 (0.8%)
Looking after dependents 6 (0.4%) 2 (0.5%) 0 (0.0%) 8 (0.4%)
Unknown 149 (10.1%) 24 (6.6%) 6 (25.0%) 179 (9.6%)
Total 1471 (100%) 364 (100%) 24 (100%) 1859 (100%)
TABLE 4.14: FATALITIES BY CAPACITY AND GENDER (% OF COLUMN TOTALS)
An analysis of the time of day and whether the fatality occurred during daylight or
darkness (Table 4.15) demonstrates that the highest proportion of the fatalities,
36.6%, occurred in daylight (n=681) compared to 23.7% (n=440) that occurred during
twilight or darkness. Of those who have been classified as aware of the flood but
depth and/ or speed of the floodwaters took them by surprise (43.6%, n=810), almost
a quarter (24.2%, n=196) perished in the dark or twilight, compared to 38.5% (n=312)
who perished in the daylight.
Dark Daylight Unknown Total
Aware but did not expect to encounter the flood 71 (16.1%) 87 (12.8%) 80 (10.8%) 238 (12.8%)
Aware but depth and or speed took them by
surprise 196 (44.5%) 312 (45.8%) 302 (40.9%) 810 (43.6%)
Unaware and taken by surprise 73 (16.6%) 97 (14.2%) 75 (10.2%) 245 (13.2%)
N/A – child < 11 years old 59 (13.4%) 143 (21.0%) 86 (11.7%) 288 (15.5%)
N/A – other 4 (0.9%) 4 (0.6%) 9 (1.2%) 17 (0.9%)
Unknown 37 (8.4%) 38 (5.6%) 186 (25.2%) 261 (14.0%)
Total 440 (100%) 681 (100%) 738 (100%) 1859 (100%)
TABLE 4.15: FATALITIES BY AWARENESS AND TIME OF DAY (% OF COLUMN TOTALS)
In terms of transport, the highest proportions were on foot (25.9%, n=482) and in a
vehicle/ 4WD/ horse drawn vehicle (24.4%, n=462), followed by those who were on a
horse (10.5%, n=195). The detailed breakdown by vehicle type has:
219 in or exiting a sedan car
107 in or exiting a horse drawn vehicle
45 in or exiting a 4WD
26 in or exiting a truck
8 in or exiting a ute
13 in a train
Furthermore, 8 were on a pushbike, 8 on a flying-fox, and 17 on other forms of
transport (e.g. motorbike). In 19 cases the vehicle type was unknown.

AN ANALYSIS OF HUMAN FATALITIES FROM FLOODS IN AUSTRALIA 1900-2015 | REPORT NO. 166.2016
35
When transport is examined over time (Table 4.16), a decrease in fatalities on foot,
horses and horse drawn vehicles is seen and an increase of those in motorised
vehicles. In particular, fatalities associated with 4WD vehicles have dramatically
increased over the last 15 years.
Of those who were in a vehicle (all types), 49.4% (n=228) were coded as capable of
independent action as they were the drivers, while 34.4% (n=159) were coded as
following the decision making of others as they were passengers (Table 4.17). These
numbers do not include all those in vehicles as it is unknown for some cases if they
were drivers or passengers. A total of 4.6% of victims (n=85) were influenced by drugs
and alcohol. Of these, 35.3% (n=30) were on foot, 38.8% (n=33) were driving in a
vehicle; 75.3% (n=64) were male. Of all those who were in or driving a 4WD, 26.7%
(n=12) were influenced by drugs or alcohol, accounting for a high portion of the
recent vehicle related deaths. Drugs include, in this analysis, recreational and/ or
above-normal doses of prescription.
When horse drawn vehicles are removed we see, in terms of gender, n=237 males
(70.5% of all fatalities) and n=97 females (28.9% of all fatalities) were killed in a
vehicle. In 2 cases the gender was unknown. Where data is available, of those who
were driving a vehicle, 85.3% were men (n=122) and 14.7% were females (n=21). Of
those who were passengers, 52.6% were males (n=71) and 45.9% were females
(n=62). Of these fatalities 25.3% were in the 0-19 age range, the majority of whom
were passengers.
In terms of the time of day, (when known) we see, the highest proportions of those
on foot perished during daylight hours (daylight = 47.3%, n=228; darkness = 21.6%,
n=104). In comparison, where time of fatality is known, the highest proportion of
those in a vehicle (with horse drawn vehicles removed) perished at night or during
twilight (daylight = 24.4%, n=82; darkness = 44.6%, n=150).
A more detailed analysis of those who were killed associated with vehicles is
provided in the Appendix.

AN ANALYSIS OF HUMAN FATALITIES FROM FLOODS IN AUSTRALIA 1900-2015 | REPORT NO. 166.2016
36
TABLE 4.16: MODE OF TRANSPORT COMPARED AGAINST DECADE (% OF COLUMN TOTALS)
1900-
1909
1910-
1919
1920-
1929
1930-
1939
1940-
1949
1950-
1959
1960-
1969
1970-
1979
1980-
1989
1990-
1999
2000-
2009
2010-
2015 Total
On foot 36 (23.2%) 46 (16.2%) 80 (29.5%) 62 (30.1%) 36 (23.5%) 85 (34.8%) 260 (35.1%) 29 (21.2%) 18 (26.5%) 19 (21.3%) 29 (32.6%) 16 (18.0%) 482 (25.9%)
Swimming (boogie
board etc) 5 (3.2%) 27 (9.5%) 29 (10.7%) 22 (10.7%) 10(6.5%) 10 (4.1%) 4 (5.4%) 13 (9.5%) 2 (2.9%) 11 (12.4%) 8 (9.0%) 14 (15.7%) 155 (8.3%)
Carried by others 0 (0.0%) 1 (0.4%) 1 (0.4%) 3 (1.5%) 1(0.7%) 4 (1.6%) 0 (0.0%) 0 (0.0%) 0 (0.0%) 0 (0.0%) 0 (0.0%) 0 (0.0%) 10 (0.5%)
On horse 31 (20.0%) 36 (12.7%) 46 (17.0%) 38 (18.4%) 15(9.8%) 20 (8.2%) 3 (4.1%) 4 (2.9%) 1 (1.5%) 0 (0.0%) 1 (1.1%) 0 (0.0%) 195 (10.5%)
On vehicle: push
bike 0 (0.0%) 1 (0.4%) 0 (0.0%) 2 (1.0%) 3(2.0%) 1 (0.4%) 0 (0.0%) 0 (0.0%) 0 (0.0%) 0 (0.0%) 1 (1.1%) 0 (0.0%) 8 (0.4%)
On boat 10 (6.5%) 8 (2.8%) 16 (5.9%) 21 (10.2%) 22(14.4%) 25 (10.2%) 2 (2.7%) 11(8.0%) 2 (2.9%) 14 (15.7%) 3 (3.4%) 3 (3.4%) 137 (7.4%)
On rope/ cable/
flying fox 0 (0.0%) 1 (0.4%) 2 (0.7%) 2 (1.0%) 1(0.7%) 2 (0.8%) 0 (0.0%) 0 (0.0%) 0 (0.0%) 0 (0.0%) 0 (0.0%) 0 (0.0%) 8 (0.4%)
4WD 0 (0.0%) 0 (0.0%) 0 (0.0%) 0 (0.0%) 0 (0.0%) 1 (0.4%) 2 (2.7%) 0 (0.0%) 6 (8.8%) 3 (3.4%) 17 (19.1%) 16 (18.0%) 45 (2.4%)
Vehicle 0 (0.0%) 16 (5.6%) 12 (4.5%) 27 (13.1%) 20 (13.1%) 45 (18.4%) 34 (45.9%) 53 (38.7%) 19 (28.0%) 23 (25.8%) 26 (29.2%) 27 (30.3%) 302 (16.2%)
Horse drawn
vehicle 5 (3.2%) 46 (16.2%) 30 (11.0%) 8 (3.9%) 9 (5.9%) 7 (2.9%) 0 (0.0%) 0 (0.0%) 2 (2.9%) 0 (0.0%) 0 (0.0%) 0 (0.0%) 107 (5.8%)
Other transport 0 (0.0%) 0 (0.0%) 0 (0.0%) 0 (0.0%) 0 (0.0%) 0 (0.0%) 0 (0.0%) 3 (2.2%) 0 (0.0%) 0 (0.0%) 0 (0.0%) 0 (0.0%) 3 (0.2%)
Unknown 64 (41.3%) 55 (19.4%) 29 (10.7%) 18 (8.7%) 27 (17.6%) 24 (9.8%) 3 (4.1%) 15 (10.9%) 11 (16.2%) 15 (16.9%) 4 (4.5%) 0 (0.0%) 265 (14.3%)
N/A – in house /
caravan 4 (2.6%) 46 (16.2%) 26 (9.6%) 3 (1.5%) 9 (5.9%) 20 (8.2%) 0 (0.0%) 9 (6.6%) 2 (2.9%) 4 (4.5%) 0 (0.0%) 13 (14.6%) 136 (7.3%)
N/A other 0 (0.0%) 1 (0.4%) 0 (0.0%) 0 (0.0%) 0 (0.%) 0 (0.0%) 0 (0.0%) 0 (0.0%) 5 (7.4%) 0 (0.0%) 0 (0.0%) 0 (0.0%) 6 (0.3%)
Total 155 (100%) 284(100%) 271(100%) 206(100%) 153 (100%) 244 (100%) 74 (100%) 137 (100%) 68 (100%) 89 (100%) 89 (100%) 89 (100%) 1859 (100%)

AN ANALYSIS OF HUMAN FATALITIES FROM FLOODS IN AUSTRALIA 1900-2015 | REPORT NO. 166.2016
37
Capable of
independent
action
Physically
and or
mentally
disabled or
incapable
Cannot
swim
Influenced
by drugs
or alcohol
Following the
decision
making of
others
A child or
group of
children on
their own <
11 years old
Unfamiliar
with the area
N/A Encumbered
with clothing,
possessions
or equipment
Looking
after
dependents
Unknown Total
On foot 239 (24.0%) 15 (53.6%) 15 (28.3%) 30 (35.3%) 27 (9.2%) 123 (71.1%) 8 (30.8%) 0 (0.0%) 4 (26.7%) 1 (12.5%) 20 (11.2%) 482 (25.9%)
Swimming (boogie board etc)
103 (10.3%) 0 (0.0%) 10 (18.9%) 10 (11.8%) 1 (0.3%) 21 (12.1%) 6 (23.1%) 0 (0.0%) 2 (13.3%) 0 (0.0%) 2 (1.1%) 155 (8.3%)
Carried by others 0 (0.0%) 0 (0.0%) 0 (0.0%) 0 (0.%) 8 (2.7%) 2 (1.2%) 0 (0.0%) 0 (0.0%) 0 (0.0%) 0 (0.0%) 0 (0.0%) 10 (0.5%)
On horse 154 (15.4%) 2 (7.1%) 16 (30.2%) 1 (1.2%) 5 (1.7%) 1 (0.6%) 2 (7.7%) 0 (0.0%) 5 (33.3%) 1 (12.5%) 8 (4.5%) 195 (10.5%)
On vehicle: push bike 6 (0.6%) 0 (0.0%) 0 (0.0%) 1(1.2%) 0 (0.0%) 1 (0.6%) 0 (0.0%) 0 (0.0%) 0 (0.0%) 0 (0.0%) 0 (0.0%) 8 (0.4%)
On boat 79 (7.9%) 1 (3.6%) 6 (11.3%) 4 (4.7%) 36 (12.3%) 1 (0.6%) 1 (3.8%) 0 (0.0%) 2 (13.3%) 1 (12.5%) 6 (3.3%) 137 (7.4%)
On rope/ cable/ flying fox
6 (0.6%) 0 (0.0%) 0 (0.0%) 0 (0.0%) 2 (0.7%) 0 (0.0%) 0 (0.0%) 0 (0.0%) 0 (0.0%) 0 (0.0%) 0 (0.0%) 8 (0.4%)
N/A – in house / caravan
59 (5.9%) 3 (10.7%) 0 (0.%) 5 (5.9%) 40 (13.7%) 2 (1.2%) 4 (15.4%) 0 (0.0%) 1 (6.7%) 4 (50.0%) 18 (10.1%) 136 (7.3%)
N/A other 5 (0.5%) 0 (0.0%) 0 (0.0%) 0 (0.%) 0 (0.0%) 0 (0.0%) 0 (0.0%) 0 (0.0%) 0 (0.0%) 0 (0.0%) 1 (0.6%) 6 (0.3%)
Other transport 3 (0.3%) 0 (0.0%) 0 (0.0%) 0 (0.%) 0 (0.0%) 0 (0.0%) 0 (0.0%) 0 (0.0%) 0 (0.0%) 0 (0.0%) 0 (0.0%) 3 (0.2%)
Unknown 121(12.1%) 0(0.0%) 1(1.9%) 1 (1.2%) 14 (4.8%) 20 (11.6%) 3 (11.5%) 0 (0.0%) 1 (6.7%) 0 (0.0%) 104(58.1%) 265 (14.3%)
4WD 13 (1.3%) 1 (3.6%) 0 (0.0%) 12 (14.1%) 16 (5.4%) 0 (0.0%) 0 (0.0%) 0 (0.0%) 0 (0.0%) 1 (12.5%) 2 (1.1%) 45 (2.4%)
Vehicle (including horse drawn)
209 (21.0%) 6 (21.4%) 5 (9.4%) 21 (24.7%) 143 (48.9%) 2 (1.2%) 2 (7.7%) 3 (100.0%) 0 (0.0%) 0 (0.0%) 18 (10.1%) 409 (22.0%)
Total 997 (100%) 28 (100%) 53 (100%) 85 (100%) 292 (100%) 173 (100%) 26 (100%) 3 (100%) 15 (100%) 8 (100%) 179 (100%) 1859 (100%)
TABLE 4.17: MODE OF TRANSPORT COMPARED AGAINST CAPACITY (% OF COLUMN TOTALS)

AN ANALYSIS OF HUMAN FATALITIES FROM FLOODS IN AUSTRALIA 1900-2015 | REPORT NO. 166.2016
38
FATALITIES BY CATCHMENT
In total, 457 deaths occurred in five catchments across the nation. The top two
catchments in terms of the greatest number of fatalities are both in
Queensland: the Fitzroy River Basin (28.0% of the fatalities in these top 5
catchments, n=125) and Brisbane River (23.5% of the fatalities in these top 5
catchments, n=105). The remaining three of the top five are located in NSW:
Murrumbidgee River (16.6%, n=78), Hunter River (17.4%, n=74) and Georges
River (14.5%, n=65). These top five catchments in terms of fatalities capture only
24.6% of all deaths, demonstrating that there is a large spread of fatalities
across river catchments – the top ten catchments with the greatest number of
fatalities captures only 616 fatalities, 33.1% of all deaths due to flooding.
The Fitzroy River Basin, with its headwaters in the Carnavon Ranges in Central
Queensland and encompassing the city of Rockhampton along with six major
river systems in an area 142,665 km2, is the largest river basin flowing out along
the east coast of Australia (FBA, 2013). The Brisbane River catchment, beginning
in the Brisbane Ranges about 140 km from the city of Brisbane, drains
approximately 13,500 km2 (Centre for the Government of Queensland, 2015).
The Hunter River catchment, with an area of about 21,500 km2, lies
approximately 100 km north of Sydney and encompasses Newcastle, the
second largest city in NSW (Department of Primary Industries, no date). The
Murrumbidgee River catchment in southern NSW covers an area of
approximately 84,000 km2 and includes Canberra and NSW’s largest inland city,
Wagga Wagga (Department of Primary Industries, no date). The Georges River
catchment is the smallest in the group of five, covering an area of 1,890 km2
and including Australia’s largest city, Sydney (Department of Primary Industries,
no date).
As expected, the greatest proportion of fatalities corresponds to large events
(see Section 4.6). The Fitzroy River catchment experienced 50.4% (n=63) of its
fatalities in 1910-1919, the Brisbane River catchment had 23.8% of its fatalities
(n=25) in 2010-2015, and the Hunter (41.9%, n=31), Murrumbidgee (23.1%, n=18)
and Georges River (18.5%, n=12) catchments’ greatest human losses all fell in
the decade from 1950-1959.
The greatest proportion of fatalities in the Fitzroy River catchment occurred
while the deceased were engaged in an activity not near a usual watercourse
(48.8%, n=61) (Table 4.18), whereas the greatest proportion of fatalities in each
of the other four catchments occurred while the deceased were attempting to
cross a bridge, causeway, culvert, road, etc. (Brisbane River: 28.6%, n=30;
Hunter River: 40.5%, n=30; Murrumbidgee River: 46.2%, n=36; Georges River:
33.8%, n=22).

AN ANALYSIS OF HUMAN FATALITIES FROM FLOODS IN AUSTRALIA 1900-2015 | REPORT NO. 166.2016
39
Brisbane
River
Fitzroy
River
Hunter
River
Murrumbidgee
River
Georges
River Total
Attempting to cross bridge/
causeway/ crossing/ culvert/ ford/
road/ watercourse
30 (28.6%) 28 (22.4%) 30 (40.5%) 36 (46.2%) 22 (33.8%) 146 (32.7%)
Attempting to cross floodwaters 10 (9.5%) 5 (4.0%) 1 (1.4%) 0 (0.0%) 2 (3.1%) 18 (4.%)
Engaged in an activity near the water
(bank/ bridge) 12 (11.4%) 5 (4.0%) 11 (14.9%) 26 (33.3%) 7 (10.8%) 61 (13.6%)
Engaged in an activity in/ near
stormwater drain 4 (3.8%) 0 (0.0%) 4 (5.4%) 1 (1.3%) 14 (21.5%) 23 (5.1%)
Engaged in an activity in the water
(rescue, swimming, joyride etc) 16 (15.2%) 2 (1.6%) 4 (5.4%) 3 (3.8%) 7 (10.8%) 32 (7.2%)
Engaged in an activity on the water
(boat) 4 (3.8%) 5 (4.%) 8 (10.8%) 4 (5.1%) 2 (3.1%) 23 (5.1%)
Engaged in an activity not near usual
watercourse 19 (18.1%) 61 (48.8%) 9 (12.2%) 2 (2.6%) 2 (3.1%) 93 (20.8%)
other 0 (0.0%) 0 (0.0%) 0 (0.0%) 0 (0.0%) 1 (1.5%) 1 (0.2%)
unknown 10 (9.5%) 19 (15.2%) 7 (9.5%) 6 (7.7%) 8 (12.3%) 50 (11.2%)
Total 105 (100%) 125 (100%) 74 (100%) 78 (100%) 65 (100%) 447 (100%)
TABLE 4.18: FATALITIES BY RIVER BASIN AND ACTIVITY PRIOR TO DEATH (% OF COLUMN TOTALS)
As expected, the greatest proportion of males and females perished in
floodwaters in the Fitzroy River catchment (males: 26.1%, n=89; females: 33.3%,
n=35) (Table 4.19). It is interesting to note that a much higher proportion of
males died in flooding in the Murrumbidgee catchment (males: 20.8%, n=71;
females: 6.7%, n=7), while a higher proportion of females perished in the
Georges (males: 13.2%, n=45; females: 19.0%, n=20) and Hunter River
catchments (males: 16%, n=55; females: 18%, n=19), as well as the Fitzroy River
catchment, as noted above.
Male Female Unknown Total
Brisbane River 81 (23.8%) 24 (22.9%) 0 (0.0%) 105 (23.5%)
Fitzroy River 89 (26.1%) 35 (33.3%) 1 (100.0%) 125 (28.0%)
Hunter River 55 (16.1%) 19 (18.1%) 0 (0.0%) 74 (16.6%)
Murrumbidgee River 71 (20.8%) 7 (6.7%) 0 (0.0%) 78 (17.4%)
Georges River 45 (13.2%) 20 (19.0%) 0 (0.0%) 65 (14.5%)
Total 341 (1003%) 105 (100%) 1 (100%) 447 (100%)
TABLE 4.19: FATALITIES BY RIVER BASIN AND GENDER (% OF COLUMN TOTALS)
FATALITIES ASSOCIATED WITH FLOOD TYPE AND FLOOD SEVERITY
Most fatalities (71.3%, n=1325) occurred close to the coast, either on short
coastal rivers (54.1%, n=1005) associated with heavy rainfall within a small
catchment, causing a short duration rapid flood or flash flood event, or longer
coastal rivers (17.2%, n=320), where floodwater rose rapidly over a longer
period (up to 4 days). A further 295 (15.9%) deaths occurred along inland rivers,
where extensive but slow moving flooding was caused by widespread rainfall.
Other fatalities occurred in an urban setting in a local flash flood or low-level
short duration flood (7.6%, n=142), on normally dry inland rivers that
experienced sudden runoff (3.7%, n=68), and from dam failure (0.9%, n=16). The
flood type of 13 fatalities (0.7%) is unknown.

AN ANALYSIS OF HUMAN FATALITIES FROM FLOODS IN AUSTRALIA 1900-2015 | REPORT NO. 166.2016
40
The greatest percentage (36.6%, n=52 of a total of 142) of women died in urban
settings in relation to a local flash flood or low-level short duration flood. The
next highest (21.3%, n=214 of a total of 1005) were associated with short coastal
rivers, longer coastal rivers (15.6%, n=50 of a total of 320) and inland rivers
(12.2%, n=36 of a total of 295). As expected, the highest number of people
killed per event correlate with the more severe floods (Table 4.20).
Events Where N
Persons Died
Minor/
moderate flood Major flood
Severe/
Record flood Unknown Total
1 68 (11.1%) 20 (8.2%) 33 (7.8%) 40 (6.8%) 161 (8.7%)
2 26 (8.5%) 14 (11.5%) 10 (4.7%) 17 (5.8%) 67 (7.2%)
3 18 (8.9%) 9 (11.1%) 11 (7.8%) 17 (8.7%) 55 (8.9%)
4 11(7.2%) 9 (14.8%) 3 (2.8%) 8 (5.5%) 31 (6.7%)
5 12 (9.9%) 5 (10.2%) 5 (5.9%) 5 (4.3%) 27 (7.3%)
6 8 (7.9%) 3 (7.4%) 6 (8.5%) 8 (8.22%) 25 (8.1%)
7 4 (4.6%) 0 (0.0%) 3 (5.0%) 1 (1.2%) 8 (3.0%)
8 2 (2.6%) 2 (6.6%) 2 (3.8%) 6 (8.2%) 12 (5.2%)
9 1 (1.5%) 2 (6.6%) 1 (2.1%) 2 (3.1%) 6 (2.9%)
10 1 (8.2%) 0 (0.0%) 0 (0.0%) 2 (3.4%) 3 (1.6%)
11 2 (3.6%) 2 (9.0%) 1 (2.6%) 1 (1.9%) 6 (3.6%)
12 0 (0.0%) 0 (0.0%) 0 (0.0%) 3 (6.2%) 3 (1.9%)
13 1 (0.2%) 0 (0.%) 1 (3.1%) 1 (2.2%) 3 (2.1%)
14 0 (0.0%) 0 (0.0%) 2 (6.6%) 0 (0.0%) 2 (1.5%)
15 0 (0.0%) 0 (0.0%) 0 (0.0%) 1 (2.6%) 1 (0.8%)
16 1 (0.2%) 1 (6.6%) 0 (0.0%) 1 (2.7%) 3 (2.6%)
17 2 (5.6%) 0 (0.0%) 0 (0.0%) 1 (2.9%) 3 (2.7%)
18 0 (0.0%) 1 (7,.4%) 0 (0.0%) 0 (0.0%) 1 (1.0%)
19 0 (0.0%) 0 (0.0%) 3 (25.6%) 1 (3.3%) 4 (4.1%)
20 or more 4 (15.6%) 0 (0.0%) 0 (0.0%) 5 (22.9%) 9 (12.3%)
Total number of
fatalities 609 (100%) 244 (100%) 422 (100%) 584 (100%) 1859 100%)
TABLE 4.20: NUMBER OF EVENTS IN WHICH A GIVEN NUMBER OF FATALITIES OCCURRED, BY FLOOD SEVERITY (% OF TOTAL FATALITIES IN EACH
SEVERITY CATEGORY)
CLUSTERS OF 20 OR MORE FATALITIES
The dataset was interrogated for clusters of fatalities relating to the same peril
type, within the same geographic region and time period. All up, seven
particular cases of flooding were identified where 20 or more fatalities
occurred. These are described in detail below.
December 1916
The central Queensland town of Clermont was a 19th century gold mining town
situated between a lagoon and Sandy Creek in the Fitzroy River catchment.
Torrential rain associated with a tropical cyclone impacted the region, causing
the banks of the Wolfgang and Sandy Creek to fail resulting in a wall of water

AN ANALYSIS OF HUMAN FATALITIES FROM FLOODS IN AUSTRALIA 1900-2015 | REPORT NO. 166.2016
41
~4.5 metres high rushing through the main street without warning (Coates,
2012).
The 1916 event was the worst in terms of the number of lives lost in the 1900–
2015 dataset, with a reported total of at least 65 fatalities (ABC, 2011). The age
of most (69.3%, n=43) of the 62 recorded fatalities is unknown. Of those
recorded, 61.3% (n=38) were male and 38.7% (n=24) were female. The greatest
proportion of people (41.9%, n=26) drowned while attempting vertical
evacuation. Several bodies were never found. More than 50 buildings and the
railway line were also destroyed in this event (Coates, 2012).
In order to prevent a similar tragedy from happening again, the remaining
Clermont residents took a radical approach and relocated the town to higher
ground (Text box 4.1) with a steam tractor engine. Colloquially, Clermont
became known as the “The Shifting Town” (ABC, 2011). Relocation due to flood
risk had only occurred once before in Australia, when the township of
Gundagai was relocated from between two rivers to higher ground after some
35.6% (n=89) of the 250 population drowned in the floods of 1852.
“Clermont, our neighbour up the road had an awful flood…, and of course in those days it actually took about three weeks for the authorities to even find out that they were flooded. I’m only here because my great-grandfather had an orchard [near Clermont] and he sold that a week before the flood happened, and moved the family into a pub that he’d bought in Clermont. The family that bought the orchard and farm off them all died, they were all drowned in their beds, and that’s Theresa and Sandy Creek when they flood, they come up so silent and so fast. There was a lot of life lost...my grandparent’s pub was the only one that didn’t flood so everyone was staying there, and they basically had to ban the sale of alcohol until they had dealt with all the dead bodies and the dead animals, as well. When you drive to Clermont you can still see, there’s an ornamental piano up a tree. It was stuck there after that great flood, and they’ve left it there every since and replaced it over the years, that’s what that’s showing is the height of that flood. They then relocated the entire town to higher ground, and there’s a wonderful book...of photographs from when that town was relocated. They literally did it with horse teams and huge big logs, and there’s classic photo of...the boarding houses all being moved...they moved and restumped the entire town.”
TEXT BOX 4.1: LOCAL RESIDENTS’ RECOLLECTION OF THE GREAT FLOOD THAT LED TO THE RELOCATION OF CLERMONT (EXERT FROM BIRD ET AL. 2013;
P.71).
February 1927
Floods occurred in rivers from Cairns through to Toowoomba due to a large rain
depression after Tropical Cyclone Willis crossed the Queensland Coast north of
Cairns in February 1927. An unprecedented flood on the Herbert River, lying
adjacent to the township of Ingham, washed away more than 12 houses and
businesses and caused much damage to rural industries and many railway
washouts. There was an estimated £300,000 (£1927) worth of damage in the
Herbert River district alone.
Of the 37 recorded fatalities that were identified as being associated with these
floods, 29.7% (n=11) were aged between 0-9 years, 48.6% (n=18) were following
the decision making of others, and most were males (59.5%, n=22).

AN ANALYSIS OF HUMAN FATALITIES FROM FLOODS IN AUSTRALIA 1900-2015 | REPORT NO. 166.2016
42
A monument at the Old Ingham Cemetery commemorates the 13 people of
Italian origin who drowned in the flood (Monument Australia, no date). There
was also extensive loss of livestock with 2,500 cattle and 1,500 horses drowned
in Ingham (BoM, 2010).
April 1929
The north and northwest region of Tasmania was impacted by gale force winds
and considerable rainfall in early April 1929, causing serious flooding in many
parts of Tasmania. Overall, 22 people were killed, 40 people were injured, 2000
buildings were damaged and more than 100 were destroyed (Maiden, 2009).
While the rainfall impacted a widespread region, an isolated event occurred in
Derby where 14 people lost their lives. Excessive rains caused the newly built
Cascade Dam at Briseis Mine (Cascade Valley) to fail, sending a wall of water
through a narrow gorge on the Cascade River and on for 5.6 km to the
township of Derby. It is reported that a 12-foot wall of water went through
Derby, crushing houses and carrying with it a ten-tonne granite boulder (Rimon,
2010). The force of the dam-burst also caused the Ringarooma River to run
uphill for almost six hours (Maiden 2009, Rimon 2010).
During the same rain event, at Gawler, eight people died when the truck they
were in plunged into the Gawler River, en route from Gawler to Ulverston. Much
damage was caused, and 4,500 were left homeless in Launceston.
October-November 1934
Continuous and heavy rainfall throughout October and into November
contributed to widespread flooding. This was the heaviest rainfall experienced
in October in Melbourne for 65 years. One early incident in late October
resulted in three deaths in Muckleford South, where floods caused damage to
roads, bridges and water channels, costing £3,000 (£1934) damage to the Shire.
Record floods occurred in November 1934 in the Yarra River, eastern Port Phillip
streams, and central and southern Gippsland, leading to unprecedented
property damage and at least 25 deaths. Flood areas were widespread around
the Yarra River, ARI 100 in Melbourne, and it was considered the ‘greatest flood
in the history of the Yarra’. Nine deaths occurred at Collingwood on the Yarra.
Three deaths occurred at Eskdale (the Mitta Mitta River at Tallandoon had a 55
ARI), eight at the Bunyip River at Koo Wee Rup (>150 ARI and the largest flood
on record). Four fatalities were recorded at Yarram, where widespread heavy
rainfall resulted in flooding in the valleys of the Upper Murray basin including
Mitta Mitta, Kiewa, Ovens, Loddon, Yarra, Latrobe and Maribyrnong Rivers. One
death occurred at Eddington.
February 1954
The tropical cyclone that made landfall near the southern Queensland boarder
on 20 February 1954 caused some of the largest recorded floods across New
South Wales catchments (Roche et al. 2013), affecting some 8,000 km2. This
event has been described as the worst flood disaster in NSW.
An estimated £4M (£1954) of damage occurred in Lismore, affecting 75% of
homes and washing away at least two homes in the Tweed River area, with

AN ANALYSIS OF HUMAN FATALITIES FROM FLOODS IN AUSTRALIA 1900-2015 | REPORT NO. 166.2016
43
2,000 people homeless, and 19 deaths in the Richmond River area. One death
occurred at Morpeth (Hunter River); one at Grafton; five at Armidale and one
at Murwillumbah (Tweed River), where houses were destroyed and livestock
drowned.
The wall of water that rushed through Kyogle took 10 lives during the early hours
of 21 February (Burin, 2014). Of the 19 recorded fatalities in the Richmond River
area, seven (36.8%) were in the 0-9 year age group.
February 1955
Torrential rain caused rivers west of Sydney to the Queensland border to flood.
Creeks and waterways were already swollen due to the incessant rain that had
fallen from October 1954 to February 1955 as a result of a La Nina cycle.
Record floods at Maitland and Singleton were the most disastrous in NSW to
that date (1955) in economic terms, causing £10-15,000,000 damage in the
Hunter Valley, with 135 houses destroyed and about 3,000 damaged, over
22,000 homeless, 6,000 evacuated, road and rail traffic and telegraph lines
disrupted and about 120,000 sheep and 2,000 cattle lost. At least 18 deaths
occurred in the Hunter region.
The Central West was also affected by these floods, with about 18,000 more
homeless. The damage cost was estimated at £5,000,000 (£1955), including five
houses destroyed, 250 badly damaged and over 1,000 damaged at Dubbo,
and over three quarters of buildings to be rebuilt at Gilgandra, which was
almost wiped out by the floods. Gilgandra, Gulargambone and Coonamble
were isolated; houses were flooded at Warren and Nyngan. Singular flood
fatalities occurred at Dubbo, Lithgow, Quirindi, Gunnedah, Wee Waa,
Gilgandra, Coonamble and Moree.
December 2010-January 2011
A moist easterly flow covered much of Queensland at the end of December
2010 (the wettest December on record for Queensland) following very
extensive and heavy rainfall periods during the previous few months – the
wettest spring on record for Queensland, meaning many catchments were
already wet before the flooding rain. It was Australia’s wettest July to October
on record and also the wettest July to December on record. The rains of late
2010 took place during a very strong La Niña event in the Pacific Ocean.
An exceptional rain event occurred over eastern Queensland during the week
of 23 December 2010 causing river flooding along the tropical Queensland
coast before producing record breaking flood levels particularly through the
Central Highlands, Wide Bay and Burnett and the Darling Downs and Maranoa.
On 10 January 2011, two intense thunderstorms crossed the south-east coast
and joined, directing high rainfall intensities towards the Toowoomba range
and into the Brisbane River catchment. The runoff on the eastern side of the
Great Dividing Range flowed into the upper tributaries of the Lockyer Creek in
the Lockyer Valley; that which fell on the escarpment itself flowed into the
catchments of the Gowrie and Oakey creeks to the east and west of
Toowoomba. Two deaths occurred in Toowoomba; but the 2010-11 flooding in

AN ANALYSIS OF HUMAN FATALITIES FROM FLOODS IN AUSTRALIA 1900-2015 | REPORT NO. 166.2016
44
Queensland had the greatest impact in the Lockyer Creek catchment. Early
afternoon on the 10 February 2011, a destructive 7 metre wall of water flooded
towards the town of Grantham, sweeping adjacent buildings into Murphy’s
Creek (van den Honert & McAneney, 2011). Almost all houses on the floodplain
were severely impacted, with some being washed off their foundations and
others totally destroyed. A total of 19 fatalities occurred in the Lockyer Valley,
including 12 in Grantham. The flooding also destroyed 120 houses and
damaged 40 bridges (Rogencamp & Barton, 2012).
Essential services and road and rail infrastructure in Queensland were
significantly affected. The original and normalised 2011 damage cost was
$2380M for Toowoomba and Lockyer Valley.
As with Clermont, local authorities had a rapid and drastic response to prevent
such a tragedy from occurring again, despite the political resistance and
bureaucratic turmoil, by relocating the township of Grantham (Okada et al.
2014). Known as the land-swap scheme, the voluntary program gave impacted
residents the opportunity to resettle on adjacent to the original town but,
importantly, free from flood.
AN EXPLORATION OF THE FATALITIES BETWEEN 2000 – 2015
There were a total of 178 fatalities over this period. Of these, two thirds are
male (66.9%, n=119) and almost one third are female (30.3%, n=54). The majority
of people died while attempting to cross a watercourse (53.4%, n=95), followed
by those engaged in an activity in the water (14.0%, n=25). Of those engaged
in an activity not near a normal watercourse (11.2%, n=20), a total of 8 fatalities
(4.5%) were in a house or structure that was destroyed, 6 fatalities (3.4%) were in
a house or structure that was not destroyed, and 2 fatalities (1.1%) were on a
house or structure that was not destroyed.
The highest proportions of both female and male deaths were on route, with a
total of 84 fatalities recorded (47.2%). Of these the highest proportions of both
genders were en route to home. Recreating was the second highest reason
behind action for both genders (29.2%, n=52).
In terms of transport the highest proportion of recorded fatalities were in a
vehicle at the time of death (48.3%, n=86), followed by those who were on foot
(25.3%, n=45). A total of 22 fatalities (12.4%) were swimming.
The greatest proportion of fatalities occurred during the summer/ monsoon
season in the NT and Queensland (Table 4.21), with the greatest proportions of
fatalities experienced in January (NT: 53.3%, n=8; Queensland: 44.6%, n=41).
Fatalities in NSW mostly occurred in January to March (57.4%, n=27), with a spike
in June (19.1%, n=9). No fatalities have occurred in the ACT or SA during this
period.

AN ANALYSIS OF HUMAN FATALITIES FROM FLOODS IN AUSTRALIA 1900-2015 | REPORT NO. 166.2016
45
ACT NSW NT QLD SA TAS VIC WA Total
January 0 (0.0%) 7 (14.9%) 8 (53.3%) 41 (44.6%) 0 (0.0%) 0 (0.0%) 1 (6.2%) 0 (0.0%) 57 (32.0%)
February 0 (0.0%) 9 (19.1%) 5 (33.3%) 16 (17.4%) 0 (0.0%) 0 (0.0%) 4 (25.0%) 0 (0.0%) 34 (19.1%)
March 0 (0.0%) 11 (23.4%) 1 (6.7%) 8 (8.7%) 0 (0.0%) 0 (0.0%) 0 (0.0%) 2 (40.0%) 22 (12.4%)
April 0 (0.0%) 2 (4.3%) 1 (6.7%) 2 (2.2%) 0 (0.0%) 0 (0.0%) 0 (0.0%) 1 (20.0%) 6 (3.4%)
May 0 (0.0%) 3 (6.4%) 0 (0.0%) 5 (5.4%) 0 (0.0%) 0 (0.0%) 0 (0.0%) 0 (0.0%) 8 (4.5%)
June 0 (0.0%) 9 (19.1%) 0 (0.0%) 2 (2.2%) 0 (0.0%) 3 (100.0%) 0 (0.0%) 0 (0.0%) 14 (7.9%)
July 0 (0.0%) 1 (2.1%) 0 (0.0%) 0 (0.0%) 0 (0.0%) 0 (0.0%) 0 (0.0%) 0 (0.0%) 1 (0.6%)
August 0 (0.0%) 1 (2.1%) 0 (0.0%) 0 (0.0%) 0 (0.0%) 0 (0.0%) 3 (18.8%) 0 (0.0%) 4 (2.2%)
September 0 (0.0%) 0 (0.0%) 0 (0.0%) 1 (1.1%) 0 (0.0%) 0 (0.0%) 2 (12.5%) 0 (0.0%) 3 (1.7%)
October 0 (0.0%) 0 (0.0%) 0 (0.0%) 1 (1.1%) 0 (0.0%) 0 (0.0%) 0 (0.0%) 2 (40.0%) 3 (1.7%)
November 0 (0.0%) 1 (2.1%) 0 (0.0%) 7 (7.6%) 0 (0.0%) 0 (0.0%) 4 (25.0%) 0 (0.0%) 12 (6.7%)
December 0 (0.0%) 3 (6.4%) 0 (0.0%) 9 (9.8%) 0 (0.0%) 0 (0.0%) 2 (12.5%) 0 (0.0%) 14 (7.9%)
Total 0
(100%) 47 (100%) 15 (100%) 92 (100%) 0(100%) 3 (100%) 16 (100%) 5 (100%) 178 (100%)
TABLE 4.21: FATALITIES BY MONTH OF FATALITY AND STATE / TERRITORY (% OF COLUMN TOTALS)
A large number of the fatalities occurred on or near short coastal rivers
associated with heavy rainfall within a small catchment, causing a short
duration rapid flood or flash flood event (46.1%, n=82) or, in an urban setting, a
local flash flood or low-level short duration flood (32.0%, n=57). With respect to
gender, female fatalities are more or less evenly spread among the age groups
(Table 4.22). Male fatalities, however, are fewest among the 0-9 and 60-89 year
age groups and largest in the 10-19 year age group (19.3%, n=23).
Also with respect to age, the majority (71.0%, n=22) of people (male and
female) aged between 10-19 years were either on foot or swimming prior to
perishing in/near floodwater. Only 29.0% (n=9) were in a vehicle. A higher
proportion of people in the 20-29 year age group also died while on foot or
swimming (55.0%, n=11) than being in a vehicle (30%, n=6). While fatalities in the
older age groups are still associated with travelling on foot or swimming, the
greatest proportions are related to vehicles (30-39 years: 65.0%, n=13; 40-49
years: 52.4%, n=11; 50-59 years: 59.3%, n=16; 60-69 years: 41.2%, n=7; 70-79 years:
71.4%, n=10; 80-89 years: 55.6%, n=5).

AN ANALYSIS OF HUMAN FATALITIES FROM FLOODS IN AUSTRALIA 1900-2015 | REPORT NO. 166.2016
46
Male Female Unknown Total
0-9 9 (7.6%) 7 (13.0%) 2 (40.0%) 18 (10.1%)
10-19 23 (19.3%) 8 (14.8%) 0 (0.0%) 31 (17.4%)
20-29 15 (12.6%) 5 (9.3%) 0 (0.0%) 20 (11.2%)
30-39 14 (11.8%) 5 (9.3%) 1 (20.0%) 20 (11.2%)
40-49 13 (10.9%) 7 (13.0%) 1 (200.%) 21 (11.8%)
50-59 20 (16.8%) 6 (11.1%) 1 (20.0%) 27 (15.2%)
60-69 11 (9.2%) 6 (11.1%) 0 (0.0%) 17 (9.6%)
70-79 8 (6.7%) 6 (11.1%) 0 (0.0%) 14 (7.9%)
80-89 5 (4.2%) 4 (7.4%) 0 (0.0%) 9 (5.1%)
Unknown 1 (0.8%) 0 (0.0%) 0 (0.0%) 1 (0.6%)
Total 119 (100%) 54 (1003%) 5 (100%) 178 (100%)
TABLE 4.22: FATALITIES BY AGE AND GENDER (% OF COLUMN TOTALS)
As expected, most people in the 10-19 year age group were recreating prior to
perishing in/ near floodwater (64.5%, n=20). 54.8% (n=17) of these people were
engaged in an activity either in the water (n=12) or in/near a stormwater drain
(n=5), while a further 35.5% (n=11) were attempting to cross a bridge,
causeway, crossing, culvert, road, etc.
In relation to awareness, 50.0% of the 178 fatalities that occurred in the period
from 2000-2015 were aware of the flood risk but the depth and / or speed took
them by surprise (Table 4.23). Of this group, 48.3% (n=43) were capable of
independent action and 31.5% (n=28) were influenced by drugs or alcohol. This
includes some cases where people may have accidentally taken extra doses
of prescription drugs. The second largest proportion of deaths fell in the
‘unaware and taken by surprise’ category (23.0%, n=41). This group had similar
results as the first, with 51.2% (n=21) capable of independent action and 26.8%
(n=11) influenced by drugs or alcohol.

AN ANALYSIS OF HUMAN FATALITIES FROM FLOODS IN AUSTRALIA 1900-2015 | REPORT NO. 166.2016
47
Aware but did
not expect to
encounter the
flood
Aware but
depth and or
speed took
them by
surprise
Unaware and
taken by
surprise
N/A – child
< 11 years
old
N/A –
other
Unknown Total
Capable of independent
action 6 (46.2%) 43 (48.3%) 21 (51.2%) 0 (0.0%) 2 (100.0%) 3 (27.3%) 75 (42.1%)
Physically and or mentally
disabled or incapable 1 (7.7%) 2 (2.2%) 1 (2.4%) 0 (0.0%) 0 (0.0%) 2 (18.2%) 6 (3.4%)
Cannot swim 2 (15.4%) 1 (1.1%) 0 (0.0%) 0 (0.0%) 0 (0.0%) 0 (0.0%) 3 (1.7%)
Influenced by drugs or
alcohol 3 (23.1%) 28 (31.5%) 11 (26.8%) 0 (0.0%) 0 (0.0%) 2 (18.2%) 44 (24.7%)
Following the decision
making of others 1 (7.7%) 8 (9.0%) 4 (9.8%) 14 (63.6%) 0 (0.0%) 0 (0.0%) 27 (15.2%)
A child or group of children
on their own < 11 0 (0.0%) 2 (2.2%) 0 (0.0%) 8 (36.4%) 0 (0.0%) 0 (0.0%) 10 (5.6%)
Unfamiliar with the area 0 (0.0%) 1 (1.1%) 2 (4.9%) 0 (0.0%) 0 (0.0%) 0 (0.0%) 3 (1.7%)
Encumbered with clothing,
possessions or equipment 0 (0.0%) 0 (0.0%) 1 (2.4%) 0 (0.0%) 0 (0.0%) 0 (0.0%) 1 (0.6%)
Looking after dependents 0 (0.0%) 1 (1.1%) 1 (2.4%) 0 (0.0%) 0 (0.0%) 0 (0.0%) 2 (1.1%)
Unknown 0 (0.0%) 3 (3.4%) 0 (0.0%) 0 (0.0%) 0 (0.0%) 4 (36.4%) 7 (3.9%)
Total 13 (100%) 89 (100%) 41 (100%) 22 (100%) 2 (100%) 11 (100%) 178 (100%)
TABLE 4.23: FATALITIES BY CAPACITY AND AWARENESS (% OF COLUMN TOTALS)
The level of detail included in the NCIS data between 2000 and 2015 enabled a
spatial analysis on the location of fatality compared to distance from home. Of
the total 178 records, 121 contained data on the location of the fatality and
their home address. Figure 4.9 shows cumulative percentage of fatalities as
distance from home increases. Of these 121 fatalities more than a quarter
occurred within 5 km of their home (26.4%, n=32) and 57.9% (n=70) were within
20 km of their home. Fewer than 22% of fatalities occurred more than 100 km
from the victim’s home (21.5%, n=26). There were no age or gender trends
evident in this data, with 57% male (n=45) and 60% female (n25) fatalities
occurring within 20 km of their home (Table 4.24).

AN ANALYSIS OF HUMAN FATALITIES FROM FLOODS IN AUSTRALIA 1900-2015 | REPORT NO. 166.2016
48
FIGURE 4.9: CUMULATIVE PERCENTAGE OF FATALITIES BY DISTANCE FROM HOME
Male Female Total
0-2km 5 (6.3%) 5 (11.9%) 10 (8.3%)
2-5km 18 (22.8%) 4 (9.5%) 22 (18.2%)
5-10km 10 (12.7%) 3 (7.1%) 13 (10.7%)
10-20km 12 (15.2%) 13 (31.0%) 25 (20.7%)
20-50km 9 (11.4%) 3 (7.1%) 12 (9.9%)
50-100km 6 (7.6%) 7 (16.7%) 13 (10.7%)
>100km 19 (24.1%) 7 (16.7%) 26 (21.5%)
Total 79 (100%) 42 (100%) 121 (100%)
TABLE 4.24: FATALITIES BY DISTANCE THE DEATH OCCURRED FROM THE VICTIM’S HOME

AN ANALYSIS OF HUMAN FATALITIES FROM FLOODS IN AUSTRALIA 1900-2015 | REPORT NO. 166.2016
49
DISCUSSION AND RECOMMENDATIONS
SALIENT RESULTS
A total number of 1859 flood fatalities occurred in Australia between 1900 and
2015 of these 79.1% have been males. The majority of these deaths (67.1%,
n=1247) occurred in events where two or less people died. The analysis of flood
severity against numbers killed per event demonstrates that the majority of
these occurred in minor-moderate floods. The greatest percentage of women
died in urban settings in relation to a local flash flood or a low-level short
duration flood.
Death rates have steadily declined which, together with an increasing
Australian population over this time, indicate that the per capita risk of death
by flooding in Australia has decreased. In particular, it is evident that a
reduction in fatalities has occurred since 1960. This observation is likely to be
due to the following:
The establishment of formalised flood prediction and warning systems
Enhanced organisation and capacity for emergency response
operations through the creation of State Emergency Services.
Increased investment in structural flood mitigation, in particular in NSW
following the 1955 Hunter flood.
Further improvements in later decades included accurate flood mapping,
systematic approaches to land-use planning and the implementation of
community education programs. However, despite this female to male fatality
ratio has steadily increased indicating a greater proportion of female fatalities
over time and the need for a gendered approach to risk mitigation.
The data highlights the distinct high-risk groups of children and young adults (<
29 years of age) who make up the greatest proportion of deaths (44%). Across
all ages male fatalities are higher apart from two, six and seven year olds where
deaths are more gender balanced. In particular, both genders show a high
and equal death rate for those who are two years old and it is likely that this is
when children have learnt to walk and are able to quickly wander from adult
supervision.
The greatest number of fatalities occurred in Queensland and NSW, accounting
for 74% of the overall fatalities across the nation. However, when deaths are
examined in relation to the per capita population, the heightened level of risk
in the NT is highlighted. Overall, the majority of deaths occurred between
January and March during the summer / monsoon season. A spatial analysis of
fatalities between the years 2000 and 2015 shows that 58% died within 20km of
their home. The more detailed analysis of this recent data also shows the
increased proportion of flood deaths in the NT.
The highest proportions of both men and women died while attempting to cross
a bridge, causeway, culvert, road, etc. Of all those who were en route at the
time of their death, the greater number were on their way home. For females,

AN ANALYSIS OF HUMAN FATALITIES FROM FLOODS IN AUSTRALIA 1900-2015 | REPORT NO. 166.2016
50
the second highest activity at the time of death, accounting for nearly a
quarter of all female fatalities, was being engaged in an activity not near a
usual watercourse, e.g. driving through town or in their home. This was the third
highest cause of death for men. Of all the people engaged in this activity, 45%
(n101) were in or on a house that was destroyed. Although the highest
proportions of children and youth also perished while attempting to cross a
watercourse, the overall data also shows their heightened vulnerability to
activities in or near the water while recreating. For those between the age of 10
and 29 these latter activities become the dominant actions at the time of
death in the 2000 to 2015 data set.
The majority of fatalities died while capable of independent action and aware
of the flood. However, the speed and or depth took them by surprise. An
analysis of fatalities by time of day revealed that almost a quarter of all fatalities
that entered floodwaters did so in the dark or twilight when visibility would have
been poor. However, a higher proportion, over one third perished during the
day when visibility is likely to have been better. Higher proportions of deaths
occurred among children and females who were following the decisions of
others and also among children and youths who were on their own or in a
group of children. Of this latter group the majority were boys (69%).
Fatalities that were on foot have decreased slightly through time but remain a
high proportion. However, an increase of fatalities associated with motorised
vehicles is seen over recent decades. In particular, fatalities associated with
4WD vehicles have increased over the last 15 years. This is likely to be a
combination of increased 4WD ownership together with the more detailed
coronial inquest reports available over this period. The vast majority of those
driving a vehicle were men (85%) while the gender breakdown of the
passengers shows slightly more men. A quarter of the fatalities in vehicles were
children and youth, the majority of whom were passengers. The highest
proportion of those in a vehicle perished at night or during twilight (45%).
In order to reduce deaths the following groups should be targeted: children,
teens, young adults and their parents around the danger of recreating in flood
waters; young men <29 concerning driving and entering floodwaters; 4WD
drivers; gender specific campaigns for females around the dangers of entering
floodwaters; females and children to raise their awareness specifically of the
dangers of being driven through floodwaters in order that they are aware and
empowered to change the actions of the driver. Education, incentives and
structural interventions to reduce deaths are discussed in section 5.2.
MANAGEMENT INSIGHTS
People entering floodwaters by vehicle
Limited research has previously been conducted to evaluate many initiatives
historically utilised to reduce the instances of people entering flood water. This
section draws upon available research and provides some ideas for further
discussion and research to assist in reducing flood deaths. Further work is also
required to assess the overall costs and benefits of measures identified before
wide scale implementation.

AN ANALYSIS OF HUMAN FATALITIES FROM FLOODS IN AUSTRALIA 1900-2015 | REPORT NO. 166.2016
51
Typically, Australian management strategies have relied upon education and
rescue interventions as primary management tools. A more holistic behavioural
change focus such as implementing a continuum of interventions is likely
required. Meyer-Emerick (2015) identifies that engagement and social
marketing techniques can be used in conjunction with other techniques to
achieve preparedness outcomes. A continuum of interventions is referred to by
Rothschild (1999) and is inclusive of the following strategies:
Education – containing messages to attempt to voluntarily change
behaviour;
Incentives and consequences – to encourage voluntary behaviour
change; and
Law / regulation – attempting to create behaviour change involuntarily.
The importance of using a holistic strategy has been demonstrated by Peden et
al. (2004) in a World Health Organisation review of road traffic injury prevention
that concluded that road safety campaigns were able to influence behaviour
when used in conjunction with legislation and law enforcement. However,
when education was used in isolation, the authors found that generally it did
not deliver tangible and sustained reductions in deaths and serious injuries.
In the context of this problem, elements of a holistic strategy should include
education, incentives and consequences / law and regulation, structural
intervention and consequence management. Strategies that underpin such an
approach are outlined in Gissing et al. (2015) and are discussed in the sections
below.
Education
Both education campaigns and safety messages in public warnings have been
the primary strategies used to change motorist behaviour. Typically, campaigns
comprise signs, commercials, digital media and broadcast media
engagement. The United States ‘Turn around don’t drown’ campaign is now
some ten years old and is internationally recognised. However, few campaigns
have been evaluated. To be successful the campaigns must utilise messages
and communications channels that target key risk groups and involve all key
partner agencies. Partner agencies include those related to road safety,
motoring, water safety, insurance, health and education.
Roadside flood markers are frequently used to indicate the possible depths of
flooding. Current markers indicate the depth of flooding, but leave motorists to
interpret the risk rather than providing them a clear safety message. Existing
flood signage providing messages such as ‘road subject to flooding’ and
‘water over the road’, may also provide an ambiguous message to motorists.
Research in the context of warning signage at railway crossing has found that
active signage involving flashing lights is more effective than passive signage
(Tey et al., 2011). Further research is required to assess driver’s interpretation of
markers and road side signage, and assess the need for any modifications that
might be required.
The dissemination of road information is also key so drivers are aware of flooded
roads and can choose safe travel routes that avoid entering flooded

AN ANALYSIS OF HUMAN FATALITIES FROM FLOODS IN AUSTRALIA 1900-2015 | REPORT NO. 166.2016
52
roadways. Today, live traffic and road closure information is more widely
available using web-based tools, radio broadcasts and broadcasting directly
into car GPS units.
Additional methods for consideration in education and awareness campaigns
include:
Implementation of specific location-based warning systems at high risk
locations. These may include broadcasts through car radio systems or
lights and sirens.
Inclusion of educational messages in driver training programs.
Implementation of a national campaign to deliver consistent messages.
This campaign may be best focused at males who drive four wheel drive
vehicles, and dispel the images frequently portrayed in four wheel drive
sales advertising which, it might be argued, encourage risk-taking
behaviour.
Enhancement of flood warning systems in flash flood environments,
enabling agencies to effectively warn communities, pre-deploy
resources and close roads in a proactive manner.
Gissing (2016)observed a number of emergency service and government
vehicles entering floodwaters, hence providing inconsistent messages to
motorists regarding the safety of entering floodwaters. Consultation with NSW
SES found that their safe driver policy discourages members from entering
floodwaters and that no current specific training is delivered to better equip SES
volunteers to drive through floodwater than the general public. This fact is
further supported by the number of emergency service vehicles which have
been left stranded in floodwaters as a consequence of members to attempt to
drive along flooded roads. Flood management agencies should consider
developing an educational package for emergency services and government
agencies about the dangers of entering floodwaters, so as to ensure messages
are promoted consistently by all authorities to the community.
Incentives and consequences / Law and regulation
Regulation is often used to change behaviour: for example, enforcing speed
limits and encouraging seat belt use. Regulation, however, has not been widely
employed across all Australian jurisdictions to stop motorists from driving though
floodwater. Queensland Police have enforced careless driving charges for
motorists entering floodwater, resulting in fines and license disqualification.
Enforcement of driving laws is a measure used more commonly in the United
States where at least three states charge individuals for rescues as
consequence of recklessness (Wogan, 2013a) Little evidence exists regarding
the effectiveness of regulation in this area due to a lack of research (Wogan,
2013b). Evaluations of traffic safety measures in other contexts finds overall
positive results with some variation in effectiveness across different contexts
(Albalate et al., 2013)
Laws and incentives that could be considered to influence behaviour may
include:

AN ANALYSIS OF HUMAN FATALITIES FROM FLOODS IN AUSTRALIA 1900-2015 | REPORT NO. 166.2016
53
Motorists requiring rescue being required to pay for the cost of their
rescue where behaviour is deemed reckless, or motorists have ignored
road closure signage. Revenue could be re-invested into education
programs. Similarly, motorists who remove road closure barriers to allow
their vehicle to pass could be prosecuted. In doing so they have
‘opened’ the road to other vehicles and encouraged risk-taking actions.
Insurance companies not being obliged to pay claims for vehicles
damaged as a consequence of driving through floodwater where
motorist behaviour is deemed reckless.
Structural intervention
Structural intervention includes structures to prevent people entering
floodwaters, road design which increases the safety of motorists if they were to
enter floodwater, and vehicle design.
The closure of roads by authorities typically occurs when flooding happens or is
imminent. The erection of barricades and signage aims to prevent motorists
from entering floodwater. Due to the portable nature of barricades, motorists
are able to relocate them or possibly drive around them, although often
flooding may also occur before authorities can establish barriers. Gissing et al.,
(2016) identified in a case study of flooding in NSW that a high percentage of
motorists ignored road closure barricades.
To enhance the effectiveness of barriers the following could be considered:
Manning of barricades in high risk areas with personnel with the authority
to direct motorists not to proceed, and
Establishment of automatic gates in high risk areas that are activated
remotely or when triggered by a warning system.
However, these measures may be limited in their effectiveness due to a lack
barricades to be deployed, resources to man barricades, or due to the cost of
automatic gates.
Road design in flood prone areas could have a critical influence on the survival
outcomes of motorists once their vehicle becomes buoyant and should be an
area of further research. Specifically, research is required to identify the
influence of the following designs:
The presence of roadside barriers high enough to prevent vehicles from
being swept off a roadway,
The height of the road above surrounding terrain,
The presence of vegetation to act as a natural barrier to prevent a
vehicle from being swept downstream, and
The presence of road lighting to allow motorists to observe dangers at
night.
If these factors were proved to have a significant impact, their consideration in
road design and in prioritising resources to close roads could assist in reducing
the risk.

AN ANALYSIS OF HUMAN FATALITIES FROM FLOODS IN AUSTRALIA 1900-2015 | REPORT NO. 166.2016
54
Vehicle design has been a major influence in reducing the overall road death
toll, with innovations such as seat belts and airbags now commonplace. Yet
existing vehicle design would appear to have few, if any, elements
incorporated to reduce risks to motorists during floods. However, future
innovations may be possible, including through the future use of autonomous
vehicles. These vehicles have the potential to remove many of the factors
which contribute to the overall road toll, such as speeding, fatigue, drugs /
alcohol, and distraction. If such vehicles are programmed to avoid flooded
roads this would be helpful in reducing the risk.
Consequence Management
Rescue is the primary consequence management strategy. Emergency
services have long-standing flood rescue capabilities and significant investment
has occurred of late in rescue capabilities for swift water. There is still much to
learn about the overall influence of flood rescue in reducing the death toll of
motorists during flooding. Some of the questions primarily relate to the timing of
fatalities in relation to rescue intervention. For example: do most flood fatalities
occur before rescue resources arrive or before bystanders can act, meaning
that, unless resources were on scene within seconds, the death would have
occurred anyway? Or do they occur after rescue resources arrive, indicating
the overall effectiveness of the intervention when applied in reducing deaths?
No matter the answers, however, it must be concluded by the existing rate of
death that rescue is not a perfect solution, and that to reduce deaths focus
must be applied to the above-mentioned preventative measures as well.
People entering floodwaters by foot
No holistic strategies have been developed to specifically address people
entering floodwater by foot, again there is limited evaluations of existing
measures and research to form a strong evidence base. This problem is
potentially hard to address due to the geographical diversity of possible
incidents, which could in theory occur anywhere on a floodplain. A similar
framework, however, to that outlined to address people entering floodwater in
vehicles could and should be developed.
Education campaigns are currently a key strategy and focus on discouraging
people from entering flood water for recreation or other purposes. Signage and
fencing is often in place around known hazard areas such as drains and
detention basins to raise awareness of the possible risks present in the
environment and prevent access. Fencing has been shown as effective in the
context of reducing drowning in swimming pools and spas (Bennett and Linnan,
2014).
The possible public appetite for regulation to prevent people from playing in
floodwater by imposing fines is likely debateable, but essentially unknown.
Proactive intelligence-led efforts could be utilised to discourage people
observed entering flood waters by proactive monitoring of identified hotspots
by police, SES and other emergency services, as currently implemented by
Queensland Police.

AN ANALYSIS OF HUMAN FATALITIES FROM FLOODS IN AUSTRALIA 1900-2015 | REPORT NO. 166.2016
55
Proactive monitoring of social media and the media could also be key. Where
people are identified as engaging in risky behaviour on social media, these
platforms should be utilised to refute the behaviour by reinforcing key messages
of safe behaviours. Likewise, media engagement is necessary to ensure images
of risky behaviour are not broadcast, and reporters demonstrate behaviours in-
line with key messages.
Failure or inability to evacuate
Reviews and research conducted after major evacuations have identified that
evacuation rates are highly variable (Baker, 1991). The timing which people
choose to leave following a warning to evacuate is also extremely variable
(Sorensen, 1991). Failing to evacuate, or evacuating too late may result in fatal
consequences.
The main reason for people evacuating is the perception that the anticipated
hazard is a significant threat (Baker, 1991). Research after hurricane
evacuations has demonstrated that the stronger the storm and the closer its
proximity, the greater the chance that people will evacuate (Smith and
McCarty 2009). People are more likely to evacuate when they understand that
a warning applies to them (Baker 1991, Huang et al, 2012): the more
personalised the form of delivery, the greater the response (Baker 1991, Huang
et al. 2012). In general, research supports that mandatory evacuations may be
more effective than voluntary evacuations, although they can result in
community anger and social turmoil (Bobrowsky 2013).
The main reason why people don’t evacuate is they do not perceive the threat
of the anticipated hazard to be sufficient enough to act (Baker 1991, Gissing et
al, 2008, Smith and McCarty 2009) or simply are unable to act due to the fast
onset of the hazard. Other reasons for not evacuating include:
• Desire to protect their property from the hazard (Baker 1991, Gissing et
al. 2008),
• Need to fulfil obligations to employers (Baker 1991, Smith and McCarty
2009),
• Concern about looters (Baker 1991),
• Inconvenience and effort incurred in having to evacuate (Baker
1991),
• Care of pets and animals (Smith and McCarty 2009, Bird et al. 2011),
• No transport or nowhere to go (Baker 1991, Smith and McCarty 2009),
• Not aware of warnings (Smith and McCarty 2009), and
• Medical conditions (Smith and McCarty 2009).
Key management actions to improve the success of evacuation are discussed
in the following sections.

AN ANALYSIS OF HUMAN FATALITIES FROM FLOODS IN AUSTRALIA 1900-2015 | REPORT NO. 166.2016
56
Ensure that evacuation is a consideration in land use planning
The safest place to be during a flood is away from the affected area. Land use
planning needs to ensure that there is an ability to completely evacuate
communities within plausible worst case scenarios. This means that a warning
system exists that will allow adequate time for existing and future residents to
leave areas threatened by flooding, and that road networks are sufficient to
enable the movement of residents to safety within the time available and
without disruption by flooding. Where this is not possible – for example in areas
where flooding occurs quickly – other development design options such as
shelter-in-place might be considered, but are unlikely to provide the degree of
safety provided for by safely managed evacuation. Though it may be possible
to construct buildings that can withstand flood forces, and offer shelter to
inhabitants in the most severe of events, isolation is likely to occur. There is no
safe period of isolation, due to the possible loss of utilities and risk of medical
emergency, fire and other incidents that may threaten human life. There can
also be no guarantee regarding how building inhabitants may behave, as
there is a risk they may attempt to evacuate through floodwater after flooding
has commenced by vehicle or foot, placing at risk their safety. Alternatively,
inhabitants may simply be too vulnerable due to their age, capacity or medical
condition to shelter in place during a severe flood.
In the context of flash flooding the Australasian Fire and Emergency Service
Authorities Council recommends (Australasian Fire and Emergency Services
Authorities Council, 2013; p. 2):
“Given the life risk posed by flash flooding and the inherent limitations on how it
can be managed, new urban areas should be designed within the limits of
existing flash flood forecast capability, should facilitate rapid and safe
evacuation from flash flood-prone locations, should account for the likelihood
that some people might become trapped inside buildings, and should involve
a thorough understanding on how people will behave in a flash flood event
and the risks they face.”
In areas where evacuation is possible, there is still no guarantee that all
residents will evacuate. In this case, safe refugees could be incorporated into
the design of new buildings to provide some degree of safety more significant
than simply attempting to shelter in the high point of a building, which may
eventually be overwhelmed by a flood. However, though possibly enhancing
safety, this option could incur additional construction costs, may not be
practical in all flood environments and may deter evacuation. Such a measure
should be considered based upon the life safety risks present within a local
flood environment.
Plan for the evacuation of residents
In areas of existing flood risk, evacuation plans should be developed in
partnership with communities to enable the movement of people to safety
during the occurrence of flooding. Key considerations include:
Determination of principles of when evacuation will be necessary in
reference to available flood risk information,

AN ANALYSIS OF HUMAN FATALITIES FROM FLOODS IN AUSTRALIA 1900-2015 | REPORT NO. 166.2016
57
The availability of flood warning systems, and warning dissemination
mechanisms,
Resources to assist in the evacuation of the community, in particular
vulnerable residents,
Suitability of evacuation routes,
Methods by which residents will evacuate,
Where residents will be encouraged to evacuate to and what shelter
maybe available, and
When will evacuees be able to return, and what measures will be
implemented to assist in the process.
A specific guideline has been developed by the Australasian Fire and
Emergency Services Authorities Council (2013) to assist emergency services in
emergency planning to protect human life during a flash flood event. It
addresses the inherent difficulties in implementing evacuation strategies in flash
flood environments. The guideline states:
“Where the available warning time and resources permit, evacuation should
be the primary response strategy” (Australasian Fire and Emergency Services
Authorities Council, 2013; p. 4).
“If insufficient time or resources are available for a full evacuation, incident
controllers must consider whether a partial evacuation, starting with structures
triaged as clearly unsuitable, can be carried out” (Australasian Fire and
Emergency Services Authorities Council, 2013; p.6).
“Public information should advise people to leave at-risk areas early, not to
attempt to escape through floodwater, and if they become trapped to move
to the highest point of a suitable building to await the end of the event, and to
call 000 if they require recue. This may include providing advice to people on
moving from obviously unsuitable buildings to more suitable ones” (Australasian
Fire and Emergency Services Authorities Council, 2013; p.6).
Improving response to evacuation warnings
Much has been achieved in the last decade to enhance the communication
of emergency warnings, including those for evacuation. The expansion of
mobile phone systems, proliferation of the internet and smart phones, and the
birth of social media has meant that warnings have become more accessible
to individuals. Constant effort is required, however, to engage with community
members about warnings, and how they should react when they are received.
Keys (2015) argues that residents need to be persuaded in 'quiet time', when
there is no flooding, that evacuation will, on occasions, be a necessary
intervention. As part of this campaign, people will need to understand the
limitations of levees, that the prediction of floods is not an exact science, and
that flooding more severe than that experienced historically is inevitable. The
persuasion is best achieved through community engagement in which people
have an opportunity to discuss and test what is being communicated by
authorities. It is also argued that the dangers of being caught in floodwaters

AN ANALYSIS OF HUMAN FATALITIES FROM FLOODS IN AUSTRALIA 1900-2015 | REPORT NO. 166.2016
58
need further attention in education campaigns. In such circumstances, people
may face snakes, spiders, insects and vermin invading their homes, floodwater
containing raw sewage, oils and chemicals, or lose essential services such as
power, water and communications.
When a flood is imminent, residents need clear information before the
occurrence of flooding about what areas are likely to be affected and (if
evacuation is necessary) about when to leave and where to go (Keys, 2015).
Emergency services need to prepare evacuation warnings well ahead of time
to ensure they can be delivered in a timely manner, and disseminate them
utilising a range of communications techniques.
People living in high hazard areas
Many communities have inherited the legacy of land use planning decisions
that have not sufficiently addressed the safety of people living or working on
floodplains. In flood prone communities, a flood plain risk management process
is necessary to minimise the existing and future risks posed by flooding. Such a
process ensures that flood risks are well understood and that appropriate risk
treatments can be planned and implemented. The Australian Government
(2013) have developed a guideline titled “Managing the Floodplain”, which
outlines in full the floodplain risk management process.
Land use planning is critical to the management of future flood risk. Unrestricted
development in flood prone areas will likely result in intolerable life safety risks,
significant financial costs and community disruption. For this reason,
management measures limiting the growth of future flood risk are designed
and implemented. These measures include:
Controls to limit the impacts of new development on the flood risk posed
to existing development, and
Limiting where different types of new development can occur and
ensuring that development is compatible with the nature of flooding
(Australian Government, 2013).
These measures are achieved through land use zoning and building controls.
Some debate has occurred in relation to land use zoning that is based on the
probability of flooding, typically in the Australian context of the one in one
hundred year event (1:100). Such a measure does not account for flood
consequences and therefore the totality of flood risk. Smith (2004) outlines three
key problems with the adoption the 1:100 year standard:
“Major differences in the flood height-range between locations;
Lack of consideration of floods that exceed the standard; and
Lack of consideration of over-floodplain flow velocities”.
McAneney et al. (2015) argue that the 1:100 year standard is a flawed risk
metric in the Australian context. This point is illustrated by an analysis of flood
height ranges between the 1:100 year flood and Probable Maximum Flood,
identifying variance of a few tens of centimetres to nine metres across different
Australian catchments (McAneney et al. 2015). The authors concluded that the

AN ANALYSIS OF HUMAN FATALITIES FROM FLOODS IN AUSTRALIA 1900-2015 | REPORT NO. 166.2016
59
risk to property will vary considerably across different catchments, therefore
inferring that a blanket standard across all at-risk communities is inappropriate.
Wenger et al. (2013a) outlines concerns regarding the uncertainties involved in
the establishment of the 1:100 year flood level such as lack of data, out of date
data, influences of new data, changes in estimation techniques and changing
future conditions such as climate change. Wenger et al. (2013a) highlights the
case study of Wagga Wagga, which discovered that its previous 1:100 year
flood level was actually closer to the 1:60 year level, which has now required
debate about raising the city’s levees to match the new standard. Wenger et
al. (2013b) concludes that the 1:100 year standard may be inadequate in the
Australian context due to the short records available on historical flooding.
Molino and Karwaj (2012), in a survey of community members regarding the
acceptability of flood risks, concluded that the current flood planning standard
of 1:100 year is not acceptable to the majority of community members, and
that the community expects a much higher degree of protection. The
standards applied across hazards are also inconsistent: for example, in the
Australian context, earthquake building standards are set at an average
recurrence interval of 1:475 years.
The practice of applying the 1:100 year standard without full consideration of
flood risk may result in development occurring in some floodplain environments
that may be considered intolerable, and establishes a concentration of risk just
above an arbitrary level. Land use planning policies must be risk-based and
allow for the consideration of flood consequences. Smith (2004) argues that it is
imperative that risks to communities from events that could be life threatening,
such as high flood depths and velocities, are incorporated into the planning
process. Therefore, given these criticisms, the use of the 1:100 year flood as a
standard requires review.
FUTURE RESEARCH
There has been limited research to date that rigorously evaluates the efficacy
of existing education, incentives and structural measures in reducing loss of life
in flood events. In order to reduce lives lost and ensure efforts are targeted
effectively this needs to be redressed. In relation to the findings of this project
and in discussion with end-users, particularly the NSWSES, the following research
priority areas are highlighted.
- Evaluating messaging and terminology used with different socio-
demographic groups, particularly women, men, and children and also
culturally and linguistically diverse groups.
- Evaluate and compare the efficacy of education, incentives and
enforcement.
- Evaluate signage options and smart technology for warning people
about flood waters and dangers ahead.
- Explore the decision making of those who do and do not drive through
floodwaters.

AN ANALYSIS OF HUMAN FATALITIES FROM FLOODS IN AUSTRALIA 1900-2015 | REPORT NO. 166.2016
60
- Exploring decision making dynamic between passengers and drivers
and how passengers can be better educated and empowered to
influence driver behavior.
- Exploring available rescue and near miss data
In terms of data, recent coronial records are extremely detailed concerning
the circumstances surrounding the deceased. However, the record of rescues
remains poor and rests within agencies who may have limited capacity to
collect and store the information. A national data base of rescues from flood
events would significantly improve the research and evidence to support
actions in reducing flood deaths and rescues
AN ANALYSIS OF HUMAN FATALITIES FROM FLOODS IN AUSTRALIA 1900-2015 | REPORT NO. 166.2016
61
REFERENCES 1. Albalate, D., Fernandez, L. & Yarygina, A. 2013. The road against fatalities: Infrastructure spending vs. regulation??
Accident Analysis & Prevention, 59, 227-239.
2. Ashley, S. T. & Ashley, W. S. 2008. Flood fatalities in the United States. Journal of Applied Meteorology and Climatology,
47, 805-818.
3. Australian Broadcasting Commission [ABC], 2011. Clermont remembers horror floods,
http://www.abc.net.au/7.30/content/2011/s3353663.htm, Accessed: 16 December 2015.
4. Australasian Fire And Emergency Services Authorities Council 2013. Guideline on emergency planning and response to
protect life in flash flood events. Melbourne, Australia: Australasian Fire and Emergency Services Authorities Council.
5. Australian Government 2013. Managing the floodplain: a guide to best practice in flood risk management in Australia.
Canberra, Australia: Attorney-General's Department.
6. Baker, E. J. 1991. Hurricane evacuation behavior. International Journal of Mass Emergencies and Disasters, 9, 287-310.
7. Becker, J., Mcclure, J. & Davies, B. 2011. Never drive, ride or walk through floodwater: Pedestrian and motorist
behaviour in and around floodwater. NSW Floodplain Management Conference. Tamworth.
8. Bennett, E. & Linnan, M. 2014. Physical Barriers. In: Biernes, J. L. M. J. (ed.) Drowning: Prevention, Rescue, Treatment.
Berlin, Heidelberg: Springer Berlin Heidelberg.
9. Bird, D. K., Gísladóttir, G. & Dominey-Howes, D. 2011. Different communities, different perspectives: issues affecting
residents’ response to a volcanic eruption in southern Iceland. Bulletin of volcanology, 73, 1209-1227.
10. Bird, D., King, D., Haynes, K., Box, P., Okada, T. & Nairn, K., 2013. Impact of the 2010/11 floods and the factors that inhibit
and enable household adaptation strategies. National Climate Change Adaptation Research Facility, Gold Coast,
Australia.
11. Blanchi, R., Leonard, J., Haynes, K., Opie, K., James, M. & Dimer de Oliveira, F. 2014. Environmental circumstances
surrounding bushfire fatalities in Australia 1901-2011. Environmental Science and Policy. Vol 37, p 192-203.
12. Blong, R.J., 2004. Natural hazards risk assessment: an Australian perspective. Issues in Risk Science 04 (27pp.), Benfield
Hazard Research Centre.
13. Bobrowsky, P. T. 2013. Encyclopedia of natural hazards, Springer.
14. Bureau of Meteorology [BOM], 2010. Queensland flood summary 1920 - 1929,
http://www.bom.gov.au/qld/flood/fld_history/floodsum_1920.shtml, Accessed: 16 December 2015.
15. Burin, M., 2014. 60 years on: Kyogle residents "will never forget" 1954 floods,
http://www.abc.net.au/local/photos/2014/02/19/3947948.htm, Accessed: 16 December 2015.
16. Centre for the Government of Queensland, 2015. Brisbane River system. http://queenslandplaces.com.au/brisbane-
river-system Accessed: 21 December 2015.
17. Chowdhury, A. M. R., Bhuyia, A. U., Choudhury, A. Y. & Sen, R. 1993. The Bangladesh cyclone of 1991: why so many
people died. Disasters, 17, 291-304.
18. Coates, L. 1996. An overview of fatalities from some natural hazards. Proceedings, NDR ’96: Conference on Natural
Disaster Reduction, Institution of Engineers Australia, 29 September-2 October 1996, Surfers Paradise, Queensland. R.L.
Heathcote, C. Cuttler and J. Koetz (Eds), 49-54.
19. Coates, L. 1999. Flood fatalities in Australia, 1788-1996. Australian Geographer, 30(3), 391-408.
20. Coates, L., 2012. Moving Grantham? Relocating flood-prone towns is nothing new,
http://theconversation.edu.au/moving-grantham-relocating-flood-prone-towns-is-nothing-new-4878, Accessed: 12
October 2012.
21. Coates L, Blong RJ & Siciliano F 1993. Lightning fatalities in Australia, 1824-1991. Natural Hazards, 8, 217-233.
22. Coates L., Haynes K., O’Brien J., McAneney K. & Dimer de Oliveira, F. 2014. Exploring 167 years of vulnerability: An
examination of extreme heat events in Australia 1844-2010. Environmental Science and Policy, 42, 33-44. DOI:
10.1016/j.envsci.2014.05.003.
23. Crompton R., McAneney K., Chen K., Pielke Jr R. & Haynes K. 2010. Influence of location, population, and climate on
building damage and fatalities due to Australian bushfire: 1925-2009. Weather, Climate and Society, 2, 300-310.
24. Department of Primary Industries, no date. Georges catchment. http://www.water.nsw.gov.au/water-
management/basins-and-catchments/georges-catchment Accessed: 21 December 2015.
25. Department of Primary Industries, no date. Hunter catchment. http://www.water.nsw.gov.au/water-
management/catchments/hunter-catchment Accessed: 21 December 2015.
26. Department of Primary Industries, no date. Murrumbidgee catchment. http://www.water.nsw.gov.au/water-
management/basins-and-catchments/murrumbidgee-catchment Accessed: 21 December 2015.
27. Diakakis, M. & Deligiannakis, G. 2013. Vehicle-related flood fatalities in Greece. Environmental Hazards, 12, 278-290.
28. Diakakis, M. & Deligiannakis, G. 2015. Flood fatalities in Greece: 1970–2010. Journal of Flood Risk Management.
29. Drobot, S. D., Benight, C. & Gruntfest, E. 2007. Risk factors for driving into flooded roads. Environmental Hazards, 7, 227-
234.
30. Fitzgerald, G., Du, W., Jamal, A., Clark, M. & Hou, X. Y. 2010. Flood fatalities in contemporary Australia (1997–2008).
Emergency Medicine Australasia, 22, 180-186.
31. Fitzroy Basin Association [FBA], 2013. Fitzroy Basin. http://www.fba.org.au/fitzroy-basin/ Accessed: 21 December 2015.
32. Franklin, R. C., King, J. C., Aitken, P. J. & Leggat, P. A. 2014. “Washed away”—assessing community perceptions of
flooding and prevention strategies: a North Queensland example. Natural Hazards, 73, 1977-1998.
33. Gissing, A. 2015. Motorist behaviour during the shoalhaven floods. Risk Frontiers Briefing Note [Online].
34. Gissing, A., Haynes, K., Coates, L. & Keys, C. 2015. How do we reduce vehicle related deaths: Exploring Australian Flood
Fatalities 1900-2105. Bushfire and Natural Hazards CRC & AFAC Conference. Adeliade.
35. Gissing, A., Haynes, K., Coates, L. & Keys, C. 2016. Motorist behaviour during the 2015 Shoalhaven floods. Australian
Journal of Emergency Management, 31, 23-27.

AN ANALYSIS OF HUMAN FATALITIES FROM FLOODS IN AUSTRALIA 1900-2015 | REPORT NO. 166.2016
62
36. Gissing, A., Molino, S., Cameron-Smith, C. & Wales, N. S. 2008. How do you improve community response to warnings?,
State Emergency Service.
37. Haynes, K., Coates, L., Leigh, R., Handmer, J., Whittaker, J., Gissing, A., Mcaneney, J. & Opper, S. 2009. 'Shelter-in-place'
vs. evacuation in flash floods. Environmental Hazards, 8, 291-303.
38. Haynes, K., Handmer, J., McAneney, K., Tibbits, A. & Coates, L. 2010. Australian bushfire fatalities 1900-2008: Exploring
trends in relation to the ‘prepare, stay and defend or leave early’ policy. Environmental Science and Policy, 13(3), 185-
194.
39. Huang, S.-K., Lindell, M. K., Prater, C. S., Wu, H.-C. & Siebeneck, L. K. 2012. Household evacuation decision making in
response to Hurricane Ike. Natural Hazards Review, 13, 283-296.
40. International Federation Of Red Cross And Red Crescent Societies 2015. World disasters report. Geneva, Switzerland.
41. Jonkman, S. 2014. Loss of life due to floods: general overview. Drowning. Springer.
42. Jonkman, S. & Kelman, I. 2005. An analysis of the causes and circumstances of flood disaster deaths. Disasters, 29, 75-
97.
43. Jonkman, S., Maaskant, B., Boyd, E. & Levitan, M. L. 2009. Loss of life caused by the flooding of New Orleans after
Hurricane Katrina: analysis of the relationship between flood characteristics and mortality. Risk Analysis, 29, 676-698.
44. Jonkman, S. & Vrijling, J. 2008. Loss of life due to floods. Journal of Flood Risk Management, 1, 43-56.
45. Kellar, D. & Schmidlin, T. 2012. Vehicle‐related flood deaths in the United States, 1995–2005. Journal of Flood Risk
Management, 5, 153-163.
46. Keys, C. 2015. Flood evacuation: never fun, sometimes necessary, always problematic. Risk Frontiers Briefing Note, 1-6.
47. Kundzewicz, Z. & Kundzewicz, W. 2005. Mortality in flood disasters. Extreme weather events and public health responses.
Springer.
48. Maiden, S., 2009. Remembering the 1929 Launceston floods,
http://www.abc.net.au/local/stories/2009/06/04/2589538.htm, Accessed: 16 December 2015.
49. Maples, L. & Tiefenbacher, J. 2009. Landscape, development, technology and drivers: The geography of drownings
associated with automobiles in Texas floods, 1950–2004. Applied geography, 29, 224-234.
50. McAneney, J., McAneney, D., Musulin, R., Walker, G. & Crompton, R. 2015. Government-sponsored Natural Disaster
Insurance Pools: A view from down-under. International Journal of Disaster Risk Reduction.
51. Meyer-Emerick, N. 2015. Using Social Marketing for Public Emergency Preparedness, New York, Routledge.
52. Molino, S. & Karwaj, A. 2012. Do we understand what is an acceptable flood risk? The people of Australia have their
say. Floodplaim Management Australia Conference. Batemans Bay.
53. Monument Australia, no date. Sacred Heart Monument,
http://monumentaustralia.org.au/themes/disaster/flood/display/91643-sacred-heart-monument, Accessed: 16
December 2015.
54. Okada, T., Haynes, K., Bird, D., van den Honert, R. & King, D., 2014. Recovery and resettlement following the 2011 flash
flooding in the Lockyer Valley. International Journal of Disaster Risk Reduction 8, 20-31.
55. Pearson, M. & Hamilton, K. 2014. Investigating driver willingness to drive through flooded waterways. Accident Analysis
& Prevention, 72, 382-390.
56. Peden, M., Scurfield, R., Sleet, D., Mohan, D., Hyder, A. A., Jarawan, E. & Mathers, C. 2004. World report on road traffic
injury prevention. In: Organisation, W. H. (ed.). Geneva: World Health Organisation.
57. Rimon, W., 2010. Floods, http://www.utas.edu.au/library/companion_to_tasmanian_history/F/Floods.htm, Accessed: 16
December 2015.
58. Roche, K., McAneney, K., Chen, K. & Crompton, R., 2013. The Australian great flood of 1954: estimating the cost of a
similar event in 2011. Weather, Climate, and Society 5, 199-209.
59. Rogencamp, G., Barton, J., 2012. The Lockyer Creek flood of January 2011: what happened and how should we
manage hazard for rare floods, 52nd Annual Floodplain Management Authorities Conference, Shoalhaven
Entertainment Centre, Nowra.
60. Rothschild, M. 1999. Carrott, sticks and promises: A conceptual framework for the management of public health and
social issue behaviours. Journal of Marketing, 63, 24-37.
61. Ruin, I., Gaillard, J.-C. & Lutoff, C. 2007. How to get there? Assessing motorists’ flash flood risk perception on daily
itineraries. Environmental hazards, 7, 235-244.
62. Shand, T., Cox, R. & Blacka, M. 2011. Australian Rainfall And Runoff Project 10: Appropriate safety criteria for vehicles.
63. Singh, O. & Kumar, M. 2013. Flood events, fatalities and damages in India from 1978 to 2006. Natural hazards, 69, 1815-
1834.
64. Smith, D. I. 2004. Shortcomings in the 1% chance flood standard. Reducing Flood Losses: Is the 1% chance (100 year)
Flood Standard Sufficent? Washington D.C.
65. Smith, S. K. & McCarty, C. 2009. Fleeing the storm (s): An examination of evacuation behavior during Florida’s 2004
hurricane season. Demography, 46, 127-145.
66. Sorensen, J. 1991. When shall we leave? Factors affecting the timimg of evacuation departures. International Journal of
Mass Emergencies and Disasters, 9, 153-165.
67. Špitalar, M., Gourley, J. J., Lutoff, C., Kirstetter, P.-E., Brilly, M. & Carr, N. 2014. Analysis of flash flood parameters and
human impacts in the US from 2006 to 2012. Journal of Hydrology, 519, 863-870.
68. Tey, L.-S., Ferreira, L. & Wallace, A. 2011. Measuring driver responses at railway level crossings. Accident Analysis &
Prevention, 43, 2134-2141.
69. Van den Honert, R. & McAneney, J., 2011. The 2011 Brisbane floods: causes, impacts and implications. Water 3, 1149-
1173.
70. Vinet, F., Lumbroso, D., Defossez, S. & Boissier, L. 2012. A comparative analysis of the loss of life during two recent floods
in France: The sea surge caused by the storm Xynthia and the flash flood in Var. Natural hazards, 61, 1179-1201.
71. Wenger, C., Hussey, K. & Pittock, J. 2013a. Living with floods: key lessons from Australia and abroad. National Climate
Change Adaptation Research Facility, Gold Coast.
72. Wenger, C., Hussey, K. & Pittock, J. 2013b. Living with floods: key lessons from four Australian flood reviews and similar

AN ANALYSIS OF HUMAN FATALITIES FROM FLOODS IN AUSTRALIA 1900-2015 | REPORT NO. 166.2016
63
reviews from the Netherlands, China and the USA. Floodplain Management Australia Conference. Tweed Heads.
73. Wogan, J. 2013a. More states consider billing rescues to make thrill seekers think again. Governing: August 2013.
74. Wogan, J. 2013b. More States consider billing risky rescues to make thrill-seekers think again. USA: Governing: Public
Safety and Justice.
75. World Health Organization 2014. Global report on drowning - preventing a leading killer. Geneva, Switzerland: World
Health Organisation.
76. Yale, J. D., Cole, T. B., Garrison, H. G., Runyan, C. W. & Ruback, J. K. R. 2003. Motor Vehicle—Related drowning deaths
associated with inland flooding after Hurricane Floyd: a field investigation. Traffic injury prevention, 4, 279-284.
77. Yeo, S. W. & Blong, R. J. 2010. Fiji's worst natural disaster: the 1931 hurricane and flood. Disasters, 34, 657-6

AN ANALYSIS OF HUMAN FATALITIES FROM FLOODS IN AUSTRALIA 1900-2015 | REPORT NO. 166.2016
64
APPENDIX – ANALYSIS OF FATALITIES AMONGST
OCCUPANTS OF VEHICLES
A total of n=336 flood fatalities were attributed to occupants of vehicles. This is
made up as follows:
219 in or exiting a sedan car
45 in or exiting a 4WD
26 in or exiting a truck
8 in or exiting a ute
13 in a train
8 on pushbike
17 on other forms of transport (e.g. motorbike)
Fatalities in horse-drawn vehicles and those in which the vehicle type is
unknown have been omitted from this analysis.
This Appendix presents charts describing the characteristics of this subset of
fatalities.
A.1 Fatalities by gender
A.2 Fatalities by age

AN ANALYSIS OF HUMAN FATALITIES FROM FLOODS IN AUSTRALIA 1900-2015 | REPORT NO. 166.2016
65
A.3 Fatalities by decade
A.4 Fatalities by state
A.5 Fatalities by month of the year
40.8%
29.5%
10.1%8.3%
4.5%2.7% 2.4% 1.8%
0%
5%
10%
15%
20%
25%
30%
35%
40%
45%
NSW QLD VIC SA TAS WA ACT NT

AN ANALYSIS OF HUMAN FATALITIES FROM FLOODS IN AUSTRALIA 1900-2015 | REPORT NO. 166.2016
66
A.6 Fatalities by time of day
A.7 Fatalities by awareness
A.8 Fatalities by activity prior to death
A.9 Fatalities by primary capacity

AN ANALYSIS OF HUMAN FATALITIES FROM FLOODS IN AUSTRALIA 1900-2015 | REPORT NO. 166.2016
67
A.10 Fatalities by reason behind action prior to death
A.11 Fatalities by flood type