traffic fatalities 2015 - visualization and analysis
TRANSCRIPT

Visualization and Analysis of2015 Traffic Fatalities
Tahmid Abtahi ,MS StudentComputer Engineering, UMBC

Dataset -2015 Traffic Fatalities Data • Annually Released by National Highway Traffic Safety Administration (NHTSA)• White House and U.S. Department of Transportation’s Blog calling for data
scientists, students and researcher to provide analysis on this data• Significance– Dept of Transportation aggressively seeking insights to improve road safety– Shaping Auto industry to improve vehicle safety– Identifying communities at higher risk of fatal crashes etc.– Insight to seek solutions to behavioral challenges like drunk, drugged, distracted and
drowsy driving
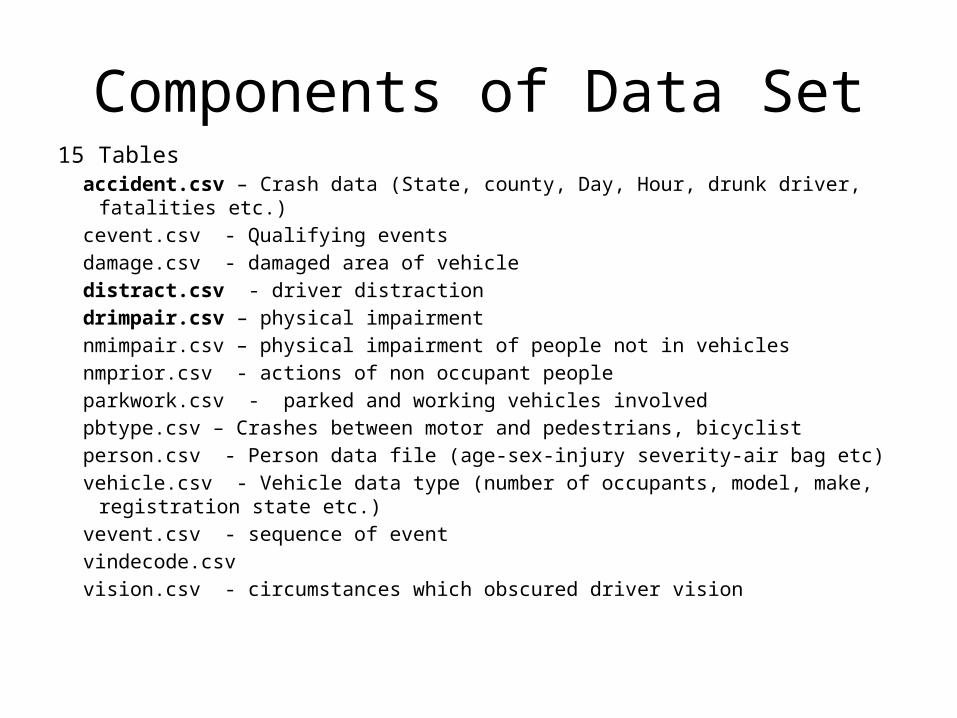
Components of Data Set15 Tables
accident.csv – Crash data (State, county, Day, Hour, drunk driver, fatalities etc.)cevent.csv - Qualifying eventsdamage.csv - damaged area of vehicledistract.csv - driver distractiondrimpair.csv – physical impairmentnmimpair.csv – physical impairment of people not in vehiclesnmprior.csv - actions of non occupant peopleparkwork.csv - parked and working vehicles involvedpbtype.csv – Crashes between motor and pedestrians, bicyclistperson.csv - Person data file (age-sex-injury severity-air bag etc)vehicle.csv - Vehicle data type (number of occupants, model, make, registration state etc.)vevent.csv - sequence of event vindecode.csv vision.csv - circumstances which obscured driver vision
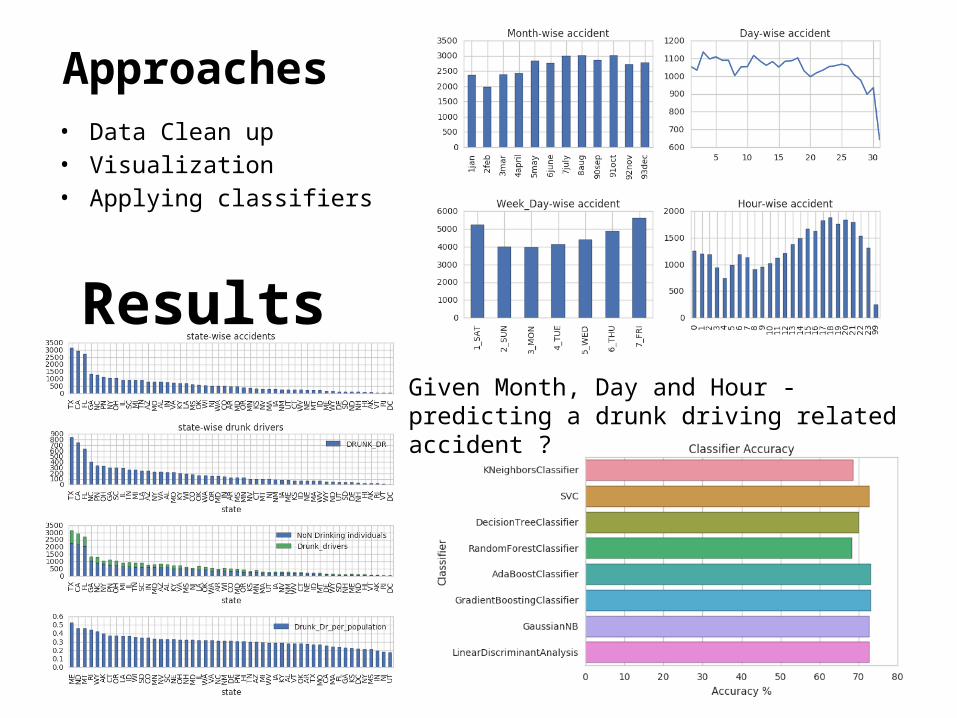
Approaches• Data Clean up• Visualization• Applying classifiers
Results Given Month, Day and Hour - predicting a drunk driving related accident ?
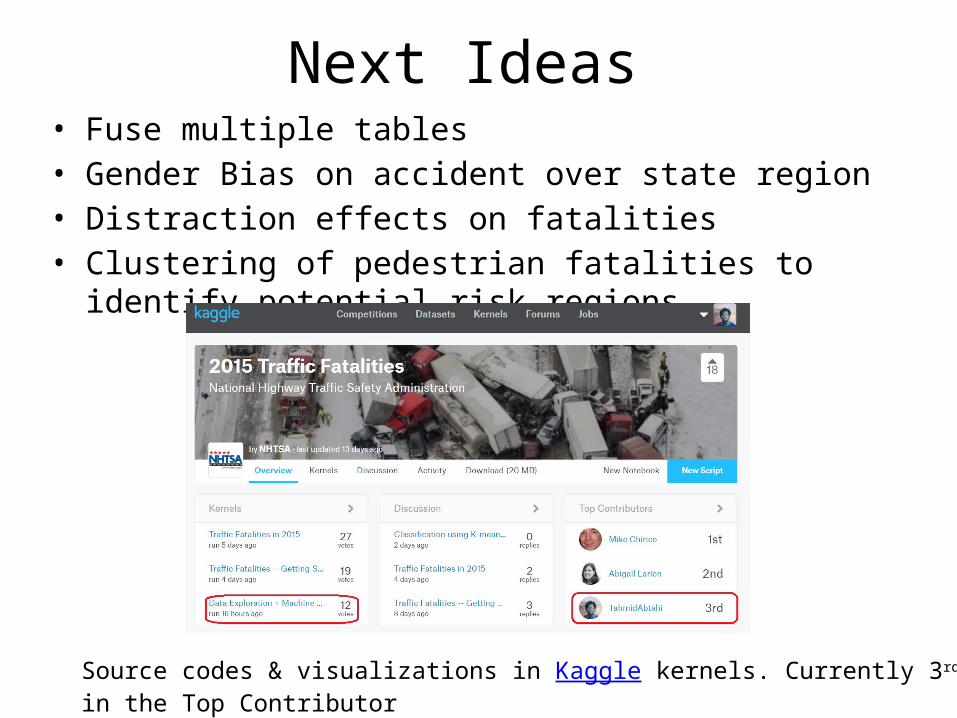
Next Ideas• Fuse multiple tables• Gender Bias on accident over state region• Distraction effects on fatalities• Clustering of pedestrian fatalities to identify potential risk regions
Source codes & visualizations in Kaggle kernels. Currently 3rd in the Top Contributor

Questions?