an analysis of the imo 2020 sulphur limit · 2018-10-24 · based on limited additional...
TRANSCRIPT

An Analysis of the IMO 2020 Sulphur Limit
Christophe Barret, Senior Oil Market Analyst
London 23 October 2018
© IEA 2016
Contents
• “Oil 2018 – Analysis and Forecasts to 2023” scenario (March 2018)
• New developments in the gasoil market
• Price impact
• Today versus Oil 2018 scenario

© IEA 2016
Oil 2018 outlook*
*“Oil 2018 – Analysis and Forecasts to 2023”, March 2018. IEA’s annual five-year oil market forecast.
• Need to understand how fuel oil and diesel demand will be impacted by
IMO 2020 in order to project future consumption.
• Starting point: lack of low sulfur molecules (marine gasoil or fuel oil) in
2020 will be the main constraint.
• We estimated c. 1 mb/d of diesel (in addition to inland requirements) will
be available for marine demand in 2020 from:
Refinery capacity developments
Crude availability
Refinery flexibility (yield shifts)

© IEA 2016
Oil 2018 scenario- HSFO Switch to MGO and VLSFO in 2020
0
500
1 000
1 500
2 000
2 500
3 000
3 500
2015 2016 2017 2018 2019 2020 2021 2022 2023
kb/d
Bunker HS FO Marine gasoil Marine VLSFO
0%
10%
20%
30%
40%
50%
60%
70%
80%
90%
2015 2016 2017 2018 2019 2020 2021 2022 2023
OECD and major-non-OECD bunker fuel switch by 2020
kb/d 2015 2016 2017 2018 2019 2020 2021 2022 2023
Marine gasoil 773 729 745 756 767 1,736 1,229 905 773
Marine VLSFO 0 0 0 0 0 969 1,496 1,849 2,018
Bunker HS FO 2,883 3,049 3,126 3,180 3,231 1,292 1,292 1,292 1,292
Total 3,656 3,778 3,872 3,937 3,997 3,997 4,017 4,047 4,084
Growth 3.3% 2.5% 1.7% 1.5% 0.0% 0.5% 0.7% 0.9%

© IEA 2016
Oil 2018 to Oil 2019l)
Based on limited additional availability of low sulfur molecules (~1 mb/d gasoil in 2020)
Comparison vs. 2019 (kb/d)2020 2021 2022 2023
A Drop in HSFO demand 1,939 1,939 1,939 1,939
B Additional marine gasoil 969 462 139 7
C = D + E + F New 0.5% Marine fuel 969 1,496 1,849 2,018
D HSFO blended in new 0.5% fuel 74 179 250 284
E Gasoil blended in new 0.5% fuel 295 717 999 1,134
F Very low sulfur fuel oil blended in 0.5% fuel 600 600 600 600
B+E Total gasoil needed 1,265 1,179 1,138 1,141
A-D Total HSFO surplus 1,865 1,759 1,689 1,655
= C+ B - A Total bunker 0 19 49 86

© IEA 2016
Changes in diesel demand – Europe’s disaffection
Diesel demand drop has happened faster than anticipated
• Slowdown in European gasoil demand
• German share of diesel cars in vehicle sales
fell from 41% in 1H17 to 31 % in 1H18.
• The disaffection towards diesel engine cars
is spreading all over Europe.
• EU economies are slowing
• Trade tensions and Brexit
• Strong deterioration in business
sentiment in Germany.
5.0
5.5
6.0
6.5
7.0
JAN APR JUL OCT
mb/d OECD Europe: Gasoil/Diesel Demand
Range 13-17 20172018 5-year avg
0.8
0.9
1.0
1.1
1.2
1.3
JAN APR JUL OCT
mb/d Germany: Gasoil/Diesel Demand
Range 13-17 20172018 5-year avg
© IEA 2016
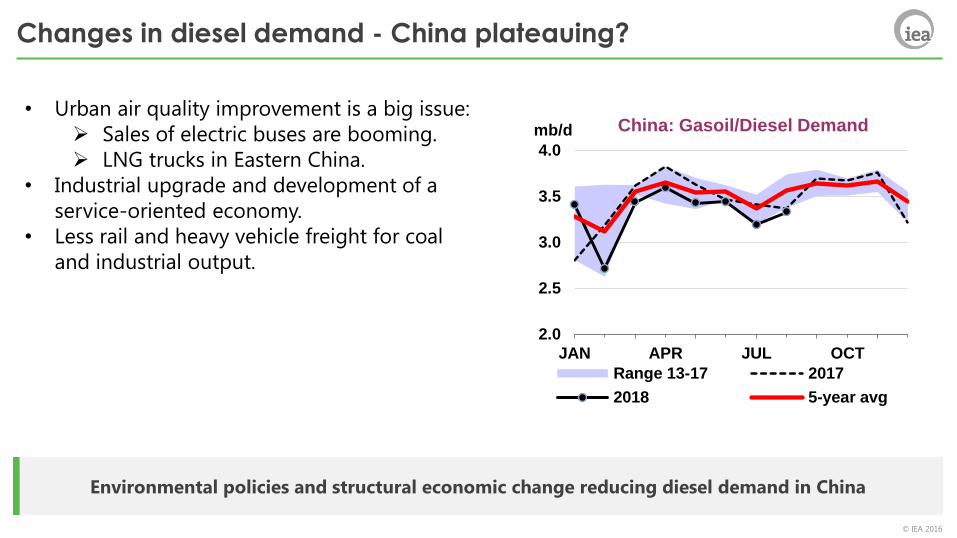
Changes in diesel demand - China plateauing?
Environmental policies and structural economic change reducing diesel demand in China
2.0
2.5
3.0
3.5
4.0
JAN APR JUL OCT
mb/d China: Gasoil/Diesel Demand
Range 13-17 2017
2018 5-year avg
• Urban air quality improvement is a big issue:
Sales of electric buses are booming.
LNG trucks in Eastern China.
• Industrial upgrade and development of a
service-oriented economy.
• Less rail and heavy vehicle freight for coal
and industrial output.

© IEA 2016
Changes in diesel demand – strength in the US
Diesel demand in the US should slow by 2020
• US diesel demand supported by rising imports of
goods and strong growth in industrial production.
• Shale oil production pipeline bottlenecks increased
reliance on trucks/rail to move crude oil.
• Diesel demand should slow in 2020:
Pipeline bottlenecks should ease in 2H19.
Trade flows likely to slow.
US fiscal expenses likely to slow in 2020.
3.4
3.6
3.8
4.0
4.2
4.4
4.6
JAN APR JUL OCT
mb/d US50: Gasoil/Diesel Demand
Range 13-17 20172018 5-year avg
© IEA 2016
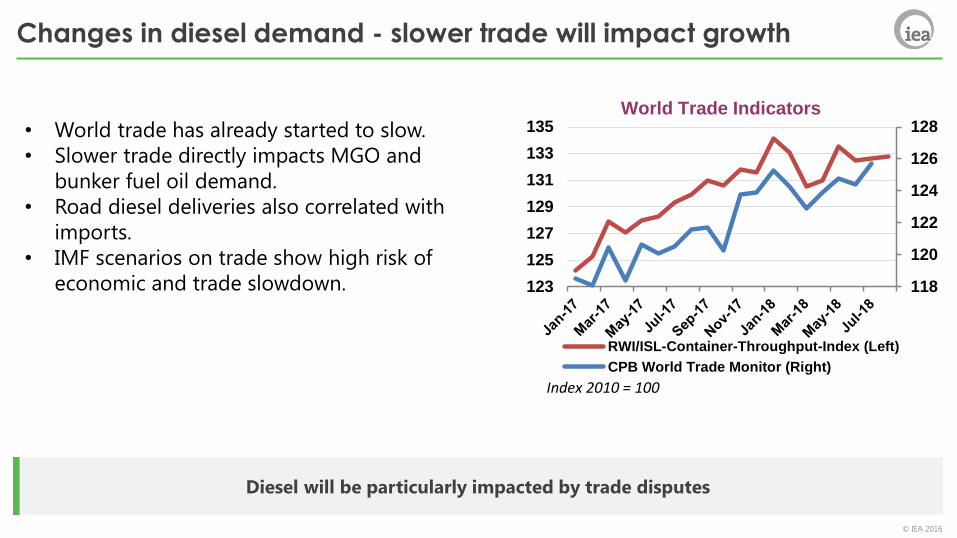
Changes in diesel demand - slower trade will impact growth
Diesel will be particularly impacted by trade disputes
118
120
122
124
126
128
123
125
127
129
131
133
135World Trade Indicators
RWI/ISL-Container-Throughput-Index (Left)
CPB World Trade Monitor (Right)
Index 2010 = 100
• World trade has already started to slow.
• Slower trade directly impacts MGO and
bunker fuel oil demand.
• Road diesel deliveries also correlated with
imports.
• IMF scenarios on trade show high risk of
economic and trade slowdown.

© IEA 2016
Price impact - history or elasticity
Diesel prices more than doubled in 2008. Lower spike anticipated in Oil 2018
0
20
40
60
80
100
120
140
160
180
Jan
2005
May 2
00
5
Se
p 2
005
Jan
2006
May 2
00
6
Se
p 2
006
Jan
2007
May 2
00
7
Se
p 2
007
Jan
2008
May 2
00
8
Se
p 2
008
Jan
2009
May 2
00
9
Se
p 2
009
Jan
2010
May 2
01
0
Se
p 2
010
Jan
2011
May 2
01
1
Se
p 2
011
Jan
2012
May 2
01
2
Se
p 2
012
Jan
2013
May 2
01
3
Se
p 2
013
Jan
2014
May 2
01
4
Se
p 2
014
Jan
2015
May 2
01
5
Se
p 2
015
Jan
2016
May 2
01
6
Se
p 2
016
Jan
2017
May 2
01
7
Se
p 2
017
Jan
2018
May 2
01
8
Se
p 2
018
Gasoil prices ands cracks in Europe
gasoil prices ($/bl) gasoil cracks ($/bl)
• With low demand response to prices,
diesel prices must significantly
increase to cut demand.
• In Oil 2018 we assumed bunkers
would need 200-250 kb/d of diesel
from inland demand to achieve the 1.2
mb/d -1.3 mb/d needed for the
switch.
• Equivalent to 20% to 30% increase in
prices.
• To switch all remaining HSFO to diesel,
prices would have to ~double to
balance 1 mb/d additional marine
gasoil use.

© IEA 2016
Possible Price Impact
Price increase needed to rebalance markets depends on scrubbers, compliance and diesel availability
-1,600
-1,400
-1,200
-1,000
-800
-600
-400
-200
0
0.00% 50.00% 100.00% 150.00% 200.00%
Die
sel
Cu
ts (
kb/d
)
Price increases
kb/d
HSFO to switch 3200 3200 3200 3200 3200 3200 3200 3200
VLSFO 1000 1000 1000 1000 1000 1000 1000 1000
Existing fo ls 600 600 600 600 600 600 600 600
blend for VLSFO 400 400 400 400 400 400 400 400
HSFO in blend 80 80 80 80 80 80 80 80
Gasoil in Blend 320 320 320 320 320 320 320 320
Scrubbers 200 250 300 350 400 450 500 550
Compliance 90% 88% 86% 84% 82% 80% 78% 76%
MGO needed 2000 1886 1772 1658 1544 1430 1316 1202
Gasoil availability 950 980 1010 1040 1070 1100 1130 1160
Gasoil Deficit -1050 -906 -762 -618 -474 -330 -186 -42
Diesel price increase 125% 108% 91% 74% 56% 39% 22% 5%
With Gasoil demand at 28
mb/d and Ep at -0.03

© IEA 2016
Conclusion: differences today vs. Oil 2018
• Higher oil prices, weaker economic outlook – mean lower demand growth &
higher supply e.g. US.
• Slightly more diesel – VLSFO could be available from refining.
• Diesel demand fundamentals have deteriorated.
• Under a scenario similar to that of Oil 2018 (100% HSFO 30% VLSFO, 30%
MGO, 40% HSFO):
Diesel may be less stretched due to lower inland demand growth.
Realistic scenario today may be closer to 30% VLSFO, 40% MGO and 30%
HSFO.
• Given recent market developments, impact on prices will depend on:
Scrubbers installed – some recent acceleration in orders.
Logistical constraints
Compliance