an analysis on domestic airlines capacity ......received from airlines operator for the domestic...
TRANSCRIPT
http://www.iaeme.com/IJM/index.asp 38 [email protected]
International Journal of Management (IJM)
Volume 6, Issue 12, Dec 2015, pp. 38-49, Article ID: IJM_06_12_004
Available online at
http://www.iaeme.com/IJM/issues.asp?JType=IJM&VType=6&IType=12
ISSN Print: 0976-6502 and ISSN Online: 0976-6510
© IAEME Publication
___________________________________________________________________________
AN ANALYSIS ON DOMESTIC AIRLINES
CAPACITY PERFORMANCE IN INDIA
A. Thirunavukkarasu
Scholar, Research & Development., Bharathiyar University, Coimbatore, India
V. R. Nedunchezian
Professor, KCT Business School, Coimbatore, India
ABSTRACT
Capacity Growth and Utilisation are the leading indicators of Airlines
performance. This paper compares the Airlines capacity growth and
utilisation of Full Service Airlines and Low Cost Airlines. The data for the
study were taken from Directorate General of Civil Aviation websites from
2005 to 2015. The findings indicate that Low Cost Airlines are able to deploy
higher capacity growth and utilise the capacity during the last 10 year.
However, in response to excellent performance of Low Cost Airlines in a short
span of time, Full Service Airlines have been fighting hard to achieve higher
capacity utilisation, matching the levels achieved by Low Cost Airlines. The
gap between the Low Cost Airlines and Full Service Airlines operating performance are narrowing down as a result of competitive fares, further
study establish that distinction between Full Service Airlines and Low Cost
Airlines no longer exists in Indian market and passenger are not having any
preference on business models for their travel choice.
Key words: Capacity, Airlines, Low Cost, Full Service, Load Factor, Seat
Factor
Cite this Article: A. Thirunavukkarasu and V. R. Nedunchezian. An Analysis
on Domestic Airlines Capacity Performance in India. International Journal of
Management, 6(12), 2015, pp. 38-49.
http://www.iaeme.com/IJM/issues.asp?JType=IJM&VType=6&IType=12
1. INTRODUCTION
Airlines Industry is a fascinating market with high standard of safety and security
embedded to it. The industry has been de-regulated with many liberal policies
encouraging more people to travel in Air. The industry has transformed from the
highly regulated to Competitive environment after the gradual liberalised policy
followed in successive years.This de-regulation process started with United States of
America in 1978 and proceeded to rest of the world namely, Europe, Australia, Asia
and Middle East etc. In India, the de-regulation process started with the repeal of Air

An Analysis on Domestic Airlines Capacity Performance In India
http://www.iaeme.com/IJM/index.asp 39 [email protected]
Corporation of India in 1994. As a result of liberation process, private airlines entered
the market in 1993 and deployed the capacity on most lucrative metro sectors, but
they are not lowering the prices but improved the service quality of the service. This
ensured better return on investment for start up private Airlines.
Airlines business market primarily consists of legacy, low-cost and regional
operators. Legacy airlines, also called as network airlines was only business model in
India for the long time. The network airlines operates with hub and spoke model with
thousands of employees on their payroll, mixed aircraft types to meet the route
economics, roomy seats, frequent flyer programs, connects to both domestic and
international destinations. Low Cost business model concept has attracted much
attraction all over the world and Airlines business is no exception. The Low Cost
Carriers expanded the market on new routes and newer markets, which was
unexplored by the legacy carrier (Civil Aviation Authority, 2006). The operating
performances of LCC are phenomenal in short span of time and marching towards in
capturing more market share from the FSC. The liberalised policy of Aviation in India
in successive years encouraged Low Cost Carriers to enter into the market with
business model as similar to Southwest Airlines of US. Air Deccan, was the first to
enter into airlines business with low cost operation structure, revolutionised the
business and many airlines followed with Low Cost Carrier (LCC) concept. Low Cost
Airlines operates with only or few types of aircraft connecting point to point
destinations. Low Cost Carrier have been showing strong influence in the market as
they changed the fundamental way of doing the business. It revolutionalized the short
haul airline market, radically changing the fares and choice of airlines (Civil Aviation
Authority, 2006).
The performance of the Airlines has been improving in the recent years on many
operating parameters which are vital to the operations of the Airlines and increase of
profitability. The performance of the domestic airlines for a longer period of 20 years
grew at an annual average rate of 10.4 % and in the last two decades, the fastest
growth in overall domestic air traffic in India was witnessed during 2004-05 to 2010-
11 at the rate of 18.5 % (Working group civil aviation sector, 2012). They have been
many studies done on comparing financial performance of Airlines, but there is no
study done on comparing operating capacity performance of Airlines. The operating
parameters are (1) Passenger load factor (2) Revenue Passengers travelled (3)
Revenue Passenger Kilometer (4) Available Seat Kilometer (Working group Civil
Aviation sector, 2012). Passenger load factor, measure of revenue passenger travelled
to the Aircraft capacity on any stage length, is the primary operating parameter and is
determined by many parameters viz (1) Convenient time of the day (2) Average
Airfare (3) demand supply of the particular stage length.
The motivation for this paper is to understand the Airlines capacity growth and
utilisation in Indian domestic The study will compare the operating capacity and
utilisation of Full Service Airlines and Low Cost Airlines operating in domestic
market of India as it has high impact on market share. This paper will contribute to
literature on understanding on Airlines capacity performance in the Indian domestic
market.
A. Thirunavukkarasu and V. R. Nedunchezian
http://www.iaeme.com/IJM/index.asp 40 [email protected]
2. LITERATURE REVIEW
Assaf (2009) concluded that Airlines should adopt benchmarking procedure to
perform a continuous evaluation of their performance against the operational
strategies and make corrective actions. However, the results can be validated with
qualitative study of the major airlines. Factors like Load factor and Airlines size are
significantly related to technical efficiency of the Airlines. Barros (2009) found that
there was growth trend in operational performance of the European airlines. Ajayi
(2010) study indicated that US large Airlines are not efficient than smaller Airlines of
US by using data from 1977 to 2007. However, US large Airlines have superior
optimal mix of resources than smaller Airlines. They further showed that higher
efficiency are associated with higher net profit margins. Asaaf (2012)study found that
European Airlines are slightly better performers than US Airlines. The study further
established that Low Cost Airlines are better performer than most Full Service airlines
in both US and Europe. Low Cost Airlines success is based on improved productivity
of Labour and Aircraft utilisation.
Backx (2002) found that there was no relationship between ownership and load
factors but public airlines utilise the aircraft less intensively than private airlines.
Also, the ownership structure remains the consideration, factors such as (1) Scale and
scope advantage, (2) Wealth and existence of competition in a home market, (3)
Geographic region of origin have important impact on Airlines Performance.
Evangelho (2005) indicated that business travellers of large firm use Full Service
Airlines, but there seems no indication that there exists no prejudice against the LCC
in the Brazil market. Fourie (2006) reiterated that South Africa business travellers
working for large companies were more likely to use Full Service Airlines and South
Africa Business travellers with small to medium size companies would like to use
Low Cost Airlines. Daraban(2012) found that convergence has been taking place
between the competing LCC and FSC business models as labor Cost , yield and
airport Services are similar in nature. LCC revolution in the US airline industry still
continues and equilibrium may be emerged depending upon the response of the Full
ServiceAirlines. Pasari (2006) emphasised that there was huge demand potential
available in India for Low Cost Airlines as there were unfulfilled demand in the
country not unfulfilled by network airlines or Full Service airlines as growing middle
class would like to fly for a cheaper price. However, Low Cost Airlines have serious
limitation of punctuality i.e On Time Performance and poor service quality level.
Many studies used ATKM (Available Tonne Kilometre) as output measures of
Airlines operating performance (Schmidt and Sickles., 1984 ; Barla and Perelman.,
1989 ; Cornwall, Schmidt, and Sickles.,1990 ; Distexhe and Perelman., 1994 ; Good
et al., 1995 ; Oum and Yu .,1995 ; Baltagi, Griffin and Rich.,1995 ; Ahn, Good and
Rich ., 1995 ; Coelli et al.,1999; Barbot et al.,2008 ; Barros and Paypoch., 2009) as
the best measurement variable based on one or combination of inputs used (1) Labour
index (2) Materials (3) Energy (4) Capital reserves (5) Aircraft capacity (6) No of
Planes (7) Flight Equipment (8) Number of Employees (9) Fuel - Gallons consumed
(10) Operational Costs. Airlines Manager uses inputs, which are mostly discretionary
and within their command, to maximise the capacity available to the passengers for
their choice of Convenient time and frequency on the particular route. Duliba (2001)
found that number of departures and advertising expenses are considered to increase
the Load factor in US but in Jenatabadi (2006) study, Computerised system, shorter
average length, Private organisation and change in vehicle kilometre were having
influence on load factor in Iran. Cho (2007) confirms that operational factor such as

An Analysis on Domestic Airlines Capacity Performance In India
http://www.iaeme.com/IJM/index.asp 41 [email protected]
capacity have important effect on Load factor. Baltagi et al.,(1998) found that excess
capacity is a fundamental reason for losses in the US Airlines industry. Jenatabadi
(2014) observed that economic situation has strong effect on the internal operation
and performance of the Airlines and the indirect effect is more stronger than direct
effect by analyzing 214 Airlines that differs in operations.
Therefore, It is observed that Low Cost Airlines are gaining the momentum all
over the world and they have been showing better operational performance and excess
capacity be the most important contributor of Airlines losses. In India, Low Cost
Airlines operation is new phenomena which is stimulating the market in an
unprecedented way of attracting the passengers. They have able to gain market share
by deploying higher capacity and better capacity utilisation than Full Service Airlines.
However, many startup airlines ceased their operations in the last decade as they have
incurred huge financial losses due to several factors such as excess capacity in the
market, High Aircraft Turbine Fuel Cost, seasonal demand etc. From the extant
literature available on performance and business models studies, there was no study
done in India to compare the capacity performance of Low Cost and Full Service
Airlines business model. Therefore, this will be first study to provide the insights on
comparing operating capacity performance of both business models of the Airlines.
3. DATA COLLECTION
The data for the study was taken from Director General of Civil Aviation website
(www.dgca.nic.in) for the last 10 years available which is the compilation of the data
received from Airlines operator for the domestic operation services. The data was
collected for the 10 year period from 1.4.2005 to 31.03.2015. The operations of Indian
Airlines , Air India , Alliance Air, Jet Airways, Kingfisher Airlines and Paramount
Airways are classified as Full Service Airlines and other Airlines namely Air India
Express, Indigo , Spicejet, Go Airlines and Air Deccan are offering limited or basic
service to the passengers and classified as Low Cost Carriers. It is noted that Indian
Airlines, Air India, Alliance Air and Air India Express are Govt Owned Airlines and
Kingfisher, Air Deccan, Paramount Airways, Indigo, Spicejet, Go Airlines are
privately owned Airlines. During the study period, operations of Govt Owned Full
Service Airlines namely Air India and Indian Airlines have been merged as single
entity as Air India in 2007. Another Full service Airlines, Jet Airlines acquired Sahara
Airlines operations in 2007 which have been positioned as Full Service Airlines and
renamed as Jetlite as a Lowest Cost Carriers. Similarly, Full Service Airlines,
Kingfisher Airlines took over Low Cost Airlines, Air Deccan operations and merged
as single corporate entity in 2007. However, owing to heavy losses, Kingfisher
Airlines ceased its operations in 2012 as a combined entity. Paramount Airways, late
entrant to Full Service Airline category, started its operations in 2005 as regional
airline, but stopped its operations in 2010.

A. Thirunavukkarasu and V. R. Nedunchezian
http://www.iaeme.com/IJM/index.asp 42 [email protected]
4. DATA ANALYSIS
4.1. Capacity expansion of the Airlines market
Though Low Cost Airlines offered ATKM and ASKM capacity are lower than
Full Service Airlines as they have entered the market in 2003 but they have steadily
increased the unprecedented capacity in the market (annual ATKM growth – 47 %
and annual ASKM growth - 46.6 %). Full Service Airlines capacity growth is very
modest (ATKM 2.2 % annual growth and ASKM 1.2 % annual growth) as they have
not deployed more capacity in domestic market. However, Full Service Airlines have
flexibility to deploy more Aircraft capacity on international operations substantially
instead of domestic operations as Govt of India relaxed the flying rules to Foreign
countries by allowing Airlines having 20 Aircraft and 5 years experience in domestic
flying. The capacity offered in terms of ATKM and ASKM are output parameter of
(1) Aircraft fleet (2) Seating capacity (3) Aircraft flying hours (4) Short haul flying
operation. The comparison of Aircraft fleet (Table 1) indicates that Full Service
Airlines are able to increase the Aircraft fleet capacity modestly whereas Low Cost
Airlines have ordered quite large number of Aircraft for their operations aggressively
as they have forecasted Indian Market as having huge potential for air travel due to
(1) De-regulation of domestic operations (2) High GDP growth (3) Concentration of
Urban population (4) Low penetration of air travel market 0.05 trips per annum
compared to 2.02 trips per annum in US (5) Expansion of Middle Income Population.
2538 2955 3346 3485 3577 3721
4186 3273 3112 3089 948
1795 2632 2419 2546
3058 3846
4500 5059 5405
0
2000
4000
6000
Y 05-06 Y 06-07 Y 07-08 Y 08-09 Y 09-10 Y 10-11 Y 11-12 Y 12-13 Y 13-14 Y 14-15
ATKM - FSC VS LCC
Full Service Carrier Low Cost Carrier
0
10000
20000
30000
40000
50000
60000
Y 05-06 Y 06-07 Y 07-08 Y 08-09 Y 09-10 Y 10-11 Y 11-12 Y 12-13 Y 13-14 Y 14-15
FSC LCC
ASKM - FSC Vs LCC

An Analysis on Domestic Airlines Capacity Performance In India
http://www.iaeme.com/IJM/index.asp 43 [email protected]
Table 1 Comparison of Aircraft fleet of the Airlines
Month IC AI AIX CD Jet JL Idgo Sjet GO AD KF PM Tot
Y 05-06 55 38 4 15 53 29 0 5 3 29 11 1 243
Y 06-07 59 35 13 15 63 27 8 11 5 39 25 5 305
Y 07-08 72 23 18 20 81 25 17 19 6 41 41 5 368
Y 08-09 72 31 21 16 88 24 19 19 7 83 5 385
Y 09-10 76 33 25 17 88 25 25 20 8 66 0 383
Y 10-11 77 29 21 14 98 18 38 27 10 66 0 398
Y 11-12 94 21 11 103 19 55 40 12 0 0 355
Y 14-15 107 17 11 115 98 38 19 0 0 405
Source: DGCA, India & Websites
Among the Low Cost Airlines, Indigo Airlines capacity growth during the study
period is the highest among all the Airlines operating in the domestic market. Indigo
Airlines ordered 100 narrow body Aircraft at Paris Air show and received the delivery
as per planned schedule, which was major contributing factor for the massive capacity
augmentation of Low Cost Airlines business in the India market. Kapil Kaul of Center
for Asia Pacific Aviation (2012) said while “ IndiGo has increased weekly capacity
by over 30 per cent in a year, Jet Airways has been moderating its domestic capacity
growth over the last few years with capacity growth coming largely due to changes in
aircraft configuration, which increased more seats with the launch of Jet Konnect.
IndiGo has gone for a long-term expansion plan instead of getting swayed by short-
term changes in the market. That has paid off”. Similarly, Spicejet Airlines capacity
addition is consistent with the market requirement. Go Air capacity share growth was
the least among the airlines operating in the market.t it is also noted that Kingfisher
Airlines acquired aircraft at a steady pace including orders released by Air Deccan but
they were not able to sustain the operations as they have faced severe financial losses
and ceased their operation.
4.2. Capacity Share Dominance
Full Service Airlines have been dominating Indian market till the year 2003 as Low
Cost Airlines have no presence in the market and continue to lead over Low Cost
Airlines till 2011-12. But, within the span of 8 years in the business, Low Cost
Airlines are able to increase the capacity share both in terms of ATKM and ASKM i.e
from 2011-12 as they have added more Aircraft in their fleet. The sudden shift in
capacity happens as Full Service Airlines not able to increase the capacity growth due
to deployment of capacity in International market as compared to Low Cost Airlines.
Moreover, Jet Airways, after acquiring Sahara Airlines, converted into Low Cost
Airlines to take advantage of passenger trend in using Low Cost Airlines service.

A. Thirunavukkarasu and V. R. Nedunchezian
http://www.iaeme.com/IJM/index.asp 44 [email protected]
Table 2 Comparison of capacity share of Airlines Business Model
Year
Capacity Share in %
ATKM ASKM
FSC LCC FSC LCC
Y 05-06 73 27 72 28
Y 06-07 62 38 66 34
Y 07-08 56 44 60 40
Y 08-09 59 41 57 43
Y 09-10 58 42 56 44
Y 10-11 55 45 53 47
Y 11-12 52 48 48 52
Y 12-13 42 58 39 61
Y 13-14 38 62 35 65
Y 14-15 36 64 34 66
4.3. Capacity utilisation of Airlines Business Model
During the study period, Load factors of Full Service Airlines has been declining
from 2005-09 as a result of entry of Low Cost Airlines to reach to 56 % and gradually
rising to higher level to 70 % due to aggressively selling of their tickets at competitive
rates . In response to poor capacity utilisation, Full Service Airlines stopped adding
more capacity in the domestic market by retiring the fuel inefficient aircraft from the
fleet, As a result, the capacity utilisation of Full Service Airlines have been steadily
increased to reach 70 % in 2014-15. Low Cost Airlines was able to achieve higher
capacity utilisation than Full Service Airlines as result of low fares initially. However,
Low Cost Airlines capacity utilisation declined steadily till 2008-09 as they were not
able to maintain the lowest fares for long time as major input cost, Aircraft Turbine
Fuel were increasing in the market threatening the survival of the Airlines operations.
As a result, Low Cost Airlines calibrated the capacity growth along with decrease in
ATF cost, contributed to increase of capacity utilisation for another 2 years. The
economic recession along with increase in ATF cost during the period 2010-14
contributed for further reduction of capacity utilisation of Low Cost Airlines.
There is decline in load factor of both Full Service and Low cast Airlines from
2010 to 14 from the peak achieved in 2010-11 but the drop in percentage is higher in
case of Low Cost Airlines than Full Service Airlines. At the end of study period, Full
Service Airlines have been able to achieve higher capacity utilisation, matching with
Low Cost Airlines and the gap in the capacity utilisation is narrowing down between
Full Service Airlines and Low Cost Airlines. The higher capacity utilisation of Full
65 64 62 56 59 63 62 61 63 70
72 68 71 64
75 79 74 72 70 76
40
90
Y 05-06 Y 06-07 Y 07-08 Y 08-09 Y 09-10 Y 10-11 Y 11-12 Y 12-13 Y 13-14 Y 14-15
LOAD FACTORS - FSC VS LCC
Full Service Carrier Low Cost Carrier
An Analysis on Domestic Airlines Capacity Performance In India
http://www.iaeme.com/IJM/index.asp 45 [email protected]
Service Airlines, could be aggressive marketing their service by offering competitive
fare matching the low cost Airlines with high service standards.
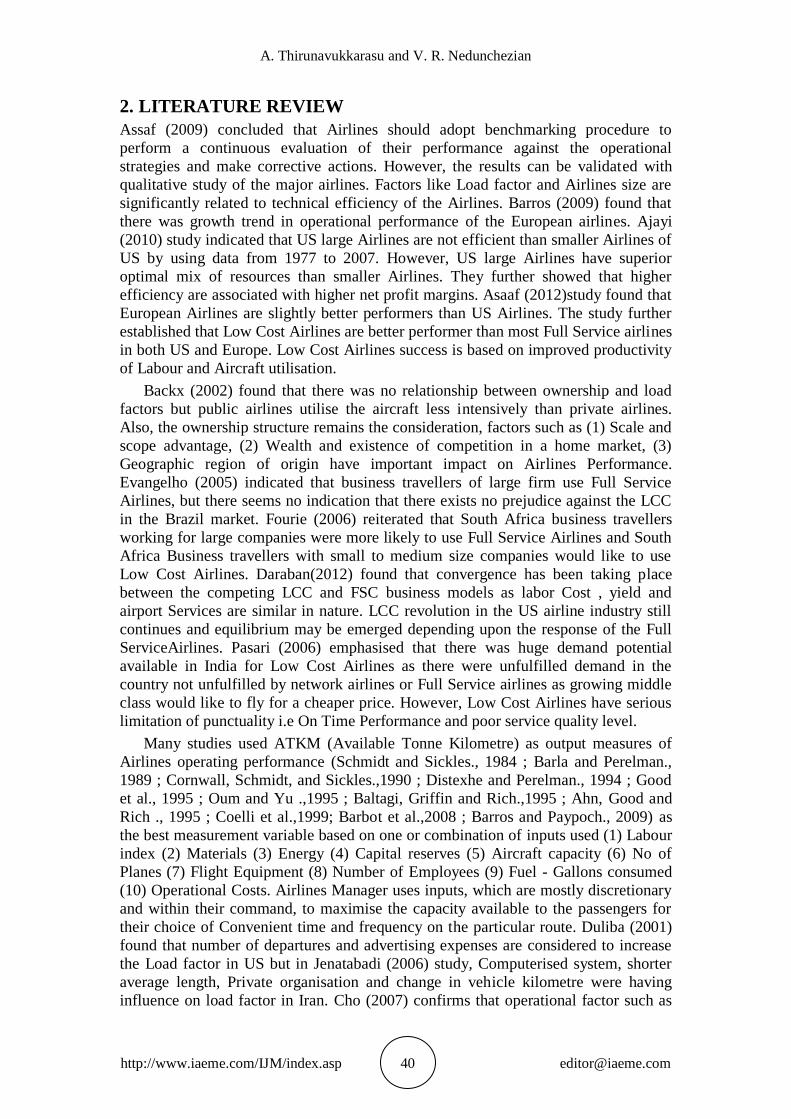
Both Full Service Airlines and Low Cost Airlines seat factors i.e Aircraft seat
capacity utilisation declined simultaneously for the period from 2005 to 2009 and
matched each other in the year 2009. Again, Full Service Airlines and Low Cost
Airlines seat factors increased from 2009 to higher level in 2011 and again declined
from 2011 to 2014. It is interesting to observe 2 factors (1) Low Cost Airlines seat
capacity utilisation is higher than Full Service Airlines during the study period.(2) At
the end of study period, Full Service Airlines seat capacity utilisation starts matching
with Low Cost Airlines. The entry of Low Cost Airlines in the market from the
beginning impacted the capacity utilisation of Full Service Airlines. The Low Cost
Airlines capacity utilisation decline during the beginning of the study period till FY
2008-09 was marginal but reduction was significant in 2008-09. Similarly, the
capacity utilisation of Full Service Airlines, dropped sharply to all time low of 52 % ,
as they were taken by surprise growth of Low Cost carrier (LCC) and could not fill
the capacity due to innovative marketing strategy of low promotion fares offered. The
capacity utilisation of Low Cost Airlines declined sharply to match with capacity
utilisation of Full Service Airlines in 2013-14. During the last year of the study period
2014-15, both Low Cost Airlines and Full Service Airlines have increased the
capacity utilisation but converging as compared to last several years. The decline in
capacity utilisation of both Full Service and Low Cost Airlines happened to coincide
with decline of passenger growth due to high increase of Aircraft Turbine fuel price
and global recession.
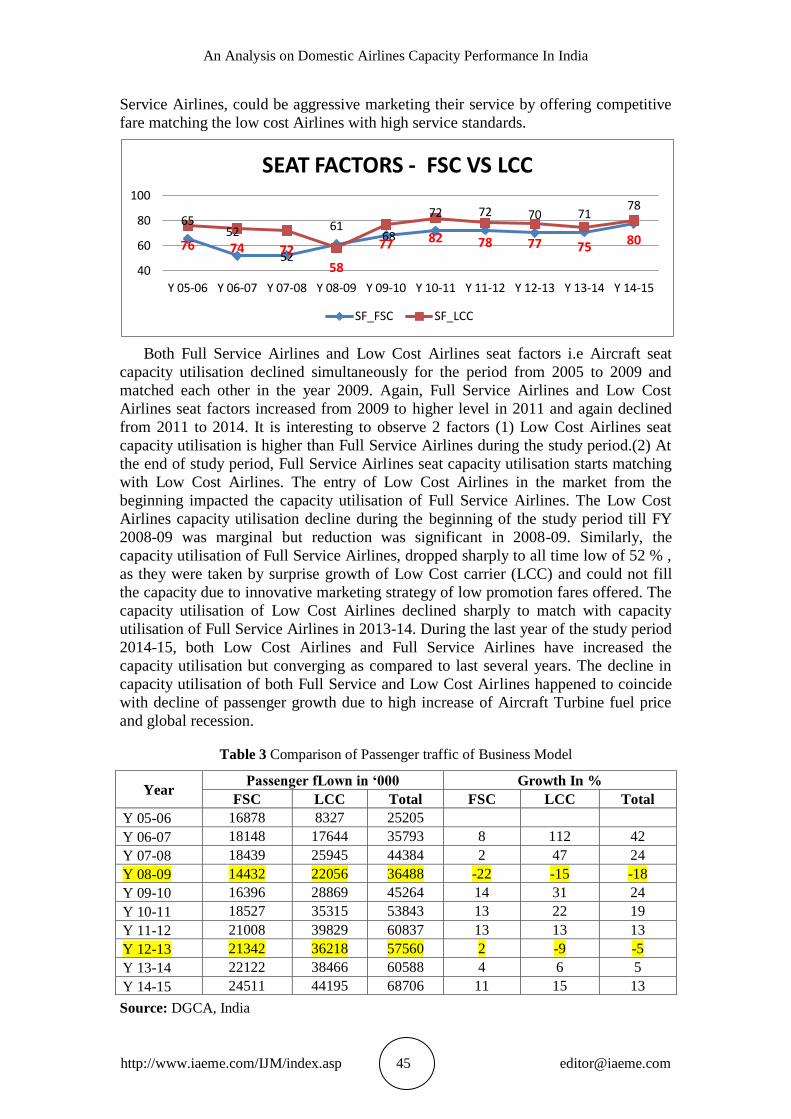
Table 3 Comparison of Passenger traffic of Business Model
Year Passenger fLown in ‘000 Growth In %
FSC LCC Total FSC LCC Total
Y 05-06 16878 8327 25205
Y 06-07 18148 17644 35793 8 112 42
Y 07-08 18439 25945 44384 2 47 24
Y 08-09 14432 22056 36488 -22 -15 -18
Y 09-10 16396 28869 45264 14 31 24
Y 10-11 18527 35315 53843 13 22 19
Y 11-12 21008 39829 60837 13 13 13
Y 12-13 21342 36218 57560 2 -9 -5
Y 13-14 22122 38466 60588 4 6 5
Y 14-15 24511 44195 68706 11 15 13
Source: DGCA, India
65 52
52
61 68
72 72 70 71 78
76 74 72 58
77 82 78 77 75 80
40
60
80
100
Y 05-06 Y 06-07 Y 07-08 Y 08-09 Y 09-10 Y 10-11 Y 11-12 Y 12-13 Y 13-14 Y 14-15
SEAT FACTORS - FSC VS LCC
SF_FSC SF_LCC
A. Thirunavukkarasu and V. R. Nedunchezian
http://www.iaeme.com/IJM/index.asp 46 [email protected]
5. DISCUSSIONS
The increase in capacity of the Low Cost Airlines can be attributed by adding (1)
Narrow Body Aircraft to the fleet to deploy flights on regional routes, which was not
catered by Full Service Airlines. (2) More seats per Aircraft in single configuration
rather than two class configuration, (3) Higher Aircraft Hours operations. The
stagnant growth of the capacity deployed by Full Service Airlines can be due to (1)
High operating cost including Aircraft Turbine Fuel (2) Global recession in the
market (3) Passenger preference to travel on low promotional fares (4) Lower
productivity on Aircraft utilisation and Labour.
The Low Cost airlines were able to fill the capacity by (1) Leisure traveller from
Non Metro cities (2) Business traveller of small and medium companies for their
business trips. These segment of passenger are generally middle income group and
expanding in the country. They were first time passengers who have been using rail
service for their travel needs and untapped demand for the Air travel. They are willing
to use Air service for transportation needs but they could not use it as travel cost
involved were very high. Low Cost Airlines innovative promotional low fare to attract
the first time passenger, helped middle income group and encouraged common people
to become travelling passengers on the flights. As ticket price of Low Cost Airlines
was low and comparable with rail fare, many passengers travelling on rail have
switched over to Low Cost airlines, for comfort and saving time even for short haul
distance upto 750 kms. It can be concluded that Passenger growth have been
increasing exponentially during the last 10 years in Indian market as Low Cost
Airlines were able to fulfil the demand not met by Full Service Airlines. This study
supports Pasari (2006) emphasis that there is huge demand potential available in India
for Low Cost Airlines as there are unfulfilled demand in the country not unfulfilled by
network airlines or full service airlines as growing middle class would like to fly for a
cheaper price.
Low Cost Airlines in India established that they have been performing better than
Full Service Airlines in adding Capacity and Utilisation of Capacity deployed. This
fact supported the findings of Asaaf (2012) that Low Cost Airlines are better
performer than most Full Service airlines. This is validated in Indian Market also. The
study provide ample evidence that LCC revolution continues in Indian Airlines
industry. As the competition is maturing, Full Service Airlines are able to match Load
Factor (FSC 70 % Vs LCC 76 % in 2015) and Seat factor (FSC 78% Vs LCC 80 % in
2015) of Low Cost Airlines. The result provides an interesting question on whether
Full Service Airlines will be able to maintain the Load Factor and Seat Factor in
future by offering similar fare on competitive routes.
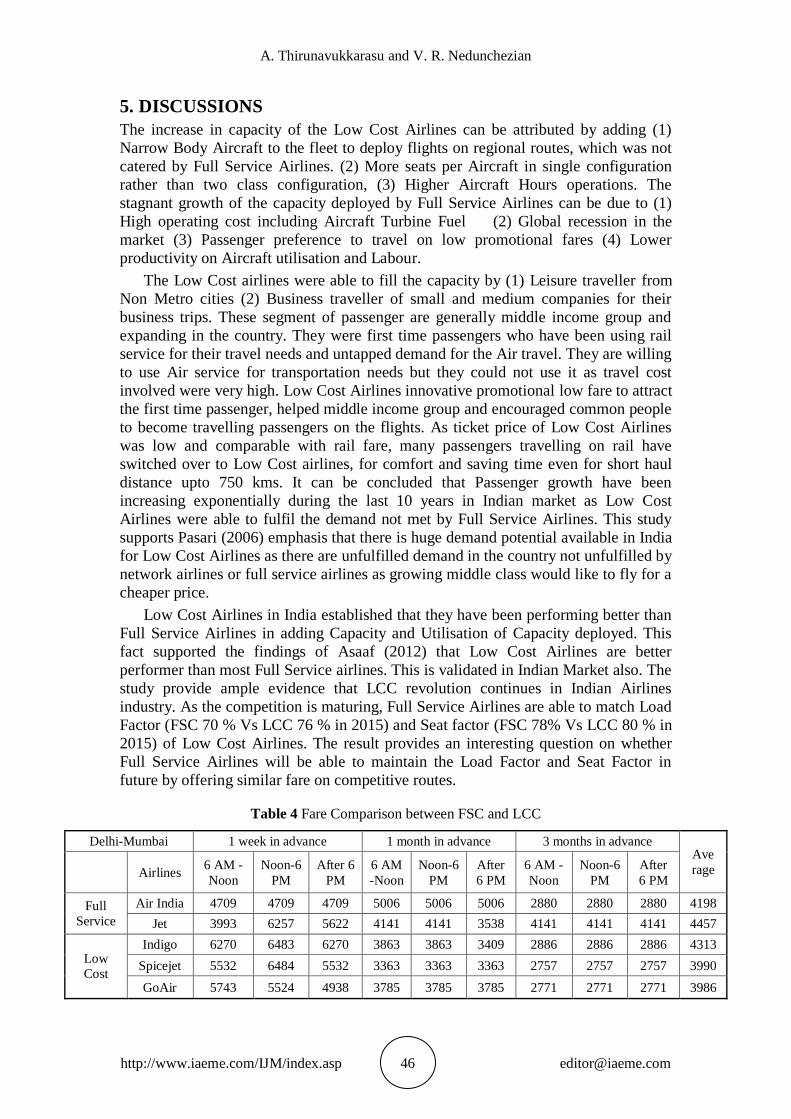
Table 4 Fare Comparison between FSC and LCC
Delhi-Mumbai 1 week in advance 1 month in advance 3 months in advance Ave
rage
Airlines 6 AM -
Noon
Noon-6
PM
After 6
PM
6 AM
-Noon
Noon-6
PM
After
6 PM
6 AM -
Noon
Noon-6
PM
After
6 PM
Full
Service
Air India 4709 4709 4709 5006 5006 5006 2880 2880 2880 4198
Jet 3993 6257 5622 4141 4141 3538 4141 4141 4141 4457
Low
Cost
Indigo 6270 6483 6270 3863 3863 3409 2886 2886 2886 4313
Spicejet 5532 6484 5532 3363 3363 3363 2757 2757 2757 3990
GoAir 5743 5524 4938 3785 3785 3785 2771 2771 2771 3986

An Analysis on Domestic Airlines Capacity Performance In India
http://www.iaeme.com/IJM/index.asp 47 [email protected]
Delhi-Chennai 1 week in advance 1 month in advance 3 months in advance
Ave
rage
Airlines 6 AM -
Noon
Noon-6
PM
After
6 PM
6 AM-
Noon
Noon-6
PM
After 6
PM
6 AM -
Noon
Noon-6
PM
After 6
PM
Full
Service
Air India 5175 5175 5175 6645 6645 6645 4900 4900 4900 5573
Jet 4124 4124 4124 6821 6821 6218 4315 4315 4315 5020
Low Cost Indigo 5144 4170 4170 6238 6238 6238 4170 4170 4170 4968
Spicejet 4262 4262 4262 4950 4950 4950 4051 7701 7701 5232
Source: www.makemytrip.com data as on 18.11.2015.
The comparison of fares ( Table: 4 ) provides evidence that there is no much
difference between the fares between the Full Service and Low Cost Airlines for
ticket booked in 1 week advance, 1 month advance and 3 months advance for the
competitive sector, Delhi - Chennai and Delhi-Mumbai. Both Full Service and Low
Cost Airlines capacity utilisation are almost similar and offering competitive pricing
policy, the comparative analysis supports Daraban (2012) finding that convergence
has been taking place between the competing LCC and FSC business models in
Airlines market. The capacity growth (ATKM & ASKM ) and capacity utilisation(
Load Factors and Seat Factors ) of the state owned Airlines such as Indian Airlines,
Air India, Alliance Air and Air India Express have not been better than private
airlines such as Jet Airways , Indigo , Spicejet and Go Airlines. The analysis does not
support Backx (2002) finding that there was no relationship between ownership and
load factors. .
6. FINDINGS
The study analysis provides lot of insights of Airlines capacity growth and utilisation
and the findings are summarised as follows (1) The capacity growth and utilisation of
capacity of Low Cost Airlines is higher than Full Service Airlines during the study
period. (2) The gap between the capacity growth between Low Cost and Full Service
Airlines is widening as a result of the higher capacity augmentation by Low Cost
Airlines. (3) The gap between the capacity utilisation between Low Cost Airlines and
Full Service Airlines is narrowing down. The better capacity utilisation of the Full
Service Airlines during the study period puts interesting question on its ability to
match with Low Cost Airlines. (4) Full Service Airlines have been able to fight the
Low Cost Airlines by (a) Competitive Pricing Policy (b) Better Service quality and
Loyalty among business traveller. (5) Private Airlines capacity growth and utilisation
are better than Govt owned airlines.
7. CONCLUSION
The objective of the study was to understand insights on operating capacity
performance of both business models. The data analysis proves that capacity growth
and utilisation of capacity of Low Cost Airlines are higher than Full Service Airlines.
This analysis presents the interesting research question that Low Cost and Full
Service business model are converging in India and there is no significant difference
between the both business models in achieving the capacity utilisation. Another
question worth considering for further investigation is that there is significant
difference in service quality between Full Service and Low Cost Airlines as Full
Service Carrier is able to increase the capacity utilisation by offering the similar fare

A. Thirunavukkarasu and V. R. Nedunchezian
http://www.iaeme.com/IJM/index.asp 48 [email protected]
on competitive routes. The study findings stimulated the further interest on specific
areas of research. First, the gap between the capacity utilisation between Low Cost
Airlines and Full Service Airlines is marginal, which can lead to further investigation
that there is no difference between the both business models in achieving the capacity
utilisation. Secondly, there is non-tangible aspect of customer satisfaction involved in
the operating capacity performance that can be investigated i.e there is difference in
service quality between Full Service and Low Cost Airlines.
REFERENCES
[1] A.G Assaf, and A. Josiassen, The operational performance of UK Airlines: 2002-
2007, Journal of Economic Studies, 38(1), 2009, 5-16.
[2] M Backx, M. Carney, E Gedajlovic, Public, Private and Mixed Ownership and
the Performance of International Airlines, Journal of Air Transport Management,
8, 2002, 213 – 220.
[3] P Barla, and S. Perelman, Technical efficiency in airlines under regulated and
deregulated environments, Annals of Public and Cooperative Economics, 60,
1989, 61-80.
[4] B.H Baltagi, J.M Griffin, S.R Vadali, and R. Sharada, 1998. Excess Capacity: A
permanent characteristics of US Airlines?. Journal of Applied Economics, 13(6),
1998, 645-657.
[5] C.P Barros, and N. Peypoch, An evaluation of European airlines’ operational
performance, International Journal of production Economics, 122, 2009, 525-533.
[6] M Cho, M Fan and Y.P. Zhou, 2007. An empirical study of Revenue
Management practices in the Airlines Industry, Unpublished paper.
[7] B. Daraban, the Low cost carrier revolution continues: Evidence from the US
Airline Industry, Journal of Business & Economics, 10 (1): 2012, 37 – 44.
[8] V Dietexhe, and S Perelman 1994. Technical efficiency and productivity growth
in an era of deregulation: the case of airlines, Swiss Journal of Economics and
Statistics, 130, 1994, 669-689.
[9] R. Khader Mohideen and S. Abdul Rajak. A Study on Passengers Perception
towards Airlines Services in Tiruchirapalli. International Journal of
Management, 6(1), 2015, pp. 500 - 506.
[10] Evangelho, et al, Market entry of a Low cost airline and impacts on the Brazillian
business travelers, Journal of Air Transport Management,11, 2005 , 99-105.
[11] D. Good, L.H Roller, and R.C. Sickles, 1995.Airline efficiency differences
between Europe and the US: implications for the pace of EC integration and
domestic regulation, European Journal of Operational Research, 80, 1995, 508 –
518.
[12] C. Fourie, B. Lubbe , Determinants of selection of Full service airlines and Low-
cost carriers - A note on business travelers in south Africa, Journal of Transport
Management,12, 2006 , 98-102.
[13] H.S. Jenatabadi, and N.A Ismail, The determination of Load Factors in the
Airline Industry. International Review of Business Research Papers, 3(4), 2007,
125-133.
[14] Dr. S. Balasubramanian and J. Joseph Francis, “Impact of Technology on
Productivity and Service Quality Among Indian Airline Services”, International
Journal of Management (IJM), Volume 2, Issue 2, 2011, pp. 33 - 43, ISSN Print:
0976-6502, ISSN Online: 0976-6510.

An Analysis on Domestic Airlines Capacity Performance In India
http://www.iaeme.com/IJM/index.asp 49 [email protected]
[15] H.S. Jenatabadi, and N.A. Ismail, 2014, Application of structural equation
modeling for estimating airline performance.
[16] T.H. Oum, C. Yu, 1995. A productivity comparison of the world’s major airlines,
Journal of Air Transport Management, 2, 1995, 181-195.
[17] N Pasari, Low Cost Airlines in Developing Economies : The case of India,
doctoral diss., The University of Nottingham,2006