an annual report on classified employee turnover for ... · an annual report on classified employee...
TRANSCRIPT
John Keel, CPA State Auditor
An Annual Report on
Classified Employee Turnover for Fiscal Year 2011 December 2011 Report No. 12-701
An Annual Report on
Classified Employee Turnover for Fiscal Year 2011
SAO Report No. 12-701 December 2011
This report was completed in accordance with Texas Government Code, Section 651.007.
For more information regarding this report, please contact Nicole Guerrero, Audit Manager, or John Keel, State Auditor, at (512) 936-9500.
Scope of Report
The scope of this report included regular full- and part-time classified employees in state agencies during fiscal year 2011 and excluded temporary employees and employees who were not subject to the State’s Position Classification Plan (such as employees at higher education institutions).
Interagency transfers were excluded from most turnover calculations in this report because employees who transfer to other state agencies and higher education institutions are not considered a loss to the State as a whole. The only exception is the turnover by agency calculation. In determining turnover by agency, interagency transfers were included because they are considered a loss for the agency.
Exit Survey Results a
According to exit surveys completed during fiscal year 2011, the top two reasons cited for leaving state employment were (1) retirement and (2) better pay/benefits.
For the past five fiscal years, "Better pay/benefits" has been among the top two reasons cited by employees for leaving state employment. a Texas Government Code, Section 651.007,
requires state agencies to provide an exit survey to employees who voluntarily leave state employment.
Overall Conclusion
The fiscal year 2011 statewide turnover rate was 16.8 percent for regular full- and part-time classified employees, based on 26,028 separations. This was a 15.1 percent increase from the fiscal year 2010 turnover rate of 14.6 percent. The fiscal year 2011 turnover rate was the highest turnover rate that the State has experienced since fiscal year 2008.
Voluntary separations accounted for the majority (70.4 percent) of the State’s total separations in fiscal year 2011. Several factors have contributed or may have contributed to the 12.9 percent increase in voluntary separations since fiscal year 2010. Specifically:
The number of employees retiring continued to increase. In fiscal year 2011, retirements increased 19.3 percent from fiscal year 2010. Over the past five fiscal years, retirements increased by 40.6 percent.
There was a perceived lack of employment stability due to state budget cuts. Exit survey comments suggested that some state workers decided to find other employment because of perceived employment instability at their state agency.
There was a reduced number of merit increases and one-time merit increases for state employees in fiscal year 2011. State agencies awarded 7,161 fewer merit increases and 4,142 fewer one-time merit increases in fiscal year 2011 than they awarded in fiscal year 2010; state agencies awarded 55.3 percent fewer merit and one-time merit increases in fiscal year 2011 than they awarded five years ago in fiscal year 2007. Better pay and benefits continues to be cited among the top reasons employees left employment with their agencies.
History of Turnover Rates Fiscal Years 2007 through 2011
Fiscal Year Turnover Rate
2007 17.4%
2008 17.3%
2009 14.4%
2010 14.6%
2011 16.8%

An Annual Report on Classified Employee Turnover for Fiscal Year 2011
SAO Report No. 12-701
ii
The remaining state separations (29.6 percent) were involuntary. There was an increase of 15.7 percent in involuntary separations since fiscal year 2010. This increase was primarily due to reductions in force, which had the largest percent change (596.0 percent).
Table 1 provides a comparison of the separations for fiscal years 2010 and 2011 and indicates the percent change in separations from fiscal years 2010 to 2011.
Table 1
Separations in Fiscal Years 2010 and 2011 a
Separation Type Fiscal Year
2010 Fiscal Year
2011 Percent Change
Retirement 3,696.0 4,411.0 19.3%
Voluntary Separation from Agency 12,535.0 13,909.0 11.0%
Total Voluntary Separations 16,231.0 18,320.0 12.9%
Reduction in Force 176.0 1,225.0 596.0%
Termination at Will 170.0 260.0 52.9%
Death 244.0 255.0 4.5%
Resignation in Lieu of Involuntary Separation 2,222.0 2,287.0 2.9%
Dismissal for Cause 3,850.0 3,681.0 -4.4%
Total Involuntary Separations 6,662.0 7,708.0 15.7%
Total Statewide Separations 22,893.0 26,028.0 13.7%
Average Statewide Headcount 156,583.0 154,486.5 -1.3%
a
Sources: Uniform Statewide Payroll/Personnel System, Human Resources Information System, and Standardized Payroll/Personnel Reporting System.
The voluntary separations and total statewide separations for fiscal year 2011 exclude interagency transfers because those are not considered a loss to the State.
Average Headcount and Statewide Separations
Fiscal Year 2011
Statewide Separations 26,028.00
Number of Employees Who
Stayed128,458.50
Statewide Average Headcount 154,486.50
An Annual Report on Classified Employee Turnover for Fiscal Year 2011
SAO Report No. 12-701
iii
“True” Turnover Rate
Excluding retirements and involuntary separations, the fiscal year 2011 turnover rate was 9.0 percent. This rate, which is often considered a more “true” turnover rate because it reflects “preventable” turnover, also increased since fiscal year 2010, when it was 8.0 percent.
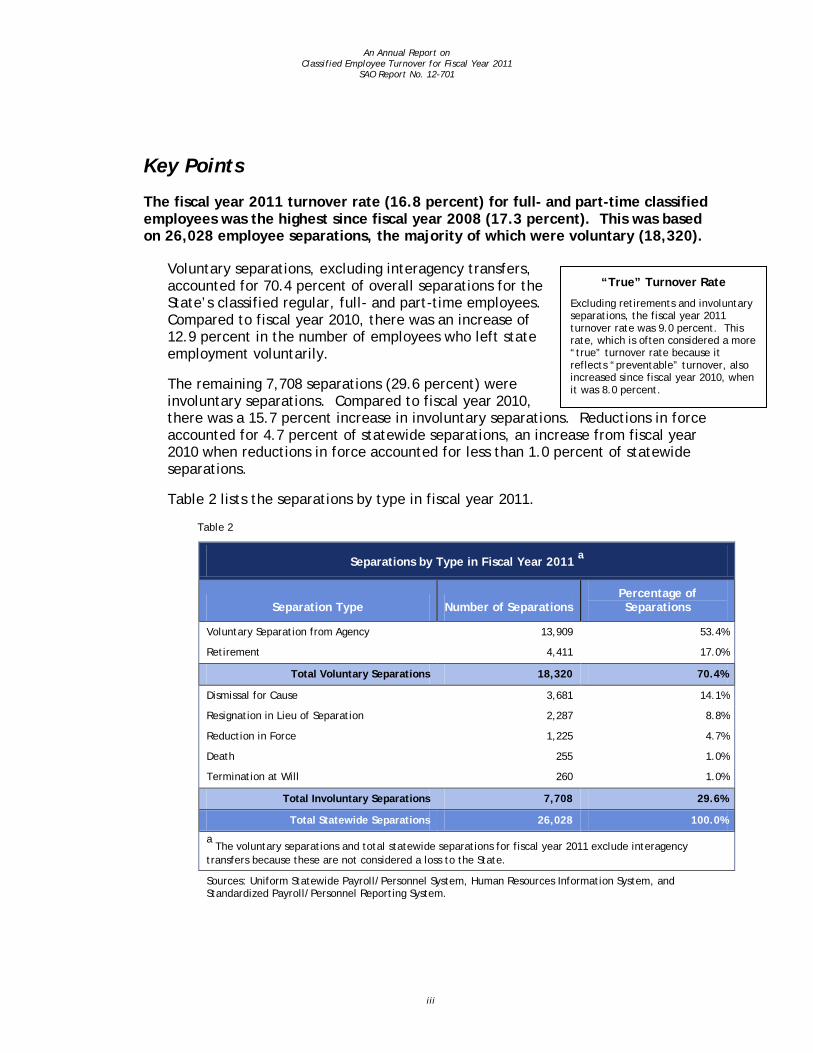
Key Points
The fiscal year 2011 turnover rate (16.8 percent) for full- and part-time classified employees was the highest since fiscal year 2008 (17.3 percent). This was based on 26,028 employee separations, the majority of which were voluntary (18,320).
Voluntary separations, excluding interagency transfers, accounted for 70.4 percent of overall separations for the State’s classified regular, full- and part-time employees. Compared to fiscal year 2010, there was an increase of 12.9 percent in the number of employees who left state employment voluntarily.
The remaining 7,708 separations (29.6 percent) were involuntary separations. Compared to fiscal year 2010, there was a 15.7 percent increase in involuntary separations. Reductions in force accounted for 4.7 percent of statewide separations, an increase from fiscal year 2010 when reductions in force accounted for less than 1.0 percent of statewide separations.
Table 2 lists the separations by type in fiscal year 2011.
Table 2
Separations by Type in Fiscal Year 2011
Separation Type
a
Number of Separations Percentage of Separations
Voluntary Separation from Agency 13,909 53.4%
Retirement 4,411 17.0%
Total Voluntary Separations 18,320 70.4%
Dismissal for Cause 3,681 14.1%
Resignation in Lieu of Separation 2,287 8.8%
Reduction in Force 1,225 4.7%
Death 255 1.0%
Termination at Will 260 1.0%
Total Involuntary Separations 7,708 29.6%
Total Statewide Separations 26,028 100.0%
a
Sources: Uniform Statewide Payroll/Personnel System, Human Resources Information System, and Standardized Payroll/Personnel Reporting System.
The voluntary separations and total statewide separations for fiscal year 2011 exclude interagency transfers because these are not considered a loss to the State.

An Annual Report on Classified Employee Turnover for Fiscal Year 2011
SAO Report No. 12-701
iv
The Texas Education Agency (TEA) experienced the highest turnover rate (38.5 percent) among state agencies with 1,000 or more employees in fiscal year 2011.1
TEA’s turnover rate of 38.5 percent in fiscal year 2011 was a significant increase from its fiscal year 2010 turnover rate of 9.0 percent. The majority (65.7 percent) of TEA’s separations in fiscal year 2011 were due to reductions in force.
The Department of Criminal Justice (TDCJ), which is the largest state agency, accounted for the largest percentage of separations (29.6 percent) within the State. The majority of the separations at TDCJ during fiscal year 2011 were voluntary. TDCJ’s turnover rate was 19.2 percent in fiscal year 2011.
Employees under age 30 and those with fewer than 2 years of state service left state employment at a higher rate that other employee age and service groups.2
Employees under age 30 accounted for 30.2 percent of the State’s separations, and employees with fewer than 2 years of state service accounted for 38.4 percent of the State’s separations.
The Social Services, Medical and Health, and Criminal Justice occupational categories made up 48.4 percent of the State’s workforce and 64.3 percent of total separations.
The types of jobs from which state employees most often separated were in the social services, medical and health, and criminal justice occupational categories. All three occupational categories had higher turnover rates than the State’s 16.8 percent overall turnover rate. This can be partially attributed to the following job classification series within those three occupational categories:
Social Services - The Mental Retardation Assistant job classification series accounted for 42.3 percent of total separations within this occupational category and had a turnover rate of 42.2 percent.
Medical and Health - The Licensed Vocational Nurse and Nurse job classification series accounted for 68.0 percent of separations within this occupational category and had a combined turnover rate of 26.6 percent.
Criminal Justice - The Juvenile Correctional Officer and Correctional Officer job classification series accounted for 92.3 percent of total separations within this occupational category and had a combined turnover rate of 23.4 percent.
1 Turnover rates for agencies include interagency transfers. 2 Some employees may be included in both employees under age 30 and employees with fewer than 2 years of state service
groups.
An Annual Report on Classified Employee Turnover for Fiscal Year 2011
SAO Report No. 12-701
v
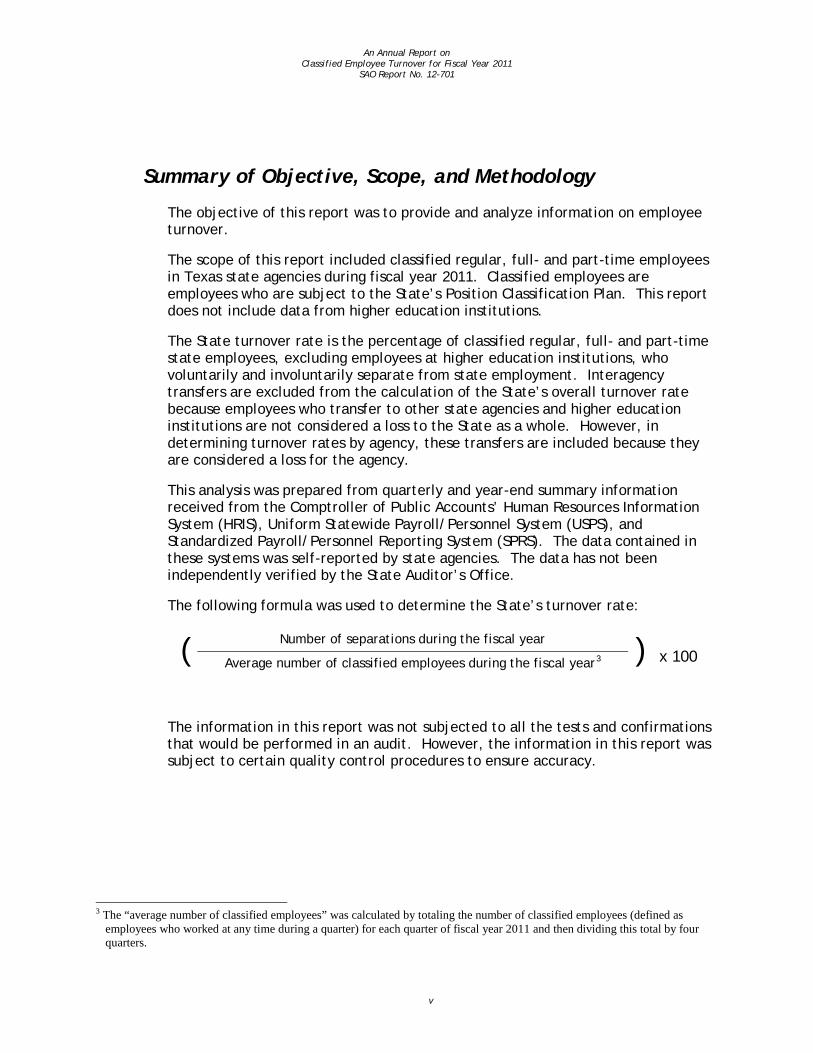
Summary of Objective, Scope, and Methodology
The objective of this report was to provide and analyze information on employee turnover.
The scope of this report included classified regular, full- and part-time employees in Texas state agencies during fiscal year 2011. Classified employees are employees who are subject to the State’s Position Classification Plan. This report does not include data from higher education institutions.
The State turnover rate is the percentage of classified regular, full- and part-time state employees, excluding employees at higher education institutions, who voluntarily and involuntarily separate from state employment. Interagency transfers are excluded from the calculation of the State’s overall turnover rate because employees who transfer to other state agencies and higher education institutions are not considered a loss to the State as a whole. However, in determining turnover rates by agency, these transfers are included because they are considered a loss for the agency.
This analysis was prepared from quarterly and year-end summary information received from the Comptroller of Public Accounts’ Human Resources Information System (HRIS), Uniform Statewide Payroll/Personnel System (USPS), and Standardized Payroll/Personnel Reporting System (SPRS). The data contained in these systems was self-reported by state agencies. The data has not been independently verified by the State Auditor’s Office.
The following formula was used to determine the State’s turnover rate:
( Number of separations during the fiscal year ) x 100 Average number of classified employees during the fiscal year3
The information in this report was not subjected to all the tests and confirmations that would be performed in an audit. However, the information in this report was subject to certain quality control procedures to ensure accuracy.
3 The “average number of classified employees” was calculated by totaling the number of classified employees (defined as
employees who worked at any time during a quarter) for each quarter of fiscal year 2011 and then dividing this total by four quarters.
Contents
Detailed Results
Chapter 1 Overall Turnover Rate ................................................ 1
Chapter 2 Turnover Demographics .............................................. 6
Appendices
Appendix 1 Objective, Scope, and Methodology .............................. 17
Appendix 2 Reasons State Employees Separated from Employment During Fiscal Years 2007-2011 ..................................... 19
Appendix 3 Employee Turnover by State Agency ............................. 20
Appendix 4 Turnover by Job Classification Series ............................ 25
Appendix 5 Turnover by Region and County ................................... 34

An Annual Report on Classified Employee Turnover for Fiscal Year 2011 SAO Report No. 12-701
December 2011 Page 1
Detailed Results
Chapter 1
Overall Turnover Rate
The statewide turnover rate for classified regular, full- and part-time employees for fiscal year 2011 was 16.8 percent based on a total of 26,028 voluntary and involuntary separations, excluding interagency transfers. This was an increase from the fiscal year 2010 turnover rate of 14.6 percent, and it was the highest rate since fiscal year 2008 when the turnover rate was 17.3 percent.
The turnover rate during the past five fiscal years has fluctuated from 17.4 percent (in fiscal year 2007) to 16.8 percent (in fiscal year 2011) (see Figure 1).
Figure 1
State of Texas
Turnover Rates for Classified Regular, Full- and Part-time Employees
Fiscal Year 2007 to Fiscal Year 2011
17.4% 17.3%
14.4% 14.6%
16.8%
0.0%
5.0%
10.0%
15.0%
20.0%
Fiscal Year 2007
Fiscal Year 2008
Fiscal Year 2009
Fiscal Year 2010
Fiscal Year 2011
Sources: Uniform Statewide Payroll/Personnel System, Human Resources Information System, and Standardized Payroll/Personnel Reporting System.
An Annual Report on Classified Employee Turnover for Fiscal Year 2011 SAO Report No. 12-701
December 2011 Page 2
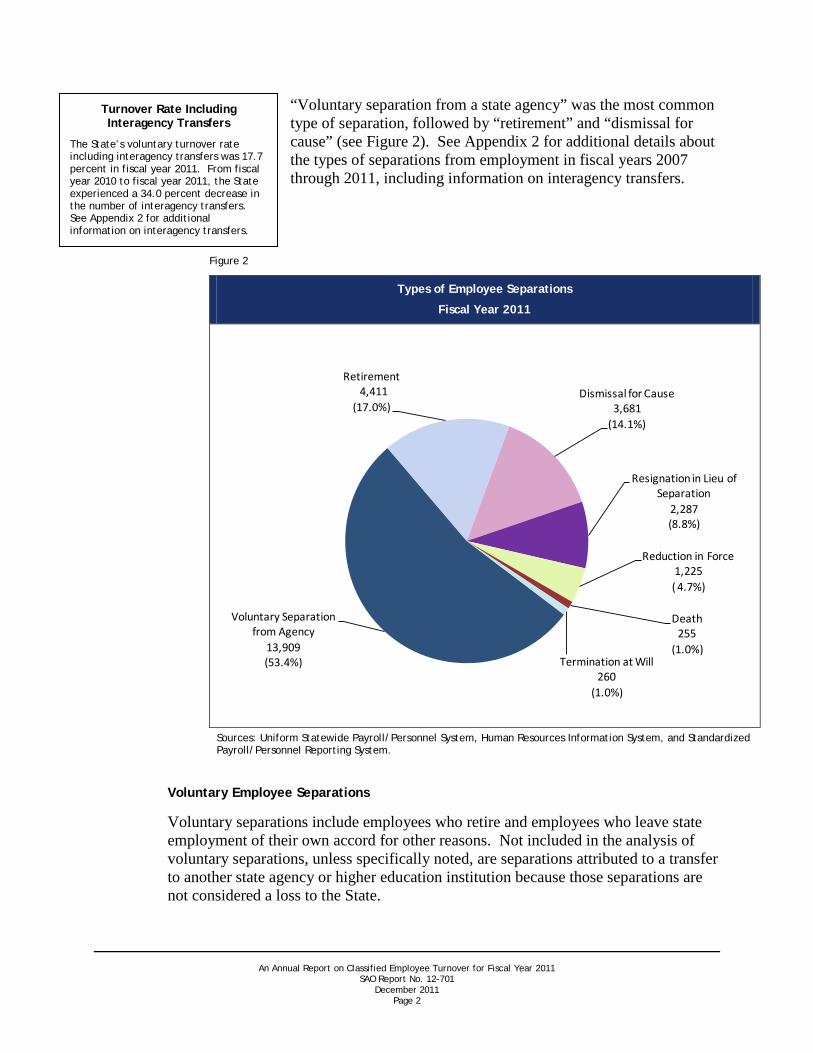
Turnover Rate Including Interagency Transfers
The State’s voluntary turnover rate including interagency transfers was 17.7 percent in fiscal year 2011. From fiscal year 2010 to fiscal year 2011, the State experienced a 34.0 percent decrease in the number of interagency transfers. See Appendix 2 for additional information on interagency transfers.
“Voluntary separation from a state agency” was the most common type of separation, followed by “retirement” and “dismissal for cause” (see Figure 2). See Appendix 2 for additional details about the types of separations from employment in fiscal years 2007 through 2011, including information on interagency transfers.
Figure 2
Types of Employee Separations
Fiscal Year 2011
Voluntary Separation from Agency
13,909 (53.4%)
Retirement4,411
(17.0%)Dismissal for Cause
3,681 (14.1%)
Resignation in Lieu of Separation
2,287(8.8%)
Reduction in Force 1,225( 4.7%)
Death255
(1.0%)Termination at Will
260 (1.0%)
Sources: Uniform Statewide Payroll/Personnel System, Human Resources Information System, and Standardized Payroll/Personnel Reporting System.
Voluntary Employee Separations
Voluntary separations include employees who retire and employees who leave state employment of their own accord for other reasons. Not included in the analysis of voluntary separations, unless specifically noted, are separations attributed to a transfer to another state agency or higher education institution because those separations are not considered a loss to the State.
An Annual Report on Classified Employee Turnover for Fiscal Year 2011 SAO Report No. 12-701
December 2011 Page 3
Exit Survey Results a
According to exit surveys completed during fiscal year 2011, the top two reasons cited for leaving state employment were:
Retirement.
Better pay/benefits.
For the past five fiscal years, "Better pay/benefits" has been among the top two reasons cited by employees for leaving state employment. a Texas Government Code, Section 651.007,
requires state agencies to provide an exit survey to employees who voluntarily leave state employment.
Voluntary separations accounted for the majority (70.4 percent) of the State’s total separations and increased 12.9 percent since fiscal year 2010. Several factors have contributed or may have contributed to that increase. Specifically:
The number of employees retiring continued to increase. In fiscal year 2011, retirement increased 19.3 percent from fiscal year 2010. Between fiscal years 2007 and 2011, retirements increased by 40.6 percent.
There was a perceived lack of employment stability due to budget cuts. Exit survey comments suggested that some state workers decided to find other employment because of perceived employment instability at their state agency.
There were a reduced number of merit increases and one-time merit increases for state employees in fiscal year 2011. State agencies awarded 7,161 fewer merit increases and 4,142 fewer one-time merit increases in fiscal year 2011 than they awarded in fiscal year 2010. Also, state agencies awarded 55.3 percent fewer merit and one-time merit increases in fiscal year 2011 than they awarded five years ago in fiscal year 2007. Better pay and benefits continued to be cited among the top reasons employees left employment with the State.
Table 3 lists the percent change for voluntary separations from fiscal year 2010 to fiscal year 2011.
Table 3
Voluntary Employee Separations for Fiscal Years 2010 and 2011 a
Separation Type Fiscal Year
2010 Fiscal Year
2011 Percent Change
Retirement 3,696 4,411 19.3%
Voluntary Separation from Agency 12,535 13,909 11.0%
Total Voluntary Separations 16,231 18,320 12.9%
a
Sources: Uniform Statewide Payroll/Personnel System, Human Resources Information System, and Standardized Payroll/Personnel Reporting System.
Voluntary separations exclude interagency transfers because they are not viewed as a loss to the State.

An Annual Report on Classified Employee Turnover for Fiscal Year 2011 SAO Report No. 12-701
December 2011 Page 4
Involuntary Employee Separations
Involuntary separations due to reduction in force, dismissal for cause, resignation in lieu of involuntary termination, termination at will, or death accounted for 29.6 percent of total separations in fiscal year 2011. Involuntary separations increased 15.7 percent from fiscal year 2010; that increase was primarily a result of the increase in the number of employees who separated from state employment due to a reduction in force.
Table 4 lists the percent changes for involuntary separations for fiscal years 2010 and 2011.
Table 4
Involuntary Employee Separations
Fiscal Years 2010 and 2011
Separation Type Fiscal Year
2010 Fiscal Year
2011 Percent Change
Reduction in Force 176 1,225 596.0%
Termination at Will 170 260 52.9%
Death 244 255 4.5%
Resignation in Lieu of Involuntary Separation
2,222 2,287 2.9%
Dismissal for Cause 3,850 3,681 -4.4%
Total Involuntary Separations 6,662 7,708 15.7%
Sources: Uniform Statewide Payroll/Personnel System, Human Resources Information System, and Standardized Payroll/Personnel Reporting System.
Thirty-four state agencies experienced reductions in force. The Texas Youth Commission, the Texas Education Agency, and the Department of Criminal Justice accounted for 72.6 percent of all staff reductions due to reductions in force in fiscal year 2011.
The three job classification series with the most separations as a result of reductions in force in fiscal year 2011 were Juvenile Correctional Officers, Program Specialists, and Administrative Assistants. Those three job classification series accounted for 45.1 percent of all reductions in force in fiscal year 2011.
Comparison of the State’s “True” Turnover Rate and the Texas Unemployment Rate
Excluding retirements and involuntary separations, the fiscal year 2011 turnover rate was 9.0 percent, compared to 8.0 percent in fiscal year 2010. This rate is often considered more of a “true” turnover rate because it reflects preventable turnover. At the same time, the Texas unemployment rate increased from 8.1 percent in fiscal year 2010 to 8.2 percent in fiscal year 2011.
With the exception of fiscal year 2011, there has been an inverse relationship between the statewide unemployment rate and the “true” turnover rate—as the unemployment

An Annual Report on Classified Employee Turnover for Fiscal Year 2011 SAO Report No. 12-701
December 2011 Page 5
rate went up, the turnover rate went down, and vice versa. Figure 3 shows the State’s voluntary turnover rates and the Texas unemployment rates for the past five years.
Figure 3
State “True” Turnover and Texas Unemployment Rates
Fiscal Year 2007 to Fiscal Year 2011
10.8% 10.5%
8.1% 8.0%
9.0%
4.5% 4.6%
6.7%
8.1% 8.2%
0.0%
2.0%
4.0%
6.0%
8.0%
10.0%
12.0%
14.0%
Fiscal Year 2007 Fiscal Year 2008 Fiscal Year 2009 Fiscal Year 2010 Fiscal Year 2011
State "True" Turnover Rate Texas Unemployment Rate
Sources: Uniform Statewide Payroll/Personnel System, Human Resources Information System, Standardized Payroll/Personnel Reporting System (voluntary turnover rate), and the U.S. Bureau of Labor Statistics (unemployment rate).
An Annual Report on Classified Employee Turnover for Fiscal Year 2011 SAO Report No. 12-701
December 2011 Page 6
Chapter 2
Turnover Demographics
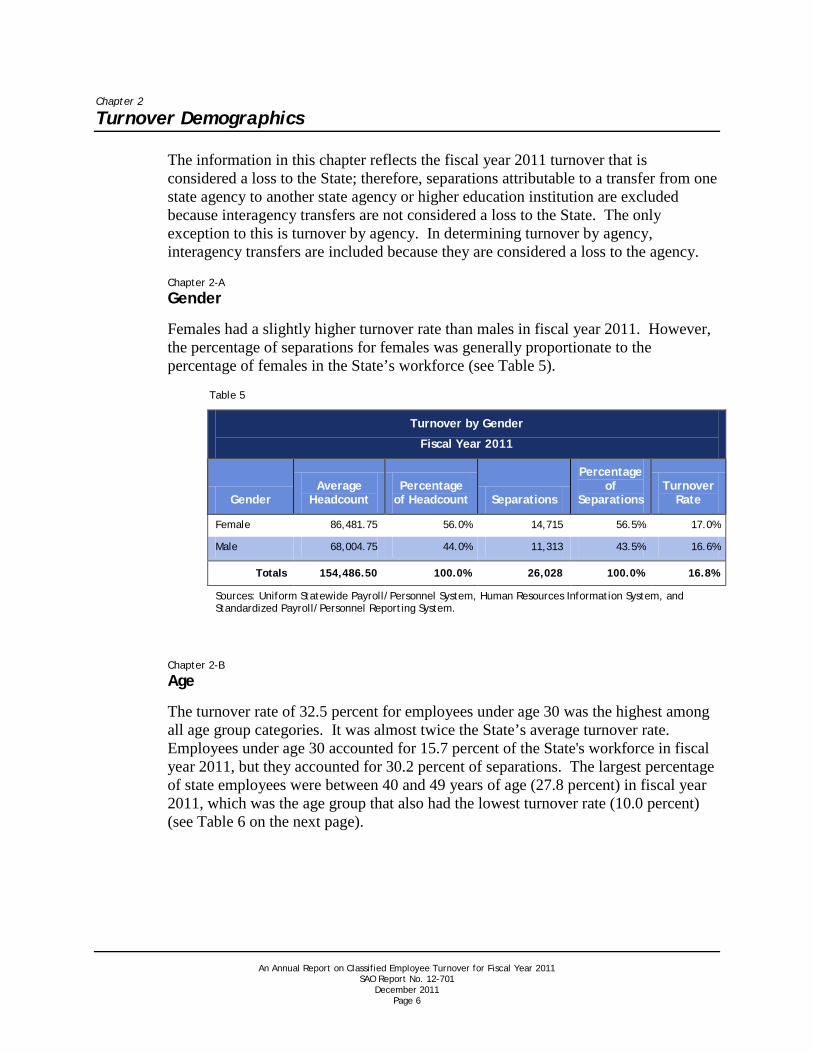
The information in this chapter reflects the fiscal year 2011 turnover that is considered a loss to the State; therefore, separations attributable to a transfer from one state agency to another state agency or higher education institution are excluded because interagency transfers are not considered a loss to the State. The only exception to this is turnover by agency. In determining turnover by agency, interagency transfers are included because they are considered a loss to the agency.
Chapter 2-A
Gender
Females had a slightly higher turnover rate than males in fiscal year 2011. However, the percentage of separations for females was generally proportionate to the percentage of females in the State’s workforce (see Table 5).
Table 5
Turnover by Gender
Fiscal Year 2011
Gender Average
Headcount Percentage
of Headcount Separations
Percentage of
Separations Turnover
Rate
Female 86,481.75 56.0% 14,715 56.5% 17.0%
Male 68,004.75 44.0% 11,313 43.5% 16.6%
Totals 154,486.50 100.0% 26,028 100.0% 16.8%
Sources: Uniform Statewide Payroll/Personnel System, Human Resources Information System, and Standardized Payroll/Personnel Reporting System.
Chapter 2-B
Age
The turnover rate of 32.5 percent for employees under age 30 was the highest among all age group categories. It was almost twice the State’s average turnover rate. Employees under age 30 accounted for 15.7 percent of the State's workforce in fiscal year 2011, but they accounted for 30.2 percent of separations. The largest percentage of state employees were between 40 and 49 years of age (27.8 percent) in fiscal year 2011, which was the age group that also had the lowest turnover rate (10.0 percent) (see Table 6 on the next page).

An Annual Report on Classified Employee Turnover for Fiscal Year 2011 SAO Report No. 12-701
December 2011 Page 7
Table 6
Turnover by Age Group
Fiscal Year 2011
Age Group Average
Headcount
Percentage of
Headcount Separations
Percentage of
Separations Turnover
Rate
16 to 29 24,183.00 15.7% 7,868 30.2% 32.5%
30 to 39 33,144.25 21.4% 5,315 20.4% 16.0%
40 to 49 42,895.75 27.8% 4,282 16.5% 10.0%
50 to 59 39,785.75 25.8% 5,194 20.0% 13.1%
60 to 69 13,512.50 8.7% 3,100 11.9% 22.9%
70 or Older 965.00 0.6% 269 1.0% 27.9%
Age Unknown 0.25 0.0% 0 0.0% 0.0%
Totals 154,486.50 100.0% 26,028 100.0% 16.8%
Sources: Uniform Statewide Payroll/Personnel System, Human Resources Information System, and Standardized Payroll/Personnel Reporting System.
Chapter 2-C
Ethnicity
Employees within the Black ethnic category had the highest turnover rate (18.5 percent) among all ethnic categories in fiscal year 2011 (see Table 7).
Table 7
Turnover by Ethnic Group
Fiscal Year 2011
Ethnic Group Average
Headcount
Percentage of
Headcount Separations
Percentage of
Separations Turnover
Rate
Black 34,103.00 22.1% 6,323 24.3% 18.5%
Hispanic 37,735.75 24.4% 5,872 22.6% 15.6%
White 78,913.25 51.1% 13,289 51.1% 16.8%
Other (American Indians, Asian, and Other)
3,734.50 2.4% 544 2.0% 14.6%
Totals 154,486.50 100.0% 26,028 100.0% 16.8%
Sources: Uniform Statewide Payroll/Personnel System, Human Resources Information System, and Standardized Payroll/Personnel Reporting System.

An Annual Report on Classified Employee Turnover for Fiscal Year 2011 SAO Report No. 12-701
December 2011 Page 8
Chapter 2-D
Employee Type
The turnover rate of 30.8 percent for classified regular, part-time employees was nearly double the turnover rate of 16.7 percent for classified regular, full-time employees in fiscal year 2011 (see Table 8).
Table 8
Turnover by Employee Type
Fiscal Year 2011
Employee Type Average
Headcount
Percentage of
Headcount Separations
Percentage of
Separations Turnover
Rate
Classified Regular, Full-time Employees 152,657.50 98.8% 25,464 97.8% 16.7%
Classified Regular, Part-time Employees 1,829.00 1.2% 564 2.2% 30.8%
Totals 154,486.50 100.0% 26,028 100.0% 16.8%
Sources: Uniform Statewide Payroll/Personnel System, Human Resources Information System, and Standardized Payroll/Personnel Reporting System.
Chapter 2-E
Salary Schedule and Salary
Salary Schedule A, which comprised 50.3 percent of the State’s classified regular, full- and part-time workforce, experienced the highest turnover rate (21.3 percent) within the State’s three classified salary schedules (see text box for descriptions of these schedules). Employees within Salary Schedule A comprised 63.6 percent of the State’s separations.
The State’s law enforcement schedule (Salary Schedule C) experienced the lowest turnover rate (6.6 percent). Table 9 lists the turnover rates for all of the State’s salary schedules.
Table 9
Turnover by Salary Schedule for Fiscal Year 2011
Salary Schedule
Average Headcount
Percentage of
Headcount Separations
Percentage of
Separations Turnover
Rate
A 77,678.75 50.3% 16,558 63.6% 21.3%
B 72,294.25 46.8% 9,174 35.3% 12.7%
C 4,513.50 2.9% 296 1.1% 6.6%
Totals 154,486.50 100.0% 26,028 100.0% 16.8%
Sources: Uniform Statewide Payroll/Personnel System, Human Resources Information System, and Standardized Payroll/Personnel Reporting System.
Classified Salary Schedules
Schedule A – Administrative support, maintenance, technical, and paraprofessional positions (for example, Administrative Assistants, Correctional Officers, and Licensed Vocational Nurses).
Schedule B – Primarily professional and managerial positions (for example, Accountants, Nurses, and Engineers).
Schedule C – Law enforcement positions (for example, Game Wardens and Troopers).

An Annual Report on Classified Employee Turnover for Fiscal Year 2011 SAO Report No. 12-701
December 2011 Page 9
Average Annual Salary for a Classified, Regular
Full-time Employee
The average annual salary for a regular, full-time classified employee in fiscal year 2011 was $39,804.
Salary and Its Effect on Turnover
Generally, the lower an employee’s salary, the more likely the employee was to leave state employment in fiscal year 2011. As shown in Figure 4, employees paid less than $30,000 annually left state employment at a higher rate than employees earning annual salaries of $30,000 and higher. In fiscal year 2011, approximately 26.3 percent of state agency employees earned less than $30,000 annually.
Figure 4
Turnover Rates Among State Employee By Salary Breakdown
Fiscal Year 2011
24.4%25.4%
16.0%
10.5% 10.4% 10.4% 11.2%
0.0%
5.0%
10.0%
15.0%
20.0%
25.0%
30.0%
$19,999 or less
$20,000 -$29,999
$30,000 -$39,999
$40,000 -$49,999
$50,000 -$59,999
$60,000 -$69,999
>$70,000
Sources: Uniform Statewide Payroll/Personnel System, Human Resources Information System, and Standardized Payroll/Personnel Reporting System.
Chapter 2-F
General Appropriations Act Article
Article III (Education) experienced the highest turnover rate among the General Appropriations Act articles; however, Article III comprises 1.5 percent of the State’s full and part-time classified employees. Almost three-fourths (73.5 percent) of the State’s full- and part-time classified employees worked for agencies in Article II (Health and Human Services) and Article V (Public Safety and Criminal Justice) of the General Appropriations Act during fiscal year 2011 (see Table 10).
Average Salaries by Salary Schedule
Salary Schedule A - $30,394
Salary Schedule B - $48,723
Salary Schedule C - $57,052

An Annual Report on Classified Employee Turnover for Fiscal Year 2011 SAO Report No. 12-701
December 2011 Page 10
Education (Article III) had the highest turnover rate (20.8 percent). The high turnover rate within this article can be attributed to a large number of involuntary separations categorized as reductions in force that occurred within the Texas Education Agency.
Health and Human Services (Article II) had the second highest turnover rate (19.4 percent) among General Appropriations Act articles. That article comprises 37.6 percent of the State’s classified workforce; however, it accounted for 43.2 percent of the State’s separations. Health and Human Services includes several job classification series with turnover rates significantly more than the statewide turnover rate (16.8 percent) in fiscal year 2011. These included Mental Retardation Assistant (42.2 percent); Licensed Vocational Nurse (33.5 percent); Psychiatric Nursing Assistant (28.9 percent); Child Protective Services Specialist (23.5 percent); and Nurse (23.1 percent) job classification series. (See Chapter 2-I for additional information on turnover rates for job classification series.)
Public Safety and Criminal Justice (Article V) had the third highest turnover rate (18.3 percent) among General Appropriation Act articles. The Public Safety and Criminal Justice turnover rate is affected by the high turnover rates among the Juvenile Correctional Officer job classification series (39.6 percent) and the Correctional Officer job classification series (22.3 percent).
Table 10
Turnover by General Appropriations Act Article
Fiscal Year 2011
Article Average
Headcount
Percentage of
Headcount Separations
Percentage of
Separations Turnover
Rate
I – General Government 9,502.75 6.2% 1,155 4.4% 12.2%
II – Health and Human Services
58,049.25 37.6% 11,237 43.2% 19.4%
III – Education 2,250.75 1.5% 469 1.8% 20.8%
IV – Judiciary 703.50 0.5% 116 0.5% 16.5%
V – Public Safety and Criminal Justice
55,502.00 35.9% 10,151 39.0% 18.3%
VI – Natural Resources 8,377.00 5.4% 1,079 4.1% 12.9%
VII – Business and Economic Development
16,562.25 10.7% 1,495 5.7% 9.0%
VIII – Regulatory 3,539.00 2.2% 326 1.3% 9.2%
Totals 154,486.50 100.0% 26,028 100.0% 16.8%
Sources: Uniform Statewide Payroll/Personnel System, Human Resources Information System, and Standardized Payroll/Personnel Reporting System.
An Annual Report on Classified Employee Turnover for Fiscal Year 2011 SAO Report No. 12-701
December 2011 Page 11
Interagency Transfers
Interagency transfers are excluded from statewide turnover calculations because they are not considered a loss to the State; however, they are included in the agency turnover calculations because they are a loss to the agency.
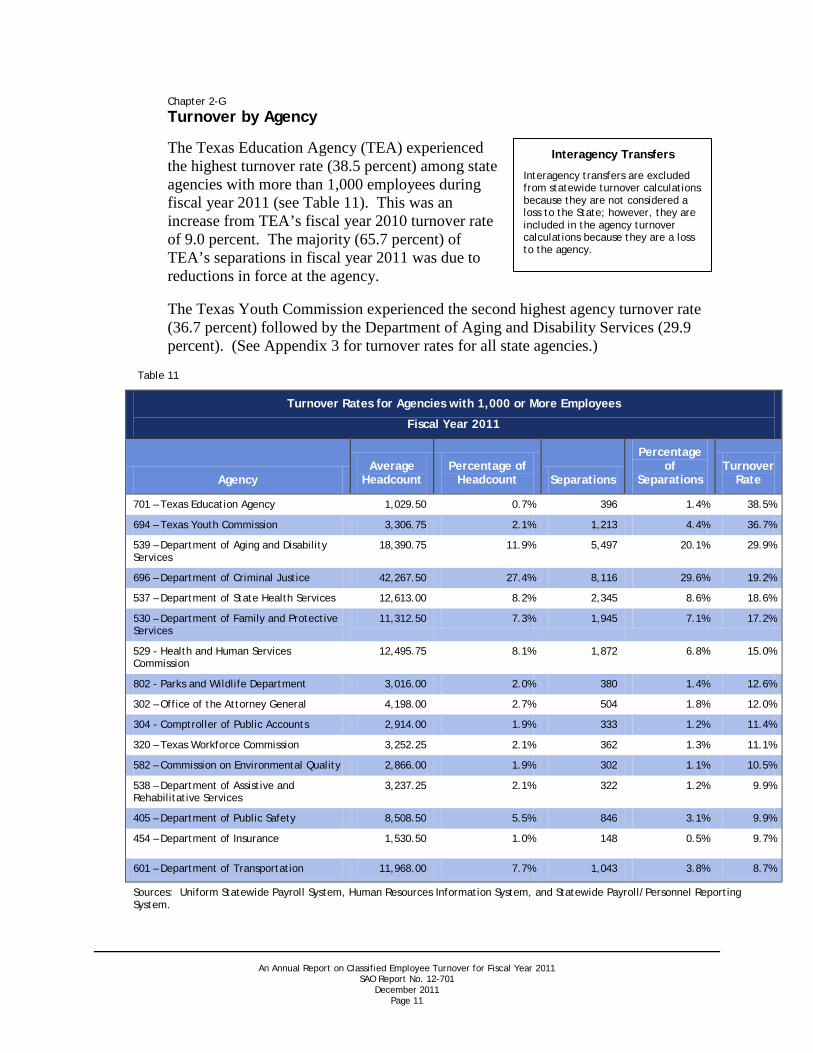
Chapter 2-G
Turnover by Agency
The Texas Education Agency (TEA) experienced the highest turnover rate (38.5 percent) among state agencies with more than 1,000 employees during fiscal year 2011 (see Table 11). This was an increase from TEA’s fiscal year 2010 turnover rate of 9.0 percent. The majority (65.7 percent) of TEA’s separations in fiscal year 2011 was due to reductions in force at the agency.
The Texas Youth Commission experienced the second highest agency turnover rate (36.7 percent) followed by the Department of Aging and Disability Services (29.9 percent). (See Appendix 3 for turnover rates for all state agencies.)
Table 11
Turnover Rates for Agencies with 1,000 or More Employees
Fiscal Year 2011
Agency Average
Headcount Percentage of
Headcount Separations
Percentage of
Separations Turnover
Rate
701 – Texas Education Agency 1,029.50 0.7% 396 1.4% 38.5%
694 – Texas Youth Commission 3,306.75 2.1% 1,213 4.4% 36.7%
539 – Department of Aging and Disability Services
18,390.75 11.9% 5,497 20.1% 29.9%
696 – Department of Criminal Justice 42,267.50 27.4% 8,116 29.6% 19.2%
537 – Department of State Health Services 12,613.00 8.2% 2,345 8.6% 18.6%
530 – Department of Family and Protective Services
11,312.50 7.3% 1,945 7.1% 17.2%
529 - Health and Human Services Commission
12,495.75 8.1% 1,872 6.8% 15.0%
802 - Parks and Wildlife Department 3,016.00 2.0% 380 1.4% 12.6%
302 – Office of the Attorney General 4,198.00 2.7% 504 1.8% 12.0%
304 - Comptroller of Public Accounts 2,914.00 1.9% 333 1.2% 11.4%
320 – Texas Workforce Commission 3,252.25 2.1% 362 1.3% 11.1%
582 – Commission on Environmental Quality 2,866.00 1.9% 302 1.1% 10.5%
538 – Department of Assistive and Rehabilitative Services
3,237.25 2.1% 322 1.2% 9.9%
405 – Department of Public Safety 8,508.50 5.5% 846 3.1% 9.9%
454 – Department of Insurance 1,530.50 1.0% 148 0.5% 9.7%
601 – Department of Transportation 11,968.00 7.7% 1,043 3.8% 8.7%
Sources: Uniform Statewide Payroll System, Human Resources Information System, and Statewide Payroll/Personnel Reporting System.

An Annual Report on Classified Employee Turnover for Fiscal Year 2011 SAO Report No. 12-701
December 2011 Page 12
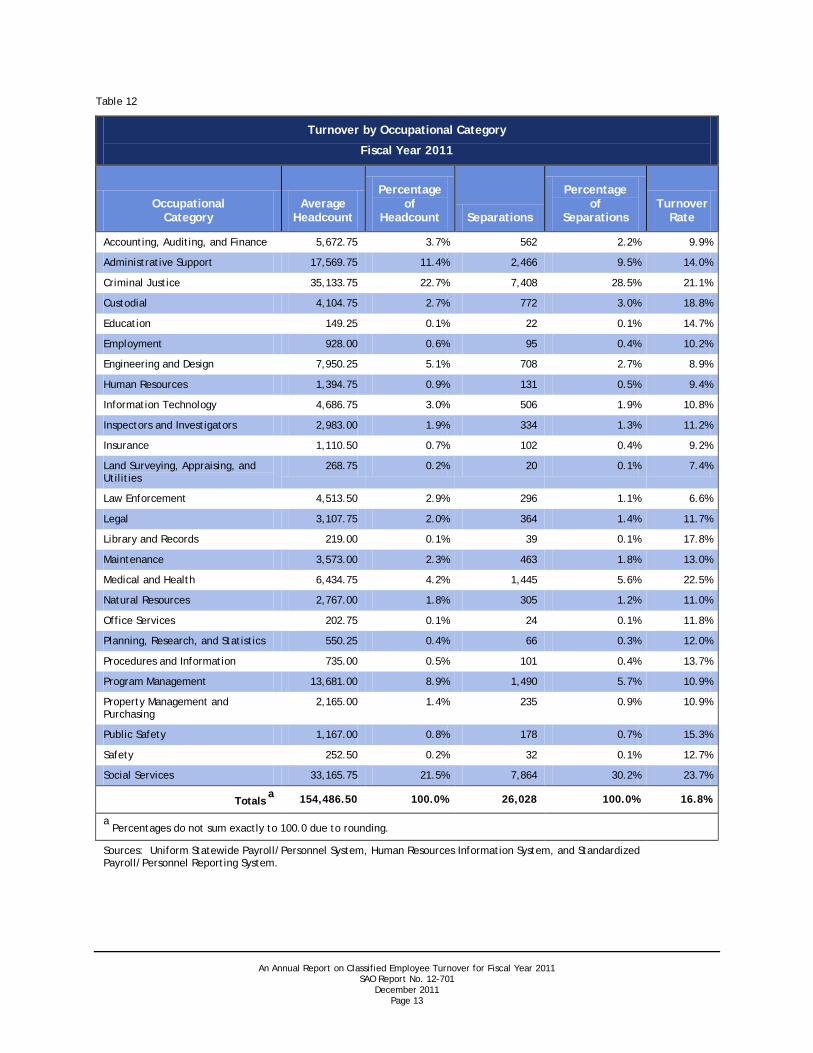
Chapter 2-H
Turnover by Occupational Category
The types of jobs from which state employees separated most often in fiscal year 2011 were in the social services, medical and health, and criminal justice fields.
The Social Services occupational category had the highest turnover rate (23.7 percent) in fiscal year 2011, followed by Medical and Health (22.5 percent) and Criminal Justice (21.1 percent). Those three occupational categories accounted for 48.4 percent of the State’s workforce and 64.3 percent of total statewide separations in fiscal year 2011.
The Social Services occupational category’s high turnover rate (23.7 percent) can partially be attributed to the high turnover rate within the Mental Retardation Assistant job classification series, which accounted for 23.8 percent of employees and 42.3 percent of separations within the Social Services occupational category.
The Medical and Health occupational category’s high turnover rate (22.5 percent) can partially be attributed to the high turnover rates within the Licensed Vocational Nurse (33.5 percent) and Nurse (23.1 percent) job classification series. Those series combined accounted for 57.4 percent of employees and 68.0 percent of separations within the Medical and Health occupational category.
The Criminal Justice occupational category’s high turnover rate (21.1 percent) can partially be attributed to the high turnover rates within the Juvenile Correctional Officer (39.6 percent) and Correctional Officer (22.3 percent) job classification series. Those series combined accounted for 83.1 percent of employees and 92.3 percent of separations within the Criminal Justice occupational category.
Table 12 on the next page lists fiscal year 2011 turnover rates by occupational category.
An Annual Report on Classified Employee Turnover for Fiscal Year 2011 SAO Report No. 12-701
December 2011 Page 13
Table 12
Turnover by Occupational Category
Fiscal Year 2011
Occupational Category
Average Headcount
Percentage of
Headcount Separations
Percentage of
Separations Turnover
Rate
Accounting, Auditing, and Finance 5,672.75 3.7% 562 2.2% 9.9%
Administrative Support 17,569.75 11.4% 2,466 9.5% 14.0%
Criminal Justice 35,133.75 22.7% 7,408 28.5% 21.1%
Custodial 4,104.75 2.7% 772 3.0% 18.8%
Education 149.25 0.1% 22 0.1% 14.7%
Employment 928.00 0.6% 95 0.4% 10.2%
Engineering and Design 7,950.25 5.1% 708 2.7% 8.9%
Human Resources 1,394.75 0.9% 131 0.5% 9.4%
Information Technology 4,686.75 3.0% 506 1.9% 10.8%
Inspectors and Investigators 2,983.00 1.9% 334 1.3% 11.2%
Insurance 1,110.50 0.7% 102 0.4% 9.2%
Land Surveying, Appraising, and Utilities
268.75 0.2% 20 0.1% 7.4%
Law Enforcement 4,513.50 2.9% 296 1.1% 6.6%
Legal 3,107.75 2.0% 364 1.4% 11.7%
Library and Records 219.00 0.1% 39 0.1% 17.8%
Maintenance 3,573.00 2.3% 463 1.8% 13.0%
Medical and Health 6,434.75 4.2% 1,445 5.6% 22.5%
Natural Resources 2,767.00 1.8% 305 1.2% 11.0%
Office Services 202.75 0.1% 24 0.1% 11.8%
Planning, Research, and Statistics 550.25 0.4% 66 0.3% 12.0%
Procedures and Information 735.00 0.5% 101 0.4% 13.7%
Program Management 13,681.00 8.9% 1,490 5.7% 10.9%
Property Management and Purchasing
2,165.00 1.4% 235 0.9% 10.9%
Public Safety 1,167.00 0.8% 178 0.7% 15.3%
Safety 252.50 0.2% 32 0.1% 12.7%
Social Services 33,165.75 21.5% 7,864 30.2% 23.7%
Totals 154,486.50 a 100.0% 26,028 100.0% 16.8%
a Percentages do not sum exactly to 100.0 due to rounding.
Sources: Uniform Statewide Payroll/Personnel System, Human Resources Information System, and Standardized Payroll/Personnel Reporting System.
An Annual Report on Classified Employee Turnover for Fiscal Year 2011 SAO Report No. 12-701
December 2011 Page 14
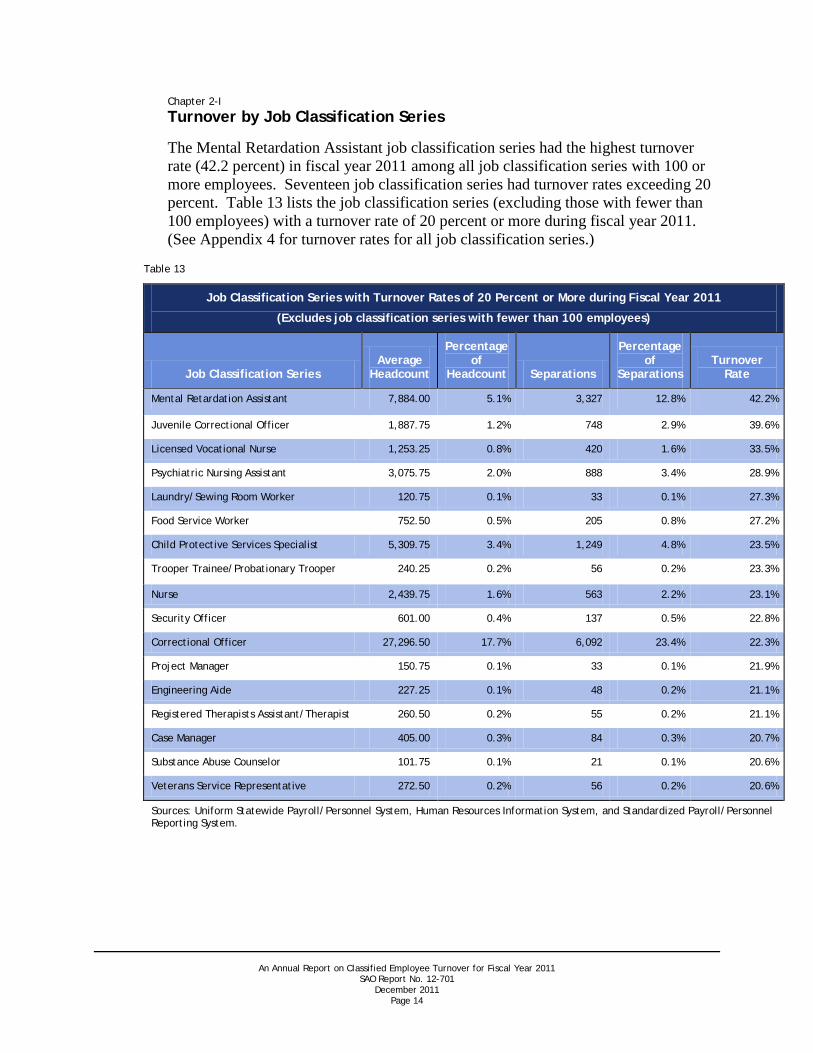
Chapter 2-I
Turnover by Job Classification Series
The Mental Retardation Assistant job classification series had the highest turnover rate (42.2 percent) in fiscal year 2011 among all job classification series with 100 or more employees. Seventeen job classification series had turnover rates exceeding 20 percent. Table 13 lists the job classification series (excluding those with fewer than 100 employees) with a turnover rate of 20 percent or more during fiscal year 2011. (See Appendix 4 for turnover rates for all job classification series.)
Table 13
Job Classification Series with Turnover Rates of 20 Percent or More during Fiscal Year 2011
(Excludes job classification series with fewer than 100 employees)
Job Classification Series Average
Headcount
Percentage of
Headcount Separations
Percentage of
Separations Turnover
Rate
Mental Retardation Assistant 7,884.00 5.1% 3,327 12.8% 42.2%
Juvenile Correctional Officer 1,887.75 1.2% 748 2.9% 39.6%
Licensed Vocational Nurse 1,253.25 0.8% 420 1.6% 33.5%
Psychiatric Nursing Assistant 3,075.75 2.0% 888 3.4% 28.9%
Laundry/Sewing Room Worker 120.75 0.1% 33 0.1% 27.3%
Food Service Worker 752.50 0.5% 205 0.8% 27.2%
Child Protective Services Specialist 5,309.75 3.4% 1,249 4.8% 23.5%
Trooper Trainee/Probationary Trooper 240.25 0.2% 56 0.2% 23.3%
Nurse 2,439.75 1.6% 563 2.2% 23.1%
Security Officer 601.00 0.4% 137 0.5% 22.8%
Correctional Officer 27,296.50 17.7% 6,092 23.4% 22.3%
Project Manager 150.75 0.1% 33 0.1% 21.9%
Engineering Aide 227.25 0.1% 48 0.2% 21.1%
Registered Therapists Assistant/Therapist 260.50 0.2% 55 0.2% 21.1%
Case Manager 405.00 0.3% 84 0.3% 20.7%
Substance Abuse Counselor 101.75 0.1% 21 0.1% 20.6%
Veterans Service Representative 272.50 0.2% 56 0.2% 20.6%
Sources: Uniform Statewide Payroll/Personnel System, Human Resources Information System, and Standardized Payroll/Personnel Reporting System.

An Annual Report on Classified Employee Turnover for Fiscal Year 2011 SAO Report No. 12-701
December 2011 Page 15
Chapter 2-J
Turnover by Length of State Service
Employees with fewer than two years of state service had the highest turnover rate (38.2 percent) in fiscal year 2011. Those employees comprised 16.9 percent of the employee population; however, they accounted for 38.4 percent of overall separations.
Table 14 lists the fiscal year 2011 turnover rates by length of state service.
Table 14
Turnover by Length of State Service during Fiscal Year 2011
Length of State Service Average
Headcount
Percentage of
Headcount Separations
Percentage of
Separations Turnover
Rate a
Fewer than 2 years 26,155.00 16.9% 10,004 38.4% 38.2%
2 to 4.99 years 30,405.25 19.7% 5,555 21.3% 18.3%
5 to 9.99 years 27,728.00 18.0% 3,046 11.7% 11.0%
10 to 14.99 years 23,963.50 15.5% 2,143 8.2% 8.9%
15 to 19.99 years 20,259.75 13.1% 1,598 6.1% 7.9%
20 to 24.99 years 13,239.00 8.6% 1,416 5.5% 10.7%
25 to 29.99 years 7,474.50 4.8% 1,234 4.8% 16.5%
30 to 34.99 years 3,441.00 2.2% 729 2.8% 21.2%
More than 35 years 1,820.50 1.2% 303 1.2% 16.6%
Totals 154,486.50 100.0% 26,028 100.0% 16.8%
a
Sources: Uniform Statewide Payroll/Personnel System, Human Resources Information System, and Standardized Payroll/Personnel Reporting System.
Percentages do not sum exactly to 100.0 due to rounding.

An Annual Report on Classified Employee Turnover for Fiscal Year 2011 SAO Report No. 12-701
December 2011 Page 16
Chapter 2-K
Turnover by Region and County
The West Texas region experienced the highest turnover rate (26.7 percent) during fiscal year 2011 among all regions of the state. The Capital region, which has the largest percentage of state employees (25.0 percent), experienced a turnover rate of 12.3 percent during fiscal year 2011, which was lower than the statewide average. Table 15 lists turnover rates by region.
Seventy-three counties experienced turnover rates that exceeded the overall statewide turnover rate of 16.8 percent for classified regular, full- and part-time employees. (See Appendix 5 for turnover rates for all Texas regions and each county within a region.)
Table 15
Turnover by Region during Fiscal Year 2011 a
Region Average
Headcount
Percentage of
Headcount Separations
Percentage of
Separations Turnover
Rate
01 – Alamo 9,829.50 6.4% 1,965 7.5% 20.0%
02 – Capital 38,652.00 25.0% 4,747 18.2% 12.3%
03 - Central Texas 11,470.50 7.4% 2,199 8.4% 19.2%
04 - Coastal Bend 5,934.25 3.8% 1,190 4.6% 20.1%
05 - Gulf Coast 23,749.75 15.4% 3,494 13.4% 14.7%
06 - High Plains 7,948.25 5.2% 1,655 6.4% 20.8%
07 – Metroplex 15,232.50 9.9% 2,542 9.8% 16.7%
08 - Northwest Texas 9,431.75 6.1% 2,035 7.8% 21.6%
09 - South Texas Border 6,515.75 4.2% 827 3.2% 12.7%
10 – Southeast Texas 7,901.00 5.1% 2,080 8.1% 26.3%
11 - Upper East Texas 9,612.50 6.2% 1,652 6.3% 17.2%
12 - Upper Rio Grande 3,530.75 2.3% 395 1.5% 11.2%
13 – West Texas 4,673.25 3.0% 1,247 4.8% 26.7%
14 – Other 4.75 0.0% 0 0.0% 0.0%
Totals 154,486.50 100.0% 26,028 100.0% 16.8%
An Annual Report on Classified Employee Turnover for Fiscal Year 2011 SAO Report No. 12-701
December 2011 Page 17
Appendices
Appendix 1
Objective, Scope, and Methodology
Objective
The objective of this report was to provide and analyze information on employee turnover.
Scope
The scope of this report included classified regular, full- and part-time employees in state agencies during fiscal year 2011. This report does not include data from higher education institutions.
Methodology
The state turnover rate is the percentage of classified regular, full- and part-time state employees, excluding employees at higher education institutions, who voluntarily and involuntarily separate from the State.
Interagency transfers are excluded from the calculation of the State’s overall turnover rate because employees who transfer to other state agencies and higher education institutions are not considered a loss to the State as a whole. However, in determining turnover rates by agency, interagency transfers are included because they are considered a loss for the agency.
This analysis was prepared from quarterly and year-end summary information received from the Comptroller of Public Accounts’ Human Resources Information System (HRIS), Uniform Statewide Payroll/Personnel System (USPS), and Standardized Payroll/Personnel Reporting System (SPRS). The data contained in these systems is self-reported by state agencies. The data has not been independently verified by the State Auditor’s Office.
The following formula was used to determine the State’s turnover rate:
( Number of separations during the fiscal year ) x 100 Average number of classified employees during the fiscal year 4
4 The “average number of classified employees” was calculated by totaling the number of classified employees (defined as
employees who worked at any time during a quarter) for each quarter of fiscal year 2011 and then dividing this total by four quarters.
An Annual Report on Classified Employee Turnover for Fiscal Year 2011 SAO Report No. 12-701
December 2011 Page 18
Project Information
Fieldwork was conducted from October 2011 through December 2011. The information in this report was not subjected to all the tests and confirmations that would be performed in an audit. However, the information in this report was subject to certain quality control procedures to ensure accuracy.
The following members of the State Auditor’s Office staff performed the field work for this report:
Sharon Schneider, PHR (Project Manager)
Stacey Robbins McClure, MBA, CCP, PHR
Debra Serrins (Information Technology Systems Support)
Dennis Ray Bushnell, CPA (Quality Control Reviewer)
Nicole M. Guerrero, MBA, CIA, CGAP, CICA (Audit Manager)
An Annual Report on Classified Employee Turnover for Fiscal Year 2011 SAO Report No. 12-701
December 2011 Page 19
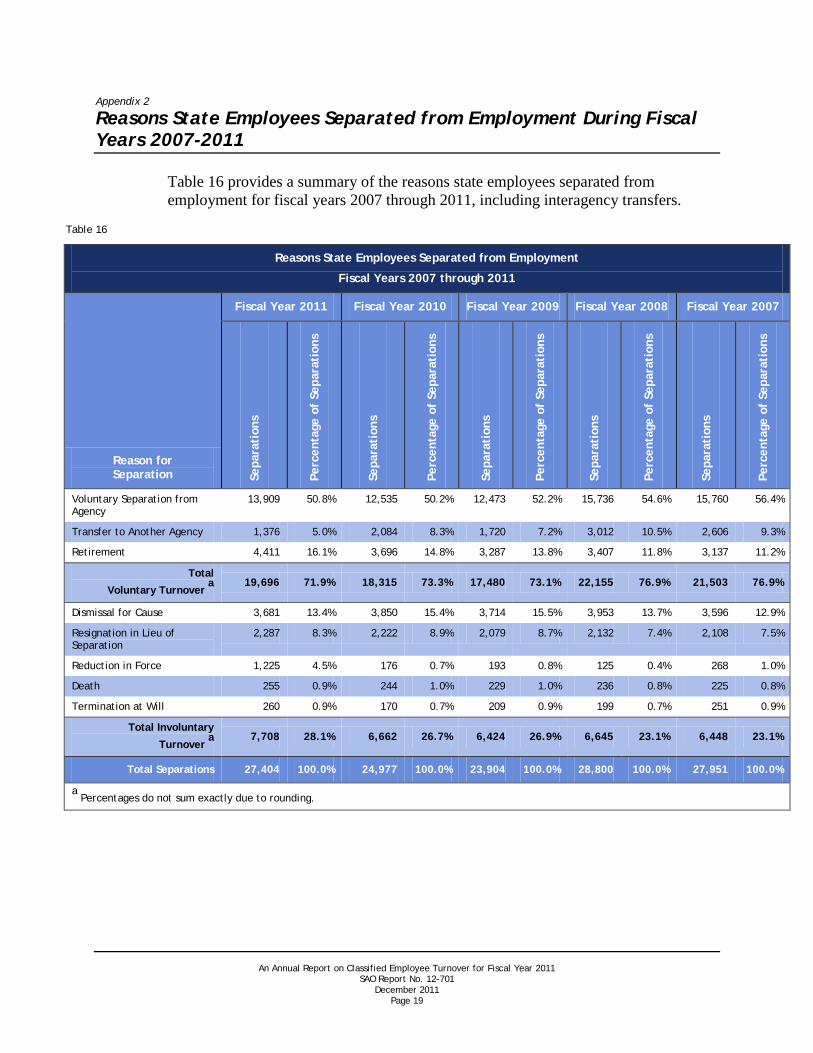
Appendix 2
Reasons State Employees Separated from Employment During Fiscal Years 2007-2011
Table 16 provides a summary of the reasons state employees separated from employment for fiscal years 2007 through 2011, including interagency transfers.
Table 16
Reasons State Employees Separated from Employment
Fiscal Years 2007 through 2011
Reason for Separation
Fiscal Year 2011 Fiscal Year 2010 Fiscal Year 2009 Fiscal Year 2008 Fiscal Year 2007
Sep
arat
ions
Per
cent
age
of S
epar
atio
ns
Sep
arat
ions
Per
cent
age
of S
epar
atio
ns
Sep
arat
ions
Per
cent
age
of S
epar
atio
ns
Sep
arat
ions
Per
cent
age
of S
epar
atio
ns
Sep
arat
ions
Per
cent
age
of S
epar
atio
ns
Voluntary Separation from Agency
13,909 50.8% 12,535 50.2% 12,473 52.2% 15,736 54.6% 15,760 56.4%
Transfer to Another Agency 1,376 5.0% 2,084 8.3% 1,720 7.2% 3,012 10.5% 2,606 9.3%
Retirement 4,411 16.1% 3,696 14.8% 3,287 13.8% 3,407 11.8% 3,137 11.2%
Total
Voluntary Turnover 19,696 a
71.9% 18,315 73.3% 17,480 73.1% 22,155 76.9% 21,503 76.9%
Dismissal for Cause 3,681 13.4% 3,850 15.4% 3,714 15.5% 3,953 13.7% 3,596 12.9%
Resignation in Lieu of Separation
2,287 8.3% 2,222 8.9% 2,079 8.7% 2,132 7.4% 2,108 7.5%
Reduction in Force 1,225 4.5% 176 0.7% 193 0.8% 125 0.4% 268 1.0%
Death 255 0.9% 244 1.0% 229 1.0% 236 0.8% 225 0.8%
Termination at Will 260 0.9% 170 0.7% 209 0.9% 199 0.7% 251 0.9%
Total Involuntary
Turnover 7,708 a
28.1% 6,662 26.7% 6,424 26.9% 6,645 23.1% 6,448 23.1%
Total Separations 27,404 100.0% 24,977 100.0% 23,904 100.0% 28,800 100.0% 27,951 100.0%
a Percentages do not sum exactly due to rounding.
An Annual Report on Classified Employee Turnover for Fiscal Year 2011 SAO Report No. 12-701
December 2011 Page 20
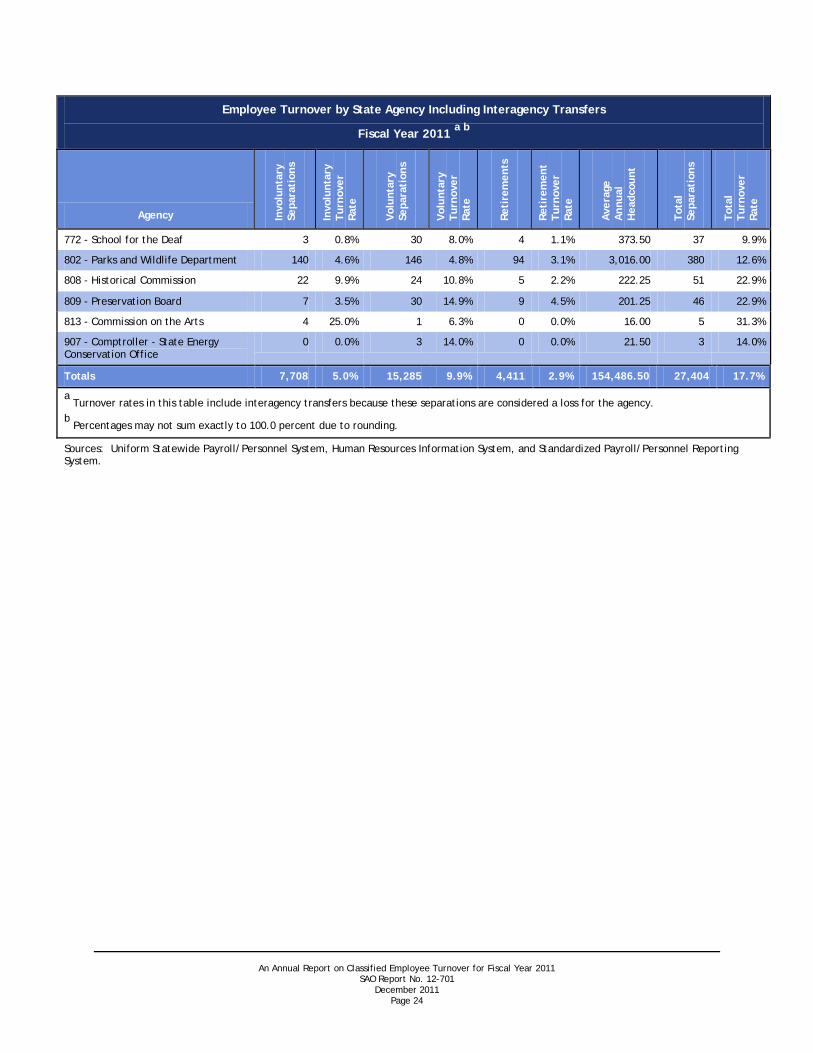
Appendix 3
Employee Turnover by State Agency
Table 17 provides information on classified regular, full- and part-time employee turnover by state agency, excluding higher education institutions. These totals include interagency transfers because they are considered a loss for the agency.
Table 17
Employee Turnover by State Agency Including Interagency Transfers
Fiscal Year 2011 a b
Agency Invo
lunt
ary
Sepa
rati
ons
Invo
lunt
ary
Turn
over
Ra
te
Vol
unta
ry
Sepa
rati
ons
Vol
unta
ry
Turn
over
Ra
te
Reti
rem
ents
Reti
rem
ent
Turn
over
Ra
te
Ave
rage
A
nnua
l H
eadc
ount
Tota
l Se
para
tion
s
Tota
l Tu
rnov
er
Rate
201 - Supreme Court of Texas 0 0.0% 25 35.5% 0 0.0% 70.50 25 35.5%
211 - Court of Criminal Appeals 1 1.6% 12 19.8% 2 3.3% 60.75 15 24.7%
212 - Judicial Council Office of Court Administration
3 1.6% 12 6.3% 2 1.0% 190.75 17 8.9%
213 - Office of the State Prosecuting Attorney
2 47.1% 0 0.0% 0 0.0% 4.25 2 47.1%
215 – Office of Capital Writs 1 11.4% 1 11.4% 0 0.0% 8.75 2 22.9%
221 - First Court of Appeals District, Houston
0 0.0% 13 31.1% 0 0.0% 41.75 13 31.1%
222 - Second Court of Appeals District, Fort Worth
0 0.0% 5 15.7% 1 3.1% 31.75 6 18.9%
223 - Third Court of Appeals District, Austin
2 6.5% 8 25.8% 1 3.2% 31.00 11 35.5%
224 - Fourth Court of Appeals District, San Antonio
0 0.0% 4 14.4% 1 3.6% 27.75 5 18.0%
225 - Fifth Court of Appeals District, Dallas
1 2.0% 2 4.0% 1 2.0% 49.50 4 8.1%
226 - Sixth Court of Appeals District, Texarkana
0 0.0% 0 0.0% 0 0.0% 13.00 0 0.0%
227 - Seventh Court of Appeals District, Amarillo
0 0.0% 0 0.0% 0 0.0% 16.00 0 0.0%
228 - Eighth Court of Appeals District, El Paso
0 0.0% 1 6.9% 1 6.9% 14.50 2 13.8%
229 - Ninth Court of Appeals District, Beaumont
0 0.0% 0 0.0% 0 0.0% 17.00 0 0.0%
230 - Tenth Court of Appeals District, Waco
0 0.0% 1 7.8% 0 0.0% 12.75 1 7.8%
231 - Eleventh Court of Appeals District, Eastland
0 0.0% 1 7.7% 1 7.7% 13.00 2 15.4%
232 - Twelfth Court of Appeals District, Tyler
1 8.3% 0 0.0% 0 0.0% 12.00 1 8.3%
233 - Thirteenth Court of Appeals District, Corpus Christi
0 0.0% 5 18.3% 0 0.0% 27.25 5 18.3%

An Annual Report on Classified Employee Turnover for Fiscal Year 2011 SAO Report No. 12-701
December 2011 Page 21
Employee Turnover by State Agency Including Interagency Transfers
Fiscal Year 2011 a b
Agency Invo
lunt
ary
Sepa
rati
ons
Invo
lunt
ary
Turn
over
Ra
te
Vol
unta
ry
Sepa
rati
ons
Vol
unta
ry
Turn
over
Ra
te
Reti
rem
ents
Reti
rem
ent
Turn
over
Ra
te
Ave
rage
A
nnua
l H
eadc
ount
Tota
l Se
para
tion
s
Tota
l Tu
rnov
er
Rate
234 - Fourteenth Court of Appeals District, Houston
2 5.7% 6 17.0% 0 0.0% 35.25 8 22.7%
242 - State Commission on Judicial Conduct
0 0.0% 1 7.7% 1 7.7% 13.00 2 15.4%
243 - State Law Library 0 0.0% 4 30.8% 0 0.0% 13.00 4 30.8%
301 - Office of the Governor 3 2.0% 32 21.4% 6 4.0% 149.25 41 27.5%
302 - Office of the Attorney General 27 0.6% 358 8.5% 119 2.8% 4,198.00 504 12.0%
303 - Texas Facilities Commission 15 5.4% 24 8.7% 11 4.0% 275.75 50 18.1%
304 – Office of the Comptroller of Public Accounts
39 1.3% 188 6.5% 106 3.6% 2,914.00 333 11.4%
305 - General Land Office and Veteran’s Land Board
17 2.9% 22 3.8% 59 10.1% 583.75 98 16.8%
306 - Library and Archives Commission
15 8.0% 17 9.1% 4 2.1% 187.25 36 19.2%
307 - Secretary of State 5 2.4% 17 8.3% 5 2.4% 205.25 27 13.2%
312 – State Securities Board 3 3.1% 6 6.2% 4 4.1% 96.50 13 13.5%
313 - Department of Information Resources
18 8.6% 8 3.8% 18 8.6% 209.50 44 21.0%
320 - Texas Workforce Commission 38 1.2% 201 6.2% 123 3.8% 3,252.25 362 11.1%
323 - Teacher Retirement System 0 0.0% 20 3.8% 17 3.3% 522.25 37 7.1%
325 - Fire Fighters' Pension Commissioner
1 12.9% 1 12.9% 0 0.0% 7.75 2 25.8%
327 - Employees Retirement System 5 1.5% 28 8.6% 11 3.4% 324.00 44 13.6%
329 - Real Estate Commission 1 1.0% 11 11.2% 0 0.0% 98.50 12 12.2%
332 - Department of Housing and Community Affairs
6 1.6% 62 16.6% 8 2.1% 374.00 76 20.3%
338 - Pension Review Board 0 0.0% 2 20.0% 1 10.0% 10.00 3 30.0%
347 - Public Finance Authority 0 0.0% 0 0.0% 1 8.7% 11.50 1 8.7%
352 - Bond Review Board 1 12.1% 0 0.0% 1 12.1% 8.25 2 24.2%
356 - Texas Ethics Commission 0 0.0% 2 6.3% 1 3.1% 32.00 3 9.4%
357 - Department of Rural Affairs 27 29.3% 25 27.1% 8 8.7% 92.25 60 65.0%
359 - Office of Public Insurance Counsel
0 0.0% 1 9.8% 0 0.0% 10.25 1 9.8%
360 - State Office of Administrative Hearings
0 0.0% 5 4.4% 7 6.2% 112.50 12 10.7%
362 - Lottery Commission 1 0.3% 7 2.2% 9 2.8% 320.25 17 5.3%
364 - Health Professions Council 1 20.0% 0 0.0% 0 0.0% 5.00 1 20.0%
401 - Adjutant General's Department 15 2.4% 64 10.1% 24 3.8% 634.00 103 16.2%

An Annual Report on Classified Employee Turnover for Fiscal Year 2011 SAO Report No. 12-701
December 2011 Page 22
Employee Turnover by State Agency Including Interagency Transfers
Fiscal Year 2011 a b
Agency Invo
lunt
ary
Sepa
rati
ons
Invo
lunt
ary
Turn
over
Ra
te
Vol
unta
ry
Sepa
rati
ons
Vol
unta
ry
Turn
over
Ra
te
Reti
rem
ents
Reti
rem
ent
Turn
over
Ra
te
Ave
rage
A
nnua
l H
eadc
ount
Tota
l Se
para
tion
s
Tota
l Tu
rnov
er
Rate
403 - Veterans Commission 16 4.7% 40 11.7% 16 4.7% 341.75 72 21.1%
405 - Department of Public Safety 66 0.8% 548 6.4% 232 2.7% 8,508.50 846 9.9%
407 - Commission on Law Enforcement Officer Standards and Education
3 6.9% 3 6.9% 2 4.6% 43.25 8 18.5%
409 - Commission on Jail Standards 3 17.4% 1 5.8% 0 0.0% 17.25 4 23.2%
411 - Commission on Fire Protection 1 2.9% 5 14.7% 4 11.8% 34.00 10 29.4%
448 - Office of Injured Employee Counsel
4 2.5% 11 6.8% 3 1.8% 162.25 18 11.1%
450 - Department of Savings and Mortgage Lending
0 0.0% 0 0.0% 1 1.6% 60.75 1 1.6%
451 - Department of Banking 2 1.0% 14 7.3% 3 1.6% 192.25 19 9.9%
452 - Department of Licensing and Regulation
6 1.6% 20 5.4% 8 2.2% 368.00 34 9.2%
454 - Department of Insurance 22 1.4% 73 4.8% 53 3.5% 1,530.50 148 9.7%
455 - Railroad Commission 0 0.0% 56 8.6% 36 5.5% 650.25 92 14.1%
456 - State Board of Plumbing Examiners
1 4.3% 0 0.0% 1 4.3% 23.00 2 8.7%
457 - Board of Public Accountancy 0 0.0% 5 12.0% 1 2.4% 41.50 6 14.5%
458 - Alcoholic Beverage Commission 3 0.5% 33 5.3% 28 4.5% 617.25 64 10.4%
459 - Board of Architectural Examiners
1 4.5% 3 13.6% 1 4.5% 22.00 5 22.7%
460 - Board of Professional Engineers 0 0.0% 3 10.6% 0 0.0% 28.25 3 10.6%
464 - Board of Professional Land Surveying
0 0.0% 1 19.0% 0 0.0% 5.25 1 19.0%
466 - Office of Consumer Credit Commissioner
1 1.7% 5 8.5% 2 3.4% 59.00 8 13.6%
469 - Credit Union Department 0 0.0% 2 8.7% 0 0.0% 23.00 2 8.7%
473 - Public Utility Commission 7 3.9% 11 6.1% 5 2.8% 181.50 23 12.7%
475 - Office of Public Utility Counsel 3 18.2% 1 6.1% 0 0.0% 16.50 4 24.2%
476 - Racing Commission 0 0.0% 3 4.8% 7 11.1% 63.00 10 15.9%
477 - Commission on State Emergency Communications
0 0.0% 0 0.0% 1 4.0% 25.00 1 4.0%
479 - State Office of Risk Management 3 2.4% 16 13.0% 1 0.8% 123.50 20 16.2%
481 - Board of Professional Geoscientists
0 0.0% 1 14.3% 0 0.0% 7.00 1 14.3%
503 - Texas Medical Board 1 0.6% 17 10.6% 4 2.5% 160.00 22 13.8%
504 - State Board of Dental Examiners 0 0.0% 8 23.0% 2 5.8% 34.75 10 28.8%
An Annual Report on Classified Employee Turnover for Fiscal Year 2011 SAO Report No. 12-701
December 2011 Page 23
Employee Turnover by State Agency Including Interagency Transfers
Fiscal Year 2011 a b
Agency Invo
lunt
ary
Sepa
rati
ons
Invo
lunt
ary
Turn
over
Ra
te
Vol
unta
ry
Sepa
rati
ons
Vol
unta
ry
Turn
over
Ra
te
Reti
rem
ents
Reti
rem
ent
Turn
over
Ra
te
Ave
rage
A
nnua
l H
eadc
ount
Tota
l Se
para
tion
s
Tota
l Tu
rnov
er
Rate
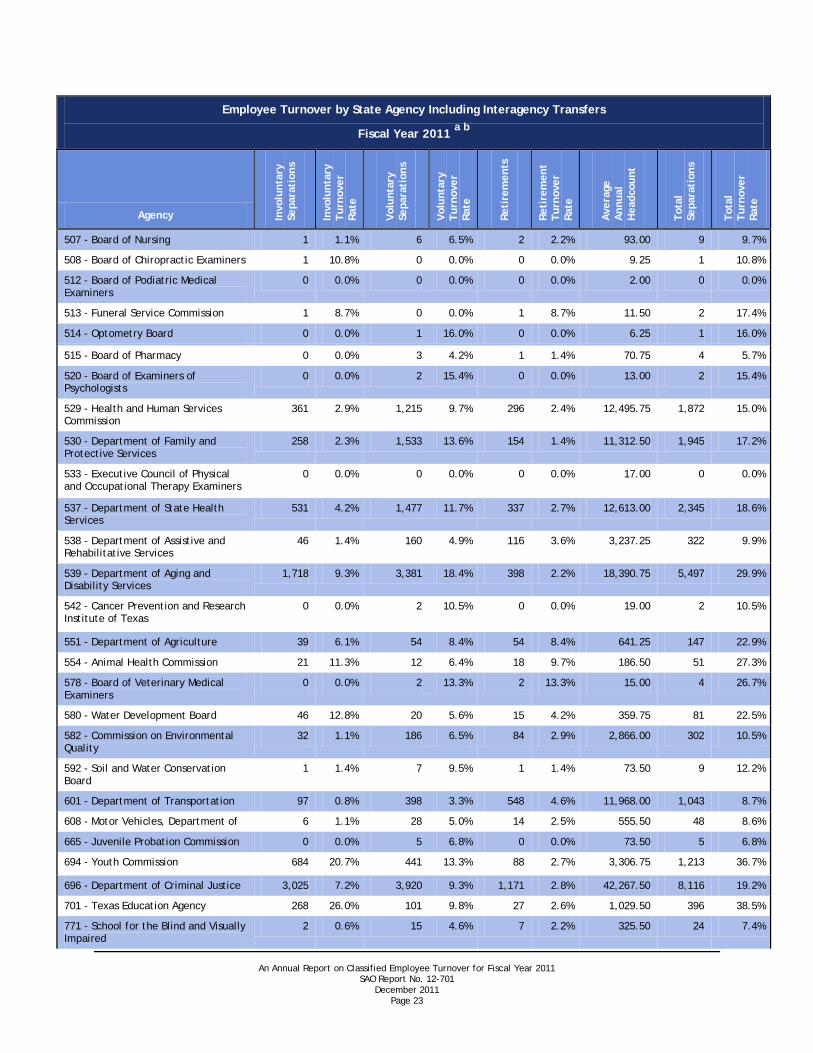
507 - Board of Nursing 1 1.1% 6 6.5% 2 2.2% 93.00 9 9.7%
508 - Board of Chiropractic Examiners 1 10.8% 0 0.0% 0 0.0% 9.25 1 10.8%
512 - Board of Podiatric Medical Examiners
0 0.0% 0 0.0% 0 0.0% 2.00 0 0.0%
513 - Funeral Service Commission 1 8.7% 0 0.0% 1 8.7% 11.50 2 17.4%
514 - Optometry Board 0 0.0% 1 16.0% 0 0.0% 6.25 1 16.0%
515 - Board of Pharmacy 0 0.0% 3 4.2% 1 1.4% 70.75 4 5.7%
520 - Board of Examiners of Psychologists
0 0.0% 2 15.4% 0 0.0% 13.00 2 15.4%
529 - Health and Human Services Commission
361 2.9% 1,215 9.7% 296 2.4% 12,495.75 1,872 15.0%
530 - Department of Family and Protective Services
258 2.3% 1,533 13.6% 154 1.4% 11,312.50 1,945 17.2%
533 - Executive Council of Physical and Occupational Therapy Examiners
0 0.0% 0 0.0% 0 0.0% 17.00 0 0.0%
537 - Department of State Health Services
531 4.2% 1,477 11.7% 337 2.7% 12,613.00 2,345 18.6%
538 - Department of Assistive and Rehabilitative Services
46 1.4% 160 4.9% 116 3.6% 3,237.25 322 9.9%
539 - Department of Aging and Disability Services
1,718 9.3% 3,381 18.4% 398 2.2% 18,390.75 5,497 29.9%
542 - Cancer Prevention and Research Institute of Texas
0 0.0% 2 10.5% 0 0.0% 19.00 2 10.5%
551 - Department of Agriculture 39 6.1% 54 8.4% 54 8.4% 641.25 147 22.9%
554 - Animal Health Commission 21 11.3% 12 6.4% 18 9.7% 186.50 51 27.3%
578 - Board of Veterinary Medical Examiners
0 0.0% 2 13.3% 2 13.3% 15.00 4 26.7%
580 - Water Development Board 46 12.8% 20 5.6% 15 4.2% 359.75 81 22.5%
582 - Commission on Environmental Quality
32 1.1% 186 6.5% 84 2.9% 2,866.00 302 10.5%
592 - Soil and Water Conservation Board
1 1.4% 7 9.5% 1 1.4% 73.50 9 12.2%
601 - Department of Transportation 97 0.8% 398 3.3% 548 4.6% 11,968.00 1,043 8.7%
608 - Motor Vehicles, Department of 6 1.1% 28 5.0% 14 2.5% 555.50 48 8.6%
665 - Juvenile Probation Commission 0 0.0% 5 6.8% 0 0.0% 73.50 5 6.8%
694 - Youth Commission 684 20.7% 441 13.3% 88 2.7% 3,306.75 1,213 36.7%
696 - Department of Criminal Justice 3,025 7.2% 3,920 9.3% 1,171 2.8% 42,267.50 8,116 19.2%
701 - Texas Education Agency 268 26.0% 101 9.8% 27 2.6% 1,029.50 396 38.5%
771 - School for the Blind and Visually Impaired
2 0.6% 15 4.6% 7 2.2% 325.50 24 7.4%
An Annual Report on Classified Employee Turnover for Fiscal Year 2011 SAO Report No. 12-701
December 2011 Page 24
Employee Turnover by State Agency Including Interagency Transfers
Fiscal Year 2011 a b
Agency Invo
lunt
ary
Sepa
rati
ons
Invo
lunt
ary
Turn
over
Ra
te
Vol
unta
ry
Sepa
rati
ons
Vol
unta
ry
Turn
over
Ra
te
Reti
rem
ents
Reti
rem
ent
Turn
over
Ra
te
Ave
rage
A
nnua
l H
eadc
ount
Tota
l Se
para
tion
s
Tota
l Tu
rnov
er
Rate
772 - School for the Deaf 3 0.8% 30 8.0% 4 1.1% 373.50 37 9.9%
802 - Parks and Wildlife Department 140 4.6% 146 4.8% 94 3.1% 3,016.00 380 12.6%
808 - Historical Commission 22 9.9% 24 10.8% 5 2.2% 222.25 51 22.9%
809 - Preservation Board 7 3.5% 30 14.9% 9 4.5% 201.25 46 22.9%
813 - Commission on the Arts 4 25.0% 1 6.3% 0 0.0% 16.00 5 31.3%
907 - Comptroller - State Energy Conservation Office
0 0.0% 3 14.0% 0 0.0% 21.50 3 14.0%
Totals 7,708 5.0% 15,285 9.9% 4,411 2.9% 154,486.50 27,404 17.7%
a Turnover rates in this table include interagency transfers because these separations are considered a loss for the agency.
b
Sources: Uniform Statewide Payroll/Personnel System, Human Resources Information System, and Standardized Payroll/Personnel Reporting System.
Percentages may not sum exactly to 100.0 percent due to rounding.

An Annual Report on Classified Employee Turnover for Fiscal Year 2011 SAO Report No. 12-701
December 2011 Page 25
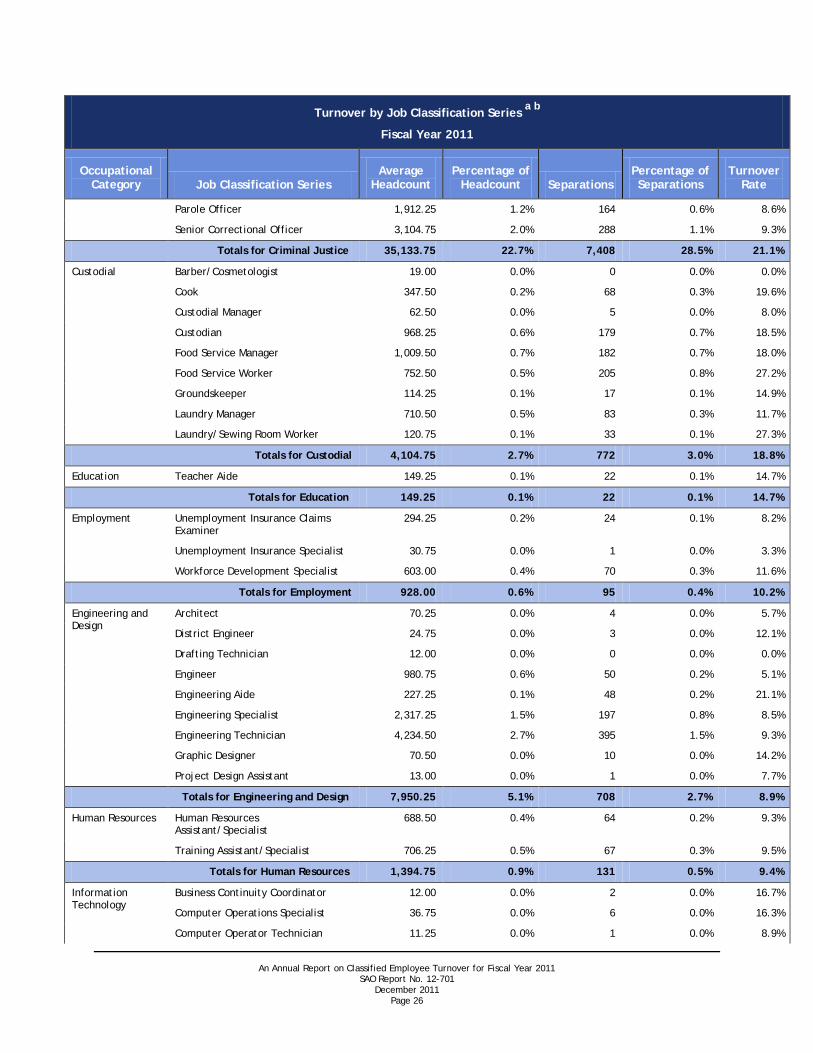
Appendix 4
Turnover by Job Classification Series
Table 18 provides a summary of turnover by job classification series.
Table 18
Turnover by Job Classification Series
Fiscal Year 2011
a b
Occupational Category Job Classification Series
Average Headcount
Percentage of Headcount Separations
Percentage of Separations
Turnover Rate
Accounting, Auditing, and Finance
Accountant 1,594.75 1.0% 145 0.6% 9.1%
Accounting Technician 215.25 0.1% 31 0.1% 14.4%
Accounts Examiner 941.50 0.6% 98 0.4% 10.4%
Auditor 1,357.75 0.9% 154 0.6% 11.3%
Budget Analyst 407.00 0.3% 36 0.1% 8.8%
Chief Investment Officer 3.00 0.0% 0 0.0% 0.0%
Chief Trader 2.50 0.0% 0 0.0% 0.0%
Financial Analyst 128.75 0.1% 14 0.1% 10.9%
Financial Examiner 380.25 0.2% 31 0.1% 8.2%
Investment Analyst 48.75 0.0% 1 0.0% 2.1%
Loan Specialist 24.50 0.0% 1 0.0% 4.1%
Portfolio Manager 84.25 0.1% 9 0.0% 10.7%
Reimbursement Officer 82.25 0.1% 8 0.0% 9.7%
Taxpayer Compliance Officer 394.25 0.3% 33 0.1% 8.4%
Trader 8.00 0.0% 1 0.0% 12.5%
Totals for Accounting, Auditing, and Finance 5,672.75 3.7% 562 2.2% 9.9%
Administrative Support
Administrative Assistant 9,740.25 6.3% 1,157 4.4% 11.9%
Clerk 5,923.00 3.8% 1,087 4.2% 18.4%
Customer Service Representative 1,013.75 0.7% 129 0.5% 12.7%
Executive Assistant 564.75 0.4% 54 0.2% 9.6%
License and Permit Specialist 244.75 0.2% 20 0.1% 8.2%
Receptionist 83.25 0.1% 19 0.1% 22.8%
Totals for Administrative Support 17,569.75 11.4% 2,466 9.5% 14.0%
Criminal Justice Agriculture Specialist 118.50 0.1% 17 0.1% 14.3%
Assistant Warden/Warden 185.75 0.1% 21 0.1% 11.3%
Correctional Officer 27,296.50 17.7% 6,092 23.4% 22.3%
Correctional Transportation Officer 120.75 0.1% 15 0.1% 12.4%
Counsel Substitute 97.75 0.1% 8 0.0% 8.2%
Dorm Supervisor 24.50 0.0% 2 0.0% 8.2%
Industrial Specialist 385.25 0.2% 53 0.2% 13.8%
Juvenile Correctional Officer 1,887.75 1.2% 748 2.9% 39.6%
An Annual Report on Classified Employee Turnover for Fiscal Year 2011 SAO Report No. 12-701
December 2011 Page 26
Turnover by Job Classification Series
Fiscal Year 2011
a b
Occupational Category Job Classification Series
Average Headcount
Percentage of Headcount Separations
Percentage of Separations
Turnover Rate
Parole Officer 1,912.25 1.2% 164 0.6% 8.6%
Senior Correctional Officer 3,104.75 2.0% 288 1.1% 9.3%
Totals for Criminal Justice 35,133.75 22.7% 7,408 28.5% 21.1%
Custodial Barber/Cosmetologist 19.00 0.0% 0 0.0% 0.0%
Cook 347.50 0.2% 68 0.3% 19.6%
Custodial Manager 62.50 0.0% 5 0.0% 8.0%
Custodian 968.25 0.6% 179 0.7% 18.5%
Food Service Manager 1,009.50 0.7% 182 0.7% 18.0%
Food Service Worker 752.50 0.5% 205 0.8% 27.2%
Groundskeeper 114.25 0.1% 17 0.1% 14.9%
Laundry Manager 710.50 0.5% 83 0.3% 11.7%
Laundry/Sewing Room Worker 120.75 0.1% 33 0.1% 27.3%
Totals for Custodial 4,104.75 2.7% 772 3.0% 18.8%
Education Teacher Aide 149.25 0.1% 22 0.1% 14.7%
Totals for Education 149.25 0.1% 22 0.1% 14.7%
Employment Unemployment Insurance Claims Examiner
294.25 0.2% 24 0.1% 8.2%
Unemployment Insurance Specialist 30.75 0.0% 1 0.0% 3.3%
Workforce Development Specialist 603.00 0.4% 70 0.3% 11.6%
Totals for Employment 928.00 0.6% 95 0.4% 10.2%
Engineering and Design
Architect 70.25 0.0% 4 0.0% 5.7%
District Engineer 24.75 0.0% 3 0.0% 12.1%
Drafting Technician 12.00 0.0% 0 0.0% 0.0%
Engineer 980.75 0.6% 50 0.2% 5.1%
Engineering Aide 227.25 0.1% 48 0.2% 21.1%
Engineering Specialist 2,317.25 1.5% 197 0.8% 8.5%
Engineering Technician 4,234.50 2.7% 395 1.5% 9.3%
Graphic Designer 70.50 0.0% 10 0.0% 14.2%
Project Design Assistant 13.00 0.0% 1 0.0% 7.7%
Totals for Engineering and Design 7,950.25 5.1% 708 2.7% 8.9%
Human Resources Human Resources Assistant/Specialist
688.50 0.4% 64 0.2% 9.3%
Training Assistant/Specialist 706.25 0.5% 67 0.3% 9.5%
Totals for Human Resources 1,394.75 0.9% 131 0.5% 9.4%
Information Technology
Business Continuity Coordinator 12.00 0.0% 2 0.0% 16.7%
Computer Operations Specialist 36.75 0.0% 6 0.0% 16.3%
Computer Operator Technician 11.25 0.0% 1 0.0% 8.9%

An Annual Report on Classified Employee Turnover for Fiscal Year 2011 SAO Report No. 12-701
December 2011 Page 27
Turnover by Job Classification Series
Fiscal Year 2011
a b
Occupational Category Job Classification Series
Average Headcount
Percentage of Headcount Separations
Percentage of Separations
Turnover Rate
Data Base Administrator 142.50 0.1% 17 0.1% 11.9%
Data Entry Operator 155.25 0.1% 23 0.1% 14.8%
Geographic Information Specialist 24.75 0.0% 2 0.0% 8.1%
Information Technology Auditor 26.50 0.0% 2 0.0% 7.5%
Information Technology Security Analyst
31.00 0.0% 7 0.0% 22.6%
Network Specialist 575.50 0.4% 52 0.2% 9.0%
Programmer 631.00 0.4% 84 0.3% 13.3%
Systems Analyst 2,291.50 1.5% 234 0.9% 10.2%
Systems Support Specialist 506.50 0.3% 42 0.2% 8.3%
Telecommunications Specialist 151.00 0.1% 18 0.1% 11.9%
Web Administrator 91.25 0.1% 16 0.1% 17.5%
Totals for Information Technology 4,686.75 3.0% 506 1.9% 10.8%
Inspectors and Investigators
Boiler Inspector 16.00 0.0% 2 0.0% 12.5%
Inspector 1,397.00 0.9% 169 0.6% 12.1%
Investigator 1,570.00 1.0% 163 0.6% 10.4%
Totals for Inspectors and Investigators 2,983.00 1.9% 334 1.3% 11.2%
Insurance Actuary 40.25 0.0% 2 0.0% 5.0%
Claims Assistants and Claims Examiner
651.25 0.4% 59 0.2% 9.1%
Insurance Specialist 210.50 0.1% 20 0.1% 9.5%
Insurance Technician 7.50 0.0% 0 0.0% 0.0%
Retirement Systems Benefits Specialist
201.00 0.1% 21 0.1% 10.4%
Totals for Insurance 1,110.50 0.7% 102 0.4% 9.2%
Land Surveying, Appraising, and Utilities
Appraiser 86.25 0.1% 8 0.0% 9.3%
Land Surveyor 30.50 0.0% 2 0.0% 6.6%
Right of Way Agent 129.00 0.1% 8 0.0% 6.2%
Utility Specialist 23.00 0.0% 2 0.0% 8.7%
Totals for Land Surveying, Appraising, and Utilities 268.75 0.2% 20 0.1% 7.4%
Law Enforcement Agent 181.75 0.1% 14 0.1% 7.7%
Agent Trainee 15.25 0.0% 2 0.0% 13.1%
Captain, Public Safety 75.00 0.0% 5 0.0% 6.7%
Commander, Public Safety 1.75 0.0% 0 0.0% 0.0%
Corporal, Public Safety 217.50 0.1% 18 0.1% 8.3%
Game Warden 383.50 0.2% 22 0.1% 5.7%
Game Warden-Assistant Commander/Commander
6.00 0.0% 0 0.0% 0.0%
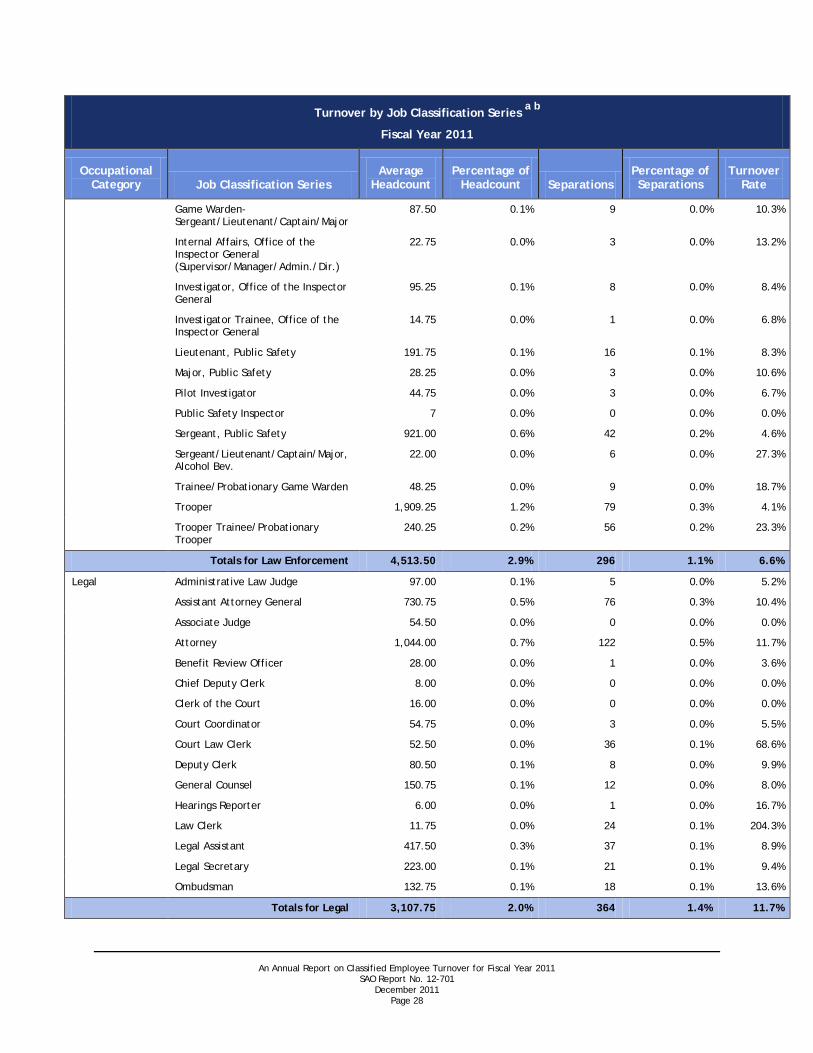
An Annual Report on Classified Employee Turnover for Fiscal Year 2011 SAO Report No. 12-701
December 2011 Page 28
Turnover by Job Classification Series
Fiscal Year 2011
a b
Occupational Category Job Classification Series
Average Headcount
Percentage of Headcount Separations
Percentage of Separations
Turnover Rate
Game Warden-Sergeant/Lieutenant/Captain/Major
87.50 0.1% 9 0.0% 10.3%
Internal Affairs, Office of the Inspector General (Supervisor/Manager/Admin./Dir.)
22.75 0.0% 3 0.0% 13.2%
Investigator, Office of the Inspector General
95.25 0.1% 8 0.0% 8.4%
Investigator Trainee, Office of the Inspector General
14.75 0.0% 1 0.0% 6.8%
Lieutenant, Public Safety 191.75 0.1% 16 0.1% 8.3%
Major, Public Safety 28.25 0.0% 3 0.0% 10.6%
Pilot Investigator 44.75 0.0% 3 0.0% 6.7%
Public Safety Inspector 7 0.0% 0 0.0% 0.0%
Sergeant, Public Safety 921.00 0.6% 42 0.2% 4.6%
Sergeant/Lieutenant/Captain/Major, Alcohol Bev.
22.00 0.0% 6 0.0% 27.3%
Trainee/Probationary Game Warden 48.25 0.0% 9 0.0% 18.7%
Trooper 1,909.25 1.2% 79 0.3% 4.1%
Trooper Trainee/Probationary Trooper
240.25 0.2% 56 0.2% 23.3%
Totals for Law Enforcement 4,513.50 2.9% 296 1.1% 6.6%
Legal Administrative Law Judge 97.00 0.1% 5 0.0% 5.2%
Assistant Attorney General 730.75 0.5% 76 0.3% 10.4%
Associate Judge 54.50 0.0% 0 0.0% 0.0%
Attorney 1,044.00 0.7% 122 0.5% 11.7%
Benefit Review Officer 28.00 0.0% 1 0.0% 3.6%
Chief Deputy Clerk 8.00 0.0% 0 0.0% 0.0%
Clerk of the Court 16.00 0.0% 0 0.0% 0.0%
Court Coordinator 54.75 0.0% 3 0.0% 5.5%
Court Law Clerk 52.50 0.0% 36 0.1% 68.6%
Deputy Clerk 80.50 0.1% 8 0.0% 9.9%
General Counsel 150.75 0.1% 12 0.0% 8.0%
Hearings Reporter 6.00 0.0% 1 0.0% 16.7%
Law Clerk 11.75 0.0% 24 0.1% 204.3%
Legal Assistant 417.50 0.3% 37 0.1% 8.9%
Legal Secretary 223.00 0.1% 21 0.1% 9.4%
Ombudsman 132.75 0.1% 18 0.1% 13.6%
Totals for Legal 3,107.75 2.0% 364 1.4% 11.7%
An Annual Report on Classified Employee Turnover for Fiscal Year 2011 SAO Report No. 12-701
December 2011 Page 29
Turnover by Job Classification Series
Fiscal Year 2011
a b
Occupational Category Job Classification Series
Average Headcount
Percentage of Headcount Separations
Percentage of Separations
Turnover Rate
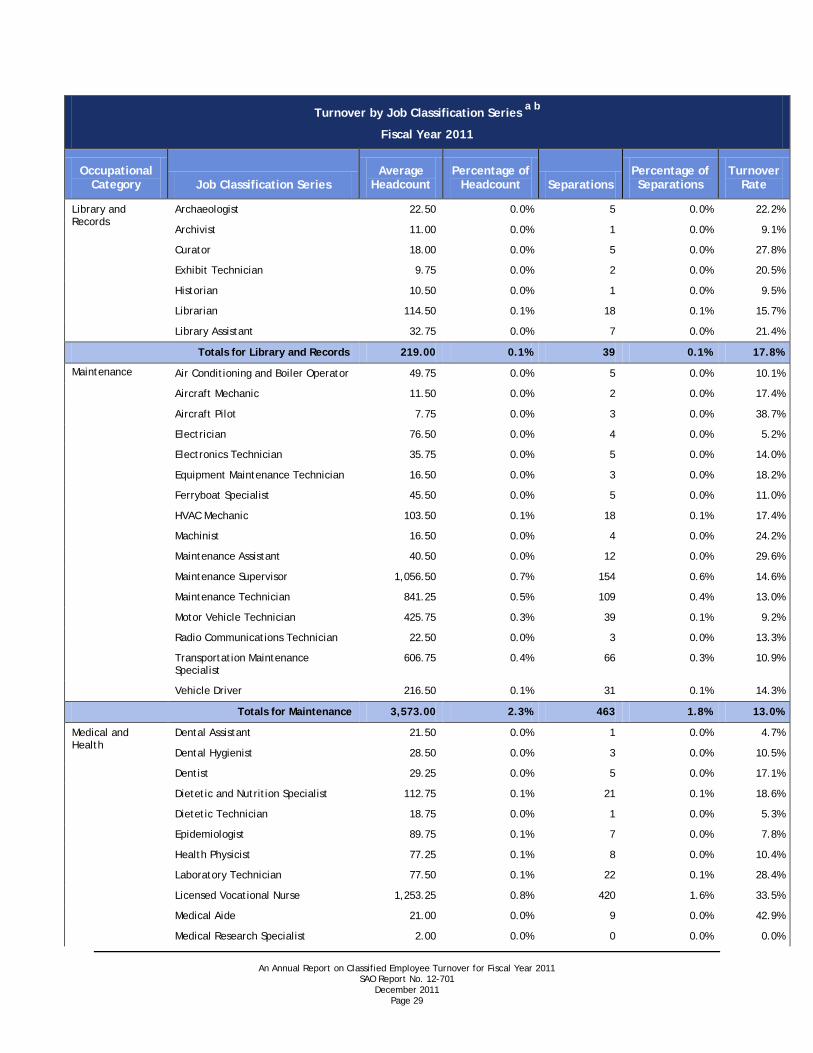
Library and Records
Archaeologist 22.50 0.0% 5 0.0% 22.2%
Archivist 11.00 0.0% 1 0.0% 9.1%
Curator 18.00 0.0% 5 0.0% 27.8%
Exhibit Technician 9.75 0.0% 2 0.0% 20.5%
Historian 10.50 0.0% 1 0.0% 9.5%
Librarian 114.50 0.1% 18 0.1% 15.7%
Library Assistant 32.75 0.0% 7 0.0% 21.4%
Totals for Library and Records 219.00 0.1% 39 0.1% 17.8%
Maintenance Air Conditioning and Boiler Operator 49.75 0.0% 5 0.0% 10.1%
Aircraft Mechanic 11.50 0.0% 2 0.0% 17.4%
Aircraft Pilot 7.75 0.0% 3 0.0% 38.7%
Electrician 76.50 0.0% 4 0.0% 5.2%
Electronics Technician 35.75 0.0% 5 0.0% 14.0%
Equipment Maintenance Technician 16.50 0.0% 3 0.0% 18.2%
Ferryboat Specialist 45.50 0.0% 5 0.0% 11.0%
HVAC Mechanic 103.50 0.1% 18 0.1% 17.4%
Machinist 16.50 0.0% 4 0.0% 24.2%
Maintenance Assistant 40.50 0.0% 12 0.0% 29.6%
Maintenance Supervisor 1,056.50 0.7% 154 0.6% 14.6%
Maintenance Technician 841.25 0.5% 109 0.4% 13.0%
Motor Vehicle Technician 425.75 0.3% 39 0.1% 9.2%
Radio Communications Technician 22.50 0.0% 3 0.0% 13.3%
Transportation Maintenance Specialist
606.75 0.4% 66 0.3% 10.9%
Vehicle Driver 216.50 0.1% 31 0.1% 14.3%
Totals for Maintenance 3,573.00 2.3% 463 1.8% 13.0%
Medical and Health
Dental Assistant 21.50 0.0% 1 0.0% 4.7%
Dental Hygienist 28.50 0.0% 3 0.0% 10.5%
Dentist 29.25 0.0% 5 0.0% 17.1%
Dietetic and Nutrition Specialist 112.75 0.1% 21 0.1% 18.6%
Dietetic Technician 18.75 0.0% 1 0.0% 5.3%
Epidemiologist 89.75 0.1% 7 0.0% 7.8%
Health Physicist 77.25 0.1% 8 0.0% 10.4%
Laboratory Technician 77.50 0.1% 22 0.1% 28.4%
Licensed Vocational Nurse 1,253.25 0.8% 420 1.6% 33.5%
Medical Aide 21.00 0.0% 9 0.0% 42.9%
Medical Research Specialist 2.00 0.0% 0 0.0% 0.0%

An Annual Report on Classified Employee Turnover for Fiscal Year 2011 SAO Report No. 12-701
December 2011 Page 30
Turnover by Job Classification Series
Fiscal Year 2011
a b
Occupational Category Job Classification Series
Average Headcount
Percentage of Headcount Separations
Percentage of Separations
Turnover Rate
Medical Technician 10.50 0.0% 3 0.0% 28.6%
Medical Technologist 93.75 0.1% 17 0.1% 18.1%
Microbiologist 127.25 0.1% 21 0.1% 16.5%
Nurse 2,439.75 1.6% 563 2.2% 23.1%
Orthopedic Equipment Assistant/Technician
41.75 0.0% 4 0.0% 9.6%
Pharmacist 98.50 0.1% 13 0.0% 13.2%
Pharmacy Technician 75.75 0.0% 13 0.0% 17.2%
Physician 127.00 0.1% 25 0.1% 19.7%
Physician Assistant 4.00 0.0% 0 0.0% 0.0%
Psychiatrist 144.00 0.1% 16 0.1% 11.1%
Psychological Assistant/Associate Psychologist
412.25 0.3% 81 0.3% 19.6%
Psychologist 87.50 0.1% 18 0.1% 20.6%
Public Health Nurse 59.25 0.0% 14 0.1% 23.6%
Public Health Technician 652.75 0.4% 98 0.4% 15.0%
Radiological Technologist 18.00 0.0% 1 0.0% 5.6%
Registered Therapists Assistant/Therapist
260.50 0.2% 55 0.2% 21.1%
Respiratory Care Practitioner 11.00 0.0% 0 0.0% 0.0%
Veterinarian 39.75 0.0% 6 0.0% 15.1%
Totals for Medical and Health 6,434.75 4.2% 1,445 5.6% 22.5%
Natural Resources
Chemist 127.75 0.1% 8 0.0% 6.3%
Earth Science Technician 1.25 0.0% 1 0.0% 80.0%
Environmental Specialist 244.00 0.2% 20 0.1% 8.2%
Fish and Wildlife Technician 193.75 0.1% 13 0.0% 6.7%
Geoscientist 135.00 0.1% 14 0.1% 10.4%
Hydrologist 77.75 0.1% 14 0.1% 18.0%
Natural Resources Specialist 1,288.25 0.8% 158 0.6% 12.3%
Park Ranger 345.25 0.2% 45 0.2% 13.0%
Park Specialist 216.00 0.1% 25 0.1% 11.6%
Sanitarian 126.00 0.1% 7 0.0% 5.6%
Toxicologist 12.00 0.0% 0 0.0% 0.0%
Totals for Natural Resources 2,767.00 1.8% 305 1.2% 11.0%
Office Services Micrographics Technician 72.50 0.0% 11 0.0% 15.2%
Photographer 5.00 0.0% 0 0.0% 0.0%

An Annual Report on Classified Employee Turnover for Fiscal Year 2011 SAO Report No. 12-701
December 2011 Page 31
Turnover by Job Classification Series
Fiscal Year 2011
a b
Occupational Category Job Classification Series
Average Headcount
Percentage of Headcount Separations
Percentage of Separations
Turnover Rate
Printing Services Technician 125.25 0.1% 13 0.0% 10.4%
Totals for Office Services 202.75 0.1% 24 0.1% 11.8%
Planning, Research, and Statistics
Economist 49.75 0.0% 5 0.0% 10.1%
Planner 182.75 0.1% 15 0.1% 8.2%
Research and Statistics Technician 22.50 0.0% 6 0.0% 26.7%
Research Specialist 275.25 0.2% 37 0.1% 13.4%
Statistician 20.00 0.0% 3 0.0% 15.0%
Totals for Planning, Research, and Statistics 550.25 0.4% 66 0.3% 12.0%
Procedures and Information
Audio/Visual Technician 15.00 0.0% 2 0.0% 13.3%
Editor 7.75 0.0% 0 0.0% 0.0%
Government Relations Specialist 76.00 0.0% 6 0.0% 7.9%
Governor’s Advisor 23.50 0.0% 1 0.0% 4.3%
Information Specialist 460.25 0.3% 64 0.2% 13.9%
Management Analyst 64.75 0.0% 7 0.0% 10.8%
Marketing Specialist 53.75 0.0% 17 0.1% 31.6%
Technical Writer 34.00 0.0% 4 0.0% 11.8%
Totals for Procedures and Information 735.00 0.5% 101 0.4% 13.7%
Program Management
Deputy Comptroller 1.00 0.0% 0 0.0% 0.0%
Director 1,926.50 1.2% 221 0.8% 11.5%
Manager 2,785.25 1.8% 282 1.1% 10.1%
Program Specialist 6,649.25 4.3% 748 2.9% 11.2%
Program Supervisor 1,847.00 1.2% 183 0.7% 9.9%
Project Manager 150.75 0.1% 33 0.1% 21.9%
Staff Services Officer 321.25 0.2% 23 0.1% 7.2%
Totals for Program Management 13,681.00 8.9% 1,490 5.7% 10.9%
Property Management and Purchasing
Contract Administration Manager 29.50 0.0% 2 0.0% 6.8%
Contract Specialist 647.75 0.4% 74 0.3% 11.4%
Contract Technician 94.25 0.1% 5 0.0% 5.3%
Grant Coordinator 67.50 0.0% 19 0.1% 28.1%
Inventory and Store Specialist 701.50 0.5% 79 0.3% 11.3%
Property Manager 140.75 0.1% 15 0.1% 10.7%
Purchaser 483.75 0.3% 41 0.2% 8.5%
Totals for Property Management and Purchasing 2,165.00 1.4% 235 0.9% 10.9%
Public Safety Crime Laboratory Specialist 50.75 0.0% 2 0.0% 3.9%
DNA Index System Analyst 7.00 0.0% 0 0.0% 0.0%
Fingerprint Technician 38.25 0.0% 6 0.0% 15.7%

An Annual Report on Classified Employee Turnover for Fiscal Year 2011 SAO Report No. 12-701
December 2011 Page 32
Turnover by Job Classification Series
Fiscal Year 2011
a b
Occupational Category Job Classification Series
Average Headcount
Percentage of Headcount Separations
Percentage of Separations
Turnover Rate
Forensic Photographer 3.00 0.0% 0 0.0% 0.0%
Forensic Scientist 238.25 0.2% 13 0.0% 5.5%
Police Communications Operator 159.50 0.1% 12 0.0% 7.5%
Public Safety Records Technician 69.25 0.0% 8 0.0% 11.6%
Security Officer 601.00 0.4% 137 0.5% 22.8%
Totals for Public Safety 1,167.00 0.8% 178 0.7% 15.3%
Safety Rescue Specialist 31.00 0.0% 6 0.0% 19.4%
Risk Management Specialist 49.00 0.0% 8 0.0% 16.3%
Safety Officer 172.50 0.1% 18 0.1% 10.4%
Totals for Safety 252.50 0.2% 32 0.1% 12.7%
Social Services Adult Protective Services Specialist 778.75 0.5% 109 0.4% 14.0%
Case Manager 405.00 0.3% 84 0.3% 20.7%
Chaplain 146.00 0.1% 13 0.0% 8.9%
Chaplaincy Services Assistant 8.75 0.0% 1 0.0% 11.4%
Child Protective Services Specialist 5,309.75 3.4% 1,249 4.8% 23.5%
Child Support Officer 1,294.50 0.8% 143 0.5% 11.0%
Child Support Technician 378.25 0.2% 62 0.2% 16.4%
Family and Protective Services Supervisor
1,150.00 0.7% 66 0.3% 5.7%
Family Services Specialist 350.75 0.2% 19 0.1% 5.4%
Health and Human Services Program Coordinator
45.75 0.0% 4 0.0% 8.7%
Human Services Specialist 8,000.25 5.2% 1,272 4.9% 15.9%
Human Services Technician 872.00 0.6% 103 0.4% 11.8%
Interpreter 22.75 0.0% 2 0.0% 8.8%
Mental Retardation Assistant 7,884.00 5.1% 3,327 12.8% 42.2%
Psychiatric Nursing Assistant 3,075.75 2.0% 888 3.4% 28.9%
Qualified Mental Retardation Professional
265.50 0.2% 44 0.2% 16.6%
Quality Assurance Specialist 129.00 0.1% 13 0.0% 10.1%
Recreation Program Specialist 45.75 0.0% 15 0.1% 32.8%
Rehabilitation Teacher 132.75 0.1% 21 0.1% 15.8%
Rehabilitation Therapy Technician 1,101.00 0.7% 174 0.7% 15.8%
Resident Specialist 403.00 0.3% 52 0.2% 12.9%
Social Worker 209.50 0.1% 40 0.2% 19.1%
Substance Abuse Counselor 101.75 0.1% 21 0.1% 20.6%
Veterans Service Representative 272.50 0.2% 56 0.2% 20.6%

An Annual Report on Classified Employee Turnover for Fiscal Year 2011 SAO Report No. 12-701
December 2011 Page 33
Turnover by Job Classification Series
Fiscal Year 2011
a b
Occupational Category Job Classification Series
Average Headcount
Percentage of Headcount Separations
Percentage of Separations
Turnover Rate
Vocational Rehabilitation Counselor 700.75 0.5% 74 0.3% 10.6%
Volunteer Services Coordinator 82.00 0.1% 12 0.0% 14.6%
Totals for Social Services 33,165.75 21.5% 7,864 30.2% 23.7%
Statewide Totals 154,486.50 100.0% 26,028 100.0% 16.8%
a The job classification series with no incumbents in fiscal year 2011 were not included in this table.
b
Sources: Uniform Statewide Payroll/Personnel System, Human Resources Information System, and Standardized Payroll/Personnel Reporting System.
Percentages do not sum exactly due to rounding.

An Annual Report on Classified Employee Turnover for Fiscal Year 2011 SAO Report No. 12-701
December 2011 Page 34
Appendix 5
Turnover by Region and County
Table 19 provides a summary of turnover by region and county in Texas.
Table 19
Turnover by Region and County
Fiscal Year 2011
a
Region County Average
Headcount
Statewide Percentage
of Headcount Separations
Statewide Percentage
of Separations
Turnover Rate
Alamo Region Atascosa 101.25 0.1% 18 0.1% 17.8%
Bandera 41.00 0.0% 7 0.0% 17.1%
Bexar 6,907.75 4.5% 1,302 5.0% 18.8%
Comal 129.25 0.1% 22 0.1% 17.0%
Frio 357.25 0.2% 66 0.3% 18.5%
Gillespie 50.50 0.0% 3 0.0% 5.9%
Guadalupe 148.25 0.1% 19 0.1% 12.8%
Karnes 735.75 0.5% 303 1.2% 41.2%
Kendall 54.00 0.0% 7 0.0% 13.0%
Kerr 725.00 0.5% 141 0.5% 19.4%
Medina 524.75 0.3% 72 0.3% 13.7%
Wilson 54.75 0.0% 5 0.0% 9.1%
Alamo Region Totals 9,829.50 6.4% 1,965 7.5% 20.0%
Capital Region Bastrop 205.25 0.1% 19 0.1% 9.3%
Blanco 37.25 0.0% 6 0.0% 16.1%
Burnet 238.50 0.2% 28 0.1% 11.7%
Caldwell 77.00 0.0% 15 0.1% 19.5%
Fayette 60.25 0.0% 5 0.0% 8.3%
Hays 208.25 0.1% 35 0.1% 16.8%
Lee 471.50 0.3% 96 0.4% 20.4%
Llano 26.50 0.0% 2 0.0% 7.5%
Travis 36,792.50 23.8% 4,479 17.2% 12.2%
Williamson 535.00 0.3% 62 0.2% 11.6%
Capital Region Totals 38,652.00 25.0% 4,747 18.2% 12.3%
Central Texas Region Bell 672.25 0.4% 115 0.4% 17.1%
Bosque 37.50 0.0% 3 0.0% 8.0%
Brazos 680.50 0.4% 78 0.3% 11.5%
Burleson 43.50 0.0% 5 0.0% 11.5%
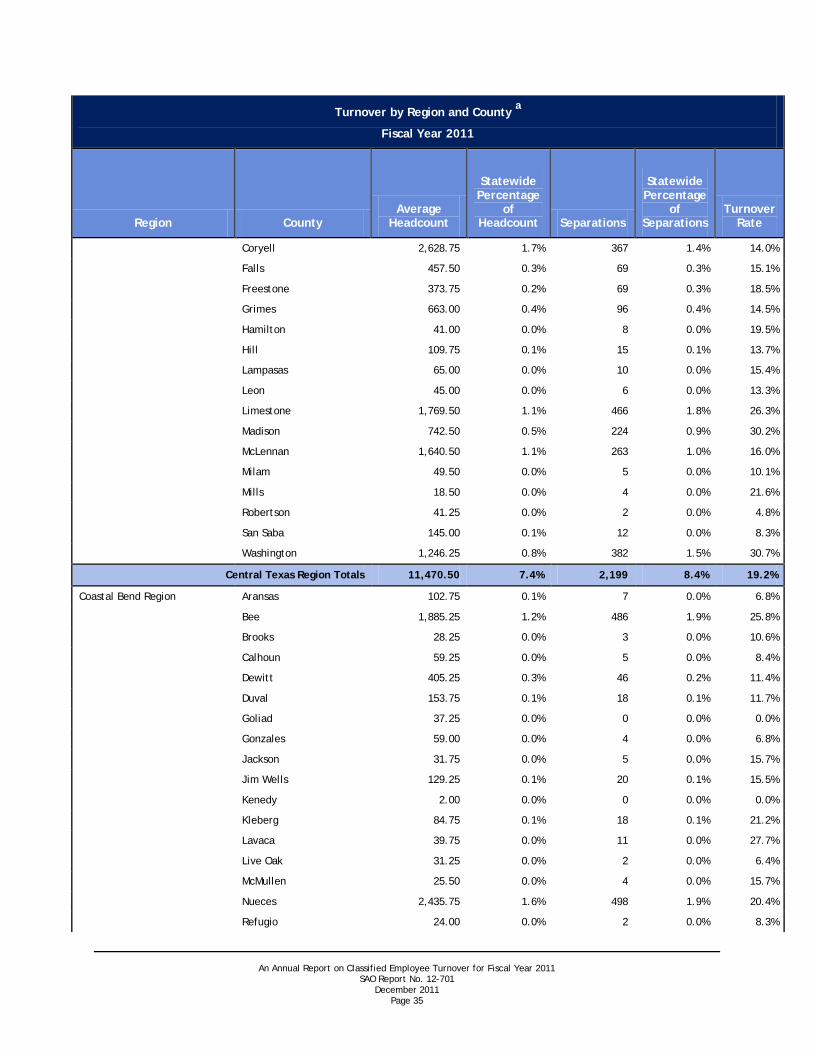
An Annual Report on Classified Employee Turnover for Fiscal Year 2011 SAO Report No. 12-701
December 2011 Page 35
Turnover by Region and County
Fiscal Year 2011
a
Region County Average
Headcount
Statewide Percentage
of Headcount Separations
Statewide Percentage
of Separations
Turnover Rate
Coryell 2,628.75 1.7% 367 1.4% 14.0%
Falls 457.50 0.3% 69 0.3% 15.1%
Freestone 373.75 0.2% 69 0.3% 18.5%
Grimes 663.00 0.4% 96 0.4% 14.5%
Hamilton 41.00 0.0% 8 0.0% 19.5%
Hill 109.75 0.1% 15 0.1% 13.7%
Lampasas 65.00 0.0% 10 0.0% 15.4%
Leon 45.00 0.0% 6 0.0% 13.3%
Limestone 1,769.50 1.1% 466 1.8% 26.3%
Madison 742.50 0.5% 224 0.9% 30.2%
McLennan 1,640.50 1.1% 263 1.0% 16.0%
Milam 49.50 0.0% 5 0.0% 10.1%
Mills 18.50 0.0% 4 0.0% 21.6%
Robertson 41.25 0.0% 2 0.0% 4.8%
San Saba 145.00 0.1% 12 0.0% 8.3%
Washington 1,246.25 0.8% 382 1.5% 30.7%
Central Texas Region Totals 11,470.50 7.4% 2,199 8.4% 19.2%
Coastal Bend Region Aransas 102.75 0.1% 7 0.0% 6.8%
Bee 1,885.25 1.2% 486 1.9% 25.8%
Brooks 28.25 0.0% 3 0.0% 10.6%
Calhoun 59.25 0.0% 5 0.0% 8.4%
Dewitt 405.25 0.3% 46 0.2% 11.4%
Duval 153.75 0.1% 18 0.1% 11.7%
Goliad 37.25 0.0% 0 0.0% 0.0%
Gonzales 59.00 0.0% 4 0.0% 6.8%
Jackson 31.75 0.0% 5 0.0% 15.7%
Jim Wells 129.25 0.1% 20 0.1% 15.5%
Kenedy 2.00 0.0% 0 0.0% 0.0%
Kleberg 84.75 0.1% 18 0.1% 21.2%
Lavaca 39.75 0.0% 11 0.0% 27.7%
Live Oak 31.25 0.0% 2 0.0% 6.4%
McMullen 25.50 0.0% 4 0.0% 15.7%
Nueces 2,435.75 1.6% 498 1.9% 20.4%
Refugio 24.00 0.0% 2 0.0% 8.3%

An Annual Report on Classified Employee Turnover for Fiscal Year 2011 SAO Report No. 12-701
December 2011 Page 36
Turnover by Region and County
Fiscal Year 2011
a
Region County Average
Headcount
Statewide Percentage
of Headcount Separations
Statewide Percentage
of Separations
Turnover Rate
San Patricio 129.50 0.1% 23 0.1% 17.8%
Victoria 270.00 0.2% 38 0.1% 14.1%
Coastal Bend Region Totals 5,934.25 3.8% 1,190 4.6% 20.1%
Gulf Coast Region Austin 704.75 0.5% 64 0.2% 9.1%
Brazoria 2,663.00 1.7% 447 1.7% 16.8%
Chambers 44.50 0.0% 4 0.0% 9.0%
Colorado 46.75 0.0% 4 0.0% 8.6%
Fort Bend 2,973.00 1.9% 402 1.5% 13.5%
Galveston 1,074.75 0.7% 117 0.4% 10.9%
Harris 7,863.50 5.1% 1,003 3.9% 12.8%
Liberty 982.50 0.6% 124 0.5% 12.6%
Matagorda 73.75 0.0% 8 0.0% 10.8%
Montgomery 432.75 0.3% 47 0.2% 10.9%
Walker 6,732.00 4.4% 1,260 4.8% 18.7%
Waller 62.00 0.0% 7 0.0% 11.3%
Wharton 96.50 0.1% 7 0.0% 7.3%
Gulf Coast Region Totals 23,749.75 15.4% 3,494 13.4% 14.7%
High Plains Region Armstrong 15.75 0.0% 2 0.0% 12.7%
Bailey 26.25 0.0% 2 0.0% 7.6%
Briscoe 19.25 0.0% 1 0.0% 5.2%
Carson 33.00 0.0% 7 0.0% 21.2%
Castro 20.50 0.0% 2 0.0% 9.8%
Childress 432.75 0.3% 77 0.3% 17.8%
Cochran 16.25 0.0% 1 0.0% 6.2%
Collingsworth 14.75 0.0% 1 0.0% 6.8%
Crosby 23.00 0.0% 1 0.0% 4.3%
Dallam 298.50 0.2% 78 0.3% 26.1%
Deaf Smith 54.50 0.0% 11 0.0% 20.2%
Dickens 14.00 0.0% 1 0.0% 7.1%
Donley 19.25 0.0% 3 0.0% 15.6%
Floyd 15.75 0.0% 1 0.0% 6.3%
Garza 20.25 0.0% 4 0.0% 19.8%
Gray 415.00 0.3% 103 0.4% 24.8%
Hale 504.25 0.3% 75 0.3% 14.9%

An Annual Report on Classified Employee Turnover for Fiscal Year 2011 SAO Report No. 12-701
December 2011 Page 37
Turnover by Region and County
Fiscal Year 2011
a
Region County Average
Headcount
Statewide Percentage
of Headcount Separations
Statewide Percentage
of Separations
Turnover Rate
Hall 17.25 0.0% 0 0.0% 0.0%
Hansford 15.25 0.0% 2 0.0% 13.1%
Hartley 17.75 0.0% 1 0.0% 5.6%
Hemphill 26.25 0.0% 3 0.0% 11.4%
Hockley 64.75 0.0% 5 0.0% 7.7%
Hutchinson 42.00 0.0% 2 0.0% 4.8%
King 7.00 0.0% 0 0.0% 0.0%
Lamb 48.25 0.0% 7 0.0% 14.5%
Lipscomb 8.25 0.0% 0 0.0% 0.0%
Lubbock 2,896.50 1.9% 713 2.7% 24.6%
Lynn 20.75 0.0% 1 0.0% 4.8%
Moore 48.00 0.0% 5 0.0% 10.4%
Motley 15.25 0.0% 2 0.0% 13.1%
Ochiltree 21.75 0.0% 2 0.0% 9.2%
Oldham 17.50 0.0% 3 0.0% 17.1%
Parmer 16.50 0.0% 0 0.0% 0.0%
Potter 2,027.75 1.3% 435 1.7% 21.5%
Randall 312.25 0.2% 47 0.2% 15.1%
Roberts 1.00 0.0% 0 0.0% 0.0%
Sherman 14.75 0.0% 0 0.0% 0.0%
Swisher 144.25 0.1% 17 0.1% 11.8%
Terry 191.00 0.1% 31 0.1% 16.25
Wheeler 18.00 0.0% 6 0.0% 33.3%
Yoakum 13.25 0.0% 3 0.0% 22.6%
High Plains Region Totals 7,948.25 5.2% 1,655 6.4% 20.8%
Metroplex Region Collin 430.75 0.3% 76 0.3% 17.6%
Cooke 438.00 0.3% 119 0.5% 27.2%
Dallas 4,564.75 3.0% 540 2.1% 11.8%
Denton 2,370.50 1.5% 779 3.0% 32.9%
Ellis 151.75 0.1% 17 0.1% 11.2%
Erath 76.75 0.0% 10 0.0% 13.0%
Fannin 495.25 0.3% 73 0.3% 14.7%
Grayson 204.25 0.1% 37 0.1% 18.1%
Hood 287.50 0.2% 38 0.1% 13.2%
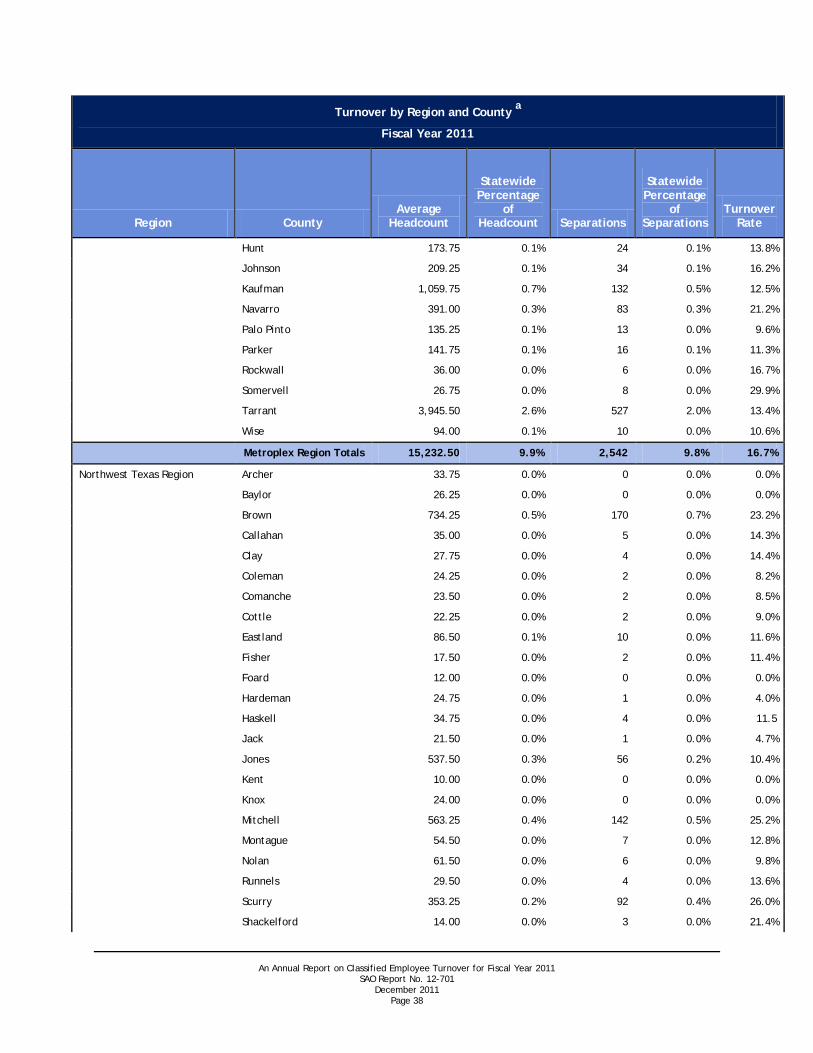
An Annual Report on Classified Employee Turnover for Fiscal Year 2011 SAO Report No. 12-701
December 2011 Page 38
Turnover by Region and County
Fiscal Year 2011
a
Region County Average
Headcount
Statewide Percentage
of Headcount Separations
Statewide Percentage
of Separations
Turnover Rate
Hunt 173.75 0.1% 24 0.1% 13.8%
Johnson 209.25 0.1% 34 0.1% 16.2%
Kaufman 1,059.75 0.7% 132 0.5% 12.5%
Navarro 391.00 0.3% 83 0.3% 21.2%
Palo Pinto 135.25 0.1% 13 0.0% 9.6%
Parker 141.75 0.1% 16 0.1% 11.3%
Rockwall 36.00 0.0% 6 0.0% 16.7%
Somervell 26.75 0.0% 8 0.0% 29.9%
Tarrant 3,945.50 2.6% 527 2.0% 13.4%
Wise 94.00 0.1% 10 0.0% 10.6%
Metroplex Region Totals 15,232.50 9.9% 2,542 9.8% 16.7%
Northwest Texas Region Archer 33.75 0.0% 0 0.0% 0.0%
Baylor 26.25 0.0% 0 0.0% 0.0%
Brown 734.25 0.5% 170 0.7% 23.2%
Callahan 35.00 0.0% 5 0.0% 14.3%
Clay 27.75 0.0% 4 0.0% 14.4%
Coleman 24.25 0.0% 2 0.0% 8.2%
Comanche 23.50 0.0% 2 0.0% 8.5%
Cottle 22.25 0.0% 2 0.0% 9.0%
Eastland 86.50 0.1% 10 0.0% 11.6%
Fisher 17.50 0.0% 2 0.0% 11.4%
Foard 12.00 0.0% 0 0.0% 0.0%
Hardeman 24.75 0.0% 1 0.0% 4.0%
Haskell 34.75 0.0% 4 0.0% 11.5
Jack 21.50 0.0% 1 0.0% 4.7%
Jones 537.50 0.3% 56 0.2% 10.4%
Kent 10.00 0.0% 0 0.0% 0.0%
Knox 24.00 0.0% 0 0.0% 0.0%
Mitchell 563.25 0.4% 142 0.5% 25.2%
Montague 54.50 0.0% 7 0.0% 12.8%
Nolan 61.50 0.0% 6 0.0% 9.8%
Runnels 29.50 0.0% 4 0.0% 13.6%
Scurry 353.25 0.2% 92 0.4% 26.0%
Shackelford 14.00 0.0% 3 0.0% 21.4%

An Annual Report on Classified Employee Turnover for Fiscal Year 2011 SAO Report No. 12-701
December 2011 Page 39
Turnover by Region and County
Fiscal Year 2011
a
Region County Average
Headcount
Statewide Percentage
of Headcount Separations
Statewide Percentage
of Separations
Turnover Rate
Stephens 175.75 0.1% 21 0.1% 11.9%
Stonewall 13.75 0.0% 2 0.0% 14.5%
Taylor 2,798.00 1.8% 802 3.1% 28.7%
Throckmorton 10.50 0.0% 0 0.0% 0.0%
Wichita 2,072.75 1.3% 448 1.7% 21.6%
Wilbarger 1,531 1.0% 244 0.9% 15.9%
Young 58.5 0.0% 5 0.0% 8.5%
Northwest Texas Region Totals 9,431.75 6.1% 2,035 7.8% 21.6%
South Texas Border Region Cameron 1,707.50 1.1% 274 1.1% 16.0%
Dimmit 44.75 0.0% 4 0.0% 8.9%
Edwards 20.50 0.0% 2 0.0% 9.8%
Hidalgo 2,990.00 1.9% 361 1.4% 12.1%
Jim Hogg 39.25 0.0% 5 0.0% 12.7%
Kinney 20.50 0.0% 2 0.0% 9.8%
La Salle 148.25 0.1% 26 0.1% 17.5%
Maverick 124.75 0.1% 7 0.0% 5.6%
Real 13.50 0.0% 2 0.0% 14.8%
Starr 241.50 0.2% 21 0.1% 8.7%
Uvalde 120.75 0.1% 12 0.0% 9.9%
Val Verde 166.50 0.1% 22 0.1% 13.2%
Webb 764.50 0.5% 78 0.3% 10.2%
Willacy 58.50 0.0% 4 0.0% 6.8%
Zapata 26.75 0.0% 2 0.0% 7.5%
Zavala 28.25 0.0% 5 0.0% 17.7%
South Texas Border Region Totals 6,515.75 4.2% 827 3.2% 12.7%
Southeast Texas Region Angelina 1,680.00 1.1% 405 1.6% 24.1%
Hardin 72.50 0.0% 9 0.0% 12.4%
Houston 1,123.50 0.7% 432 1.7% 38.5%
Jasper 284.00 0.2% 32 0.1% 11.3%
Jefferson 2,602.75 1.7% 728 2.8% 28.0%
Nacogdoches 205.50 0.1% 23 0.1% 11.2%
Newton 32.00 0.0% 0 0.0% 0.0%
Orange 131.00 0.1% 16 0.1% 12.2%
Polk 932.50 0.6% 248 1.0% 26.6%

An Annual Report on Classified Employee Turnover for Fiscal Year 2011 SAO Report No. 12-701
December 2011 Page 40
Turnover by Region and County
Fiscal Year 2011
a
Region County Average
Headcount
Statewide Percentage
of Headcount Separations
Statewide Percentage
of Separations
Turnover Rate
Sabine 24.25 0.0% 3 0.0% 12.4%
San Augustine 26.50 0.0% 2 0.0% 7.5%
San Jacinto 36.75 0.0% 1 0.0% 2.7%
Shelby 53.25 0.0% 6 0.0% 11.3%
Trinity 34.50 0.0% 3 0.0% 8.7%
Tyler 662.00 0.4% 172 0.7% 26.0%
Southeast Texas Region Totals 7,901.00 5.1% 2,080 8.1% 26.3%
Upper East Texas Region Anderson 3,428.75 2.2% 730 2.8% 21.3%
Bowie 995.50 0.6% 191 0.7% 19.2%
Camp 9.50 0.0% 1 0.0% 10.5%
Cass 173.00 0.1% 11 0.0% 6.4%
Cherokee 1,773.50 1.1% 355 1.4% 20.0%
Delta 24.25 0.0% 0 0.0% 0.0%
Franklin 21.75 0.0% 2 0.0% 9.2%
Gregg 381.75 0.2% 56 0.2% 14.7%
Harrison 314.50 0.2% 24 0.1% 7.6%
Henderson 289.00 0.2% 38 0.1% 13.1%
Hopkins 129.25 0.1% 9 0.0% 7.0%
Lamar 244.50 0.2% 20 0.1% 8.2%
Marion 25.50 0.0% 3 0.0% 11.8%
Morris 37.50 0.0% 6 0.0% 16.0%
Panola 42.50 0.0% 3 0.0% 7.1%
Rains 22.75 0.0% 1 0.0% 4.4%
Red River 40.25 0.0% 7 0.0% 17.4%
Rusk 92.50 0.1% 18 0.1% 19.5%
Smith 1,024.25 0.7% 107 0.4% 10.4%
Titus 141.00 0.1% 21 0.1% 14.9%
Upshur 70.75 0.0% 10 0.0% 14.1%
Van Zandt 96.75 0.1% 6 0.0% 6.2%
Wood 233.50 0.2% 33 0.1% 14.1%
Upper East Texas Region Totals 9,612.50 6.2% 1,652 6.3% 17.2%
Upper Rio Grande Region Brewster 86.00 0.1% 6 0.0% 7.0%
Culberson 24.25 0.0% 2 0.0% 8.2%
El Paso 3,252.75 2.1% 372 1.4% 11.4%
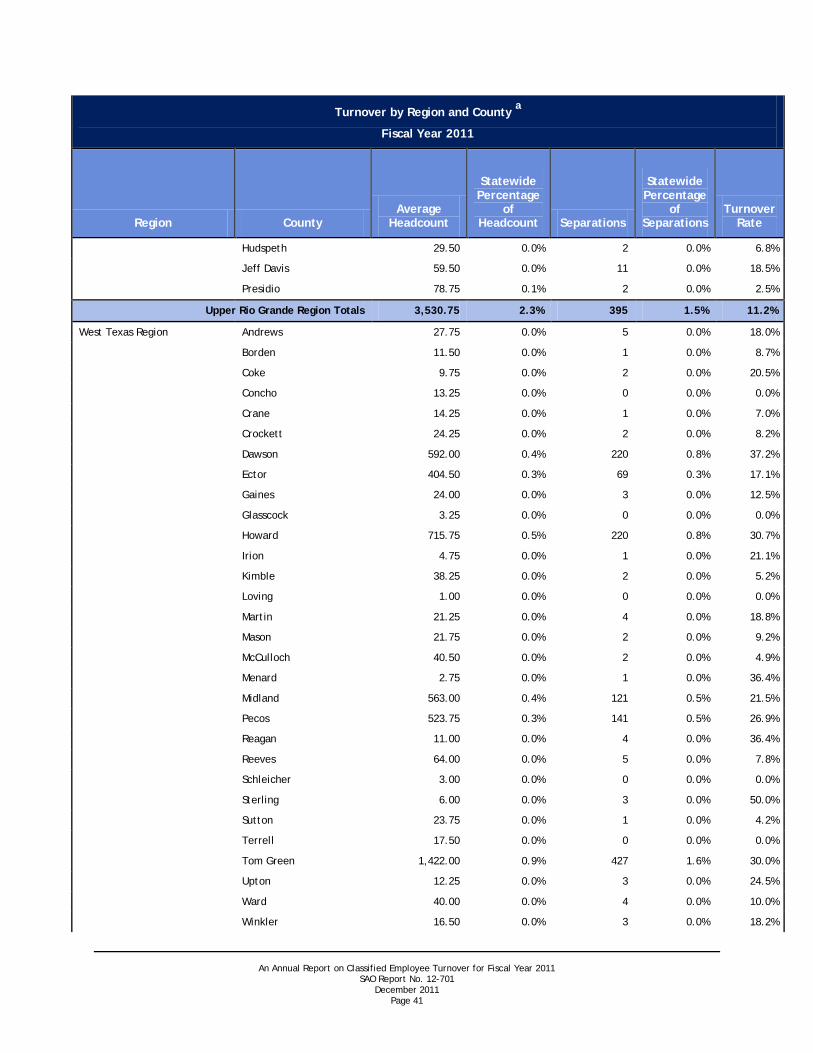
An Annual Report on Classified Employee Turnover for Fiscal Year 2011 SAO Report No. 12-701
December 2011 Page 41
Turnover by Region and County
Fiscal Year 2011
a
Region County Average
Headcount
Statewide Percentage
of Headcount Separations
Statewide Percentage
of Separations
Turnover Rate
Hudspeth 29.50 0.0% 2 0.0% 6.8%
Jeff Davis 59.50 0.0% 11 0.0% 18.5%
Presidio 78.75 0.1% 2 0.0% 2.5%
Upper Rio Grande Region Totals 3,530.75 2.3% 395 1.5% 11.2%
West Texas Region Andrews 27.75 0.0% 5 0.0% 18.0%
Borden 11.50 0.0% 1 0.0% 8.7%
Coke 9.75 0.0% 2 0.0% 20.5%
Concho 13.25 0.0% 0 0.0% 0.0%
Crane 14.25 0.0% 1 0.0% 7.0%
Crockett 24.25 0.0% 2 0.0% 8.2%
Dawson 592.00 0.4% 220 0.8% 37.2%
Ector 404.50 0.3% 69 0.3% 17.1%
Gaines 24.00 0.0% 3 0.0% 12.5%
Glasscock 3.25 0.0% 0 0.0% 0.0%
Howard 715.75 0.5% 220 0.8% 30.7%
Irion 4.75 0.0% 1 0.0% 21.1%
Kimble 38.25 0.0% 2 0.0% 5.2%
Loving 1.00 0.0% 0 0.0% 0.0%
Martin 21.25 0.0% 4 0.0% 18.8%
Mason 21.75 0.0% 2 0.0% 9.2%
McCulloch 40.50 0.0% 2 0.0% 4.9%
Menard 2.75 0.0% 1 0.0% 36.4%
Midland 563.00 0.4% 121 0.5% 21.5%
Pecos 523.75 0.3% 141 0.5% 26.9%
Reagan 11.00 0.0% 4 0.0% 36.4%
Reeves 64.00 0.0% 5 0.0% 7.8%
Schleicher 3.00 0.0% 0 0.0% 0.0%
Sterling 6.00 0.0% 3 0.0% 50.0%
Sutton 23.75 0.0% 1 0.0% 4.2%
Terrell 17.50 0.0% 0 0.0% 0.0%
Tom Green 1,422.00 0.9% 427 1.6% 30.0%
Upton 12.25 0.0% 3 0.0% 24.5%
Ward 40.00 0.0% 4 0.0% 10.0%
Winkler 16.50 0.0% 3 0.0% 18.2%

An Annual Report on Classified Employee Turnover for Fiscal Year 2011 SAO Report No. 12-701
December 2011 Page 42
Turnover by Region and County
Fiscal Year 2011
a
Region County Average
Headcount
Statewide Percentage
of Headcount Separations
Statewide Percentage
of Separations
Turnover Rate
West Texas Region Totals 4,673.25 3.0% 1,247 4.8% 26.7%
Other
4.75 0.0% 0 0.0% 0.0%
Statewide Totals 154,486.50 100.0% 26,028 100.0% 16.8%
a
Sources: Uniform Statewide Payroll/Personnel System, Human Resources Information System, and Standardized Payroll/Personnel Reporting System.
Totals may not sum exactly due to rounding.
Copies of this report have been distributed to the following:
Legislative Audit Committee The Honorable David Dewhurst, Lieutenant Governor, Joint Chair The Honorable Joe Straus III, Speaker of the House, Joint Chair The Honorable Steve Ogden, Senate Finance Committee The Honorable Thomas “Tommy” Williams, Member, Texas Senate The Honorable Jim Pitts, House Appropriations Committee The Honorable Harvey Hilderbran, House Ways and Means Committee
Office of the Governor The Honorable Rick Perry, Governor

This document is not copyrighted. Readers may make additional copies of this report as needed. In addition, most State Auditor’s Office reports may be downloaded from our Web site: www.sao.state.tx.us. In compliance with the Americans with Disabilities Act, this document may also be requested in alternative formats. To do so, contact our report request line at (512) 936-9500 (Voice), (512) 936-9400 (FAX), 1-800-RELAY-TX (TDD), or visit the Robert E. Johnson Building, 1501 North Congress Avenue, Suite 4.224, Austin, Texas 78701. The State Auditor’s Office is an equal opportunity employer and does not discriminate on the basis of race, color, religion, sex, national origin, age, or disability in employment or in the provision of services, programs, or activities. To report waste, fraud, or abuse in state government call the SAO Hotline: 1-800-TX-AUDIT.