an automated picking workstation for healthcare...
TRANSCRIPT

An Automated Picking Workstation for Healthcare Applications
Abstract – The costs associated with the management of healthcare systems have been subject to
continuous scrutiny for some time now, with a view to reducing them without affecting the quality
as perceived by final users. A number of different solutions have arisen based on centralisation of
healthcare services and investments in Information Technology (IT). One such example is
centralised management of pharmaceuticals among a group of hospitals which is then incorporated
into the different steps of the automation supply chain. This paper focuses on a new picking
workstation available for insertion in automated pharmaceutical distribution centres and which is
capable of replacing manual workstations and bringing about improvements in working time. The
workstation described uses a sophisticated computer vision algorithm to allow picking of very
diverse and complex objects randomly available on a belt or in bins. The algorithm exploits state-
of-the-art feature descriptors for an approach that is robust against occlusions and distracting
objects, and invariant to scale, rotation or illumination changes. Finally, the performance of the
designed picking workstation is tested in a large experimentation focused on the management of
pharmaceutical items.
*Manuscript excluding Author DetailsClick here to view linked References
Keywords: centralised distribution centre, automated picking workstation, pharmaceuticals, object
segmentation, computer vision
1 Introduction
International healthcare systems are under increasing pressure to reduce waste and eliminate
unnecessary costs while still improving the quality of patient care. Healthcare logistics and supply
chain management are therefore coming under a great deal of scrutiny from both practitioners and
academics (Bradley 2000, Battini et al. 2009).
For example, Bowman (1997) cites that healthcare supply chain inefficiencies amount to $11 billion
(or 48%) of the total annual cost of $23 billion. Among those processes with potential for
improvement, pharmaceutical logistics is significant in terms of the resources and costs involved
and their effect on the final perceived service level (de Vries 2011).
Traditional management is therefore currently under scrutiny and innovative models are being
implemented on a continuous basis. For example, some contributions have recently appeared which
describe methodologies and the effects of the introduction of centralised drugs management on
order issue and receipt, centralised warehouse management, distribution to end users or simply
regarding centralised logistics management. In this context it is clear that the new emerging figure
of central distributor is appreciated for the benefits it brings when introduced into the supply chain,
both when managing ward stocks (hence the reference to a Ward Stock Drug Distribution System -
WSDDS) and when dispensing unit dose (hence the reference to a Unit Dose Drug Dispensing
System - UDDDS) (Summerfield 1983).
The process of picking items is critical to the performance of distribution centres. This paper
therefore focuses on an automated pick-and-place workstation whose operative behaviour is based
on innovative computer-vision-driven robotics (as defined in Asadi 2011) and whose main
potentialities are described below:

Different object types and a highly variable appearance: pharmaceuticals are characterised by
highly variable appearance in terms of colour, size, primary packages (i.e. regular-shaped boxes,
irregular-shaped boxes with transparents, flowpacks, etc.). The workstation manages different
types of object of different dimensions and complexity, available for both WSDDS and
UDDDS;
Randomly available objects: most of the picking systems consider the scenario of well-separated
objects, well-aligned on the belt and with synchronised grasping of the objects. Pharmaceuticals
are sometimes characterised by irregular dispositions in a bin or on a conveyor belt, especially
when items in flowpacks are handled or UDDDSs are served;
Multiple instances and distractors: while in other image processing and computer vision
applications the basic objective is to identify the single best instance of the target/query object,
with pick-and-place applications the aim is not just to classify the first (or best) instance but to
determine the locations, orientations and sizes of all or most of the duplicates/instances. Object
duplicates can have different sizes, poses and orientations, and can be seen from different
viewpoints and under different illumination. Moreover, in real-life applications the system must
also account for the presence of distractors, i.e. other types of objects that differ from the target
object and which should not be detected;
Heavily occluded objects: as a consequence of the latter requirements, objects can be severely
occluded;
High working speed: when picking workstations are included in fully automated UDCs, the
required working speed is very high; a fast detection technique is used to process up to a
hundred objects a minute.
The automated picking workstation described in this paper uses state-of-the-art computer vision
techniques based on local features, specifically single-point SIFT (Lowe 2004), which have proven
to be robust to scale and translation variations, rotations and, at least partially, illumination changes.
When handling complex, reflective, low-textured and heavily occluded objects, humans also rely

only on very few visual features. To obtain multiple object identification in such complex scenarios
we use a novel clustering method which exploits the Euclidean transformation hypothesis and the
definition of a small set of principal points of the shape, i.e. points that characterize and delimit the
object shape. To improve accuracy with low-textured, reflective or semi-transparent objects,
multiple models of the target object can be used.
This paper is structured as follows. Section 2 analyses related publications. Section 3 describes the
main components and characteristics of the proposed workstation. In section 4, a wide
experimentation in the field of localisation and picking of pharmaceuticals is conducted and the
results reported and commented. Finally, section 5 outlines some conclusions.
2 Literature review
As anticipated in the introductory section, this paper focuses on the characteristics and effects of the
adoption of an automated picking workstation in a pharmaceutical centralised warehouse, using
vision-based algorithms for object detection. The literature review is therefore performed by
analysing related issues: healthcare supply chains (section 2.1), picking systems and workstations
(section 2.2), vision-based systems for pick-and-place applications with particular emphasis on the
types of object handled and their characteristics (section 2.3).
2.1 Healthcare supply chains
The healthcare supply chains can be conceptualised as comprising five main actors (Burns et al.
2002): (a) healthcare producers: manufacturing and service companies including pharmaceutical
and biotechnology manufacturers, medical device makers, medical suppliers and information
technology firms; (b) healthcare product intermediaries: wholesalers, mail order distributors and
group purchasing organisations; (c) healthcare providers: hospitals, physicians, integrated delivery
networks and pharmacies; (d) healthcare fiscal intermediaries: insurers, health maintenance

organisations and pharmacy benefit managers; (e) purchasers: government, employers, individuals
and employer coalitions.
The portion of the supply chain on which this paper focuses is the relationship between
pharmaceutical companies and hospitals and clinics.
Such a relation is also analysed in Battini et al. (2009) where, in the case of companies supplying
pharmaceuticals, the authors state that 3 main management models are implemented:
1) A traditional approach in which there is a central pharmacy store in every hospital that decides
what and how to buy. This is the most widespread system (Dongsoo 2005);
2) Centralised management of drugs in a district or regional centre (Unique Distributive Centre -
UDC), whose insertion in the supply chain is mainly justified by e.g. expected savings due to
elimination of stocks duplication along with economies of scale in the purchasing, storing, handling
and transportation of items (Nollet and Bealieu 2003, Nicholson 2004, Chandra 2008);
3) All physical managing and pharmaceutical movements are carried out by a third party (logistics
operator). However, the hospital pharmacy is in charge of deciding what and how to order.
These models are schematised in figure 1 using the framework introduced in Caldeira Pedroso and
Nakano (2009).
[TAKE IN FIGURE 1]
This paper focuses on innovative healthcare supply chains shaped as described in model 2, and in
particular on an automated picking solution to improve their performance.
2.2 Picking systems and workstations in distribution centres and warehouses included in
healthcare supply chains
Order picking and the process of retrieving products from storage or buffer areas in response to a
specific customer request are among the most labour-intensive operations in manual systems and

are a very capital-intensive operation in automated systems (Goetschalckx and Ashayery 1989, van
den Berg and Zijm 1999, Tompkins et al. 2003).
The focus of this paper is therefore on innovative solutions for improving the behaviour of picking
techniques in healthcare supply chains.
Order picking systems can be classified according to whether humans or automated machines are
used (de Koster et al. 2007). The former group includes picker-to-parts, parts-to-picker and put
systems. Picker-to-parts systems are characterised by pickers who walk or drive along the aisles to
pick items. Parts-to-picker systems include Automated Storage and Retrieval Systems (AS/RS).
These use mainly aisle-bound cranes that retrieve one or more unit loads (pallets or bins) and bring
them to a pick position from where the picker takes the required number of pieces. Next, the
remaining load is stored again. Put systems consist of a retrieval and distribution process where
items are initially retrieved, either in a parts-to-picker or in a picker-to-parts manner. Afterwards, a
bin with these pre-picked units is usually offered to an order picker who distributes them over
customer orders.
Alternatively, automated picking (e.g. see Figure 2) and picking robot systems use machines for
order picking and are preferred for the picking of small, valuable, and delicate items.
Most warehouses typically feature a mixture of such models, examples of which in the field of
healthcare supply chains are reported in Figures 3, 4 and 5 which illustrate combinations of
automated picking with manual picker-to-parts, manual parts-to-picker or robotic picker
respectively.
[TAKE IN FIGURES 2, 3, 4, 5]
This paper focuses on the robotic picking workstation, which is particularly suitable for applications
similar to those depicted in Figure 5.

2.3 Items managed by pick-and-place robots using vision-based detecting algorithms
The scientific literature on vision-based pick-and-place (or object grasping) is very abundant. Table
1 summarises some significant existing approaches by focusing on vision-based object grasping
systems. Table 1 also emphasises which objects are considered in those papers and whether the
characteristics listed in Section 1 are considered (YES), not considered (NO) or not explicitly stated
(U). In particular, the experimental conditions (whether distractors, multiple instances of the same
object or occlusions are accounted for, whether random disposal of objects is considered, whether
illumination is controlled or not) and the characteristics of the objects (whether or not objects of
different sizes, transparent or reflective are considered) are reported for each paper and for the
workstation presented in the work.
Some of the published papers deserve additional discussion. For example the pioneering work of
Sanz et al. (1998) exploits image processing techniques to determine the grasping points for picking
up unknown everyday objects. Similarly, Saxena et al. (2008) do not concentrate on objects
themselves but on identifying their grasping point. Indeed they are concerned with grasping all the
available objects rather than looking for a specific object. Synthetic models of typical objects with
manually selected grasp areas (neck for glasses, handle for cups, etc.) are indicated and used to train
the system. However both these approaches consider isolated objects with few or no distractors and
no severe occlusions (at least not of the grasping point).
Unfortunately, the cluttered appearance of objects due to occlusions and distractors tends to make
these approaches unreliable in real-life scenarios. By contrast, Rahardja and Kosaka (1996) perform
bin-picking of industrial objects using stereo vision. Simple visual global features such as region
area, eccentricity, and gray scale mean value are adopted for object recognition and pose estimation.
However, Rahardja and Kosaka (1996) do not cover the crucial aspect of transparencies which are
commonplace when managing healthcare market items.
Some solutions exploit additional sensor modalities to improve the system performance. For
instance, Mohan et al. (2011) propose the combined used of a structured light for computing a 3D

reconstruction of the scene using a standard single camera, while Prasse et al. (2011) merge
computer vision and camera with RFID processing, which guarantees a more accurate identification
of the objects. Both these solutions, however, bring additional costs, more computational burden
and are not applicable to all the conditions (for instance, structured light can be severely misled by
uncontrolled natural light).
The picking workstation described in this paper therefore aims to satisfy requirements coming from
a market field that is continuously investing in IT solutions (Gunasekaran et al. 2006) in order to
overcome traditional approaches and obtain improvements. It disregards published experimentation
with vision-based object-grasping approaches.
[TAKE IN TABLE 1]
3 Characteristics and components of the picking workstation
Our proposed workstation is specifically oriented to a typical pick-and-place system, examples of
which in the healthcare market field have been described above. Further details are reported in the
sequel and depicted in Figure 6.
[TAKE IN FIGURE 6]
The objects are either dropped in bulk onto bins positioned on a belt or randomly dropped directly
onto the belt. The belt is moved to bring the object to the picking station where two cameras acquire
a pair of synchronised stereo images. The first camera is used to segment the image in order to
detect the target objects, their 2D position and their orientation. The second camera is used to
estimate the distance from the cameras of the object to be picked up. It does so by composing,
together with the first camera, a classical stereo pair: this estimation, through a proper calibration of
the whole system, will allow the correct 3D localisation of the object. These 3D coordinates ((x; y)

obtained from the segmented image and z from the stereo-based 3D estimation) and the object’s
main orientation are sent to the robot which picks up the selected object and places it in the placing
station. This architecture is fairly standard in pick-and-place robotic applications where objects
normally enter the system in an ordered manner on a line, making the computer vision process
easier. The novelty of our proposal is that the robustness of the method and its generality mean that
unordered objects also become tractable. This characteristic is particularly interesting in the field of
pharmaceuticals where, as mentioned above, flow packs, irregularly-shaped packaging, and
UDDDS are encountered.
The main procedure of the system iterates through four main phases. In the Object Detection phase,
the objects in the current image are detected and localised (in 2D). This is the core of the system
and is described in more detail below. Once the objects are detected, one of them is selected as the
next one to be picked up. This Object Selection phase can be based on some models in order to
optimize the robot trajectories, reduce the overall working time, and improve predefined objectives
set by the customer. In our prototype, Object Selection is obtained by ordering the objects with
decreasing distance from the robot (to account for the closest object first).
The third phase (3D Object Localization) exploits camera calibration to obtain 3D world
coordinates of the grasping points of the selected object. Finally, these coordinates are sent to the
robot which picks up the selected object (Object Picking phase).
This process is iterated by acquiring a new image from a single camera. The image segmented at the
previous iteration could in principle be used to obtain the next selected object (without performing
object detection again), but the picking of the object often shuffles the remaining objects.
A detailed flowchart of the Object Detection phase is shown in Figure 7. The left side of the
flowchart shows the offline model acquisition. In fact the target object is modelled using multiple
2D models, both from the same view of the object and from different views/faces of the object. All
the models are taken under free environmental illumination and using different object orientations
in order to be robust to the reflexes created by a possible transparent container. i
jM represents the j-

th model for the face i (the total number of faces is indicated by F), while is the set of principal
points for the j-th model of the face i.
The right side of Figure 7 shows the online process which consists of two main phases: Feature
extraction and matching, and Object localisation.
In “Feature extraction and matching”, significant features are extracted from both the object model
and the current image. Among the possible local features to be used for model-image matching, we
selected the SIFT features and the 2NN (two nearest neighbours) heuristic proposed in Lowe
(2004). SIFT has proved to be very robust to noise and invariant to scaling, rotation, translation and,
to some extent, illumination changes. Given the two sets of features ( for the j-th model of face i
and K from the current image – see Figure 7) the standard 2NN matching algorithm computes the
Euclidean distance to find the image-to-model matches (or correspondences) , where each match
contains the (x; y) coordinates on the two reference systems and the main orientation on the current
image.
[TAKE IN FIGURE 7]
The “object localisation” step computes a registration transform between the model and the best
location of the detected object in the current image. This is achieved by first clustering the matches
using a voting scheme which allows us to estimate the object centre’s position (considering pure
roto-translational, i.e. Euclidean, transform). Next, the Mean Shift algorithm (Fukunaga et al. 1975)
is applied to account for uncertainty and inaccuracies (only the centres with a minimum number of
contributing matches are considered correct). Finally, for each cluster the positions of a fixed
number of principal points are computed in order to define the object delimiting shape and/or the
grasping points.

In the example shown in figure 8, the numbers in black represent the estimates of the object’s
centre, the black cross the estimated centre position, while small circles in blue, red, yellow and
green represent the estimates of the other four principal points.
More details concerning the algorithm implemented are available in Piccinini et al. (2010).
[TAKE IN FIGURE 8]
4 Experimental results
To validate our approach in the context of healthcare applications, experiments are performed on
very different types of pharmaceutical/cosmetic objects. A summary of the objects used in these
tests is given in table 2. For each object, a list of peculiarities is defined. Some peculiarities, such as
texture or size, may aid detection, i.e. they are “positive” in the table. Others, such as reflectivity or
transparency, may hinder it and are therefore denoted by “negative”. The grade (from “Very Low”
to “Very High”) reported for each peculiarity indicates how much it applies to that type of object.
The “Difficulty” column is a subjective evaluation of how difficult it is to detect the object. Figure 9
also shows some snapshots of the objects.
[TAKE IN TABLE 2]
[TAKE IN FIGURE 9]
The accuracy of our approach can be measured using different metrics:
The precision at object level that accounts for the fraction (as a percentage) of detected
objects that are correct;
The recall at object level that accounts for the fraction (as a percentage) of existing correct
objects that are detected (Makhoul et al. 1999);
The accuracy of the centre location, more application-oriented. In a pick-and-place
application the accuracy in determining the grasping point (e.g. the centre) is crucial, hence
the distance between the detected coordinates and the actual ones is computed and
expressed both in pixel ( ) and as a percentage ( ), as described in equation (1):
(1)
where is the mean area of the analysed items, expressed in pixels and strictly
connected with the zoom defined on the camera. In the analysed case study, values
registered for are reported in the sequel:
[TAKE IN TABLE 3]
The fact that at least one catchable object is detected at each iteration (in order to “feed” the
robot) and consequently the picking of all the objects after a certain number of iterations
(equal to the number of items in the order or all the available items in the bin or on the
conveyor belt; specifically, in our experimentation the picking of all the available items is
studied). An example of such behaviour is shown in figure 10. Given all the items randomly
distributed on the conveyor belt or into the bin, our approach localises products that are
highlighted by green boundaries. The yellow-bounded item is the one selected in
accordance with predefined picking and placing algorithms and objectives, which is then
positioned in the placing station. In the following iteration, a new detection of items occurs
and a new selection of the product to be placed in the placing station is executed. The
process continues until no more items are available on the conveyor belt or in the bin or
until no more objects are detected. In the former case, the picking sequence is correctly
executed, with a performance rate of 100%. In the latter case, inferior performance is

registered. Specifically, the more undetected objects are registered, the less efficient the
localising process is.
[TAKE IN FIGURE 10]
The precision, recall and accuracy of the centre location are based on fundamental truths obtained
by subjective operator evaluations.
Last but not least and importantly for our purposes: we also aim to evaluate the efficiency of our
proposal by measuring the computational and operational time.
The experiments are carried out using three different scenarios: the first includes a rather simple
situation with few objects (even if randomly available which produces occlusions) and no
distractors (“EASY”); the second scenario considers a more complex situation with tens of objects
(“COMPLEX”); the third scenario (“DISTRACTORS”) is a complex case which also includes
distractors (paper, cellophane or scotch tape).
Each experiment is run three times with a new image and new objects and then averaged.
Results obtained are reported in table 4 and in figures 11 and 12, where the aforementioned data is
also depicted in order to increase its readability.
[TAKE IN TABLE 4]
[TAKE IN FIGURE 11]
[TAKE IN FIGURE 12]
It is worth noting that the general accuracy is similar to that obtained in previous experiments with
different objects (Piccinini et al. 2010). The performance degrades when more challenging objects
are considered such as pills which are untextured and bright and which make visual detection
harder. Uncommon behaviour can be identified in the case of “Band-aid Box” objects. These are

simple objects for which however recall is limited because they are thicker and tend to overlap each
other with out-of-the-plane rotations. This violates the assumption of pure Euclidean transformation
hypothesis mentioned in the introduction. In addition, the better performance achieved in some
cases for small pills compared to large ones can be ascribed to the lower probability of occlusions in
the case of small objects. Finally, the consistent improvement in centre accuracy in the
“Distractors” scenario for “Toothbrush Head” objects is also due to the improvement in precision at
object level. This can be explained by the highly textured nature of this object and thus to its
robustness to occlusions caused by distractors.
Given that our target scenario is the use of the proposed workstation in health care systems, the
values obtained for the execution of both isolated and sequenced detection, picking and placing
actions, performed in a complex environment, will allow comparison between the introduction of an
automated workstation in substitution with a manually-managed picking area.
The benefits associated with the insertion of robotics in healthcare systems have been studied since
the 1980s (Minifie 1989). Traditional manual picking systems (similar to those described in figure
3) have been widely studied in the past (Hwang and Cho 2006, Pan and Shih 2008, Rim and Park
2008). Nevertheless, congestion often occurs. When product characteristics are suitable, i.e. small
items with no particular stocking or handling conditions, the systems described in figure 5 are
therefore implemented. A recent contribution has studied the problem of subdividing picking work
in different workstations (Hou et al. 2009).
In our experimentation, operative environments depicted in figures 4 and 5 are compared in terms
of detection, picking and placing execution time per cycle. Subsequently, sequences of detection,
picking and placing actions are studied. Finally, an economical analysis is traced.
In the robotic picking workstation, mean registered time per cycle for image acquisition, image
elaboration, picking and placing are described in table 5. Next, the handled items per minute are
computed.
[TAKE IN TABLE 5]
Otherwise, in the case of a manual workstation, such times are estimated by MINIMOST System
(Zandin 2003), available for measuring work in case of identical cycles, typically of short duration.
Specifically, the General Move Sequence Model is implemented and the studied work is analysed
by the following sequence of parameters:
A (Action distance). This parameter covers all spatial movements or actions of fingers,
hand and/or feet, either loaded or unloaded by an object;
B (Body motion). This parameter is used to specify vertical motion of the body, including
the exercise of eye travel;
G (Grain control). This parameter covers all manual motions (mainly of the fingers, hand or
foot) employed to obtain complete control of an object, before moving it to another
location;
P (Placement). This parameter is used to analyze actions at the final stage of displacement.
Such parameters are structures in the sequence ABGABPA, whose parts are grouped in sets similar
to those executed by the robot:
Object detection (AB)
Grasping (G)
Placing (ABPA).
Next, parameter indexing is evaluated. By observing or visualising the operator's actions during
each phase of the activity, a duration (reported in the subscript of each parameter) is evaluated by
matching each parameter variant with the data card reported in Zandin (2003). For example, the
variant is associated with any displacement of the fingers and/or hands at a distance greater than 10
cm and less than or equal to 20 cm.
The full evaluated sequence per studied object is reported in the second column of table 6.

Subsequently, the total operative time per cycle is computed and expressed both in TMU (Time
Measurement Unit; 1 TMU=0.036 seconds) and in seconds. Finally, the last column describes the
effects of the implementation of a manual workstation, in comparison with a robotic one. A
reduction in the handled items per minute is registered in the range [-70.27%, -196.97%].
[TAKE IN TABLE 6]
Hence the introduction of the robotic workstation induces the possibility of executing more picking
cycles per minute in the range of [+41.27%, +66.33%] (see table 5, last column).
As mentioned above, the behaviour of the system during sequences of detection, picking and
placing actions is finally studied. Results obtained are depicted in figure 14. Whilst dropper, glass
syringe, toothbrush head, hand gel and band-aid box demonstrate the complete correct execution of
the sequence (to which 100% of performance is coupled), syringe and pills (initially classified as
critical items) demonstrate a lower performance.
[TAKE IN FIGURE 14]
Nevertheless, the good margins mentioned above for detection, picking and placing time per cycle
address guidelines for improving the behaviour of the workstation, which can be loaded with items
in bins and equipped with a shaker, moving the working desk slightly. When a bin containing
products is located on the working desk and no object is detected by the robot, a shake could take
place in order to change objects disposition and re-apply the object detection algorithm. In such
cases, given the aforementioned robot operative cycle (image acquisition, image processing,
picking, placing), the two previous steps are executed as many times as required but picking and
placing are executed only once. Table 7 describes the cycle of a robot where, in the case of critical
items (syringe and pills), even if image acquisition and processing are executed twice, the

improvements in terms of handled items per minute, in comparison with a manual workstation, still
remain at 41.27% for syringe and at 60.24% for pills (first two columns of table 7). Furthermore,
improvements are still assured if repetitions are executed up to 4 times (see table 7).
However, experimental results reported in figure 14 demonstrate that less than one shake per object
detection is enough to ensure the complete execution of the picking sequence.
Such a result is crucial for a picking area where the insertion of automation induces a consistent
improvement in performance, regarding both the speed of action execution and the registered
reliability. Alternatively, picking errors in the range are registered when manual
picking areas are analysed (Osualdella 2011).
Furthermore, whilst the human errors are characterised by undetectability and are often registered
by the user, the errors made by the proposed automated system are managed by an internal control
system, before reaching the user. Specifically, in the manual picking system depicted in figure 4,
the operators could include in the customers orders wrong medicines, or correct objects but with an
incorrect amount, and no traceability of their actions is available (Abbasi 2011). So, only the final
user can detect errors and complain with the warehouse managers. On the contrary, in the picking
automated system presented in this work the occurring errors are related only with the presence of
an object in the bin, that, however, is not detected. Such errors are automatically managed by
repeating the image acquisition and processing steps in a re-called bin containing the same
medicines. Obviously, picking and placing steps occur only once, when a correct object detection
occurs.
In tables 8 and 9 the objects managed per minute, respectively in the manual and in the robotic
system when errors are taken into account, are reported. Specifically, in the computation of correct
cycles per minute executed in a manual picking system, the errors percentage reported in
aforementioned (Osualdella 2011) are considered and used for correcting values presented in
column 8 of table 6. Alternatively, in the computation of the correct cycles per minute executed in
the robotic picking system, the errors percentages emerging in the execution of a picking sequence

(depicted in figure 14) are used for evaluating how many times image acquisition and processing
steps need to be repeated.
The introduction of the robotic workstation induces again the possibility of executing more picking
cycles per minute in the range of [+42.86%, +65.59%] (see table 9, last column).
[TAKE IN TABLES 8 AND 9]
Finally, an economical analysis of the behaviour of the manual and the robotic picking system,
respectively, is carried out. Specifically, as shown in figures 4 and 5, both systems are constituted
by an A-frame module, an automated parts-to-picker module, a conveyor belt, with groups of
pharmaceuticals, created by the A-frame module and final containers for satisfying customers
orders. Moreover, whilst pickers serve the manual system, the robotic workstation serves the
automated system. Hence, by focusing only on the differential costs (hourly manpower in the first
case and hourly cost of the robotic workstation in the latter), unitary costs for handling each item
picked from bins in the automated parts-to-picker module and placed on the conveyor belt are
reported in tables 10 and 11. Specifically, both the ideal case without errors and the case with
detection errors are analysed. In table 10 an operator hourly cost of 27 €/hour is compared with the
case of a robotic workstation hourly cost in the range [40; 80] €/hour, related with differential
equipments of the robot (i.e. dimension of the picking arm, available movements in the picking arm
...). The obtained results will address the choices of managers and engineers engaged in the analysis
of conditions, by also assuring economical benefits from the insertion of the robotic workstation in
the market. Specifically, the automated solution results to be cheaper if its characteristics and
operative conditions assure to not overcome limit costs in the range [50, 80] €/hour, that are
underlined with a bold character in table 11. Obviously, case specific alternative studies can be
executed in different operative environments, i.e. by varying operators hourly costs and/or robotic
workstation customized characteristics.

[TAKE IN TABLES 10 AND 11]
5 Conclusions
More and more research is being conducted on centralised distribution of pharmaceuticals in
healthcare systems due to its effect on final costs perceived by users. Solutions addressing its
efficiency are therefore subject to ongoing study.
This paper focuses on the picking process commonly found in centralised warehouses. Specifically
it describes a new picking workstation available for insertion in automated pharmaceutical
distribution centres and which is capable of replacing manual workstations and improving working
time. A sophisticated algorithm is implemented which exploits state-of-the-art feature descriptors to
allow picking of very diverse and complex objects randomly available on a belt or in bins, even
where occlusions and distractors exist.
A wide experimentation is executed by focusing the performance analysis in the promising field of
healthcare, often disregarded by computer vision researchers.
The values obtained for precision and recall suggest the use of the new studied workstation with
scarcely detectable objects occurring in the healthcare field, often characterised by irregular shape
and flowpacks, along with transparencies.
Next, a comparison with the studied automated workstation with a manual picking-managed zone is
carried out. Improvements in the handled items per minute are registered in the range of [+41.27%,
+66.33%]. Furthermore, interesting improvements still remain when, with very critical items such
as pills, the image acquisition and processing step should require an iteration, e.g. following a
shake. Up to 4 iterations can be assured per image without inducing inefficiencies in the system.
However, in the executed experimentation less than one shake per object detection is enough to
ensure the complete execution of the picking sequence.

Furthermore, the errors occurring during picking are deeply analysed, both in their content and in
their effect on the system’s technical and economical performance. Specifically, cycles per minute
without and with the presence of picking errors are compared. The introduction of the robotic
workstation induces again the possibility of executing more picking cycles per minute in the range
of [+42.86%, +65.59%].
Finally, an economical analysis is carried out and unitary handling costs are computed for both the
manual and the robotic system. Moreover, both the ideal case without picking errors and the case
with detected errors are analysed by defining limit cost values addressing the choice of the proposed
robotic workstation.

References
Abbasi, M., 2011. Storage, warehousing and inventory management. Logistics Operations and
Management, 181-197.
Asadi, S., 2011. Logistics system: Information and communication technology. Logistics
Operations and Management, 221-245.
Battini, D., Faccio, M., Persona, A., Sgarbossa, F., 2009. Healthcare supply chain modeling: a
conceptual framework. Proceedings of POMS (Production and Operations Management Society)
20th Annual Conference, 1st-4th May, Orlando (USA).
Bone, G.M., Lambert, A., Edwards, M., 2008. Automated modeling and robotic grasping of
unknown three-dimensional objects. Proceedings of IEEE International Conference on Robotics and
Automation, 292-298.
Bowman, R.J., 1997. EHCR at a glance. Distribution, 96, 18.
Bradley, P., 2000. Taking on the health care supply chain. Manufacturing Systems, 50–51.
Burns, L.R., Degraaff, R.A., Danzon, P.M., Kimberly, J.R., Kissick, W.L., Pauly, M.V., 2002. The
Wharton School study of the health care value chain. In: Burns, L.R., The Healthcare Value Chain:
Producers, Purchasers, and Providers, Wiley, New York (USA).
Caldeira Pedroso, M., Nakano, D., 2009. Knowledge and information flows in supply chains: A
study on pharmaceutical companies. International Journal of Production Economics, 122, 376-384.
Chandra, C., 2008. The case for healthcare supply chain management: insights from problem
solving approaches. International Journal of Procurement Management, 1, 261-279.
de Koster, R., Le-Duc, T., Roodbergen, K.J., 2007. Design and control of warehouse order picking:
A literature review. European Journal of Operational Research, 182, 481-501.
de Vries, J., 2011. The shaping of inventory systems in health services: A stakeholder analysis.
International Journal of Production Economics, 133, 60-69.
Dongsoo, K., 2005. An integrated supply chain management system: A case study in healthcare
sector. Lecture Notes in Computer Science, 3590, 218-227.

Fukunaga, K., Hostetler, L., 1975. The estimation of the gradient of a density function, with
applications in pattern recognition. IEEE Transactions on Information Theory, 21, 32–40.
Goetschalckx, M., Ashayery, J., 1989. Classification and design of order picking systems. Logistics
World, June, 99-106.
Gunasekaran, A., Ngai, E.W.T., McGaughey, R.E., 2006. European Journal of Operational
Research, 173, 957-983.
Hou, J.-L., Wu, N., Wu, Y.-J., 2009. A job assignment model for conveyor-aided picking system.
Computers & Industrial Engineering, 56, 1254-1264.
Huang, Y.-J., Lee, F.-F., 2010. An automatic machine vision-guided grasping system for
Phalaenopsis tissue culture plantlets. Computers and Electronics in Agriculture, 70, 42-51.
Hwang, H.S., Cho, G.S., 2006. A performance evaluation model for order picking warehouse
design. Computers & Industrial Engineering, 51, 335-342.
Lowe, D.G., 2004. Distinctive image features from scale-invariant keypoints. International Journal
of Computer Vision, 60, 91–110.
Makhoul, J., Kubala, F., Schwartz, R., Weischedel, R., 1999. Performance measures for information
extraction. Proceedings of DARPA Broadcast News Workshop, Herndon, VA (USA), February.
Minifie, J.R., 1989. Survey of robotics in the health care industry. Engineering costs and production
economics, 17, 223-230.
Mohan, S., Simonsen, K.B., Balslev, I., Kruger, V., Eriksen, R.D., 2011. 3D scanning of object
surfaces using structured light and a single camera image. Proceedings of IEEE Conference on
Automation Science and Engineering (CASE), 151-156.
Nicholson, L., Vakharia, A.J., Selcuk Erenguc, S., 2004. Outsourcing inventory management
decisions in healthcare: Models and application. European Journal of Operational Research, 154,
271-290.
Nollet, J., Beaulieu, M., 2003. The development of group purchasing: an empirical study in the
healthcare sector. Journal of Purchasing & Supply Management, 9, 3-10.

Osualdella, S., 2011. L'automazione al servizio del parafarmaco. Il Giornale della Logistica, 20/06,
46-50.
Pan, J. C.-H., Shih P.-H., 2008. Evaluation of the throughput of a multiple picker order picking
system with congestion consideration. Computers & Industrial Engineering, 55, 379-389.
Piccinini, P., Prati, A., Cucchiara, R., 2010. SIFT-based Segmentation of Multiple Instances of
Low-Textured Objects. Proceedings of International Conference on Machine Vision (ICMV), Hong
Kong, 28-30 Dec.
Prasse, C., Skibinski, S., Weichert, F., Stenzel, J., Muller, H., ten Hompel, M., 2011. Concept of
automated load detection for de-palletizing using depth images and RFID data. Proceedings of
IEEE International Conference on Control System, Computing and Engineering (ICCSCE), 249-
254.
Rahardja, K., Kosaka, A., 1996. Vision-based bin picking: recognition and localization of multiple
complex objects using simple visual cues. Proceedings of IEEE/RSJ International Conference on
Intelligent Robots and Systems, 1448-1457.
Rim, S.-C., Park, I.-S., 2008. Order picking plan to maximise the order fill rate. Computers &
Industrial Engineering, 55, 557-566.
Saxena, A., Driemeyer, J., Ng, A.Y., 2008. Robotic grasping of novel objects using vision. The
International Journal of Robotics Research, 27, 157-173.
Sanz, P., Del Pobil, A., Inesta, J., Recatala, G., 1998. Vision-guided grasping of unknown objects
for service robots. Proceedings of IEEE International Conference on Robotics and Automation,
3018–3025.
Speth, J., Morales, A., Sanz, P., 2008. Vision-based grasp planning of 3D objects by extending 2D
contour based algorithms. Proceedings of IEEE/RSJ International Conference on Intelligent Robots
and Systems, 2240-2245.
Summerfield M.R., 1983. Unit dose primer. American Society of Hospital Pharmacists, Bethesda
(USA).

Tompkins, J.A., White, J.A., Bozer, Y.A., Frazelle, E.H., Tanchoco, J.M.A., 2003. Facilities
planning, John Wiley & Sons, New Jork (USA).
van den Berg, J.P., Zijm, W.H.M., 1999. Models for warehouse management: Classification and
examples. International Journal of Production Economics, 59, 519-528.
Zandin, K.B., 2003. MOST Work Measurement Systems. CRC Press, Boca Raton (USA).

Figure 1 Main frameworks describing the relation between pharmaceutical companies
and hospitals and clinics
PHARMACEUTICAL
COMPANIES Hospitals and
Clinics
1.
Goods
Inform.
$
2.
PHARMACEUTICAL
COMPANIES Hospital 1
Hospital 2
...
Hospital n
UDC
Goods
Inform.
$
Goods
Inform.
$
3.
PHARMACEUTICAL
COMPANIES Hospital 1
Hospital 2
...
Hospital n
Logistic Operator
Goods
Inform.
$
Inform.
$
Goods

Figure 2 An example of an automated picking system (named A-frame), widely used in
pharmaceuticals distributions centers
Side view Front view

Figure 3 A warehouse scheme with a composition of automated picking and manual
picker-to-parts system
A-frame module
Conveyor belt Groups of pharmaceuticals for
different customers, created by
the A-frame module
Containers for
final customers
Pickers
Shelves

Figure 4 A warehouse scheme with a composition of automated picking and manual
parts-to-picker system
A-frame module
Conveyor
belt
Groups of pharmaceuticals
for different customers,
created by the A-frame
module
Containers for
final customers Pickers
Automated parts-to-
picker module
Containers with
items sequenced in
accordance with the
output of the A-
frame module

Figure 5 A warehouse scheme with a composition of automated picking and robotic
parts-to-picker system
Picking robot
A-frame module
Conveyor
belt
Groups of pharmaceuticals
for different customers,
created by the A-frame
module
Containers for
final customers
Automated parts-to-
picker module
Figure 6 General overview of the workstation
Object at
random disposal

Figure 7 Flowchart of the “Object Detection” phase

Figure 8 Examples of “Object Dectetion” results
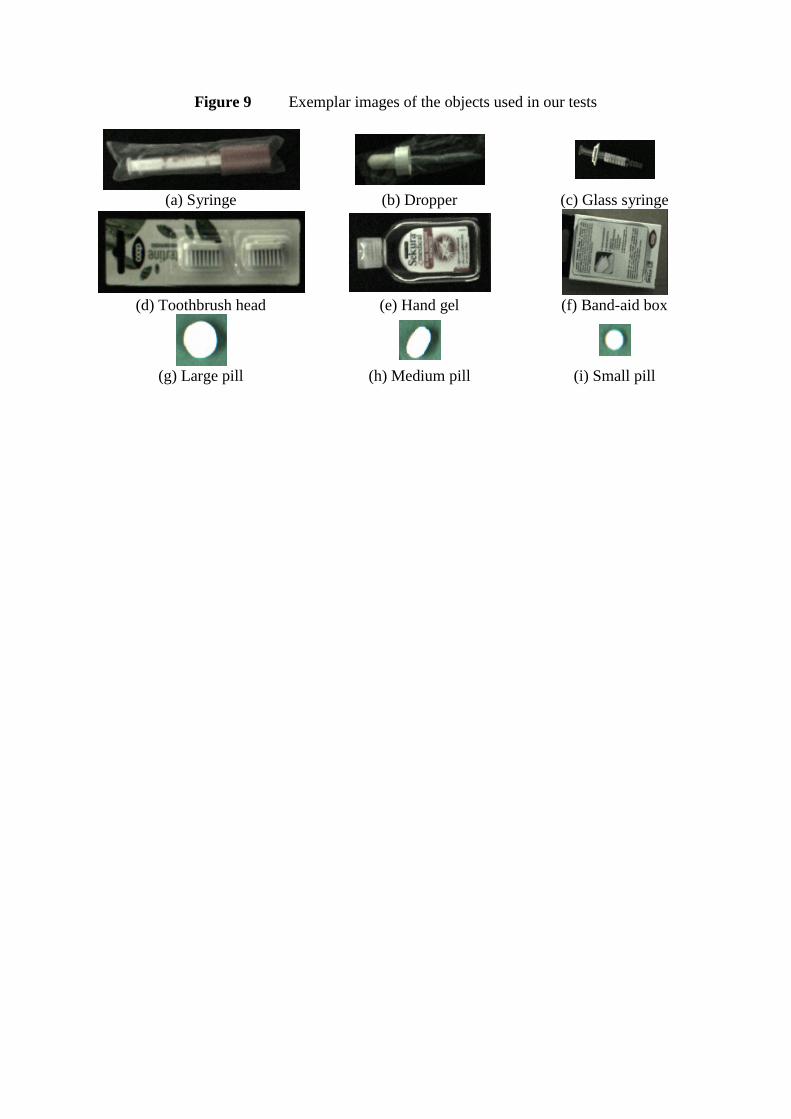
Figure 9 Exemplar images of the objects used in our tests
(a) Syringe (b) Dropper (c) Glass syringe
(d) Toothbrush head (e) Hand gel (f) Band-aid box
(g) Large pill (h) Medium pill (i) Small pill

Figure 10 An example of picking sequence for “Toothbrush heads”
(yellow indicates the selected object)

Figure 11 Histograms of accuracy at object-level
(a) Syringe
(b) Dropper
(c) Glass syringe
(d) Toothbrush head
0.00%
50.00%
100.00%
EASY COMPLEX DISTRACTORS
Object-level Precision Recall
0.00%
50.00%
100.00%
EASY COMPLEX DISTRACTORS
Object-level Precision Recall
0.00%
50.00%
100.00%
EASY COMPLEX DISTRACTORS
Object-level Precision Recall
0.00%
50.00%
100.00%
EASY COMPLEX DISTRACTORS
Object-level Precision Recall

(e) Hand Gel
(f) Band-aid Box
(g) Large Pills
0.00%
50.00%
100.00%
EASY COMPLEX DISTRACTORS
Object-level Precision Recall
0.00%
50.00%
100.00%
EASY COMPLEX DISTRACTORS
Object-level Precision Recall
0.00%
50.00%
100.00%
EASY COMPLEX DISTRACTORS
Object-level Precision Recall
0.00%
50.00%
100.00%
EASY COMPLEX DISTRACTORS
Object-level Precision Recall

(h) Medium Pills
(i) Small Pills
0.00%
50.00%
100.00%
EASY COMPLEX DISTRACTORS
Object-level Precision Recall

Figure 12 Histograms of center distance (in pixels)
(a) Syringe
(b) Dropper
(c) Glass syringe
(d) Toothbrush head
0.00
5.00
10.00
15.00
EASY COMPLEX DISTRACTORS
Center distance (in px)
0.00
5.00
10.00
15.00
EASY COMPLEX DISTRACTORS
Center distance (in px)
0.00
5.00
10.00
15.00
EASY COMPLEX DISTRACTORS
Center distance (in px)
0.00
5.00
10.00
15.00
EASY COMPLEX DISTRACTORS
Center distance (in px)

(e) Hand Gel
(f) Band-aid Box
(g) Large Pills
0.00
5.00
10.00
15.00
EASY COMPLEX DISTRACTORS
Center distance (in px)
0.00
5.00
10.00
15.00
EASY COMPLEX DISTRACTORS
Center distance (in px)
0.00
5.00
10.00
15.00
EASY COMPLEX DISTRACTORS
Center distance (in px)
0.00
5.00
10.00
15.00
EASY COMPLEX DISTRACTORS
Center distance (in px)

(h) Medium Pills
(i) Small Pills
0.00
5.00
10.00
15.00
EASY COMPLEX DISTRACTORS
Center distance (in px)

Figure 14 Percentage of correct picking in the sequence experiment
0.0%
20.0%
40.0%
60.0%
80.0%
100.0%
Pe
rce
nta
ge o
f co
rre
ct p
icki
ng
Object type
Results on picking sequence experiment

Table 1 Published approaches in the field of vision-based object grasping systems
Paper ref.
(year) Addressed objects Note
Difficulties
Distractors Multiple
Instances Occlusions
Random
Disposal
No control
illumination
Different
size objects
Transparent
objects
Reflective
objects
Rahardja &
Kosaka (1996)
Alternator covers
Use of stereo
cameras YES YES YES YES U NO NO YES
Sanz et al.
(1998)
Potentially any
N/A NO NO NO NO NO YES NO NO
Bone et al.
(2008)
Metal bracket and hex
nut
3D model
acquisition +
integration of
structured
light
NO NO NO NO NO YES NO YES
Saxena et al.
(2008)
Potentially any
Not
identifying
objects, just
grasping
NO NO YES YES YES NO YES YES
Speth et al.
(2008)
Several types
3D model
acquisition NO NO NO NO U YES NO NO
Huang &
Lee
(2010)
Tissue culture plantlets
Use of stereo
cameras NO YES NO NO NO NO NO NO
Proposed
system
Potentially any
Use of stereo
cameras YES YES YES YES YES YES YES YES

Table 2 Summary of the types of objects used in the experiments
Name Texture Size Reflectivity Transparency Multi-face Deformability
Difficulty Positive Positive Negative Negative Negative Negative
Syringe Very Low Low Medium High Very Low Low High
Dropper Very Low Very Low High Very High Very Low Low High
Glass Syringe Medium Low Low High High Very Low Medium
Toothb. Head Very High Medium Low Low High Very Low Low
Hand Gel High High Medium High High Very Low Medium
Band-aid Box Very High High Very Low Very Low High Very Low Very Low
Large Pill Very Low Medium Low Very Low Very Low Very Low High
Medium Pill Very Low Low Low Very Low Very Low Very Low High
Small Pill Very Low Very Low Low Very Low Very Low Very Low Very High

Table 3 Mean area in the case study
Name Name Name
Syringe 14262 px Toothb. Head 33375 px Large Pill 19142 px
Dropper 10758 px Hand Gel 24072 px Medium Pill 11971 px
Glass Syringe 11435 px Band-aid Box 30628 px Small Pill 6413 px

Table 4 Accuracy at object level and center distance (both and measures).
Name EASY
Precision Recall
Syringe 100.00% 77.78% 3.95 0,028%
Dropper 91.67% 100.00% 4.46 0,041%
Glass Syringe 100.00% 88.89% 1.78 0,016%
Toothb. Head 100.00% 100.00% 1.99 0,006%
Hand Gel 100.00% 66.67% 3.74 0,016%
Band-aid Box 100.00% 53.33% 1.86 0,006%
Large Pill 66.03% 57.14% 2.37 0,012%
Medium Pill 75.00% 44.44% 3.60 0,030%
Small Pill 100.00% 66.67% 1.46 0,023%
Name COMPLEX
Precision Recall
Syringe 100.00% 57.14% 6.43 0,045%
Dropper 74.49% 53.33% 4.56 0,042%
Glass Syringe 94.32% 72.46% 2.65 0,023%
Toothb. Head 84.13% 70.00% 7.05 0,021%
Hand Gel 100.00% 50.00% 1.85 0,008%
Band-aid Box 100.00% 46.67% 1.79 0,006%
Large Pill 85.45% 64.29% 1.74 0,009%
Medium Pill 87.78% 21.67% 3.56 0,030%
Small Pill 94.44% 55.56% 1.76 0,027%
Name DISTRACTORS
Precision Recall
Syringe 63.89% 61.90% 7.52 0,053%
Dropper 93.33% 48.89% 5.17 0,048%
Glass Syringe 97.62% 60.87% 2.79 0,024%
Toothb. Head 89.68% 60.00% 2.16 0,006%
Hand Gel 100.00% 30.00% 3.03 0,013%
Band-aid Box 100.00% 50.00% 1.26 0,004%
Large Pill 33.70% 23.81% 1.78 0,009%
Medium Pill 31.03% 10.00% 2.58 0,022%
Small Pill 44.44% 20.00% 2.53 0,039%

Table 5 Mean registered time in robotic picking workstation.
Name
Image
acquisition
[sec]
Image
processing
[sec]
Picking
[sec]
Placing
[sec]
Total time
[sec]
Items per
minute Comparison
Syringe 0,0103 0,210 0,250 0,250 0,720 83 +55,42%
Dropper 0,0103 0,210 0,250 0,250 0,720 83 +55,42%
Glass Syringe 0,0103 0,430 0,250 0,250 0,940 63 +41,27%
Toothb. Head 0,0103 0,430 0,250 0,250 0,940 63 +41,27%
Hand Gel 0,0103 0,430 0,250 0,250 0,940 63 +41,27%
Band-aid Box 0,0103 0,430 0,250 0,250 0,940 63 +41,27%
Large Pill 0,0103 0,0983 0,250 0,250 0,609 98 +66,33%
Medium Pill 0,0103 0,0983 0,250 0,250 0,609 98 +66,33%
Small Pill 0,0103 0,0983 0,250 0,250 0,609 98 +66,33%

Table 6 Mean registered time in manual workstation through MINIMOST system.
Name MINIMOST
sequence
Object
detection
[TMU]
Picking
[TMU]
Placing
[TMU]
Total
[TMU]
Total
[sec]
Items
per
minute
Comparison
Syringe 6 10 28 44 1,58 37 -124,32%
Dropper 6 10 28 44 1,58 37 -124,32%
Glass Syringe 6 10 28 44 1,58 37 -70,27%
Toothb. Head 6 10 28 44 1,58 37 -70,27%
Hand Gel 6 10 28 44 1,58 37 -70,27%
Band-aid Box 6 10 28 44 1,58 37 -70,27%
Large Pill 6 16 28 50 1,80 33 -196,97%
Medium Pill 6 16 28 50 1,80 33 -196,97%
Small Pill 6 16 28 50 1,80 33 -196,97%

Table 7 Comparison between robotic and manual approaches in case of multiple iterations of
the robotic system for complex objects.
Name
2 iterations 3 iterations 4 iterations
Items per
minute Compar.
Items per
minute Compar.
Items per
minute Compar.
Syringe 63 +41,27% 51 +22,22% 43 +9,52%
Large Pill 83 +60,24% 72 +54,17% 64 +48,44%
Medium Pill 83 +60,24% 72 +54,17% 64 +48,44%
Small Pill 83 +60,24% 72 +54,17% 64 +48,44%

Table 8: Mean registered time in manual picking workstation, while considering only correctly
managed items.
Name
Items per
minute Comparison
Error percentage
[0,2%;1,5%]
Items per minute
while
considering
detection errors Comparison
Syringe 37 -124,32% 36 -122,22%
Dropper 37 -124,32% 36 -130,56%
Glass Syringe 37 -70,27% 36 -75,00%
Toothb. Head 37 -70,27% 36 -75,00%
Hand Gel 37 -70,27% 36 -75,00%
Band-aid Box 37 -70,27% 36 -75,00%
Large Pill 33 -196,97% 32 -190,63%
Medium Pill 33 -196,97% 32 -190,63%
Small Pill 33 -196,97% 32 -190,63%

Table 9: Mean registered time in robotic picking workstation, while considering only correctly managed items.
Name
Image
acquisition
[sec]
Image
processing
[sec]
Picking
[sec]
Placing
[sec]
Total
time
[sec]
Items per
minute Comparison
Items
correctly
managed
per minute
[%]
Total time
while
considering
detection
errors [sec]
Items per
minute while
considering
detection
errors Comparison
Syringe 0,0103 0,21 0,25 0,25 0,7203 83 55,42% 87,50% 0,7478 80 55,00%
Dropper 0,0103 0,21 0,25 0,25 0,7203 83 55,42% 100,00% 0,7203 83 56,63%
Glass Syringe 0,0103 0,43 0,25 0,25 0,9403 63 41,27% 100,00% 0,9403 63 42,86%
Toothb. Head 0,0103 0,43 0,25 0,25 0,9403 63 41,27% 100,00% 0,9403 63 42,86%
Hand Gel 0,0103 0,43 0,25 0,25 0,9403 63 41,27% 100,00% 0,9403 63 42,86%
Band-aid Box 0,0103 0,43 0,25 0,25 0,9403 63 41,27% 100,00% 0,9403 63 42,86%
Large Pill 0,0103 0,0983 0,25 0,25 0,6086 98 66,33% 70,00% 0,6412 93 65,59%
Medium Pill 0,0103 0,0983 0,25 0,25 0,6086 98 66,33% 68,97% 0,6423 93 65,59%
Small Pill 0,0103 0,0983 0,25 0,25 0,6086 98 66,33% 71,43% 0,6396 93 65,59%

Table 10: Unitary handling cost in manual picking system, by considering both an ideal
environment without errors and detected errors
Name
Items per
minute
Unit
handling
cost [€/pc]
Error percentage
[0,2%;1,5%]
Items per minute
while
considering
detection errors
Unit handling
cost [€/pc]
Syringe 37 0,0122 36 0,0125
Dropper 37 0,0122 36 0,0125
Glass Syringe 37 0,0122 36 0,0125
Toothb. Head 37 0,0122 36 0,0125
Hand Gel 37 0,0122 36 0,0125
Band-aid Box 37 0,0122 36 0,0125
Large Pill 33 0,0136 32 0,0141
Medium Pill 33 0,0136 32 0,0141
Small Pill 33 0,0136 32 0,0141

Table 11: Unitary handling cost in manual picking system, by considering both an ideal environment without errors and detected errors
Name
Items
per
minute
Hourly automated picking system cost [€/h] Items
correctly
managed
per
minute
[%]
Total time
while
considering
detection
errors [sec]
Items per
minute
while
considering
detection
errors
Hourly automated picking system cost [€/h]
40 [€/h] 50 [€/h] 60 [€/h] 70 [€/h] 80 [€/h] 40 [€/h] 50 [€/h] 60 [€/h] 70 [€/h] 80 [€/h]
Unitary
handling
cost [€/pc]
Unitary
handling
cost [€/pc]
Unitary
handling
cost [€/pc]
Unitary
handling
cost [€/pc]
Unitary
handling
cost [€/pc]
Unitary
handling
cost [€/pc]
Unitary
handling
cost [€/pc]
Unitary
handling
cost [€/pc]
Unitary
handling
cost [€/pc]
Unitary
handling
cost [€/pc]
Syringe 83 0,0080 0,0100 0,0120 0,0141 0,0161 87,50% 0,7478 80 0,0083 0,0104 0,0125 0,0146 0,0167
Dropper 83 0,0080 0,0100 0,0120 0,0141 0,0161 100,00% 0,7203 83 0,0080 0,0100 0,0120 0,0141 0,0161
Glass Syringe 63 0,0106 0,0132 0,0159 0,0185 0,0212 100,00% 0,9403 63 0,0106 0,0132 0,0159 0,0185 0,0212
Toothb. Head 63 0,0106 0,0132 0,0159 0,0185 0,0212 100,00% 0,9403 63 0,0106 0,0132 0,0159 0,0185 0,0212
Hand Gel 63 0,0106 0,0132 0,0159 0,0185 0,0212 100,00% 0,9403 63 0,0106 0,0132 0,0159 0,0185 0,0212
Band-aid Box 63 0,0106 0,0132 0,0159 0,0185 0,0212 100,00% 0,9403 63 0,0106 0,0132 0,0159 0,0185 0,0212
Large Pill 98 0,0068 0,0085 0,0102 0,0119 0,0136 70,00% 0,6412 93 0,0072 0,0090 0,0108 0,0125 0,0143
Medium Pill 98 0,0068 0,0085 0,0102 0,0119 0,0136 68,97% 0,6423 93 0,0072 0,0090 0,0108 0,0125 0,0143
Small Pill 98 0,0068 0,0085 0,0102 0,0119 0,0136 71,43% 0,6396 93 0,0072 0,0090 0,0108 0,0125 0,0143