study and analysis of automated order picking systems
TRANSCRIPT

STUDY AND ANALYSIS OF AUTOMATED ORDER PICKING SYSTEMS
A Thesis
Submitted to the Graduate Faculty
of the
North Dakota State University
of Agriculture and Applied Science
By
Akhilesh Chandra Ambati
In Partial Fulfillment of the Requirements
for the Degree of
MASTER OF SCIENCE
Major Department:
Industrial and Manufacturing Engineering
May 2012
Fargo, North Dakota

North Dakota State University Graduate School
Title
Study and Analysis of Automated Order Picking Systems
By
Akhilesh Chandra Ambati
The Supervisory Committee certifies that this disquisition complies with North Dakota
State University’s regulations and meets the accepted standards for the degree of
MASTER OF SCIENCE
SUPERVISORY COMMITTEE:
Dr.Reza A Maleki
Chair
Dr.Fardad Azarmi
Dr.Kambiz Farahmand
Dr,Jun Zhang
Approved:
05/24/2012
Dr.John R Cook
Date
Department Chair

iii
ABSTRACT
Order picking is an essential part of order processing in warehousing and distribution
operations and can be performed using manual, automated, or semi-automated systems.
This thesis analyzes two automated systems, which include carousel and AS/RS
(automated storage and retrieval system). The main goal of this research is to develop
mathematical models to compare the performance of both systems under random and class-
based storage assignments.
Simulation models are used to validate the reliability of mathematical models. The
outputs of mathematical and simulation models are consistent indicating carousel system
with class-based assignment has the highest throughput.
Economic analysis is used to estimate the payback periods required to convert from
manual to AS/RS and carousel systems. The economic analysis shows that converting from
manual to AS/RS with class-based assignment has the shortest payback period.

iv
ACKNOWLEDGEMENTS
I would like to express my sincere gratitude to my advisor, Dr. Reza Maleki, whose
encouragement, guidance, and support which enabled me to understand and complete my
research.
I would like to thank my committee members, Dr. Kambiz Farahmand, Dr. Jun
Zhang, and Dr. Fardad Azarmi, for their help and kindly advice with my research and study.
I also would like to thank my grandparents, parents, brother and sister on whose
Encouragement and love I have relied throughout my studies.
At last but not least I would like to thank my friends Vaibhav Biradar, Vinay Gonela,
Xia Xu, Ergin Erdem and others for their kind help.

v
TABLE OF CONTENTS
ABSTRACT ............................................................................................................................. iii
ACKNOWLEDGEMENTS ..................................................................................................... iv
LIST OF TABLES ................................................................................................................. viii
LIST OF FIGURES .................................................................................................................. ix
LIST OF APPENDIX TABLES................................................................................................ x
CHAPTER 1. INTRODUCTION .............................................................................................. 1
1.1. Background ..................................................................................................................... 1
1.2. Motivation....................................................................................................................... 6
1.3. Research Objective ......................................................................................................... 6
1.4. Thesis Outline ................................................................................................................. 7
CHAPTER 2. LITERATURE REVIEW ................................................................................... 8
2.1. Automated Order Picking Systems ................................................................................. 8
2.2. AS/RS (Automated Storage and Retrieval System) ....................................................... 8
2.2.1. Types of AS/RS .................................................................................................... 9
2.2.2. Advantages of AS/RS ......................................................................................... 10
2.2.3. Disadvantages of AS/RS ..................................................................................... 10
2.2.4. Travel time for AS/RS ........................................................................................ 10
2.2.5. Storage assignment for AS/RS ........................................................................... 11
2.3. Carousel System ........................................................................................................... 13
2.3.1. Types of carousel system .................................................................................... 14
2.3.2. Advantages of carousel system ........................................................................... 14
2.3.3. Disadvantages of carousel system ...................................................................... 14
2.3.4. Travel time for carousel system .......................................................................... 14

vi
2.3.5. Storage assignment for carousel system ............................................................. 16
2.4. Summary of Literature Review .................................................................................... 17
CHAPTER 3. METHODOLOGY ........................................................................................... 19
3.1. AS/RS ........................................................................................................................... 20
3.1.1. The typical order picking process in AS/RS ....................................................... 20
3.1.2. Pickup or cycle time for AS/RS .......................................................................... 21
3.1.3. AS/RS storage assignments ................................................................................ 22
3.2. Carousel System ........................................................................................................... 22
3.2.1. The typical order picking process in carousel system ........................................ 23
3.2.2. Pickup or cycle time for carousel system ........................................................... 23
3.2.3. Carousel system storage assignments ................................................................. 25
3.3. Assumptions ................................................................................................................. 25
3.3.1. The assumptions used for AS/RS ....................................................................... 25
3.3.2. The assumptions used for carousel system ......................................................... 25
3.3.3. Combined assumptions for both AS/RS and carousel systems .......................... 26
3.4. Notations ....................................................................................................................... 26
3.5. Throughput ................................................................................................................... 26
3.5.1. Throughput of AS/RS under random storage assignment .................................. 27
3.5.2. Throughput of AS/RS under class-based storage assignment ............................ 30
3.5.3. Throughput of carousel system under random storage assignment .................... 30
3.5.4. Throughput of carousel system under class-based storage assignment .............. 32
3.6. Summary ....................................................................................................................... 32
CHAPTER 4. ANALYSIS AND RESULTS .......................................................................... 34

vii
4.1. Scenario Description ..................................................................................................... 34
4.2. Case Study .................................................................................................................... 36
4.3. Validating Mathematical Model ................................................................................... 39
4.4. Simulation Model Verification and Validation ............................................................ 40
4.5. Economic Analysis ....................................................................................................... 41
4.5.1. Sensitivity analysis ............................................................................................. 43
CHAPTER 5. CONCLUSIONS AND FUTURE RESEARCH .............................................. 45
5.1. Main Results of the Thesis Research ............................................................................ 45
5.2. Contributions of the Thesis Research ........................................................................... 46
5.3. Limitations and Future Research .................................................................................. 46
REFERENCES ........................................................................................................................ 47
APPENDIX A. THE SIMULATION RESULTS ................................................................... 51
APPENDIX B. EXTREME DATA VALUES ........................................................................ 55

viii
LIST OF TABLES
Table Page
1.1. Summary of Characteristics for both AS/RS and Carousel Systems ................................. 6
2.1. Summary of Literature Review by Topics ....................................................................... 18
2.2. Summary of Literature Review by Common Focus ......................................................... 18
3.1. Evaluations for Different Arrangements of Assignments and Systems ........................... 20
3.2. Notations used for AS/RS ................................................................................................ 28
3.3. Notations used for Carousel ............................................................................................. 29
3.4. Summary of Outputs ........................................................................................................ 32
3.5. Basic Inputs and Formulae for AS/RS and Carousel System .......................................... 33
4.1. Input Parameters and Value used in the Case Study ........................................................ 36
4.2. Main Outputs of Mathematical Model ............................................................................. 37
4.3. Main Outputs of Mathematical and Simulation Model .................................................... 39
4.4. Simulation Model Verification and Validation Summary ............................................... 41
4.5. Investment Summary ........................................................................................................ 42
4.6. Annual Gross Profit Comparison ..................................................................................... 42
4.7. Payback Period Summary ................................................................................................ 42

ix
LIST OF FIGURES
Figure Page
1.1. Basic Departments in a Warehouse .................................................................................... 1
1.2. Order Picking Technologies ............................................................................................... 3
1.3. AS/RS ................................................................................................................................. 5
1.4. Carousel System ................................................................................................................. 5
3.1. Typical Order Picking Process in AS/RS ......................................................................... 21
3.2. Random and Class-Based Storage Assignment for AS/RS .............................................. 23
3.3. Typical Order Picking Process in Carousel System ......................................................... 26
3.4. Random and Class-Based Storage Assignment for Carousel System .............................. 27
4.1. SKU Flows in AS/RS and Carousel Systems ................................................................... 35
4.2. Cycle Time Resulting from Executing Mathematical Models ......................................... 38
4.3. Throughput Resulting from Executing Mathematical Models ......................................... 38
4.4. Cycle Time for Four Systems in Mathematical and Simulation Models ......................... 40
4.5. System Throughputs for Four Systems in Mathematical and Simulation Models ........... 40
4.6. Calculations for Payback Periods ..................................................................................... 43
4.7. Sensitivity Analysis of Gross Profit ................................................................................. 44
4.8. Sensitivity Analysis of Payback Period ............................................................................ 44

x
LIST OF APPENDIX TABLES
Table Page
A.1. Simulation Result for AS/RS with Random Assignment ................................................ 51
A.2. Simulation Result for AS/RS with Class-Based Assignment .......................................... 52
A.3. Simulation Result for Carousel with Random Assignment ............................................. 53
A.4. Simulation Result for Carousel with Class-Based Assignment ...................................... 54
B.1. Extreme Data Values for AS/RS with Random Assignment ........................................... 55
B.2. Extreme Data Values for AS/RS with Class-Based Assignment .................................... 56
B.3. Extreme Data Values for Carousel with Random Assignment ....................................... 57
B.4. Extreme Data Values for Carousel with Class-Based Assignment ................................. 58

1
CHAPTER 1. INTRODUCTION
1.1. Background
Warehouses can operate under different departments in the supply chain and also can
be used for different purposes. However, the main reason for having a warehouse is storage.
When there is no demand the time difference between supply and demand is solved by
storing finished products. Manufacturers can accomplish production economies without
being distracted by inadequate demand at the time of production. Customers do not have to
wait for a production cycle to get the product. Instead, they can have it shipped directly from
the warehouse. Also, a warehouse accumulates products from different manufacturers and
merges the shipment to one consumer. The customer need not receive five separate boxes if
he orders ten different products, and the manufacturer does not have to send five shipments if
products are ordered by five customers. Figure 1.1 illustrates the various departments in a
warehouse. The basic departments are Receiving, Storage, Order Picking and Shipping.
The general process used in most warehouses is as follows. When incoming products
arrive, the warehouse will acquire them and unload them at the receiving dock. Their
quantity and quality will be checked; and at the same time, labels or tags might be attached to
Figure 1.1. Basic Departments in a Warehouse

2
them to enable tracking. After recording their profiles, they will be placed in the storage area.
The product will stay there until the customer orders it. Upon receiving a customer order, the
warehouse will process it and generate a picking list that indicates the product, quantity, and
location in the warehouse. Therefore, the picker will know where to pick products.
Order picking is the process of fulfilling customer requests through picking items
from storage. According to Kong and Masel (2008) among all warehousing operations, order
picking makes up approximately 55% of the cost. This is because order picking is a labor
intensive activity for traditional manual warehouses. Therefore, order picking is a very
important activity in warehouse management, and the order picking system should be
planned wisely and controlled efficiently. If the cost of order picking is decreased, the
operation costs of the warehouse will decrease significantly. That is the reason why order
picking is a crucial topic in warehouse management, and therefore a lot of research has been
done on it.
The different order picking technologies are shown in Figure 1.2. order picking is
divided into three types: 1) manual order picking system 2) semi automated and 3) automated
order picking systems.
1) Manual order picking is a labor intensive operation in warehouse; in this type of order
picking system the pickers to parts process is involved. There are the basic forms
include picking by article (batch picking) or pick by order (discrete picking). In the
case of picking by article, multiple customer orders (the batch) are picked
simultaneously by an order picker. Many in-between forms exist, such as picking
multiple orders followed by immediate sorting (on the pick cart) by the order picker

3
Figure 1.2. Order Picking Technologies
(sort-while-pick) or the sorting takes place after the pick process has finished (pick-
and-sort). This type of order picking system is also called as low-level order picking
system.
2) The semi-automated is another order picking system which also involves the same
process (picker to parts) as manual order picking systems, in this type order pickers
travel to the pick locations on board of a lifting order-pick truck or crane. The crane
automatically stops in front of the appropriate pick location and waits for the order
picker to perform the pick. This type of system is called a high-level or a man-aboard
order-picking system.
3) The automated system follows the parts-to-picker systems, which include automated
storage and retrieval system (AS/RS), and carousel System. In this systems mostly
aisle-bound cranes that retrieve one or more unit loads (pallets or bins; in the latter
case the system is often called a mini-load) and brings them to a pick position (i.e. a
load/unload station). At this position the order picker takes the required number of

4
pieces, after which the remaining load is stored again. This type of system is also
called a unit-load or end-of-aisle order-picking system. The two main automated
order picking systems are automated storage and retrieval system (AS/RS) and
carousel system.
The automated storage and retrieval machine can work under different operating modes:
single, dual and multiple command cycles. The single-command cycle means that either a
load is moved from the load/unload station to a rack location or from a rack location to the
load/unload station. In the dual-command mode, first a load is moved from the depot to the
rack location and next another load is retrieved from the rack. In multiple command cycles,
the storage/retrieval (S/R) machines have more than one shuttle and can pick up and drop off
several loads in one cycle. For example, in a four command cycle, the S/R machine leaves
the depot with two storage loads, stores them and returns with two retrieved loads. Figure 1.3
represents the simple AS/RS system, which is currently used in warehouses.
Carousel is an automated storage and retrieval system. A carousel system is one of
two types vertical or horizontal carousel, a vertical carousel provides for closed loop
automatically controlled rotation of the basic storage unit because storage is vertical, such
systems are popular when conserving floor space. Although automatic insertion and
extraction of individual items or loads is possible, it is not as common as it is with horizontal
carousel applications. A horizontal carousel is a carousel that consists of a fixed number of
adjacent storage columns, or bays, that are mechanically linked to either an Overhead or floor
mounted drive mechanism to form a complete loop. Figure 1.4 represents the horizontal
carousel system, which is used in warehouses. Table 1.1 is a summary of comparing the
characteristics of AS/RS and carousel system.

5
Figure 1.3. AS/RS, adapted from Groover (2007)
Figure 1.4. Carousel System, adapted from Groover (2007)

6
Table 1.1. Summary of Characteristics for both AS/RS and Carousel Systems
Characteristics AS/RS Carousel system
Storage structure Rack arrangement to
provision pallets or shelf
arrangement to provision tote
bins.
Bins suspended from
overhead conveyor columns.
Motions Linear motions of S/R. Revolution of overhead
carousel conveyor columns
around oval track.
Storage/retrieval operation. S/R machine travels to
compartments in rack
structure.
Carousel revolves to bring
bins to load/unload station.
Replication of storage
Capacity
Multiple aisles, each
consisting of rack structure
and S/R machine.
Multiple carousels, each
consisting of oval track and
suspended bins.
1.2. Motivation
The main problem for further refining the automated order picking systems is because
they are becoming important part of warehouse systems, among automated order picking
systems the technologies that are being used are AS/RS and carousel and did not found
literature that compares the performance of these two systems. These are some of the factors
that motivated to conduct research on these systems.
1.3. Research Objective
More warehousing and distribution companies are adopting AS/RS and carousel
systems. There is a need to have tools that can help decision makers in evaluating the
performance of these systems. One measure of system performance is throughput, which is
the rate the systems can complete orders per unit of time. The storage policies such as
random and class-based have influence on system performance.
The main goal of this research is to develop a mathematical model for comparing the
performance of AS/RS and carousel system under two different storage assignments, namely

7
random and class-based storage assignments. The measure of performance is throughput,
which is the number of SKUs (stock keeping units) retrieved per unit of time.
The specific objective for this thesis is to develop a mathematical model that can be
used to determine and compare the performance of the systems.
1.4. Thesis Outline
This thesis is organized as follows. This Chapter has presented the background,
motivations and objective of this research. Chapter 2 reflects the literature review related to
AS/RS and carousel systems and concludes with a statement about the void in research
related to these systems.
Chapter 3 explains the development of the mathematical models that can be used for
evaluating the automated systems performance that are the focal point of this thesis.
Chapter 4 addresses the validation of the mathematical model, which is performed
using simulation model developed using Arena simulation software (Version 13.90.00000).
Chapter 4 also included economic analysis comparing investment requirements and payback
period for converting from manual to automated order picking systems.
Chapter 5 includes the conclusions derived from the study and recommendation for
future research.

8
CHAPTER 2. LITERATURE REVIEW
This section introduces the different order picking technologies and summarizes the
research and accomplishments in AS/RS and Carousel systems.
2.1. Automated Order Picking Systems
According to De Koster R et al. (2007) there are two types of order picking systems,
first is picker to parts which is also called as manual order picking systems and other is Parts
to picker systems which comprises of automated storage and retrieval systems (AS/RS) and
carousel systems. An AS/RS contains many different kinds of systems that depend on the
size and volume of items and the storage method. A mini load AS/RS and a unit-load AS/RS
are commonly discussed since they can reduce labor cost and increase space utilization.
Carousel systems are efficient automated warehousing systems and they can be categorized
into “three kinds: horizontal, vertical, and rotary racks” was given by Park et al. (2003).
A horizontal carousel is a carousel that revolves horizontally and a vertical carousel is
a carousel that revolves vertically. Rotary racks are carousels that have self-regulating
rotating racks. The benefit of carousel systems is low cost because it is cheaper than other
systems such as mini load AS/RS. Here in this thesis AS/RS and horizontal carousel system
will be considered.
2.2. AS/RS (Automated Storage and Retrieval System)
Automated storage and retrieval systems have been extensively used in distribution
and manufacture locations since their introduction in the 1950s. Roodbergen (2009) have
presented an important outline of all significant issues concerning AS/RS design and control
in both production and distribution environments and some of the literature related to AS/RS
design and control is discussed in this section. An AS/RS usually consists of racks assisted

9
by cranes running through aisles among the racks. An AS/RS is capable of holding pallets
without the interfering of an operator and the position where operator stands is known as
load/unload station where the crane picks and drops off loads. Thus the system is fully
automated. Both in manufacture and distribution environments, AS/RSs are used for storing
the items in storage and for retrieving those items from storage to accomplish an order.
According to Roodbergen (2009) in United States there was a substantial increase in usage of
AS/RS by distributions centers during 1994 to 2004, due to the fact that usage of AS/RSs has
an upper hand over manual picking systems. Some of those benefits are saving in manual
labor costs and floor space, increasing consistency and condensing error rates.
Apparent drawbacks are high investment costs of about $634,000 for a single aisle
AS/RS Zollinger (1999), less flexibility and higher investments in control systems about
$103,000, Zollinger (1999). While designing an AS/RS, many physical design and control
issues have to be addressed in the correct way to fully take advantage of all its benefits.
Kusiak (1985) describes design and operational decision problems for flexible manufacturing
systems with an emphasis on automated guided vehicles and AS/RSs. The author discusses
design, storage and batching procedures for AS/RSs. Johnson and Brandeau (1996) discuss
stochastic models for the design and control of automated guided vehicles and AS/RSs.
Manda and Palekar (1997) discuss certain papers on travel time models for AS/RSs and
storage assignments.
2.2.1. Types of AS/RS
A great number of construction choices exist for AS/RSs, but according to
Roodbergen (2009) there are three types of AS/RSs. The basic form of an AS/RS has only
one crane in each aisle, which cannot leave its aisle and which can carry only one unit-load at

10
a time. Material handling in this instance is by unit-load only; manual labor is not involved to
handle single items. The racks in the basic form are fixed and single-deep, which means that
the crane can directly access every load. This type of AS/RS is referred to as a single aisle
AS/RS. The second type of AS/RS consists of multi-shuttle cranes that are this type of crane
can carry two or more loads at same time and the cranes, which carry two loads, are called as
dual shuttle cranes. The third type of AS/RS is a special type of AS/RS, which is called as
autonomous vehicle storage and retrieval system. This type of AS/RS includes horizontal and
vertical travel. Vehicles travelling horizontally over rails through aisles and lifts are used to
transfer loads vertically.
2.2.2. Advantages of AS/RS
1. Savings in labor costs and floor space
2. Increased consistency
3. Reduced error rates
2.2.3. Disadvantages of AS/RS
1. High investments costs
2. Less flexibility
2.2.4. Travel time for AS/RS
Hausman et al. (1976) were some of the first to present travel time models for a
single-shuttle unit-load AS/RS. These authors have proposed estimates for single command
scheduling in square-in-time continuous racks. Random, full turnover, two- and three-class-
based storage assignment policies were considered and extended those results by also
considering interleaving times resulting from a first-come-first-served (FCFS) dual command
scheduling policy.

11
The authors introduce variable b as the shape factor of the rack to deal with
rectangular racks. Other authors such as Eynan and Rosenblatt (1994) since then continue the
research of Hausman et al. (1976), by studying different control policies, configurations of
AS/RS and operational characteristics. Instead of an FCFS-policy a nearest-neighbor (NN)
policy can be used to schedule requests. Recursive procedures and closed-form expressions
by Kouvelis and Papanicolaou (1995) have been proposed for n-class-based storage and full
turnover storage.
2.2.5. Storage assignment for AS/RS
Hausman et al. (1976) and Graves et al. (1977) have described few storage
assignments; among them the following five are the storage assignments, which are
commonly used. These rules are:
Dedicated storage assignment
Random storage assignment
Closest open location storage assignment
Full-turnover-based storage assignment
Class-based storage assignment
For the dedicated storage method each product type is assigned to a fixed location.
Replenishments of that product always occur at this same location. The main drawback of
dedicated storage is its high space requirements and low space utilization.
Furthermore, for each product type enough space must be kept to accommodate the
highest stock level that may take place. Most advantages of dedicated storage, such as
locating intense products at the bottom or matching the layout of stores, are related to non-
automated order-picking areas and are not as interesting for AS/RSs. For random storage all
12
empty locations have an equal chance of having an incoming load assigned to it. If the
nearby open location storage is applied, the first empty location that is encountered will be
used to store the products.
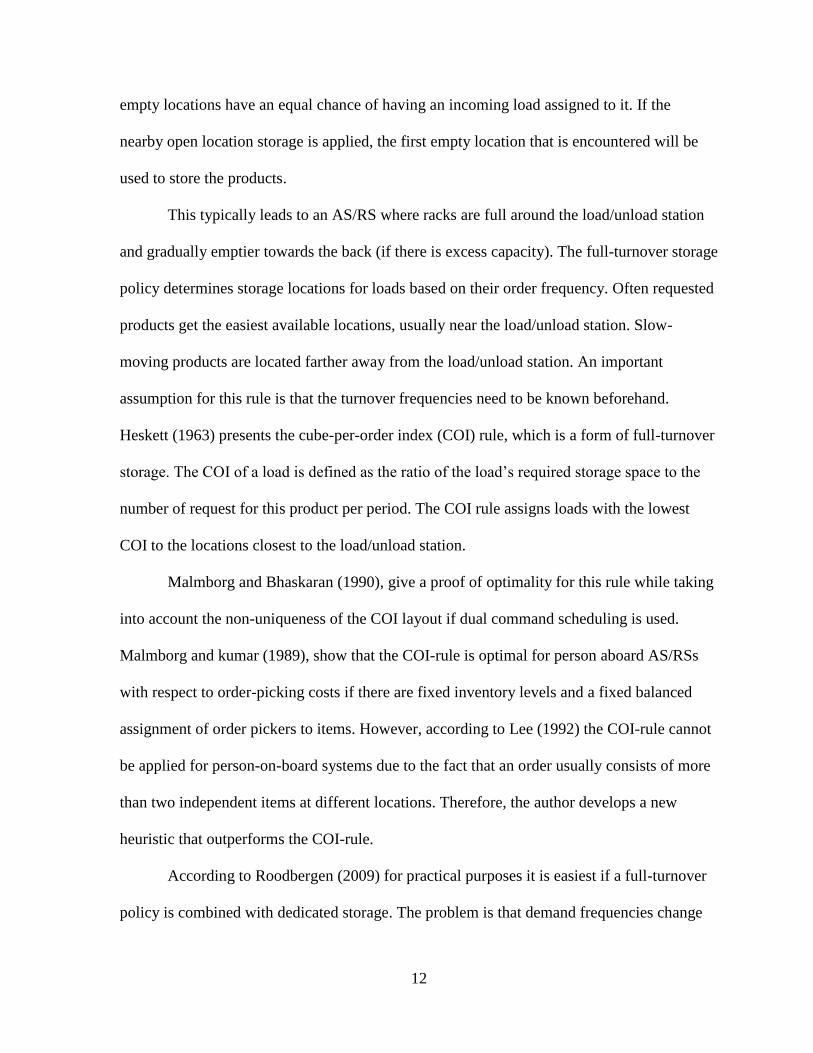
This typically leads to an AS/RS where racks are full around the load/unload station
and gradually emptier towards the back (if there is excess capacity). The full-turnover storage
policy determines storage locations for loads based on their order frequency. Often requested
products get the easiest available locations, usually near the load/unload station. Slow-
moving products are located farther away from the load/unload station. An important
assumption for this rule is that the turnover frequencies need to be known beforehand.
Heskett (1963) presents the cube-per-order index (COI) rule, which is a form of full-turnover
storage. The COI of a load is defined as the ratio of the load’s required storage space to the
number of request for this product per period. The COI rule assigns loads with the lowest
COI to the locations closest to the load/unload station.
Malmborg and Bhaskaran (1990), give a proof of optimality for this rule while taking
into account the non-uniqueness of the COI layout if dual command scheduling is used.
Malmborg and kumar (1989), show that the COI-rule is optimal for person aboard AS/RSs
with respect to order-picking costs if there are fixed inventory levels and a fixed balanced
assignment of order pickers to items. However, according to Lee (1992) the COI-rule cannot
be applied for person-on-board systems due to the fact that an order usually consists of more
than two independent items at different locations. Therefore, the author develops a new
heuristic that outperforms the COI-rule.
According to Roodbergen (2009) for practical purposes it is easiest if a full-turnover
policy is combined with dedicated storage. The problem is that demand frequencies change

13
constantly and also the product to assortment is usually far from constant. Any change in
frequency and any addition of a new product to the system may require a large amount of
repositioning of loads to bring it back in line with the full-turnover rule. To prevent excessive
repositioning, a new storage allocation is in practice typically calculated once per period. To
reduce space requirements and periodic repositioning while maintaining most of the
efficiency gains, class-based storage can be used.
2.3. Carousel System
According to Litvak and Vlasiou (2010) a carousel is an automated storage and
retrieval system, which is often used in modern warehouses. It consists of a number of
columns, which are connected together, and these columns revolve in a closed circle. These
authors also described that carousels are commonly used for storage and retrieval of small
and medium-sized items, such as health and beauty products, repair parts of boilers, parts of
vacuum cleaners and sewing machines, books, shoes and many other goods. Hassini and
Vickson (2003) stated that carousels are highly flexible, and come in a wide range of
structures, sizes, and types. They can be horizontal or vertical and rotate in either one or both
directions.
Although both unidirectional (one-way rotating) and bidirectional (two-way rotating)
carousels are encountered in practice, the bidirectional types are the most regular (as well as
being the most proficient). One of the main benefits of carousels is that, rather than having
the operator travel to an item (as is the case in a warehouse where items are stored on
shelves); the carousel rotates the items to the operator. While the carousel is travelling, the
operator has the time to perform other tasks, such as pack or label the retrieved items, or

14
serve another carousel. This carry out enhances the operational effectiveness of the
warehouse.
2.3.1. Types of carousel system
Carousel systems can be horizontal or vertical and rotate in either one or both
directions, that is unidirectional (one-way rotating) and bidirectional (two-way rotating) was
given by Hassini and Vickson (2003).
2.3.2. Advantages of carousel system
1. The picker travels to an item.
2. While the carousel is travelling, the operator has the time to perform other tasks.
3. The design has considerable versatility.
2.3.3. Disadvantages of carousel system
1. Carousel processes only small or medium type of SKUs.
2.3.4. Travel time for carousel system
All research papers mentioned so far that investigated travel time models of carousel
systems have assumed average uniform velocity of the carousel. In other words, the main
assumption is that the carousel travels with constant speed and the acceleration from the
stationary position (when a pick is performed) to its full speed, as well as the deceleration
from the maximum speed to zero speed, are neglected when estimating the travel time of the
carousel. Guenov and Raeside (1989) gave some empirical indications that the error
persuaded when neglecting acceleration and deceleration of an order picking vehicle is
indeed negligible.
Hwang et al. (2004), however, developed approaches for retrieving that take into
consideration the variation in the speed of the carousel. For unit-load automated storage and
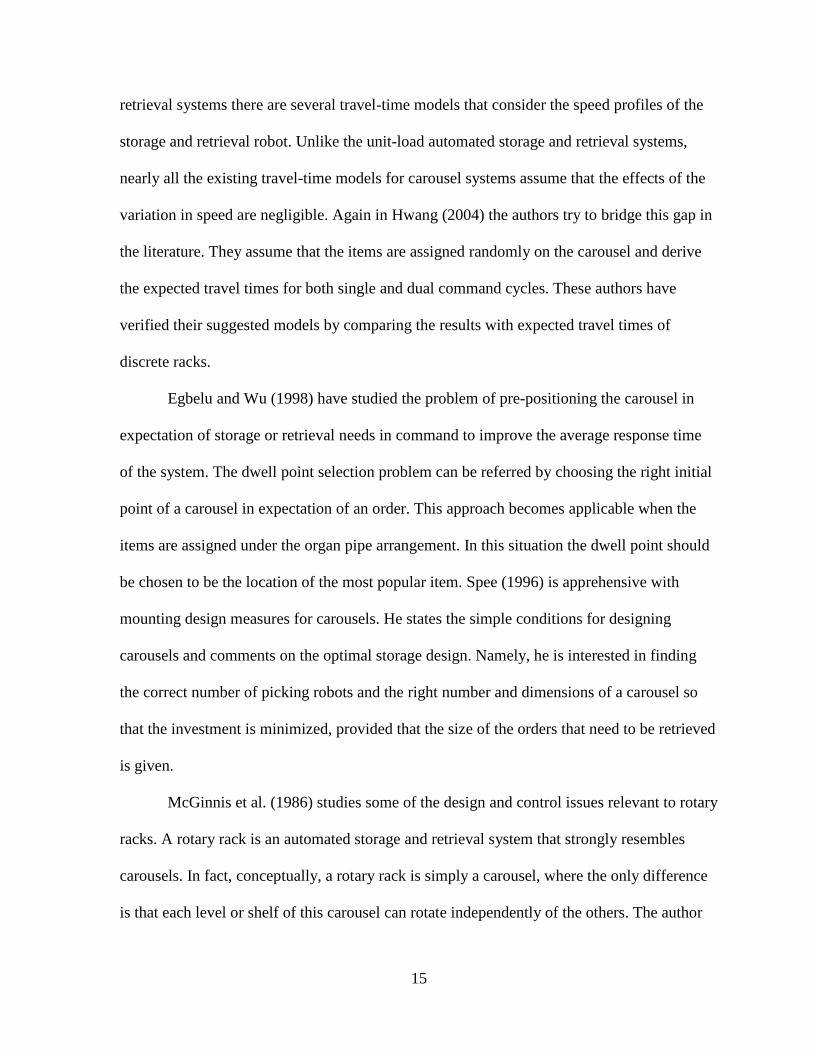
15
retrieval systems there are several travel-time models that consider the speed profiles of the
storage and retrieval robot. Unlike the unit-load automated storage and retrieval systems,
nearly all the existing travel-time models for carousel systems assume that the effects of the
variation in speed are negligible. Again in Hwang (2004) the authors try to bridge this gap in
the literature. They assume that the items are assigned randomly on the carousel and derive
the expected travel times for both single and dual command cycles. These authors have
verified their suggested models by comparing the results with expected travel times of
discrete racks.
Egbelu and Wu (1998) have studied the problem of pre-positioning the carousel in
expectation of storage or retrieval needs in command to improve the average response time
of the system. The dwell point selection problem can be referred by choosing the right initial
point of a carousel in expectation of an order. This approach becomes applicable when the
items are assigned under the organ pipe arrangement. In this situation the dwell point should
be chosen to be the location of the most popular item. Spee (1996) is apprehensive with
mounting design measures for carousels. He states the simple conditions for designing
carousels and comments on the optimal storage design. Namely, he is interested in finding
the correct number of picking robots and the right number and dimensions of a carousel so
that the investment is minimized, provided that the size of the orders that need to be retrieved
is given.
McGinnis et al. (1986) studies some of the design and control issues relevant to rotary
racks. A rotary rack is an automated storage and retrieval system that strongly resembles
carousels. In fact, conceptually, a rotary rack is simply a carousel, where the only difference
is that each level or shelf of this carousel can rotate independently of the others. The author

16
concludes that, while rotary racks appear to be a simple generalization of conventional
carousels, the control strategies that have been shown effective for carousels do not appear to
be as effective for these systems. Rotary racks can be viewed as a multiple-carousel system
(where each level is considered as a sub-carousel) with a single picker.
2.3.5. Storage assignment for carousel system
The basic storage assignments used for carousel system are:
Random storage assignment
Class-based storage assignment
Organ pipe arrangement
The performance of a carousel system depends wholly upon the way it is loaded and
the order frequency of the items placed on it. An effective storage system may decrease
drastically the travel time of the carousel. Numerous approaches have been followed in
practice to store items on a carousel. The simplest approach is to place the items randomly on
the carousel. Random storage assignment has been examined extensively by Hwang and Ha
(1991) and Litvak (2001) and various performance characteristics have been derived under
the assumption that the items are uniformly distributed on the carousel.
One way to better obtain the throughput of a carousel system is to implement a
storage policy other than the random storage assignment policy. Hwang and Ha (1994) have
studied the two class-based storage, which is a storage scheme that divides the items in two
classes based on their demand frequency. The items with a higher turnover are randomly
assigned to one continuous region of the carousel, while the less frequently asked for items
occupy the complementary region. The authors demonstrate by simulation that the two-class-

17
based storage can reduce significantly the expected cycle time, both in the single-command
cycle and in the case of dual-command cycle.
Authors Hwang and Ha (1994) also observed the effects of the two-class-based
storage policy on the throughput of the system, and present a case where there is a 16.29%
progress of this assignment over the random storage assignment. Another storage scheme is
suggested by Stern (1986). Assignments are made using a maximal adjacency principle, that
is, two items are placed closely if their probability of appearing in the same order is high.
The author evaluates this storage assignment analytically by using a Markov chain model he
develops. The organ pipe arrangement for a carousel system is introduced in Lim et al.
(1985) and is proven to be optimal in Beng (1995) under a wide variety of settings.
The organ pipe arrangement has been widely used in warehouses. In carousel
systems, the organ pipe arrangement places the item with the highest demand in an arbitrary
bin, the items with the second and third highest demands in the bin next to the first one but
from opposite sides, and sequentially all other items next to the previous ones, where the
odd-numbered items according to their frequency are grouped together and placed next to
one another in a decreasing order from the one side of the most frequent item and similarly
the even-numbered items are grouped together and placed to the other side.
2.4. Summary of Literature Review
The literature reviewed provides better understanding of automated order picking
systems. Table 2.1 summarizes the literature by topics and Table 2.2 summarizes the
literature that has the common objectives. Some of the literature reviewed included
performance measure of AS/RS or carousel systems but none of them included the
comparison of the systems performance against each other. Furthermore the literature that

18
include AS/RS and carousel performance measures used over simplistic models which did
not include parameters such as operator pick time and retrieval/storage time that impact the
systems performance. None of the literature included economic analysis of systems showing
the investment requirements and payback periods resulting from switching from manual to
AS/RS and carousel order picking systems.
Table 2.1. Summary of Literature Review by Topics
Topics Literature
Automated order picking systems De Koster et al. (2007), Park et al. (2003)
AS/RS design Zollinger (1999), Roodbergen (2009),
Johnson and Brandeau (1996), Kusiak (1985)
AS/RS travel time Hausman et al. (1976), Eynan and Rosenblatt (1994),
Kouvelis and Papanicolaou (1995)
AS/RS storage assignment Graves et al.(1977), Heskett (1963), Malmborg and
Bhaskaran (1990), Malmborg and Krishna (1989)
Carousel design Hassini et al.(2003), Litvak and Vlasiou (2010)
Carousel travel time Egbelu and Wu (1998), Guenov and Raeside (1989),
Hwang et al.(2004), Spee (1996), McGinnis et
al.(1986)
Carousel storage assignment Beng (1995), Hwang and Ha (1994), Litvak (2001),
Hwang and Ha(1991), Stern (1986), Lim et al.(1985)
Table 2.2. Summary of Literature Review by Common Focus
References Common Focus Methodology Used
Bhaba and Sobhan
(1995)
Review of travel time
models in automated
storage/retrieval systems
These aspects include improving
throughput rate, changing retrieval
sequencing rules, using order batching
algorithms, applying various dwell point
strategies and increasing the
storage/retrieval machine capacity
Hwang and Ha
(1991)
Cycle time models for
single/double carousel
system
Based on a randomized storage assignment
policy, cycle time models are developed for
single and dual commands.
Hwang and Ha
(1994)
For reducing expected
cycle time, the two-class-
based storage assignment
was used
Simulation

19
CHAPTER 3. METHODOLOGY
In this chapter, the details of the considered automated order picking systems will be
presented. The assumptions and details according to the proposal will be described. The
mathematical model for system throughput, which can be defined as the number of orders
retrieved per unit time, will be carried out for four situations respectively. Here throughput is
explained in terms of pickup time. The pickup time for AS/RS system is sum of crane travel
time for retrieving order, crane pick time to retrieve order from rack, crane travel time to
return load/unload station and operator pick time. The pickup time for carousel system is sum
of time taken by a carousel for indexing the columns holding the order to front end location,
storage/retrieval robot travel time for retrieving order, storage/retrieval robot retrieval time,
operator pick time, storage/retrieval robot travel time for returning order and storage/retrieval
robot deposit time. The storage systems associated with AS/RS and carousel systems include:
a. Random storage Assignment: In random storage the items are placed into storage in
the nearest available open location; that is, when an order received for given SKU, the
stock is retrieved from storage according to FIFO (first in first out) policy.
b. Class-based storage Assignment: class-based dedicated storage is based on Pareto
principle (80-20 Rule) that is roughly 80% of the effects come from 20% of the
causes. In a class-based storage assignment the storage system is divided into several
classes according to activity level. The classes A containing 20% of SKUs, which
make up (80%) of items ordered, class B containing 30% of SKU make up (15%) of
items ordered and class C containing 50% of SKU make up (5%) of items ordered.
Table 3.1 summarizes the evaluations for different arrangements of assignments and systems.

20
Table 3.1. Evaluations for Different Arrangements of Assignments and Systems
Storage Assignment
Systems
AS/RS Carousel
Random Assignment System Throughput
Class-based Assignment
System throughput: Operating hours/pickup or cycle time.
Pickup or cycle time: It is the sum of operator pick time, machine retrieval/deposit time and
machine travel time.
In this section the considered automated order picking systems are described in detail
and a mathematical model is developed for estimating the throughput of both systems under
different storage assignments which include random and class-based storage assignments.
3.1. AS/RS
The AS/RS that is being modeled consists of single aisle with each side containing
H× V locations (H horizontal locations and V vertical locations). There are total N numbers
of slots each containing single bin; the storage rack will contain one bin in it.
In an AS/RS a crane (mechanical storage/retrieval device) transports storage bins,
containing items, to and from a load/unload station. This system will have load/unload
located at one end of the aisle. The crane will operate in dual operating mode.
3.1.1. The typical order picking process in AS/RS
The typical order picking process in AS/RS is shown in Figure 3.1. When the first
order is (i=1) placed, the crane from load/unload station goes directly to storage location
retrieves, the first order P1 and comes back to load/unload station. When processing the
second order (i>1), the crane at load/unload station goes to storage location to return the first
order R1 and after that the crane goes for retrieving second order P2. As such in processing
the order i the crane first returns i-1 order then it retrieves the order i from storage location.

21
i=0
i =i+1
i>1
Load/Unload station
Returns the bin Ri-1 in storage
rack at (Xi-1,Yi-1) location
Retrieves the bin Pi
from storage rack at (Xi,Yi)
location
Operator picks the
SKU i from bin Pi
Start
No
Yes
Figure 3.1. Typical Order Picking Process in AS/RS
3.1.2. Pickup or cycle time for AS/RS
Pickup or cycle time is the sum of crane travel time, crane retrieve or storage time
and operator pick time. The pickup time or cycle of a crane in AS/RS under single command
cycle is shown in Equation 3.1.
Pickup time for first order is TPi= CTi+ CPi+ OPi+ RTi (3.1)
Where CTi = crane travel time for retrieving first order
CPi = crane retrieval time
RTi = crane travel time to return to load/unload
OPi = operator pick time
For first order retrieval travel time = return travel time.
In this thesis the pickup time for first order is neglected. The pickup or cycle time for
remaining orders will have a change in its formula because for remaining orders greater than
one crane need to perform one extra operation during retrieval of second order, that is it

22
needs to return first order and the formula for pickup or cycle time is shown in Equation 3.2
which shows the pickup time for remaining orders where i > 1.
(3.2)
CTi-1= crane travel time to return order i-1
DTi-1= crane depositing time
CTi = crane travel time for retrieving order i
CPi= crane retrieval time
RTi= crane travel time to return to load/unload station
OPi= operator pick time
3.1.3. AS/RS storage assignments
In Figures 3.2, the storage rack structures of AS/RS in random and class-based
storage assignments are shown. Figure 3.2 shows the side view of AS/RS storage rack
structure. The top portion of the figure shows the random assignment of SKUs to storage
locations. The bottom portion of the figure shows class-based assignment of SKUs. The SKU
locations are generated by Excel software. The yellow, green and blue colors in storage rack
represents the class A, class B and class C type SKUs.
3.2. Carousel System
The carousel system that is being modeled will have C number of columns and D
number of storage bins per column and is served by a single storage/retrieval robot, which
carries only one bin (unit load) at a time. The carousel length and height, its rotating speed,
and the vertical speed of the storage/retrieval robot are known. The load/unload station is
located at the bottom front corner of the carousel. The storage/retrieval robot can move in a
vertical direction while the carousel rotates. The carousel used here is a bidirectional.

23
Figure 3.2. Random and Class-Based Storage Assignment for AS/RS
3.2.1. The typical order picking process in carousel system
The typical order picking process in carousel system is shown in Figure 3.3. When
the first order is (i=1) placed, the carousel rack indexes the column holding bin to
load/unload station. Then (storage/retrieval) robot at load/unload station goes to carousel rack
retrieves the first order P1 to load/unload station then robot returns the first order R1 and after
that the Carousel rack indexes the column holding second order. Then robot goes retrieves
second order P2 then it returns second order R2. As such in processing the order i, carousel
rack indexes the column containing order i then robot retrieves order i from carousel and
returns the order.
3.2.2. Pickup or cycle time for carousel system
Pickup or cycle time is the sum of carousel indexing time, robot travel time, robot
retrieve or storage time, and operator pick time. The pickup time or cycle of carousel system
under single command cycle is shown in Equation 3.3.
Ii Ti i i OTi (3.3)
This is the pickup time for first order Where:

24
Ii= time taken by a carousel for indexing the column holding the order i
to pick column location
Ti = robot travel time for retrieving orders i
i = robot retrieval time
i= robot travel time in returning to load/unload station
OTi= operator picks time
In this thesis as discussed before the pickup time for first order is neglected. The
pickup or cycle time for remaining orders will have a change in its formula because for
remaining orders greater than one robot need to perform one extra operation during retrieval
of second order that is it needs to return first order and the formula for pickup or cycle time is
shown in Equation 3.4.
Ti-1 Ii Ti i i OTi (3.4)
Where:
Ti-1= robot travel time for returning order i-1
= robot deposit time
Ii= time taken by a carousel for indexing the column holding the order i
to pick column location
Ti = robot travel time for retrieving order i
i= robot retrieval time
i= robot travel time in returning to load/unload station
OTi= operator picks time

25
3.2.3. Carousel system storage assignments
In Figure 3.4 the storage rack structures of the carousel in random and class-based
storage assignments are shown. Figure 3.4 shows the structure of carousel when it is
unwrapped into a rectangle form such that the circumference of the carousel becomes the
width of a rectangle. The top portion of the figure shows the random assignment of SKUs to
storage locations. The bottom portion of the figure shows class-based assignment of SKUs.
The SKU locations are generated by Excel software. The yellow, green and blue colors in
storage rack represents the class A, class B and class C type SKUs.
3.3. Assumptions
The assumptions for AS/RS and Carousel are:
3.3.1. The assumptions used for AS/RS
1. The AS/RS will have only one crane in its aisle.
2. It is a single shuttle type.
3. It is a dual command cycle.
4. It carries only single unit load at a time.
5. The speed of the crane is constant.
6. The racks in AS/RS system are stationary and single-deep.
3.3.2. The assumptions used for carousel system
1. The carousel system is served by only one storage or retrieval robot.
2. It is a bi-directional system.
3. It carries only single unit load at a time.
4. The rotating speed of carousel and vertical speed of the robot are known.
5. The load/unload station is located at the bottom front corner of the carousel.

26
i=0
i =i+1
i>1
Load/Unload station
Returns the bin Ri-1 in storage rack at (Xi-1,Yi-1) location
Retrieves the Bin Pi from
storage rack at (Xi,Yi) location
Operator picks the
SKU i from bin i
Start
Carousel indexes the column Xi
holding bin i
Yes
No
Figure 3.3. Typical Order Picking Process in Carousel System
3.3.3. Combined assumptions for both AS/RS and carousel systems
1. Both systems have the same number of storage locations.
2. Both systems have the same number and types of SKUs.
3. Both systems are used to process the same types of orders.
3.4. Notations
The notations are used for the variables considered for analysis of throughput of
automated order picking systems. The notations used are listed in Tables 3.2 and 3.3.
3.5. Throughput
Throughput of a system can be defined as the number of orders retrieved per unit of
time.

27
Figure 3.4. Random and Class-Based Storage Assignment for Carousel System
3.5.1. Throughput of AS/RS under random storage assignment
From Equation 3.2 travel time model for AS/RS where they have given expected time
for AS/RS as:
The time taken by AS/RS crane to reach a horizontal location containing the SKU i-1
can be represented as:
(3.5)
The time taken by AS/RS crane to reach a vertical location containing the SKU i-1
can be expressed as shown in Equation 3.6:
(3.6)
Therefore to reach pick location i-1 the time taken by a crane is expressed as:
⟨ ⟩ (3.7)
Similarly the time taken by crane from pick location i-1 to i and from pick location i
to load/unload station is represented in Equations 3.8, 3.9 respectively:

28
Table 3.2. Notations used for AS/RS
Symbols Description
Sh Speed of crane in horizontal direction
Sv Speed of crane in vertical direction
Dhi-1 Horizontal distance travelled by crane from load/unload station to pick location
i-1, i = 1,2, 3------N
Dvi-1 Vertical distance travelled by crane from load/unload station to pick location i-1,
i = 1,2, 3------ N
Dhi-1 Horizontal distance travelled by crane from pick location i-1 to i, i = 1,2, 3---N
Dvi-1 Vertical distance travelled by crane from pick location i-1 to i, i = 1,2, 3------ N
Rhi Horizontal distance travelled by crane from pick location i to load/unload
station, i = 1,2, 3-- N
Rvi Vertical distance travelled by crane from pick location i to load/unload station, i
= 1,2, 3--- N
Pk Probability of th class of fast-moving SKUs in class-based storage assignment
per order,
CTi-1 Crane travel time to return SKU i-1, i = 1,2, 3------ N
DTi-1 Crane depositing time at rack which contains SKU i-1, i = 1,2, 3------ N
CTi Crane travel time to rack which contains SKU i, i = 1,2, 3------ N
CPi Crane retrieval time at rack which contains SKU i, i = 1,2, 3------ N
RTi Crane travel time to return to load/unload station, i = 1,2, 3------ N
OPi Operator pick time, i = 1,2, 3------ N
TPi The cycle time/pickup times for one SKU under random storage assignment, i =
1,2, 3-- N
The expected travel time under dual command cycle
[ ] The expected time for one SKU under random storage assignment
Ta Throughput of AS/RS under random storage assignment
pi The cycle time/pickup times for one SKU under class-based storage assignment
The expected time for one SKU under class-based storage assignment
a Throughput of AS/RS under class-based storage assignment
⟨ ⟩ (3.8)
⟨ ⟩ (3.9)
The expected cycle time for picking a unit load is given by:
E [TPi] = expected travel time to pick a unit load + machine deposit/retrieve time +
operator pick time.
According to Hausman et al. (1976) the expected travel times for both single and dual
command cycles of an AS/RS are shown in equations 3.10, 3.11.
29
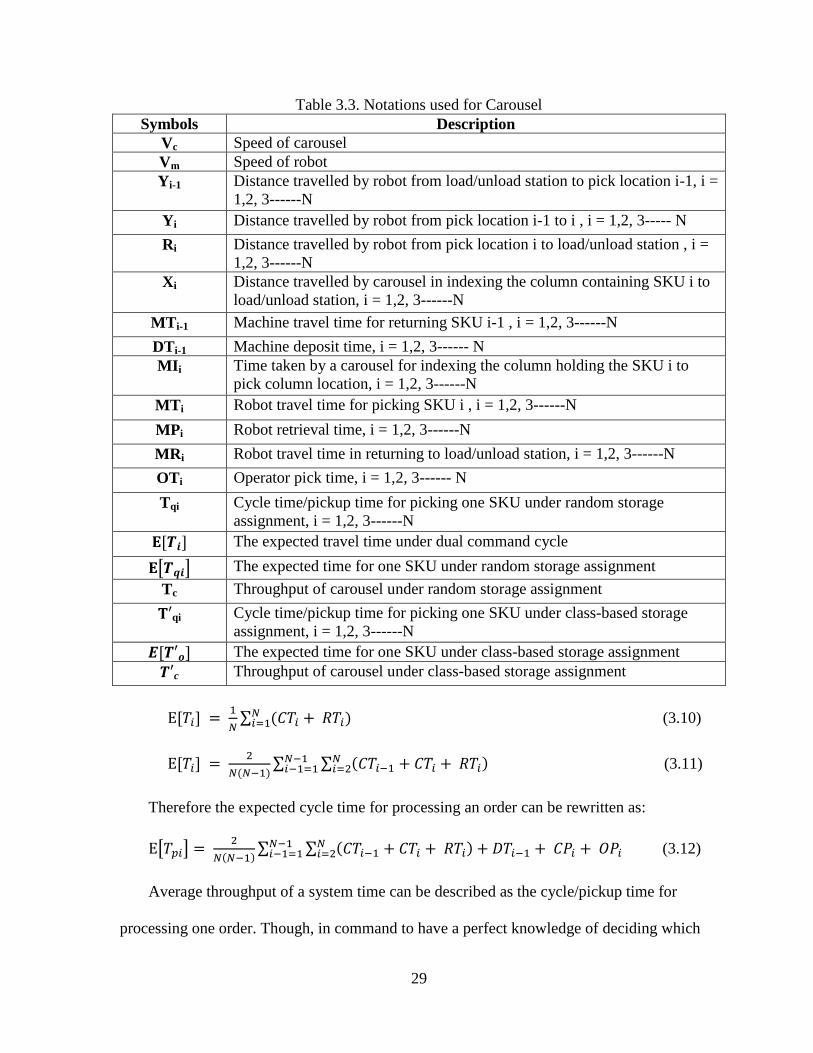
Table 3.3. Notations used for Carousel
Symbols Description
Vc Speed of carousel
Vm Speed of robot
Yi-1 Distance travelled by robot from load/unload station to pick location i-1, i =
1,2, 3------N
Yi Distance travelled by robot from pick location i-1 to i , i = 1,2, 3----- N
Ri Distance travelled by robot from pick location i to load/unload station , i =
1,2, 3------N
Xi Distance travelled by carousel in indexing the column containing SKU i to
load/unload station, i = 1,2, 3------N
MTi-1 Machine travel time for returning SKU i-1 , i = 1,2, 3------N
DTi-1 Machine deposit time, i = 1,2, 3------ N
MIi Time taken by a carousel for indexing the column holding the SKU i to
pick column location, i = 1,2, 3------N
MTi Robot travel time for picking SKU i , i = 1,2, 3------N
MPi Robot retrieval time, i = 1,2, 3------N
MRi Robot travel time in returning to load/unload station, i = 1,2, 3------N
OTi Operator pick time, i = 1,2, 3------ N
Tqi Cycle time/pickup time for picking one SKU under random storage
assignment, i = 1,2, 3------N
The expected travel time under dual command cycle
[ ] The expected time for one SKU under random storage assignment
Tc Throughput of carousel under random storage assignment
qi Cycle time/pickup time for picking one SKU under class-based storage
assignment, i = 1,2, 3------N
The expected time for one SKU under class-based storage assignment
c Throughput of carousel under class-based storage assignment
∑
(3.10)
∑ ∑
(3.11)
Therefore the expected cycle time for processing an order can be rewritten as:
[ ]
∑ ∑
(3.12)
Average throughput of a system time can be described as the cycle/pickup time for
processing one order. Though, in command to have a perfect knowledge of deciding which

30
system has the best performance, the cycle time needs to be converted into system
throughput in an hourly standard. Throughput of AS/RS for random assignment is expressed
as shown in Equation 3.13.
(3.13)
3.5.2. Throughput of AS/RS under class-based storage assignment
As the percentage of every class in one order has been taken into consideration
because of class-based storage assignment, the SKUs allocation is optimized to save travel
time, which can be seen in Figure 3.3. Three classes of SKUs in one order are considered for
different percentages, the new total picking time can be expressed as:
∑ [ ] (3.14)
Where
[ ]
∑ ∑
(3.15)
The throughput for AS/RS under class-based storage assignment is given in Equation
3.16:
(3.16)
3.5.3. Throughput of carousel system under random storage assignment
According to Hark Hwang and Jae-Won Ha (1991) there are two aspects of the
Carousel system, which differ from, typical unit-load AS/RS. One is that while
pickup/discharge operations are being performed at the load/unload station by a
storage/retrieval robot; the carousel may rotate at the same time. The effect is to make
storage locations closer to the load/unload station than they are in a comparable unit-load

31
AS/RS. The other aspect is that the position of each rack opening relative to the load/unload
station may change from cycle to cycle. Thus the model of unit-load AS/RS cannot be
directly applied to the carousel system. The expected cycle time for carousel system is from
Equation 3.4.
In Equation 3.17 the times taken for machine from load/unload station to pick
location i-1 is shown:
(3.17)
Similarly the time taken for machine to travel from pick location i-1 to i and pick
location i to load/unload station are given in Equations 3.18, 3.19 respectively:
(3.18)
(3.19)
The Equation 3.20 shows the carousel indexing time:
) (3.20)
According to Hwang et al.(2004) the expected travel time for carousel is:
∑ ∑
(3.21)
Expected cycle/pickup time for one SKU:
[ ]
∑ ∑
(3.22)
Throughput of carousel for random assignment is expressed as shown in Equation
3.23
(3.23)
32
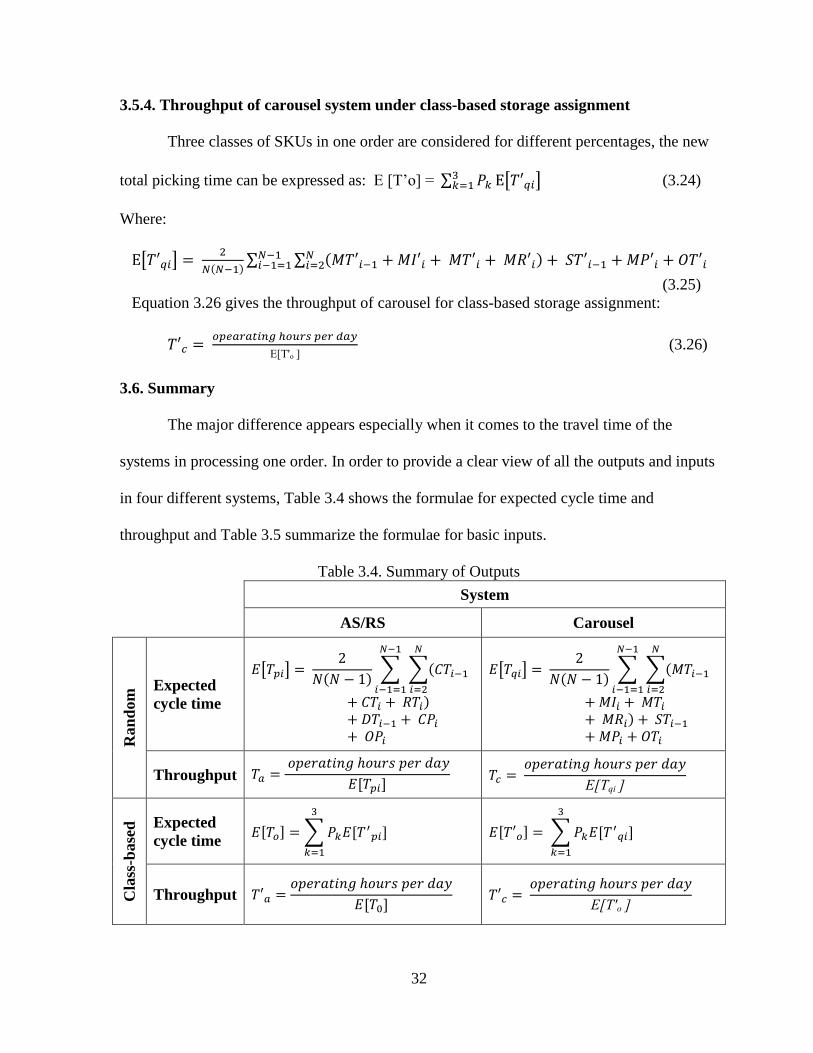
3.5.4. Throughput of carousel system under class-based storage assignment
Three classes of SKUs in one order are considered for different percentages, the new
total picking time can be expressed as: T’o ∑ [ ] (3.24)
Where:
[ ]
∑ ∑
(3.25)
Equation 3.26 gives the throughput of carousel for class-based storage assignment:
T o (3.26)
3.6. Summary
The major difference appears especially when it comes to the travel time of the
systems in processing one order. In order to provide a clear view of all the outputs and inputs
in four different systems, Table 3.4 shows the formulae for expected cycle time and
throughput and Table 3.5 summarize the formulae for basic inputs.
Table 3.4. Summary of Outputs
System
AS/RS Carousel
Ran
dom
Expected
cycle time
[ ]
∑ ∑
[ ]
∑ ∑
Throughput
Cla
ss-b
ase
d Expected
cycle time ∑
∑
Throughput

33
Table 3.5. Basic Inputs and Formulae for AS/RS and Carousel System
System Inputs
AS
/RS
⟨ ⟩
Crane travel time from load/unload to
the previous SKU storage location
⟨ ⟩ Crane travel time from load/unload to
the SKU current storage location
Crane travel time from SKU current
storage location to load/unload
Time taken by crane in horizontal
direction to reach previous SKU
storage location
Time taken by crane in vertical
direction to reach previous SKU
storage location
= Constant value Crane deposit time value at previous
SKU storage location
= Constant value Crane retrieval time value at current
SKU storage location
= Constant value Operator pick time value
Ca
rou
sel
Robot travel time from load/unload to
the previous SKU storage location
)
Carousel indexing time for current
SKU
Robot travel time from SKU current
storage location to load/unload
= Constant value Robot deposit time value at previous
SKU storage location
= Constant value Robot retrieval time value at current
SKU storage location
= Constant value Operator pick time value

34
CHAPTER 4. ANALYSIS AND RESULTS
This chapter includes three sections. The first presents the mathematical models to
compare performance of AS/RS and carousel. Excel (Version 14.0.6029.1000) is used to
perform the mathematical operations. In the second section similar comparisons are done
between these two systems by using simulation software. At last, an economic analysis is
presented to evaluate the cost effective and the sensitivity analysis is conducted to test the
relation between the gross profit per order and payback period.
4.1. Scenario Description
Figure 4.1 shows the SKU flows in both systems. In the AS/RS, at the beginning of
retrieval operation, if it is a first order in sequence then the crane goes to storage rack
location where the first SKU is stored from there it retrieves SKU and returns it back to
load/unload. If it is a second order then the crane first returns the first SKU at its location
and from there it moves to the other location in storage rack where it retrieves the second
SKU and comes back to load/unload station.
In this thesis the SKU locations are selected from a data table and this table is
generated for identifying coordinates of SKU, where X represents the row and Y
represents the column of storage rack. Suppose there is an order for two SKU’s which are
at and positions in a storage rack. In this case the crane performs a
single command operation while retrieving the first SKU from and while
retrieving the second SKU, the crane first returns the SKU1 at then retrieves
the second SKU at ; that is, the crane is operated in dual command cycle.
The differences between AS/RS and carousel system could be seen as: 1) the
storage rack in carousel is not stationary as in AS/RS. So the carousel indexes the column.

35
i=0
i =i+1
i>1
Load/
Unload
station
Returns the bin
Ri-1 in storage
rack at
(Xi-1,Yi-1)
location
Retrieves the
bin Pi from
storage rack
at (Xi,Yi)
location
Operator
picks the
SKU i
from bin
Pi
Start
No
Yes
i=0
i
=i+1
i>1
Load/
Unload
station
Returns the bin
Ri-1 in storage
rack at
(Xi-1,Yi-1)
location
Retrieves
the bin Pi
from
storage
rack at
(Xi,Yi)
location
Operator
picks the
SKU i
from bin i
Start
Carousel
indexes
the
column Xi
holding
bin i
Yes
No
AS/RS Carousel
Figure 4.1. SKU Flows in AS/RS and Carousel Systems
which holds the required SKU to front end location. From there the vertical
storage/retrieval robot picks the SKU. In this process when order is placed, if it is a first
order in sequence then carousel indexes the column holding the first SKU to front end
location then the SKU is retrieved by storage/retrieval robot. If it is a second order in
sequence storage/retrieval robot returns first SKU, then carousel indexes column holding
the second SKU to front end location and again the storage/retrieval robot retrieves SKU
from that position and comes back to load/unload.
The same procedure of AS/RS for selecting SKU location is followed here; that is,
the SKU locations are selected from a data table and this table is generated for identifying
coordinates of SKU, where X represents the row and Y represents the column of
storage rack. Suppose there is an order for two SKU’s which are at and
positions in a storage then the carousel performs a single command operation while

36
retrieving the first SKU from and while retrieving the second SKU robot first
returns the SKU1 at carousel indexes the column holding second
SKU and is retrieved by robot that is operated in dual command cycle.
4.2. Case Study
Table 4.1 provides a summary of the input parameters that are used as inputs to
both mathematical and simulation models. All the values are based on practical situations,
which can be referenced from AFT–system specifications (2012), Schaefer carousel system
(2011), Hwang and song (2004).
Table 4.1. Input Parameters and Value used in the Case Study
System
AS/RS Carousel
Inp
uts
Height H = 25ft[1]
H= 25ft
Overall Length W=100ft[1]
W=100ft
Speed of crane in horizontal direction Sh = 180ft/min[1]
N/A
Speed of crane in vertical direction Sv =90ft/min[1]
N/A
Speed of carousel N/A Vc=90ft/min [2]
Speed of robot N/A Vm=160ft/min [3]
Number of storage racks 1500[2]
1500[2]
Number of rows 25 N/A
Number of columns 30 60
Number of bins in each column N/A 25
Probability of th level of fast-moving
SKUs in level loading per order
=0.8 =0.15
=0.05
=0.8 =0.15
=0.05
Crane deposit/retrieval time 4 sec N/A
Robot deposit/retrieval time N/A 4 sec
Operators pick time 6 sec 6 sec
[1] data is adapted from AFT - system specifications (2012). [2] data is adapted from
Schaefer Carousel system (2011). [3] data is adapted from Hwang and Song (2004).

37
The sequence of calculation will be followed, as the expected number of SKUs
needs to be picked. Also, the average system throughput time includes travel time, machine
retrieval or storage time and operator picking time taken for average number of SKU’s.
The main outputs of the systems can be seen in Table 4.2. All the calculations are
contributing to the final system throughput. Comparisons between each output also can be
seen in Figures 4.2, 4.3 and can obtain the conclusion that carousel system with the class-
based assignment method has the best system performance in finishing an order in about
29.81 seconds and the best throughput with capacity of processing almost 120.75 orders
per hour, this as expected is the most throughput.
The average system throughput can be also explained as the cycle time to process
one order. In the AS/RS system, the difference between random assignment and class-
based is about 24 seconds in this case study. However, when considering carousel, the
processing time difference between random assignment and class-based is about 16
seconds. The processing time for carousel in class-based assignment is much less than the
remaining systems. In class-based assignment, by choosing AS/RS, the cycle time will be
improved by approximately 62.37% compared to random assignment, as well as in
carousel; the cycle time will be improved by approximately 55.21% compared to random
assignment.
Table 4.2. Main Outputs of Mathematical Model
Systems
Performance
AS/RS Carousel
Random Class-based Random Class-based
Expected cycle time (sec) 61.93 38.14 45.56 29.81
Throughput (orders/hour) 58.12 94.37 79 120.75

38
The reason for the difference in cycle time in random and class-based systems can
be explained by the assigning of fast moving SKU’s near to load/unload station. As a
result, by adapting this method, the total picking time in class-based assignment is shown
to be comparatively less than the same order components in random assignment. Since the
orders are being handled instantaneously, the average cycle time needs to be presented in
order to measure the system throughput in one system.
Figure 4.2. Cycle Time Resulting from Executing Mathematical Models
Figure 4.3. Throughput Resulting from Executing Mathematical Models
61.93
38.14
45.56
29.81
0
10
20
30
40
50
60
70
Random Class
based
Random Class
based
AS/RS AS/RS Carousel Carousel
Exp
ecte
d c
ycl
e ti
me
in s
econ
ds
Expected
cycle time
58.12
94.37
79
120.75
0
20
40
60
80
100
120
140
Random Class
based
Random Class
based
AS/RS AS/RS Carousel Carousel
Th
rou
gh
pu
t(n
um
ber
of
ord
ers
per
hou
r)
Throughput

39
There will be nearly 120.75 orders to be fulfilled in carousel with class-based in one
operating hour without external limits considered. In addition, the outputs demonstrate that
the storage policy serves an important function in increasing the system throughput.
4.3. Validating Mathematical Model
As stated at beginning of this chapter, that Excel software is used to perform the
mathematical operations. In this section simulation models were developed to validate
mathematical models. Simulation models were generated by using Arena simulation
software according to parameters of mathematical models. The results generated by the
simulation models to estimate cycle times for AS/RS and carousel systems with different
storage assignments are shown in Appendix A, Table A.1- A.4.
Table 4.3 compares the mathematical and simulation models outputs. This table is
also shown in graphic form in Figure 4.4 and 4.5, each respectively showing the cycle
times and throughput for the systems. According to these figures carousel system with
class-based assignment has the shortest cycle time and largest throughput among the
systems.
Table 4.3. Main Outputs of Mathematical and Simulation Model

40
Figure 4.4. Cycle Time for Four Systems in Mathematical and Simulation Models
Figure 4.5. System Throughputs for Four Systems in Mathematical and Simulation Models
4.4. Simulation Model Verification and Validation
In order to determine if the simulation model is correctly representing the
conceptual model, there are several ways to verify and validate a simulation model, such as
find the Real outcomes for the model or calculate the extreme examples to test the
simulation model Song (2010). For the purpose of verifying the simulation model,
calculation was done using sample data, which represent the extreme situation. The
extreme data included inter arrival time and order processing times. Table 4.4 shows the
results of simulation model using extreme data. The extreme data values are shown in
Appendix B, Tables B1-B4.
0
10
20
30
40
50
60
70
Random Class
based
Random Class
based
AS/RS Carousel
Exp
ecte
d c
ycl
e ti
me
in
seco
nd
s
Mathematical Model
Expected cycle time
(sec)
Simulation model
Expected cycle time
(sec)
0
20
40
60
80
100
120
140
Random Class
based
Random Class
based
AS/RS Carousel
Th
rou
gh
pu
t(n
um
ber
of
ord
ers
per
hou
r
Mathematical Model
Throughput (in hours)
Simulation model
Throughput (in hours)
41
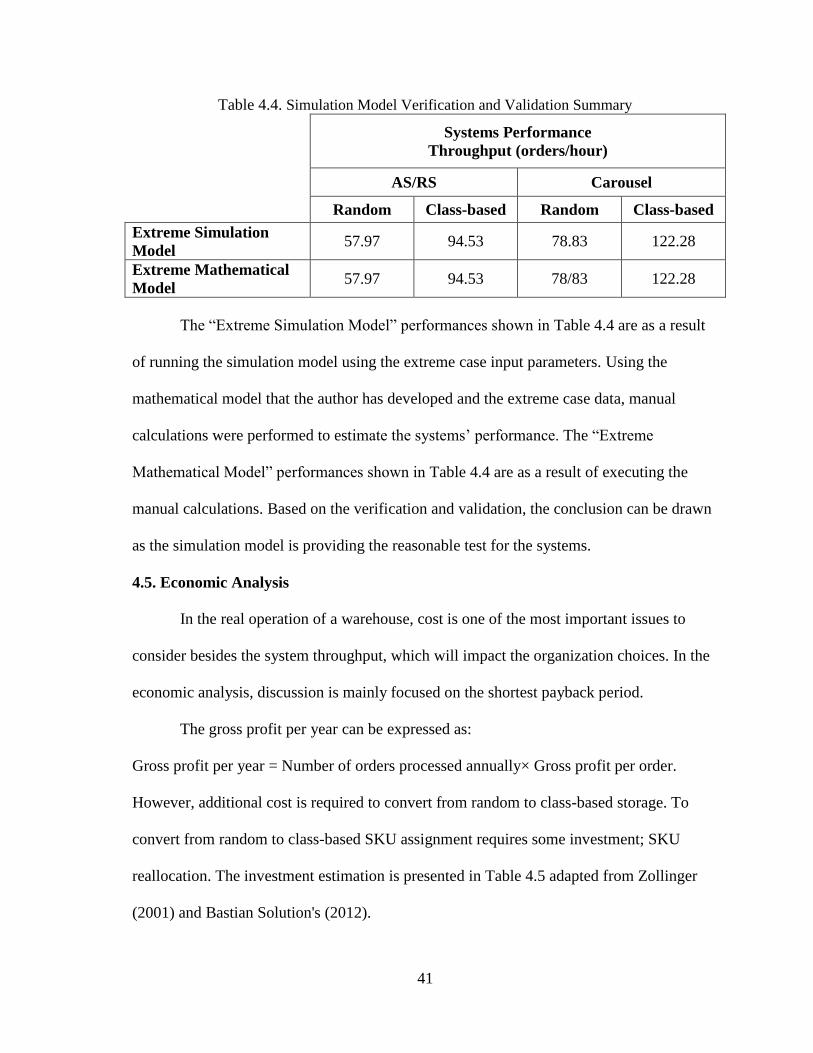
Table 4.4. Simulation Model Verification and Validation Summary
Systems Performance
Throughput (orders/hour)
AS/RS Carousel
Random Class-based Random Class-based
Extreme Simulation
Model 57.97 94.53 78.83 122.28
Extreme Mathematical
Model 57.97 94.53 78/83 122.28
The “ xtreme Simulation odel” performances shown in Table 4.4 are as a result
of running the simulation model using the extreme case input parameters. Using the
mathematical model that the author has developed and the extreme case data, manual
calculations were performed to estimate the systems’ performance. The “ xtreme
athematical odel” performances shown in Table 4.4 are as a result of executing the
manual calculations. Based on the verification and validation, the conclusion can be drawn
as the simulation model is providing the reasonable test for the systems.
4.5. Economic Analysis
In the real operation of a warehouse, cost is one of the most important issues to
consider besides the system throughput, which will impact the organization choices. In the
economic analysis, discussion is mainly focused on the shortest payback period.
The gross profit per year can be expressed as:
Gross profit per year = Number of orders processed annually× Gross profit per order.
However, additional cost is required to convert from random to class-based storage. To
convert from random to class-based SKU assignment requires some investment; SKU
reallocation. The investment estimation is presented in Table 4.5 adapted from Zollinger
(2001) and Bastian Solution's (2012).

42
Table 4.6 presents the annual gross profit for the four situations of systems
respectively by operating 255 days, 8 hours per day, $6 profit per each SKU in order to
calculate the annual gross profit among the systems.
The simple payback period for each kind of investment is shown in Table 4.7.
Payback period is the time required for recovering investment required for alternative
systems and can be expressed as: Payback Period =
Calculations for payback periods in Table 4.7 are shown in Figure 4.6. According to Table
4.7 changing from manual to AS/RS with random SKU assignment have the longest
payback period.
Table 4.5. Investment Summary
AS/RS Carousel
System Cost (one time cost) $435,500[1]
$724,921[2]
SKU Reallocation (recurring cost) $47,360 $47,360
[1] Adapted from Zollinger (2001) [2] adapted from Bastian Solution's (2012)
Table 4.6. Annual Gross Profit Comparison
AS/RS Carousel
Output Manual Random Class-based Random Class-based
Throughput (orders/hour)
40 [2]
58.12 [1]
79 [1]
79 [1]
120.75 [1]
Throughput [3]
(orders/year) 81,600 118,564.8 192,514.8 161,160 246,330
Gross profit per year $489,600 $711,388.8 $1,155,089 $966,960 $1,477,980
[1] output of mathematical models
[2] adapted from literature
[3] based on 8 hours / day and 255 days/year
Gross Profit on the basis of $6 profit per SKU
Table 4.7. Payback Period Summary
System Conversion Payback Period in Years
(a) Manual to AS/RS Random 1.96
(b) Manual to AS/RS Class-based 0.70
(c) Manual to Carousel Random 1.51
(d) Manual to Carousel Class-based 0.77

43
Figure 4.6. Calculations for Payback Periods
Conversions from manual order picking to carousel system with random SKU
assignment (random) is about one and half year and conversions from manual order
picking to carousel system with class-based is about nine months. The shortest payback
period belongs to the conversion from manual to AS/RS with class-based. It can be
concluded that the investment in SKU reallocation, which is required for switching to
class-based assignment, helps to improve the automated systems throughput, gross profit,
and payback periods.
4.5.1. Sensitivity analysis
In this section, the sensitivity analysis will be presented for the effect of gross profit
per order to simple payback period. Figure 4.7 shows the sensitivity analysis of gross profit
ranging from $4 to $ 12. The ranking of gross profit, from least to most, are manual order
picking, AS/RS (random), AS/RS (class-based), carousel (random), carousel (class-based).
Since the time scale for conversion from manual to automated order picking system
that is manual order picking to AS/RS (random), manual order picking to AS/RS (class-
based), manual order picking to carousel (random), manual order picking to carousel
(class-based) is shown in the small scales in Figure 4.8 and it shows the sensitivity analysis
of payback period that by only AS/RS will take the longest payback period.

44
Figure 4.7. Sensitivity Analysis of Gross Profit
Figure 4.8. Sensitivity Analysis of Payback Period
Furthermore, the change from manual to AS/RS (class-based) has the shortest
payback period, which indicates the system and storage policy implementation has better
system performance. As profit per SKU increases payback period will decrease for all
systems. The more profit earned per order, the less payback period will cost. In both figures
AS/RS and carousel with random assignment both are represented by + R and AS/RS and
carousel with class-based assignment is represented by + CB.
0
0.5
1
1.5
2
2.5
3
3.5
4 5 6 7 8 9 10 11 12
Gro
ss P
rofi
t in
Mil
lion
Doll
ars
Profit per SKU
Manual
AS/RS + R
Carousel + R
AS/RS + CB
Carousel + CB
0
0.5
1
1.5
2
2.5
3
3.5
4 5 6 7 8 9 10 11 12
Pay
bac
k P
erio
d i
n Y
ears
Profit per SKU in dollars
Manual to
AS/RS + R
Manual to
AS/RS + CB
45
CHAPTER 5. CONCLUSIONS AND FUTURE RESEARCH
In this conclusion chapter, the main results of this thesis research will be
summarized. A section illustrating the major contributions of this thesis research to
academic warehouse management research follows the summary of main results. Also,
during the progress of obtaining the results, several opportunities for future research will be
presented in the last section.
5.1. Main Results of the Thesis Research
Mathematical models were developed that can help with evaluating the
performance of AS/RS and carousel automated order picking systems under random and
class-based storage assignments.
Simulation models were developed and used to verify the validity of mathematical
models. The output of mathematical and simulation models measuring systems’
performance were consistent. Mathematical and simulation models showed that compared
to other systems under study, carousel system with class-based assignment has the shortest
cycle time and the highest throughput. In contrast, AS/RS with random storage assignment
had the longest cycle time and the smallest throughput.
Economic analysis was performed to compare investment requirements and
payback periods for converting from manual to AS/RS and carousel systems. Based on the
profit margin, required SKUs, and the order volume data used for this thesis, the economic
analysis showed that converting from manual order picking to AS/RS with class-based
assignment has the shortest payback period.

46
5.2. Contributions of the Thesis Research
This thesis evaluates the performance of two systems, AS/RS and carousel system
with two different SKU assignments, random assignment and class-based assignment.
From the view of both academia and practice, this thesis study makes the following
contributions.
First, the models developed in previous studies were over simplistic and did not
include parameters such as operator pick time and retrieval/storage time that impact the
systems performance. In this thesis both operator pick time and retrieval/storage time were
considered.
Second, this thesis compares the performance of AS/RS and carousel systems. The
literature reviewed included measuring performance of AS/RS or carousel, but not
comparing the performance of the two systems against each other.
Finally, none of the previous studies included economic analysis of these systems.
This thesis included the economic analysis, which compared the investment requirements
for converting from a manual to automated order picking system and the payback periods.
5.3. Limitations and Future Research
In this thesis the systems’ performance was measured based on the assumption that
each order is made of one SKU. Future researches can include studying the impacts of
having more than one SKU per order and the requirement that an entire order is processed
before processing the next order.
Future research can also include having multiple shuttles and aisles in an AS/RS
and multiple carousels as opposed to single shuttle and single carousel, which was the
focus of this thesis.

47
REFERENCES
Schaefer Carousel System. (2011, july 20). Retrieved from SSI Schaefer: http://www.ssi-
schaefer.us/automated_systems_SCS.php
BITO Storage Systems. (2012, April 21). Retrieved from Order picking some basics:
http://www.bito.com.tr/www_root/documents/LB2_GB_Theorie.pdf
AFT – SYSTEM SPECIFICATIONS. (2012, January 26). Retrieved from AFT, Inc. :
http://www.asrs.net/asrs_specifications.php
Bastian Solution's. (2012, March Monday). Retrieved from Horizontal Carousels for Order
Picking & Putting Systems:
http://www.bastiansolutions.com/automation/industrial-
carousels/horizontal_carousels.asp
Beng u, G. (1995). An optimal storage assignment for automated rotating carousels. IIE
transactions, 105{107.
Bhaba R. Sarker, P. B. (1995). Travel time models in automated storage/retrieval systems:
A criticalreview. International Journal of Production Economics, 173–184.
Dan, S. (2010). Adaptive production planning and scheduling for the make-to-order DNA
manufacturing system. North Dakota State University.
De Koster R, L. D. (2007). Design and control of warehouse order picking. European
Journal of Operational Research, 481-501.
Egbelu, P. J. (1998). Relative positioning of a load extractor for a storage Relative
positioning of a load extractor for a storage. IIE Transactions, 301-317.
Eynan A, R. M. (1994). Establishing zones in single—command class—based rectangular
AS/RS. IIE Transactions, 38—46.

48
Graves, S. H. (1977). Storage-retrieval interleaving in automatic warehousing systems.
Management Science, 935–945.
Groover, M. P. (2007). Automation, Production Systems, and Computer-Integrated
Manufacturing. Prentice Hall.
Guenov, M. a. (1989). Real time optimisation of man on board order picking. 10th
International Conference on Automation in Warehousing (pp. 87-93). Dallas:
IFS(Publications).
Hassini, E. a. (2003). A two-carousel storage location problem. Computers & Operations
Research, 527-539.
Hausman WH, S. L. (1976). Optimal storage assignment in automatic warehousing
systems. Management Science, 629—638.
Heskett, J. (1963). Cube-per-order index – a key to warehouse stock. Transportation and
Distribution Management, 27–31.
Hwang, H. a. (1991). Cycle time models for single/double carousel system. International
Journal of Production Economics, 129-140.
Hwang, H. a.-W. (1994). An optimal boundary for two class-based storage assignment
policy in carousel system. Computers & Industrial Engineering, 87{90.
Hwang, H. S. (2004). The impacts of acceleration/deceleration on travel time models for
carousel systems. Computers & Industrial Engineering, 253{265.
Johnson ME, B. M. (1996). Stochastic modeling for automated material handling system
design and. Transportation Science, 330—350.
Kouvelis, P. P. (1995). Expected travel time and optimal. International Journal of
Production Research, 2889–2905.

49
Kusiak. (1985). Material handling in flexible manufacturing systems. Material Flow, 79—
95.
Lee, M. (1992). A storage assignment policy in a man-on-boardautomated storage/retrieval
system. International Journal of Production Research, 2281–2292.
Lim, W. K. (1985). Storage schemes for carousel conveyors under real time control.
Georgia Institute of Technology.
Litvak, N. (. (2001). Eindhoven University of Technology Eindhoven. Retrieved from
http://alexandria.tue.nl/extra2/200210141.pdf.
Malmborg, C. B. (1990). A revised proof of optimality for the cube-per-order index rule for
stored item location. Applied Mathematical Modelling, 87–95.
Malmborg, C. K. (1989). Optimal storage assignment policies for multiaddress
warehousing systems. IEEE Transactions on Systems, Man and Cybernetics, 197–
204.
Manda, P. (1997). Recent advances in the design and analysis of material handling
systems. Journal of Manufacturing Science and Engineering, 841—848.
Masel, C. K. (2008). Methods for Design and Management of a Fast-Pick Area in a.
Industrial Engineering Research Conference (pp. 1367-1372). Athens: Department
of Industrial and Systems Engineering.
McGinnis, L. F. (1986). Analysis of rotary rack operations. The 7th International
Conference on Automation in Warehousing (pp. 165-171). San Francisco: Springer.
N. Litvak, M. V. (2010). A Survey on Performance Analysis of Warehouse Carousel
Systems. Statistica Neerlandica, 401–447.
50
Park BC, F. R. (2003). Dual command travel times and miniload system throughput. IIE
Transactions, 343—355.
Roodbergen, K. a. (2009). A survey of literature on automated. European Journal of
Operational Research, 343-362.
Spee, D. (1996). Automatic order picking system with horizontal racks. Material Handling
Research (pp. 545-550). Material Handling Research: The Material Handling
Institute.
Stern, H. I. (1986). Parts location and optimal picking rules for a carousel conveyor
automatic storage and retrieval system. International Conference on Automation in
Warehousing (pp. 185-193). San Francisco: Springer.
Zollinger. (1999). Automated Storage Retrieval Systems Production Section of the Material
Handling. Retrieved from AS/RS application, benefits and justification in
comparison to other storage methods: a:
http://www.mhia.org/PSC/pdf/AS/RSwhitepaper.pdf.
Zollinger, H. (2001). AS/RS APPLICATION, BENEFITS AND JUSTIFICATION.
Retrieved from Material Handling Multimedia Bank:
https://www.cirrelt.ca/mhmultimediabank/ApplicationGuide%5CMHIA%20-
%20ASRS%20application.pdf

51
APPENDIX A. THE SIMULATION RESULTS
Table A.1. Simulation Result for AS/RS with Random Assignment
Cycle time Throughput per hour Throughput per day
1 67.13287 53.625 429
2 64 56.25 450
3 62.33766 57.75 462
4 64.28571 56 448
5 62.7451 57.375 459
6 63.71681 56.5 452
7 66.82135 53.875 431
8 67.28972 53.5 428
8 63.01969 57.125 457
10 63.57616 56.625 453
11 62.47289 57.625 461
12 65.45455 55 440
13 64 56.25 450
14 62.6087 57.5 460
15 64.28571 56 448
16 65.60364 54.875 439
17 67.28972 53.5 428
18 64.57399 55.75 446
19 67.92453 53 424
20 63.57616 56.625 453
21 63.71681 56.5 452
22 67.60563 53.25 426
23 64.57399 55.75 446
24 70.58824 51 408
25 62.7451 57.375 459
26 66.66667 54 432
27 66.05505 54.5 436
28 63.2967 56.875 455
29 65.15837 55.25 442
30 64.42953 55.875 447
Average 64.91837 55.50417 444.0333

52
Table A.2. Simulation Result for AS/RS with Class-Based Assignment
Cycle time (sec) Throughput per hour Throughput per day
1 38.45127 93.625 749
2 37.64706 95.625 765
3 37.74574 95.375 763
4 35.25092 102.125 817
5 40.16736 89.625 717
6 35.12195 102.5 820
7 39.34426 91.5 732
8 38.6059 93.25 746
9 36.04506 99.875 799
10 38.50267 93.5 748
11 39.72414 90.625 725
12 36.36364 99 792
13 38.4 93.75 750
14 38.1457 94.375 755
15 37.84494 95.125 761
16 36.82864 97.75 782
17 37.06564 97.125 777
18 38.29787 94 752
19 38.97158 92.375 739
20 37.99472 94.75 758
21 39.39808 91.375 731
22 40.7932 88.25 706
23 41.14286 87.5 700
24 40 90 720
25 35.64356 101 808
26 37.1134 97 776
27 38.97158 92.375 739
28 38.4 93.75 750
29 35.73201 100.75 806
30 38.34887 93.875 751
Average 38.06875 94.725 757.8

53
Table A.3. Simulation Result for Carousel with Random Assignment
Cycle time (sec) Throughput per hour Throughput per day
1 46.08 78.125 625
2 44.44444444 81 648
3 44.65116279 80.625 645
4 43.37349398 83 664
5 42.228739 85.25 682
6 42.04379562 85.625 685
7 47.76119403 75.375 603
8 46.82926829 76.875 615
9 42.66666667 84.375 675
10 44.85981308 80.25 642
11 47.36842105 76 608
12 42.98507463 83.75 670
13 44.30769231 81.25 650
14 45.64183835 78.875 631
15 45.42586751 79.25 634
16 45 80 640
17 46.67747164 77.125 617
18 44.72049689 80.5 644
19 47.92013311 75.125 601
20 45.14106583 79.75 638
21 45.28301887 79.5 636
22 46.82926829 76.875 615
23 47.44645799 75.875 607
24 52.17391304 69 552
25 42.2907489 85.125 681
26 48.73096447 73.875 591
27 45.21193093 79.625 637
28 44.72049689 80.5 644
29 46.4516129 77.5 620
30 45.64183835 78.875 631
Average 45.49689633 79.29583333 634.3667
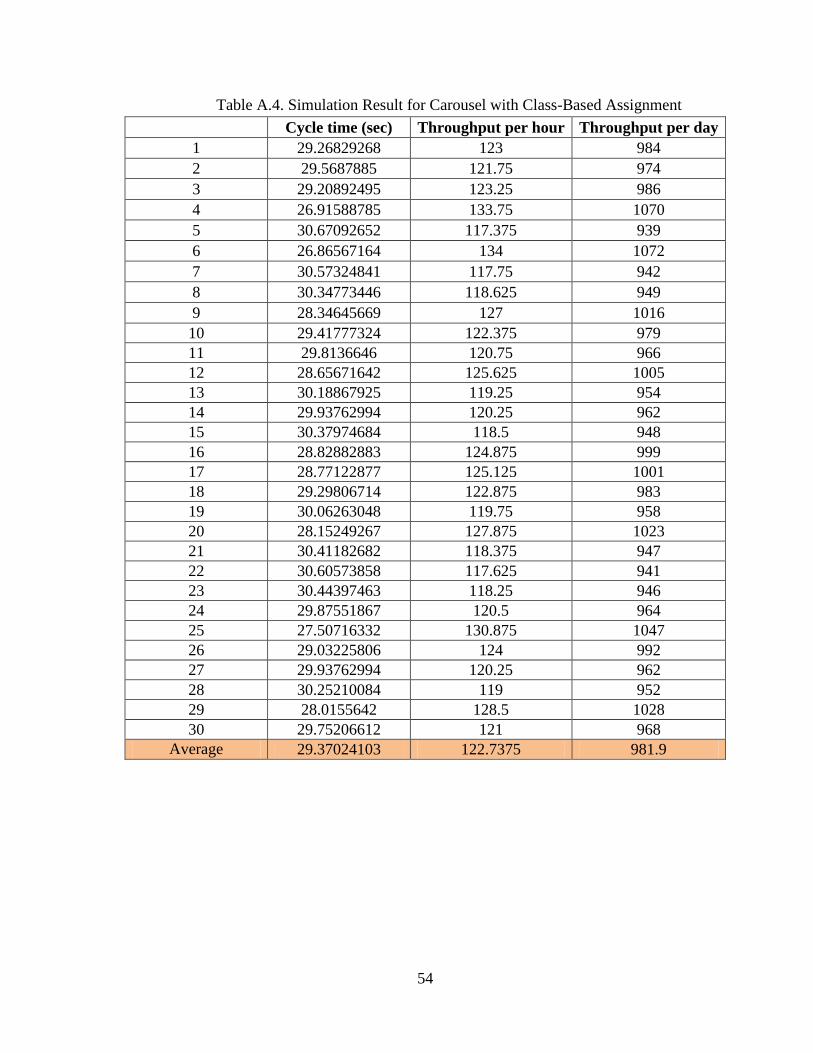
54
Table A.4. Simulation Result for Carousel with Class-Based Assignment
Cycle time (sec) Throughput per hour Throughput per day
1 29.26829268 123 984
2 29.5687885 121.75 974
3 29.20892495 123.25 986
4 26.91588785 133.75 1070
5 30.67092652 117.375 939
6 26.86567164 134 1072
7 30.57324841 117.75 942
8 30.34773446 118.625 949
9 28.34645669 127 1016
10 29.41777324 122.375 979
11 29.8136646 120.75 966
12 28.65671642 125.625 1005
13 30.18867925 119.25 954
14 29.93762994 120.25 962
15 30.37974684 118.5 948
16 28.82882883 124.875 999
17 28.77122877 125.125 1001
18 29.29806714 122.875 983
19 30.06263048 119.75 958
20 28.15249267 127.875 1023
21 30.41182682 118.375 947
22 30.60573858 117.625 941
23 30.44397463 118.25 946
24 29.87551867 120.5 964
25 27.50716332 130.875 1047
26 29.03225806 124 992
27 29.93762994 120.25 962
28 30.25210084 119 952
29 28.0155642 128.5 1028
30 29.75206612 121 968
Average 29.37024103 122.7375 981.9

55
APPENDIX B. EXTREME DATA VALUES
Table B.1. Extreme Data Values for AS/RS with Random Assignment
Arrival time
(minutes)
Start time
(minutes)
Process time
(minutes)
Ending time
(minutes)
Waiting time
(minutes) Order
0 0 1.035 1.035 0 1
1.035 1.035 1.035 2.07 0 2
2.07 2.07 1.035 3.105 0 3
3.105 3.105 1.035 4.14 0 4
4.14 4.14 1.035 5.175 0 5
5.175 5.175 1.035 6.21 0 6
6.21 6.21 1.035 7.245 0 7
7.245 7.245 1.035 8.28 0 8
8.28 8.28 1.035 9.315 0 9
9.315 9.315 1.035 10.35 0 10
10.35 10.35 1.035 11.385 0 11
11.385 11.385 1.035 12.42 0 12
12.42 12.42 1.035 13.455 0 13
13.455 13.455 1.035 14.49 0 14

56
Table B.2. Extreme Data Values for AS/RS with Class-Based Assignment
Arrival time
(minutes)
Start time
(minutes)
Process time
(minutes)
Ending time
(minutes)
Waiting time
(minutes) Order
0 0 0.619355 0.619355 0 1
0.6356 0.6356 0.619355 1.254955 0 2
1.2712 1.2712 0.619355 1.890555 0 3
1.9068 1.9068 0.619355 2.526155 0 4
2.5424 2.5424 0.619355 3.161755 0 5
3.178 3.178 0.619355 3.797355 0 6
3.8136 3.8136 0.619355 4.432955 0 7
4.4492 4.4492 0.619355 5.068555 0 8
5.0848 5.0848 0.619355 5.704155 0 9
5.7204 5.7204 0.619355 6.339755 0 10
6.356 6.356 0.619355 6.975355 0 11
6.9916 6.9916 0.619355 7.610955 0 12
7.6272 7.6272 0.619355 8.246555 0 13
8.2628 8.2628 0.619355 8.882155 0 14
8.8984 8.8984 0.619355 9.517755 0 15
9.534 9.534 0.619355 10.153355 0 16
10.1696 10.1696 0.619355 10.788955 0 17
10.8052 10.8052 0.619355 11.424555 0 18
11.4408 11.4408 0.619355 12.060155 0 19
12.0764 12.0764 0.619355 12.695755 0 20
12.712 12.712 0.619355 13.331355 0 21
13.3476 13.3476 0.619355 13.966955 0 22
13.9832 13.9832 0.619355 14.602555 0 23

57
Table B.3. Extreme Data Values for Carousel with Random Assignment
Arrival time
(minutes)
Start time
(minutes)
Process time
(minutes)
Ending time
(minutes)
Waiting time
(minutes) Order
0 0 0.7953 0.7953 0 1
0.7593 0.7593 0.7953 1.5546 0 2
1.5186 1.5186 0.7953 2.3139 0 3
2.2779 2.2779 0.7953 3.0732 0 4
3.0372 3.0372 0.7953 3.8325 0 5
3.7965 3.7965 0.7953 4.5918 0 6
4.5558 4.5558 0.7953 5.3511 0 7
5.3151 5.3151 0.7953 6.1104 0 8
6.0744 6.0744 0.7953 6.8697 0 9
6.8337 6.8337 0.7953 7.629 0 10
7.593 7.593 0.7953 8.3883 0 11
8.3523 8.3523 0.7953 9.1476 0 12
9.1116 9.1116 0.7953 9.9069 0 13
9.8709 9.8709 0.7953 10.6662 0 14
10.6302 10.6302 0.7953 11.4255 0 15
11.3895 11.3895 0.7953 12.1848 0 16
12.1488 12.1488 0.7953 12.9441 0 17
12.9081 12.9081 0.7953 13.7034 0 18
13.6674 13.6674 0.7953 14.4627 0 19

58
Table B.4. Extreme Data Values for Carousel with Class-Based Assignment
Arrival time
(minutes)
Start time
(minutes)
Process time
(minutes)
Ending time
(minutes)
Waiting time
(minutes) Order
0 0 0.49602162 0.49602162 0 1
0.49069 0.49069 0.49602162 0.98671162 0 2
0.98138 0.98138 0.49602162 1.47740162 0 3
1.47207 1.47207 0.49602162 1.96809162 0 4
1.96276 1.96276 0.49602162 2.45878162 0 5
2.45345 2.45345 0.49602162 2.94947162 0 6
2.94414 2.94414 0.49602162 3.44016162 0 7
3.43483 3.43483 0.49602162 3.93085162 0 8
3.92552 3.92552 0.49602162 4.42154162 0 9
4.41621 4.41621 0.49602162 4.91223162 0 10
4.9069 4.9069 0.49602162 5.40292162 0 11
5.39759 5.39759 0.49602162 5.89361162 0 12
5.88828 5.88828 0.49602162 6.38430162 0 13
6.37897 6.37897 0.49602162 6.87499162 0 14
6.86966 6.86966 0.49602162 7.36568162 0 15
7.36035 7.36035 0.49602162 7.85637162 0 16
7.85104 7.85104 0.49602162 8.34706162 0 17
8.34173 8.34173 0.49602162 8.83775162 0 18
8.83242 8.83242 0.49602162 9.32844162 0 19
9.32311 9.32311 0.49602162 9.81913162 0 20
9.8138 9.8138 0.49602162 10.3098216 0 21
10.30449 10.30449 0.49602162 10.8005116 0 22
10.79518 10.79518 0.49602162 11.2912016 0 23
11.28587 11.28587 0.49602162 11.7818916 0 24
11.77656 11.77656 0.49602162 12.2725816 0 25
12.26725 12.26725 0.49602162 12.7632716 0 26
12.75794 12.75794 0.49602162 13.2539616 0 27
13.24863 13.24863 0.49602162 13.7446516 0 28
13.73932 13.73932 0.49602162 14.2353416 0 29
14.23001 14.23001 0.49602162 14.7260316 0 30