an automatic road sign recognition system based on …fuh/personal/anautomatic...an automatic road...
TRANSCRIPT

www.elsevier.com/locate/cviu
Computer Vision and Image Understanding 96 (2004) 237–268
An automatic road sign recognition systembased on a computational model of
human recognition processing
C.Y. Fanga,*, C.S. Fuhb, P.S. Yena, S. Cherngc, S.W. Chend
a Department of Information and Computer Education, National Taiwan Normal University,
Taipei, Taiwan, ROCb Department of Computer Science and Information Engineering, National Taiwan University,
Taipei, Taiwan, ROCc Department of Electrical Engineering, Cheng Shiu University, Kaohsiung, Taiwan, ROC
d Department of Computer Science and Information Engineering, National Taiwan Normal University,
Taipei, Taiwan, ROC
Received 14 March 2002; accepted 2 February 2004
Available online 3 August 2004
Abstract
This paper presents an automatic road sign detection and recognition system that is based
on a computational model of human visual recognition processing. Road signs are typically
placed either by the roadside or above roads. They provide important information for guiding,
warning, or regulating the behaviors drivers in order to make driving safer and easier. The
proposed recognition system is motivated by human recognition processing. The system con-
sists of three major components: sensory, perceptual, and conceptual analyzers. The sensory
analyzer extracts the spatial and temporal information of interest from video sequences.
The extracted information then serves as the input stimuli to a spatiotemporal attentional
(STA) neural network in the perceptual analyzer. If stimulation continues, focuses of attention
will be established in the neural network. Potential features of road signs are then extracted
from the image areas corresponding to the focuses of attention. The extracted features are next
fed into the conceptual analyzer. The conceptual analyzer is composed of two modules: a
category module and an object module. The former uses a configurable adaptive resonance
1077-3142/$ - see front matter � 2004 Elsevier Inc. All rights reserved.
doi:10.1016/j.cviu.2004.02.007
* Corresponding author. Fax: +886-2-23512772.
E-mail address: [email protected] (C.Y. Fang).

238 C.Y. Fang et al. / Computer Vision and Image Understanding 96 (2004) 237–268
theory (CART) neural network to determine the category of the input stimuli, whereas the
later uses a configurable heteroassociative memory (CHAM) neural network to recognize
an object in the determined category of objects. The proposed computational model has been
used to develop a system for automatically detecting and recognizing road signs from sequenc-
es of traffic images. The experimental results revealed both the feasibility of the proposed com-
putational model and the robustness of the developed road sign detection system.
� 2004 Elsevier Inc. All rights reserved.
Keywords: Road sign recognition; Cognitive model; Sensory, perceptual, and conceptual analyzer;
Spatiotemporal attentional neural network; Configurable adaptive resonance theory neural network;
Configurable associative memory neural network
1. Introduction
1.1. Motivation
The main purpose of driving assistance systems (DAS) is to collect significant in-
formation for drivers in order to reduce their effort in safe driving. Drivers have to
pay attention to various conditions, including vehicle speed and orientation, the dis-
tance between vehicles, passing cars, and potential dangerous or unusual events
ahead. If DAS can collect such information a prior, it will greatly reduce the burdenof driving for drivers and make driving safer and easier.
Driving information mentioned above could be detected by many kinds of devic-
es, such as infrared rays, ultrasonic waves, microwaves, radar, and a computer vision
system. These devices can be utilized to extract various kinds of data from the driv-
ing environments. Computer vision systems, which have the advantage of high-res-
olution, can be employed to detect road borders and obstacles, and recognize road
signs. This kind of device cannot be surpassed because only they can ‘‘see’’ and ‘‘rec-
ognize’’ something during driving without the use extra auxiliary devices such asmagnetic marks.
Road signs are installed to guide, warn, and regulate traffic. They supply informa-
tion to help drivers operate their cars in such a way as to ensure traffic safety. In the
real world, when they get tired, drivers may not always notice road signs. At night,
drivers are easily affected by headlights of on coming vehicles and may miss road
signs. In bad weather, road signs are harder to recognize quickly and correctly. These
situations may lead to traffic accidents and serious injuries. A vision-based road sign
detection and recognition system is thus desirable to catch the attention of a driver toavoid traffic hazards.
Road signs are designed to attract a driver�s attention with particular colors and
simple geometric shapes. However, the difficulty in recognizing road signs is largely
due to the following reasons:
(1) The colors of road signs, particularly red, may fade after long exposure to the
sun. Moreover, paint may even flake or peel off.

C.Y. Fang et al. / Computer Vision and Image Understanding 96 (2004) 237–268 239
(2) Air pollution and weather conditions (e.g., rain, fog, shadows, and clouds) may
decrease the visibility of road signs.
(3) Outdoor lighting conditions varying from day to night may affect the colors of
road signs.
(4) Obstacles, such as vehicles, pedestrians, and other road signs, may partially oc-
clude road signs.
(5) Video images of road signs will have motion blur if the camcorder is mounted ona moving vehicle due to vehicle vibration as well as motion.
1.2. Related work
Vision systems incorporating visual sensing devices have been used in a variety of
applications, such as recognition, classification, detection, tracking, and monitoring.
For the purpose of driver assistance, vision systems have been employed to detect,recognize, and track objects such as lanes [3,22], roads [5,15,20,24], road signs and
traffic signals [6,30], road conditions (e.g., dry, wet, ice, and snow) [35], obstacles
(e.g., pedestrians, bikes, motorcycles, vehicles, and other intruders) [3–5,18,28], as
well as structures (e.g., tunnels, bridges, and overpasses) [11].
Since no formal definition for a vision-based driver assistance system (VDAS) has
ever been given, any functions, as mentioned above, that contribute to driving safety
can be considered a part of VDAS. To realize these functions, we have proposed a
dynamic visual model (DVM), which is a computational model for visual analysisbased on video sequences. The model primarily inspired by the human visual system
provides an underlying framework in which road sign detection system is developed.
Our DVM bridges some techniques of computer vision and some properties of hu-
man vision. In this study, we design artificial systems with similar properties of nat-
ural systems and hope to improve the understanding of natural process through the
operations of artificial systems. Note that the proposed DVM is a general-purpose
model. Various visual application systems using video sequences as input data will
be developed on the basis of the proposed model.Recently, many techniques have been developed to detect and recognize road
signs. Pacheco et al. [29] proposed adding special color barcodes under road signs
to help road sign identification for vision-based systems. However, much time re-
sources would be expended to reequip road signs, making this solution not econom-
ical. Aoyagi and Asakura [1] used genetic algorithms to detection road signs from
gray-level video imagery. Unfortunately, because of the limitation of crossover
and mutation operators, optimal solutions are not guaranteed. Lalonde and Li
[23] reported a color indexing approach to identify road signs, but the computationtime increases greatly in complex traffic scenes. Additionally, many other studies
about detecting and recognizing road signs by distance transforms [13], morpholog-
ical methods [17], neural networks [14,16,19,25], and fuzzy reasoning [24] have been
presented.
Researchers attempt to detect and recognize road signs not only in a single image
[8,9,19,31,36], but also in a video sequence [2,7,30,32]. Practically, at any given

240 C.Y. Fang et al. / Computer Vision and Image Understanding 96 (2004) 237–268
moment road signs may be partially occluded by vehicles, pedestrians, or other
obstacles. Using video sequences, we could preserve useful information from earlier
image frames, such as the number and sizes of road signs, to predict sizes and posi-
tions of road signs in later frames. This information will increase the speed of road
sign detection and the correctness of road sign recognition in later frames. At the
same time, information supplied by the later frames will help with road sign verifi-
cation for earlier frames. In summary, video sequences provide much more usefulinformation than single images.
Road signs are always placed either beside roads or above lanes. Being intended
to guide, warn, or regulate traffic to make driving safer and easier, they are designed
to attract drivers� attention to provide important information. It is believed that if
the behavior of an automatic road sign recognition system can be patterned after
the human brain, then such a system could ultimately detect and recognize road signs
from video image sequences as correctly and quickly as people do. This paper de-
scribes an automatic road sign detection and recognition system based on a compu-tational model of human recognition processing. We introduce in Section 2 a
computational model for pattern recognition inspired by human cognitive process-
ing. There are three important neural networks incorporated in the computational
model: spatiotemporal attentional (STA), configurable adaptive resonance theory
(CART), and configurable heteroassociative memory (CHAM). A system based
on the proposed computational model for detecting and recognizing road signs is de-
veloped in Section 3. The feasibility of the proposed computational model and the
robustness of the developed road sign detection and recognition system are exploredin Section 4. Finally, we draw conclusions and address future work in Section 5.
2. Computational model
2.1. Psychological fundamentals
While computers are excellent at computing, they are unhandy in both object de-tection and pattern recognition. On the other hand, the human brain exhibits impres-
sive powers in detection and recognition, but are not as good as computers in
computational ability. Human detection and recognition is primarily characterized
by two features: parallel processing and distributed representation. In the distributed
representation of information, a subject matter is decomposed into simple concepts,
each of which is encoded by a cognitive unit (a single neuron or a small set of neu-
rons collectively acting as a complex neuron). Furthermore, since a concept may be
shared by several different subjects, a cognitive unit can be involved in representingmany subjects.
In parallel processing, cognitive units can simultaneously process their own re-
ceived stimuli and propagate their outputs to others. Information, which is scattered
everywhere in the cortex, can be interchanged immediately and in parallel through
the connections among cognitive units. By this exchange process, high-level informa-
tion, including abstract concepts, can be constructed and supplied to the brain to

C.Y. Fang et al. / Computer Vision and Image Understanding 96 (2004) 237–268 241
analyze, thereby allowing humans to understand complex situations, including those
which cannot be worked out by a sequential process. For this reason we designed a
computational framework to model the recognition process of the human brain for
object detection and pattern recognition (see Fig. 1).
Before discussing our computational model, we give a brief description of human
cognition and recognition. According to cognitive psychologists [26], there are hier-
archical levels of information processing involved in cognition and recognition, suchas sensory, perceptual, conceptual, and action levels, as shown in Fig. 2. Considering
the case of vision, light (physical stimuli) absorbed by rods and cones (receptors) is
transformed into electrical signals, which are transmitted to the visual sensation an-
alyzer (the sensory analyzer) located in the primary visual receiving areas of the cor-
tex. The visual sensation analyzer extracts basic features (e.g., edges, lines, and
corners), spatial frequency patterns, as well as the information about color, depth,
and motion from the input signals. The outputs of the visual sensation analyzer
are delivered to the visual analyzer (the perceptual analyzer). The visual analyzer ly-ing in the visual association areas of the cortex perceives the categories of the input
stimuli (e.g., objects) based on the features detected at the sensory level. Both the
sensed low-level features and the perceived high-level categories are exploited at
the conceptual level to understand the input stimuli. Finally, people take action if
necessary, and the motor system takes care of the details of muscle movements.
All analyzers involved in cognition and recognition have analogous architectures
[21]. Every analyzer contains several layers of neurons, called cognitive units. Cogni-
tive units on the same layer are laterally connected with links which are almost alwaysinhibitory. Cognitive units on different layers are vertically connected with links
which are excitatory. A vertical link indicates the existence of a particular part-whole
relationship; the synaptic strength of the link specifies the degree of the relationship.
A lateral inhibitory link signifies the existence of a mutually exclusive relationship be-
tween two components; the strength of the link describes the grade of the relationship.
Both links and their strengths are made up solely through learning.
In the above, the parallel processing, distributed representation, hierarchical
analyzers, and layered architecture of the human brain are discussed. Numerous
Fig. 1. A simplified version of human cognitive and recognition processing.

Fig. 2. The proposed computational model.
242 C.Y. Fang et al. / Computer Vision and Image Understanding 96 (2004) 237–268

C.Y. Fang et al. / Computer Vision and Image Understanding 96 (2004) 237–268 243
functions of the brain are brought into being on the basis of the above features. In
Section 2.2, a computational model motivated by human cognitive processing for
road sign detection and recognition is developed.
2.2. Cognitive model
Fig. 2 depicts the proposed computational model. There are three analyzers com-prising of the model, referred to as sensory, perceptual, and conceptual. The input
data to the model are video sequences, which carry both spatial and temporal infor-
mation. Spatial information sketches the relations (e.g., distance, direction) between
objects in a single image, and temporal information describes the change of objects
(e.g., color, intensity, and position) between successive images. All these kinds of in-
formation are important for correct detection and recognition. First, in the sensory
analyzer, we extract the temporal and spatial information of moving objects from the
input video sequence.While a vehicle is in motion, everything outside the vehicle appears to be moving.
How can the objects of interest be pulled from a jumble of moving objects? Intuitive-
ly, specific characteristics (regarding shape, color, and texture) of objects can be uti-
lized to distinguish them. In the perceptual analyzer, a voluntary selectivity of
attention is realized by introducing a network called the STA neural network, as well
as a long-term memory (LTM), which preserves the characteristics of the objects of
interest. The information from the LTM will call the attention of the neural network
to the objects of interest when it is being innervated by the stimuli (i.e., the spatialand temporal information) coming from the sensory analyzer. Then the activations
of the STA neurons are examined. If there is no focus of attention formed over the
neurons, the system repeats the above process. Otherwise, the feature extraction step
is evoked to detect categorical features of the objects within the image areas corre-
sponding to the focuses of attention in the STA neural network.
Human brains first take notice of attractional objects, such as moving objects or
brightly colored objects, and then recognize them from coarse to fine. For example,
when we are driving, road signs become noticeable to us from afar. We may first dis-tinguish what categories they belong to, such as prohibition signs or guide signs by
their color or shape. Later, when the road signs appear larger, we can recognize their
meaning, such as no right turn, no left turn, and so on. In our computational model,
the classification stage, category perception, is simulated by CART neural network.
The recognition stage, object recognition, is implemented by a CHAM neural net-
work.
The categorical features obtained in the perceptual analyzer serve as the input
stimuli, represented as a supraliminal pattern, to a CART neural network in the con-ceptual analyzer. Fig. 3 represents the flowchart of a CART neural network. The in-
put supraliminal pattern first initializes the LTM of the CART neural network with
the contents coming from a system memory, called the episodic memory. The con-
figurations of the LTM and the associated components of the neural network have
to be adapted in accordance with the contents. This adaptability of configuration is
referred as the configurable capability of the neural network. Subliminal patterns to

Fig. 3. Flowchart for CART neural network.
244 C.Y. Fang et al. / Computer Vision and Image Understanding 96 (2004) 237–268
be matched with the input supraliminal pattern will be retrieved from the LTM, for
which the search space of subliminal patterns is greatly reduced. The supraliminal
pattern is compared with a subliminal pattern, and if they are similar enough, the
class of the supraliminal pattern is regarded as that of the subliminal pattern under
consideration. The CART network then performs a supervised learning through
which the subliminal pattern in the LTM is updated under the guidance of the input
supraliminal pattern. On the other hand, if no subliminal pattern is similar to anysupraliminal pattern, an unsupervised learning, which represents the supraliminal
pattern as a new subliminal pattern in the LTM, is carried out.
After the classification stage, particular object features regarding the special cat-
egory are extracted and fed into a CHAM neural network, which is the recognition
stage in the conceptual analyzer. Similar to the classification stage, the supraliminal
object feature pattern first initializes the LTM of the CHAM network with the con-
tents coming from the episodic memory. If the supraliminal pattern adequately
matches a subliminal pattern, the supraliminal pattern is recognized successfully.Otherwise, our system is in a new situation and will attempt to learn and memorize
the new experience for future recognition.
3. Road sign detection and recognition system
A system rooted in the proposed computational model for detecting and recogniz-
ing road signs is presented in this section. The system consists of three components:

C.Y. Fang et al. / Computer Vision and Image Understanding 96 (2004) 237–268 245
sensory, perceptual, and conceptual, corresponding to the three analyzers of the pro-
posed computational model.
3.1. Sensory component
The input data to our system were acquired using a video camcorder (SONY
TRV-900) mounted in the front windshield of a vehicle while driving on freeways.Since the vehicle�s speed is high (more then 90km/h), we use the interlace mode of
SONY TRV 900 to capture video sequences. In this mode the images are clearer than
in the normal mode and especially useful for analyzing high-speed actions such as
traffic scenes. However, moving objects appear jerky if the image is read/output
about every 1/30s.
In the sensory analyzer of our system, the spatial and temporal information of dy-
namic scenes is extracted from the input video sequences, and noise is filtered out.
The sensory analyzer is a primary analyzer which concerns itself with only local in-formation. In road sign detection, color is a local feature which can be extracted
from a single pixel. On the other hand, shape is global feature and must be decided
by a neighborhood of pixels.
As mentioned above, road sign detection is very difficult under poor weather con-
ditions because of the influence of constantly varying outdoor illumination. Even
though the actual colors of road signs are initially quite well controlled, the perceived
colors are affected by illumination from light of various colors in their natural set-
tings. Moreover, with the effects of sunlight, the paint on signs often fades with time.The hue component in HSI (hue, saturation, and intensity) model is invariant to
brightness [33] and shadows. Thus, the hue component is suitable to extract color
features, given the uncertainty of weather and natural and artificial damage to road
signs.
There are one-to-one mappings of sensory analyzers to the pixels of an input
image, and a sensory analyzer processes only the information coming from a single
pixel. First, the hue value, h, of each pixel is calculated by
h ¼180p cos�1
12½ðr�gÞþðr�bÞ�
½ðr�gÞ2þðr�bÞðg�bÞ�1=2
n oif ðg � bÞP 0;
� 180p cos�1
12½ðr�gÞþðr�bÞ�
½ðr�gÞ2þðr�bÞðg�bÞ�1=2
n oif ðg � bÞ < 0;
8><>:
where r, g, and b indicate the red, green, and blue values of the pixel. Then, the sim-
ilarity between h and the stored hue values of particular colors in road signs is cal-
culated. Let {h1,h2, . . . ,hq} be the set all the hue values of particular colors in road
signs which are assumed to be Gaussianly distributed with variance r2. Then the out-
put of the sensory analyzer is the degree of similarity
z ¼ maxk¼1;...;q
ðzkÞ;
where zk ¼ 1ffiffiffiffi2p
prexpððh� hkÞ2=2r2Þ.
Finally, the outputs of sensory analyzers are fed into the perceptual analyzer.
Fig. 4 gives an example showing the result of the sensory analyzers. The input image

Fig. 4. An example of the attention map of the STA neural network. (A) One image of an input video
sequence. (B) Corresponding outputs of the sensory analyzers. (C) Corresponding attention map of the
STA neural network.
246 C.Y. Fang et al. / Computer Vision and Image Understanding 96 (2004) 237–268
is shown in Fig. 4A. There are two road signs in the traffic scenes: one red and one
blue. The output of the sensory analyzers is shown in Fig. 4B, and the intensities of
the pixels indicate their degrees belonging to road sign colors.
3.2. Perceptual component
There are two major tasks in the perceptual component: attention formation and
feature extraction. The former is finished by a STA neural network, and the latter by
a categorical feature extraction method. These two techniques are introduced in Sec-
tions 3.2.1 and 3.2.2.
3.2.1. STA neural network
Tagare et al. [34] presented a maximum-likelihood strategy to direct the attentionduring visual search. This ‘‘attention strategy’’ can reduce the overall computation
by suggesting a promising subregion of the image in which a target object may ap-
pear. The subregion is similar to the focus of attention in which humans are interest-
ed. However, their method works on static images. In our application, input video
sequences are continuous stimuli carrying both spatial and temporal information
of dynamic scenes. The STA neural network is proposed for processing spatial
and temporal information in one construct.
We give only a brief description of the STA neural network in this subsection;more details can be found in [10]. The STA neural network, as Fig. 5 shows, is struc-
tured as a two-layer network: one for input and one for output. The output layer is
also referred to as the attentional layer. Neurons in this layer are arranged into a 2D
array in which they are connected to one another. These connections are within-layer
(lateral) connections and are almost always inhibitory. There are no synaptic links
among input neurons; they are, however, fully connected to the attentional neurons.
These connections are called between-layer (vertical) connections and are always ex-
citatory.The input neurons are also organized into a 2D array as are the attentional neu-
rons, and the size of both arrays are the same as that of the input images. Let wij de-
note the weight of the link between attentional neuron ni and input neuron nj. The
weight vector of attentional neuron ni is written as wi = (wi1,wi2, . . . ,wim), where m

Fig. 5. STA neural network.
C.Y. Fang et al. / Computer Vision and Image Understanding 96 (2004) 237–268 247
is the number of input neurons. The activation of attentional neuron ni due to input
stimuli z (coming from sensory analyzers) is
aiðtÞ ¼ wðaiðt � 1Þ þ Bð�aaiðt � 1Þ þ bAðIvi þ Ili � CnÞÞÞ;
Ivi ¼Xmj¼1
wijzj; I li ¼X
k2Ni;k 6¼i
½uikMðrikÞakðt � 1Þ�;
AðvÞ ¼v if v > 0;
0 if v6 0;
�
BðvÞ ¼v if v > 0
cv if v6 0
�; where 1 > c > 0:
In the above equations, ak is the activation of neuron nk, threshold Cn prevents theeffect due to noise, and a and b are positive parameters. Set Ni indicates the neigh-
boring set of attentional neuron ni; uik is the linking weight between neurons ni and
nk; M(rik) denotes a ‘‘Mexican-hat’’ function, and the parameter rik is the distance
between neurons ni and nk.
The linking weights,wij, between the input and attentional layers are defined as
follows. Referring to Fig. 6, let nj be any input neuron and ni be its corresponding
attentional neuron. Assume that a 2D Gaussian G is centered at attentional neuron
ni. Then, the linking strength wkj between input neuron nj and attentional neuron nkis defined as wkj = G (rki), where rki is the position vector of neuron nk with respect to
neuron ni.

Fig. 6. Weights between input and attentional layers.
248 C.Y. Fang et al. / Computer Vision and Image Understanding 96 (2004) 237–268
Suppose a point stimulus is applied to an input neuron. Next it innervates the
neurons in the attentional layer. Rather than equally stimulate, the degrees ofinnervation associated with attentional neurons are governed by a Gaussian dis-
tribution (see Fig. 6). Due to such a distribution, the point stimulus is spread
out before arriving at the attentional layer. Recall that the lateral interactions
among attentional neurons are dictated by a Mexican-hat function for which
the activations of attentional neurons tend to be clustered. The spreading and
clustering mechanisms of the STA neural network are in a sense analogous to
the morphological operations of dilation and erosion, respectively. The hybrid
of the two mechanisms increases the ability of the system to tolerate imperfectinput data.
The input stimuli of the STA neural network are the outputs of the sensory ana-
lyzers, shown in Fig. 4B. Fig. 4C shows the corresponding attention map of the STA
neural network. The spreading and clustering mechanisms make the focus of atten-
tion obvious, although the input stimuli are faint. Once the focus of attention is de-
veloped, the following subsystems will pay attention to only the area of interest and
ignore the rest of the input pattern. It can significantly reduce the search time of the
following subsystems.
3.2.2. Categorical feature extraction
The purpose of road sign classification is to reduce the search space and increase
the recognition rate. Categorical features utilized to partition road signs into groups
should represent common characteristics of the groups, not the specific ones of road
signs. For example, the red circle regulatory signs may belong to one group, and the
blue rectangular information signs may belong to another. The color and shape fea-
tures of each group should be extracted for classification.First, create an edge image E from the original stimuli O, the input Z of percep-
tual analyzer, and the attention map M of STA neural network. For each pixel (x,y),
E(x,y) is calculated by

C.Y. Fang et al. / Computer Vision and Image Understanding 96 (2004) 237–268 249
Eðx; yÞ ¼jE0ðx; yÞj if Mðx; yÞ > 0 and Zðx; yÞ > Cc;
0 otherwise;
�
where |E0(x,y)| is the absolute edge magnitude of pixel (x,y), and Cc is the similaritythreshold to determinate whether the color of pixel (x,y) has a road sign color. Here,
image E(x,y) represents only the edge information of pixels which may belong to the
road signs, and the other edge information is filtered by this equation.
Second, by combining the color and edge information, we can locate the candi-
date positions of road signs. Let Q contain the candidate positions of road signs.
For each position (x,y),
Qðx; yÞ ¼1 if Eðx; yÞ > 0 and Zðx; yÞ > 0;
0 otherwise:
�
As mentioned above, road signs are always installed either beside roads or above
lanes, which is where people expect to find them. A pre-attention map is used for
modeling the expectation of the human brain. In the pre-attention map, the places
where we expect road signs to be located have stronger stimuli than others. Now,we combine this prior information in Q:
P ðx; yÞ ¼1 if M�ðx; yÞ > 0 and Qðx; yÞ ¼ 1;
0 otherwise;
�
M�ðx; yÞ ¼ minðMðx; yÞ;Mpðx; yÞÞ;where Mp(x,y) is the pre-attention stimulus of pixel (x,y). Fig. 7 gives an example
to illustrate the effect of the pre-attention map. The original input stimulus is
Fig. 7. Experimental results with and without pre-attention. (A) Original image. (B) Attention map
without pre-attention. (C) Regions containing road sign candidates without pre-attention. (D) Pre-
attention map. (E) Attention map with pre-attention. (F) Regions containing road sign candidates with
pre-attention.
250 C.Y. Fang et al. / Computer Vision and Image Understanding 96 (2004) 237–268
shown in Fig. 7A, and the pre-attention map is presented in Fig. 7D. Figs. 7B and
E show the attention maps, M and M*, respectively. Compared with M, the atten-
tion map given by M* is more concentrated on the road signs, and noise near the
ground is filtered out. Finally, patterns Q and P are shown in Figs. 7C and F, re-
spectively.
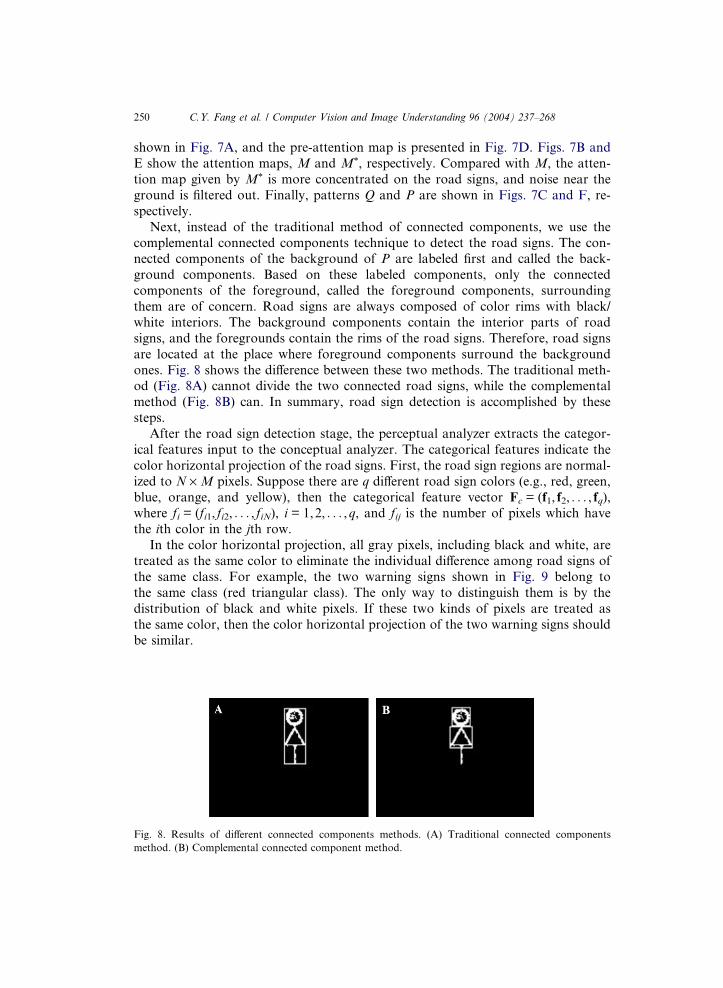
Next, instead of the traditional method of connected components, we use the
complemental connected components technique to detect the road signs. The con-nected components of the background of P are labeled first and called the back-
ground components. Based on these labeled components, only the connected
components of the foreground, called the foreground components, surrounding
them are of concern. Road signs are always composed of color rims with black/
white interiors. The background components contain the interior parts of road
signs, and the foregrounds contain the rims of the road signs. Therefore, road signs
are located at the place where foreground components surround the background
ones. Fig. 8 shows the difference between these two methods. The traditional meth-od (Fig. 8A) cannot divide the two connected road signs, while the complemental
method (Fig. 8B) can. In summary, road sign detection is accomplished by these
steps.
After the road sign detection stage, the perceptual analyzer extracts the categor-
ical features input to the conceptual analyzer. The categorical features indicate the
color horizontal projection of the road signs. First, the road sign regions are normal-
ized to N · M pixels. Suppose there are q different road sign colors (e.g., red, green,
blue, orange, and yellow), then the categorical feature vector Fc = (f1, f2, . . . , fq),where fi = (fi1, fi2, . . . , fiN), i = 1,2, . . . ,q, and fij is the number of pixels which have
the ith color in the jth row.
In the color horizontal projection, all gray pixels, including black and white, are
treated as the same color to eliminate the individual difference among road signs of
the same class. For example, the two warning signs shown in Fig. 9 belong to
the same class (red triangular class). The only way to distinguish them is by the
distribution of black and white pixels. If these two kinds of pixels are treated as
the same color, then the color horizontal projection of the two warning signs shouldbe similar.
Fig. 8. Results of different connected components methods. (A) Traditional connected components
method. (B) Complemental connected component method.

Fig. 9. Two warning signs.
C.Y. Fang et al. / Computer Vision and Image Understanding 96 (2004) 237–268 251
3.3. Conceptual component
The conceptual component is divided into two modules: a category module andan object module. The former uses a CART neural network to determine the cate-
gory of the input stimuli. The later uses a CHAM neural network to recognize an
object in a determined category of objects.
3.3.1. Category module
CART neural network. The categorical feature extracted in the perceptual compo-
nent serves as a supraliminal feature to be fed into the CART network in the
conceptual component. The CART network is actually an ART2 neural network[12] with a CLTM. Fig. 10 depicts the architecture of the ART2 neural network.
Fig. 10. ART2 neural network.

252 C.Y. Fang et al. / Computer Vision and Image Understanding 96 (2004) 237–268
The LTM of the neural network is embedded in the bidirectional links between the
category (the F2 layer) and the input (the F1 layer) representation fields in the atten-
tional subsystem. Rather than being fixed, the links and the associated components
are reconfigurable. In our proposed computational model, several systems (e.g., road
sign, obstacle, traffic condition, and environmental change detection systems) share a
common storage, referred to as the episodic memory. The subliminal features of the
system under consideration will be loaded from the episodic memory into the LTMof the neural network. The links and associated components of the LTM have to be
configured accordingly.
The supraliminal feature (the input categorical feature) is fed into the F1 layer of
the neural network. Its output is then used as a reference for recalling a subliminal
feature from the LTM. Next, the selected subliminal feature is matched with the su-
praliminal feature in the F1 layer. The orienting subsystem of the network decides to
accept or reject the subliminal feature based on its degree of match with the supra-
liminal feature. If the subliminal feature is accepted, the class represented by the sub-liminal feature is regarded as that of the input supraliminal feature. Supervised
learning is then performed to update the subliminal feature in the LTM under the
guidance of the supraliminal feature. On the other hand, if the subliminal feature
is rejected and there are still unselected subliminal features available in the LTM,
the next best subliminal feature is selected and the above process repeats. However,
if no subliminal feature matches the supraliminal feature, it is memorized as a new
subliminal feature and stored in the LTM through an unsupervised learning process.
The episodic memory in our system has to be refreshed with the content of theLTM of the CART network when the road sign recognition system is terminated.
The latest subliminal features are thus preserved for later uses. Furthermore, the
CART network can be utilized by the other systems.
Fig. 11 shows a classification result of the CART2 network. We scan sixteen road
sign images and extract their categorical features to train and test our system. Sixteen
categorical features of road signs are applied to the CART network. These features
are classified into eight classes so that similar features will be classified into the same
class. Instead of presenting the features, their corresponding road signs are illustrat-ed in Fig. 11. This result is memorized as the learned experience and used to classify
the subsequent input features.
Object feature extraction. After a road sign has been classified into some specific
class, the object features, which differ from categorical features, should focus on the
distinctions of the road signs of the same class. For example, the road signs shown in
row of Fig. 12A are all regulatory signs, having the same red rim and circular shape.
However, based on the distributions of white and black pixels, these signs represent
various meanings, such as no U-turn, left-turn, or right-turn. The distributions ofwhite and black pixels are extracted as the object features for the road sign recogni-
tion.
Instead of global thresholding, locally variable thresholding [27] is used to bina-
rize the road sign pattern. In this variable thresholding technique, the input image
is first divided into non-overlapping blocks. For each block, a gray-level histogram
is computed and a least-squares fit of a bimodal Gaussian mixture to the histogram

Fig. 11. Classification result of CART2 neural network. (A) Warning signs. (B) Regulatory signs. (C)
Construction signs. (D) Construction signs. (E) Guide signs. (F) Guide signs in highway. (G) Information
signs in highway. (H) Guide signs in highway.
Fig. 12. Some examples of regulatory signs and their extracted object features. (A) The original road signs.
(B) Their white object features. (C) Their black object features.
C.Y. Fang et al. / Computer Vision and Image Understanding 96 (2004) 237–268 253
is performed. A threshold value is then determined as the intensity value correspond-
ing to the deepest valley of the fitted curve. Based on these values, a homogenous
region test is conducted for the block under consideration. If the block region is re-
garded as a homogenous area, the determined threshold value is ignored. Finally,
from the threshold values of blocks, the dense threshold values of image pixel are
computed using bilinear interpolation. This method is particularly useful for dealing

254 C.Y. Fang et al. / Computer Vision and Image Understanding 96 (2004) 237–268
with the shadowing problem; for example, to threshold the road signs partially shad-
ed by buildings or trees (especially with their leaves swinging in the breeze). After
thresholding, the road signs are divided into two parts, black and white, shown in
rows of Figs. 12B and C. Both parts are the object features which are fed into the
object module for road sign recognition.
3.3.2. Object module
Associative memory [12] is one of the primary functions of the human brain. For
example, humans can easily associate the face of a friend with that friend�s name, or
a name with a telephone number. Associative memory can be thought of as one kind
of neural network mapping, which is able to compute some functional relationship
between its inputs and outputs. Heteroassociative memory is one form of associative
memory whose input vector and output vector can be selected freely and indepen-
dently of each other. Suppose there are L pairs of vectors, {(z1,m1), (z2,m2), . . . ,(zL, mL)}, with zi 2 Rm, and mi 2 Rn. A mapping, U, of z to m can be defined asU(zi) = mi. Heteroassociative memory associates non-equal pairs of vectors (zi „ mi).
Similarly, a recognition system which accepts feature input vectors and outputs the
recognition results can be thought of as a mapping system whose input and output
vectors are different. Moreover, heteroassociative memory is able to tolerate partially
occluding and noise interference. Thus, CHAM is selected to recognize objects in our
system.
The CHAM neural network, shown in Fig. 13, is structured as a two-layer net-
work with one input layer and one output layer. The output layer is a winner-take-all competitive layer. In the input layer, neurons are arranged into a 2D array,
and there are no within-layer synaptic links among these neurons. However, neurons
on the output layer are interconnected to one another by within-layer connections
and are fully connected to the output neurons by between-layer connections.
Fig. 13. CHAM neural network.

C.Y. Fang et al. / Computer Vision and Image Understanding 96 (2004) 237–268 255
Between-layer connections are always excitatory, while within-layer connections are
almost always inhibitory.
Suppose that the input layer of the neural network contains m neurons and the
output layer contains n neurons. Let wij denote the weight representing the strength
of the link between output neuron i and input neuron j. The weight vector of neuron
i is written as wi = (wi1,wi2, . . . ,wim). The net input to neuron i on the competitive
layer due to innervation z is computed from
neti ¼ wi � z ¼Xmj¼1
wijzj: ð1Þ
The neurons on the competitive layer will compete among themselves, and theneuron whose weight vector most closely matches the input vector wins. In other
words, the winner is the neuron having the largest activation. Let nc be the winner
after the competition, then
nc ¼ argðmaxi
ðnetiÞÞ: ð2Þ
Finally, the one winner on the competitive layer outputs a one while the rest out-
put zeros.
vi ¼1 if i ¼ nc;
0 otherwise:
�
Let {H1,H2, . . . ,Hp} be the set of object feature patterns stored in the CHAM, where
Hi = (Hib,Hiw)T, and i = 1,2, . . . ,p. Patterns Hib and Hiw represent the black and
white feature patterns, respectively, of the ith road sign. If an input object feature
pattern, H, is fed into the CHAM, then the output class carried out by Eqs. (1)
and (2) corresponds to
K ¼ argð mini¼1;...;p
H�Hik kÞ;
where kH � Hik is the distance between H and Hi.
Fig. 14 shows an example of the regulatory sign recognition. The CHAM is
trained by the set of 31 regulatory signs shown in column (A). The white and black
object features extracted from the training set are shown in columns (B) and (C), re-
spectively. Three test sets are prepared for the test stage. The first test set, shown in
column (D), contains the smoothed images of those signs in column (A) with 5 · 5neighborhood averaging. Their white and black object features extracted from the
training set are represented in columns (E) and (F), respectively. The second test
set, shown in column (G), is comprised of the regulatory signs corrupted by 20% uni-
formly distributed random noise, and the last one, shown in column (J), includes the
same signs corrupted by 30% noise. All 31 smoothed signs and 46 signs with noise
are recognized correctly.
Fig. 15 gives another example of regulatory sign recognition. The training set
is the same as shown in Fig. 14A but the test patterns (Fig. 15A) are extractedfrom real images captured by camcorder. Their white and black object features
are shown in columns (B) and (C), respectively. Column (D) shows the recogni-

256 C.Y. Fang et al. / Computer Vision and Image Understanding 96 (2004) 237–268
tion results. Although these road signs are imperfect, they are still recognized by
CHAM.
Fig. 16 illustrates an example of warning sign recognition. The CHAM is trained
by the set of 20 warning signs shown in column (A). The patterns in columns (B)–(L)
Fig. 14. An experimental result of regulatory signs recognition. (A) Training set of the regulatory signs.
(B) White object feature of column (A). (C) Black object feature of column (A). (D) Blurred test set. (E)
White object feature of column (D). (F) Black object feature of column (D). (G) Noisy test set. (H) White
object feature of column (G). (I) Black object feature of column (G). (J) Noisy test set. (K) White object
feature of column (J). (L) Black object feature of column (J).

C.Y. Fang et al. / Computer Vision and Image Understanding 96 (2004) 237–268 257
are generated in the same way as those in Figs. 14B–L. Columns (D), (G), and (K)
are the test sets prepared for the test stage. All 20 smoothed signs and 40 signs with
noise are recognized correctly.
These examples show how to recognize road signs in a single image. However, the
data input to our system are video sequences. We can collect more information dur-
ing several successive image frames to make a better decision. As the road signs on
the roadside get closer to the vehicle, the images of the road signs projected in thevideo images continuously increase in size and clarity. While road signs should still
Fig 14. (continued)

Fig. 15. Recognition results of real road sign patterns. (A) Test images captured by camcorder. (B)
Corresponding white object feature of column (A). (C) Corresponding black object feature of column (A).
(D) Their recognition results.
258 C.Y. Fang et al. / Computer Vision and Image Understanding 96 (2004) 237–268
be very small at first detection, our system may have difficulty recognizing these
small signs. However, such signs still supply valuable information for eliminating im-
possible candidates of road signs and reducing the search space. The more video im-
ages fed into our system, the more information can be used to strengthen our
decision.
Suppose our system initially maintains all the candidates for road signs in
the LTM of the CHAM network, then after processing some of the videoinput, the number of candidates, p, will be decreased by using the following
procedure:

Fig. 16. An experimental result of warning sign recognition. (A) Training set of the regulatory signs. (B)
White object feature of column (A). (C) Black object feature of column (A). (D) Blurred test set. (E) White
object feature of column (D). (F) Black object feature of column (D). (G) Noisy test set. (H) White object
feature of column (G). (I) Black object feature of column (G). (J) Noisy test set. (K) White object feature
of column (J). (L) Black object feature of column (J).
C.Y. Fang et al. / Computer Vision and Image Understanding 96 (2004) 237–268 259

260 C.Y. Fang et al. / Computer Vision and Image Understanding 96 (2004) 237–268
(1) Put all candidates for the road signs in the LTM.
(2) Input the extracted object feature H of an image in a video sequence to the
CHAM network.(3) For each candidate Hj in the LTM, apply the following rule: If
kH�Hjk > 1p
Ppi¼1kH�Hik, then remove the jth candidate from the LTM,
where j = 1,2, . . . ,p.
(4) Repeat steps (2) and (3) until only one candidate is left, and output the candidate
as the recognition result.
This procedure illustrates the recognition process for a road sign. If there are two
or more signs in the image sequence, the recognition process is the same except thatthe contents of the LTM should be modified for the different signs.
4. Experimental results and discussion
As mentioned above, the input data to our system were acquired using a video
camcorder mounted in the front windshield of a vehicle while driving on freeways.
Since the vehicle�s speed is high, moving objects appear jerky if the image is read/out-put about every 1/30s. Fig. 17 shows an example of this situation.
In our experiments, each video sequence was down-sampled to a frame rate of
5Hz before being submitted to the system. Furthermore, each 720 · 480 pixel input
image was reduced to 180 · 120 pixels by uniform sub-sampling. It is well known
that the advantages of sub-sampling include the reduction of processing time, noise,
Fig. 17. Original image captured with camcorder.

Fig. 18. Results of different sub-sampling methods. (A) Result of uniform sub-sampling method.
(B) Result of averaging sub-sampling method.
C.Y. Fang et al. / Computer Vision and Image Understanding 96 (2004) 237–268 261
as well as image instability. However, we want to emphasize that uniform sub-
sampling is better than averaging. In Figs. 18A and B, the different can easily be
discerned. These two images are derived from Fig. 17, and only uniform sub-sam-
pling will produce clear images in high-speed situations.
4.1. Experimental results
A number of video sequences were collected for experiments with one or two
signs included in each sequence. The first example of the experimental results is
presented in Fig. 19. It shows only part of a video sequence (the seven images in
column (A)). In this sequence, two road signs should be recognized, one is a
speed limit sign and the other is a warning sign. The corresponding attention
maps of the input images, column (A), are shown in column (B). These atten-
tion maps have combined pre-attention information, and thus the focus of atten-
tion is concentrated on where the road signs are located. Column (C) representsthe detection results of the candidate road signs. We frame these road signs with
white boxes. Column (D) shows the contents of the white boxes. They are ex-
tracted from the input image and normalized to 60 · 60 pixels. The normalized
patterns are first input to the CART network for classification and then fed to
the CHAM network for recognition. The recognized results, shown in column
(E), are output only when one candidate is left in each LTM. In this example,
the warning sign is recognized first, and the speed limit sign is recognized three
images later.Another example of the experimental results is presented in Fig. 20, showing only
five images of a video sequence (column (A)). This sequence includes two speed limit
signs. Column (B) shows the corresponding attention maps for the input images of
column (A); and column (C) gives the detection results of the candidate road signs.
The extracted and normalized patterns (60 · 60 pixels) for road sign recognition are
shown in column (D) and the recognized results in column (E). In this example, the
lower speed limit sign is recognized first, and the upper sign is recognized three
images later.

Fig. 19. Result of road sign detection and recognition. (A) The input video sequence. (B) The
corresponding attention map. (C) The results of road sign detection. (D) The road signs extracted after
category module. (E) The recognition result.
262 C.Y. Fang et al. / Computer Vision and Image Understanding 96 (2004) 237–268
Fig. 21 shows six more examples of experimental results. In each sequence we se-
lect only one image to represent the whole sequence in this figure. Columns (A) and
(D) are the selected images of the input video sequences, and columns (B) and (E)

Fig. 20. Another experimental result of road sign detection and recognition. (A) The input video
sequence. (B) The corresponding attention map. (C) The results of road sign detection. (D) The road signs
extracted after category module. (E) The recognition result.
C.Y. Fang et al. / Computer Vision and Image Understanding 96 (2004) 237–268 263
give their detection results. The recognition results are presented in columns (C) and
(F). No matter how many road signs are contained in the sequences, the recognitionresults are all correct.
Although most road signs in input images are detected at the detection stage,
there are some missed detections. Missed detection usually occurs when the road
signs are small in the image. These road signs may have no strong rims for detecting
correct connected components. Another reason is that the color on the rim of the
road signs does not match its original color (e.g., affected by colored lighting).
Fig. 22 shows two examples of missed detection. Fig. 22B shows the result
of Fig. 22A. The warning sign is not detected, because its rim is not complete soas to separate the interior and exterior of the sign. Figs. 22C and D show another
example of missed detection. Since our system integrates the results of several

Fig. 22. Two examples of missed detection. (A) The first input image. (B) The road sign detection result of
(A). (C) The second input image. (D) The road sign detection result of (C).
Fig. 21. Some experimental results of road sign detection and recognition. (A,D) are the input video
sequences. (B,E) Detection results. (C,F) The recognition results.
264 C.Y. Fang et al. / Computer Vision and Image Understanding 96 (2004) 237–268
successive images to make a decision, a few missed detections in a sequence does not
affect the decision making of our system.
If the speed of a vehicle is very high or the road surface is rough, then vehicle and
camcorder vibration cannot be avoided, and the quality of input video sequences is
reduced. Some patterns extracted from these sequences, shown in Fig. 23A, appear

Fig. 23. Three examples of incorrect recognition. (A) The extracted pattern for recognition. (B) Their
recognition results. (C) The correct answers.
C.Y. Fang et al. / Computer Vision and Image Understanding 96 (2004) 237–268 265
jerky, although they are detected and classified correctly. However, the recognition
of these patterns may be incorrect. Comparing the incorrect answers (Fig. 23B) with
the correct ones (Fig. 23C) shows that they are similar but not exactly the same. The
incorrect results do not affect the correctness of system�s decision since the decision is
made by integrating several images.
Twenty-one sequences have been tested in our experiment. Most of the classifi-
cation results of the CART neural network are correct (99%), and only 11 frames
(1%) are incorrect. About 85% of extracted road signs can be recognized correctlyin the CHAM neural network. Since our system only outputs a result for each in-
put sequence, this 85% ratio is enough for our system to recognize road signs cor-
rectly.
4.2. Discussion
The CART and CHAM networks should be well trained before being tested. As
mentioned earlier, the training patterns of CART are shown in Fig. 11. These pat-terns are first normalized to 60 · 60 pixels, and then the categorical feature vectors
(color horizontal projection) are extracted to train the CART network. Although
the patterns in the training set are man-made, they can be used to classify real pat-
terns captured by the camcorder. In our experiments additional patterns are not need
for training the CART network.
For each category stored in the CART networks, a corresponding LTM of the
CHAM network should be trained. The weights in these LTMs are recorded in ep-
isodic memory, and will be moved to the LTM as they are needed. In our experi-ments, only three categories in Fig. 11 have been trained. They are the regulatory
signs (Fig. 11A), the warning signs (Fig. 11B), and the guide signs (Fig. 11E). The
training sets of regulatory and warning signs are shown in Figs. 14A and 16A, re-
spectively. Similar to the training set of the CART network, these patterns can be
utilized to recognize the real patterns. In our experiments the lower speed limit signs
are included in the set of guide signs. Since the number of training patterns is small,
the training set of guide signs is not shown here.

266 C.Y. Fang et al. / Computer Vision and Image Understanding 96 (2004) 237–268
Our system is able to detect and recognize road signs at night if the street signs are
illuminated by headlights or street lights. However, if road signs are in dark or the
light is too dim, they may be lost at the detection stage. Our system cannot handle
these conditions.
5. Conclusion and future work
In this paper, a computational model motivated by human cognitive and recog-
nition processing was presented. Based on the proposed model, a road sign detec-
tion and recognition system was developed. The computational model consists of
three analyzers: sensory, perceptual, and conceptual. The sensory analyzer extracts
both spatial and temporal information from dynamic scenes. The spatial informa-
tion calls the attention of the perceptual analyzer to interesting objects, whereas the
temporal information calls attention to moving objects. The STA neural networkinvolved in the perceptual analyzer realizes both the spatial and temporal attention-
al mechanisms in one construct. The conceptual analyzer based on CART and
CHAM neural networks interprets the focuses of attention formed in the STA net-
work.
The road sign recognition system is not the only subsystem in vision-based DAS.
There are several other subsystems which perform road detection, obstacle recogni-
tion, and environmental change detection, etc. Developing and integrating these sub-
systems to collect significant information in driving environments is very importantfor improving traffic safety. We hope the proposed computational model is helpful
for designing various subsystems for functions such as the detection and recognition
of lanes, traffic signals, weaving intersections, obstacles, as well as road and weather
conditions. Moreover, other applications to event detection and recognition can also
be accomplished with this model by extracting different kinds of features.
Acknowledgments
This work was supported by the National Science Council, Republic of China,
under Contract NSC-90-2213-E-003-002. The authors gratefully acknowledge the as-
sistance of Prof. Robert R. Bailey of National Taiwan Normal University for his
many helpful suggestions in writing this paper and for editing the English.
References
[1] Y. Aoyagi, T. Asakura, A study on traffic sign recognition in scene image using genetic algorithms
and neural networks, in: Proc. IEEE IECON Int. Conf. on Industrial Electronics, Control, and
Instrumentation, Taipei, Taiwan, vol. 3, 1996, pp. 1838–1843.
[2] P. Arnoul, M. Viala, JP. Guerin, M. Mergy, Traffic signs localization for highways inventory from a
video camera on board a moving collection van, in: Proc. IEEE Intelligent Vehicles Symposium,
Tokyo, Japan, 1996, pp. 141–146.

C.Y. Fang et al. / Computer Vision and Image Understanding 96 (2004) 237–268 267
[3] M. Bertozzi, A. Broggi, GOLD: a parallel real-time stereo vision system for generic obstacle and lane
detection, IEEE Trans. Image Process. 7 (1998) 62–81.
[4] M. Bertozzi, A. Fascioli, A. Broggi, Performance analysis of a low-cost solution to vision-based
obstacle detection, in: Proc. IEEE Int. Conf. on Intelligent Transportation Systems, Tokyo, Japan,
1999, pp. 350–355.
[5] R. Chapuis, F. Marmoiton, R. Aufrere, F. Collange, J. P. Derutin, Road detection and vehicles
tracking by vision for an On-Board ACC System in the VELAC vehicle, in: Proc. Int. Conf. on
Information Fusion, Paris, vol. 2, 2000, pp. 11–18.
[6] A. de la Escalera, L. Moreno, Road traffic sign detection and classification, IEEE Trans. Ind.
Electron. 44 (1997) 848–859.
[7] S. Estable, J. Schick, F. Stein, R. Janssen, R. Ott, W. Ritter, Y. J. Zheng, A real-time traffic sign
recognition system, in: Proc. of the Intelligent Vehicles Symposium, Paris, 1994, pp. 213–218.
[8] L. Estevez, N. Kehtarnavaz, A real-time histographic approach to road sign recognition, in: Proc.
IEEE Southwest Symp. on Image Analysis and Interpretation, San Antonio, Texas, 1996, pp. 95–100.
[9] C.Y. Fang, C.S. Fuh, S.W. Chen, Detection and tracking of road signs, Pattern Recognit. Image
Anal. 11 (2001) 304–308.
[10] C.Y. Fang, S.W. Chen, C.S. Fuh, Automatic change detection of driving environments in a vision-
based driver assistance system, IEEE Trans. Neural Networks 14 (2003) 646–657.
[11] C.Y. Fang, C.S. Fuh, S.W. Chen, Driving environmental change detection subsystem in a vision-
based driver assistance system, in: Proce. IEEE Int. Joint Conf. on Neural Networks, Honolulu,
Hawaii, vol. 1, 2002, pp. 246–251.
[12] J.A. Freeman, D.M. Skapura, Neural Networks—Algorithms, Applications, Programming Tech-
niques, Addison-Wesley, Readings, MA, 1992.
[13] D.M. Gavrila, Multi-feature hierarchical template matching using distance transforms, in: Proc. IEEE
Int. Conf. Pattern Recognition, Brisbane, Australia, 1998. Available from: <http://www.gavrila.com>.
[14] D. Ghica, S.W. Lu, X. Yuan, Recognition of traffic signs by artificial neural network, in: Proc. IEEE
Int. Conf. on Neural Network, Perth, Australia, vol. 3, 1995, pp. 1444–1449.
[15] A. Guiducci, Parametric model of the perspective projection of a road with applications to lane
keeping and 3d road reconstruction, Comput. Vis. Image Understand. 73 (1999) 414–427.
[16] J.A. Janet, M.W. White, T.A. Chase, R.C. Luo, J.C. Sutto, Pattern analysis for autonomous vehicles
with the region- and feature-based neural network: global self-localization and traffic sign recognition,
in: Proc. IEEE Int. Conf. on Robotics and Automation, Minneapolis, Minnesota, vol. 4, 1996, pp.
3598–3604.
[17] G.Y. Jiang, T.Y. Choi, Y. Zheng, Morphological traffic sign recognitions, in: Proc. Int. Conf. on
Signal Processing, Lausanne, Switzerland, vol. 1, 1996, pp. 531–534.
[18] D.S. Kang, A noise tolerant algorithm for the object recognition of warning system, in: Proc. IEEE
Int. Symp. on Information Theory, Whistler, Canada, 1995, p. 367.
[19] N. Kehtarnavaz, A. Ahmad, Traffic sign recognition in noisy outdoor scenes, in: Proceedings of the
Intelligent Vehicles Symposium, Detroit, 1995, pp. 460–465.
[20] K. Kluge, C. Thorpe, The YARF system for vision-based road following, J. Math. Comput. Modell.
22 (1995) 213–233.
[21] J. Konorski, Integrative Activity of the Brain, University of Chicago Press, Chicago, 1967.
[22] H.S. Lai, H.C. Yung, Lane detection by orientation and length discrimination, IEEE Trans. Syst.
Man Cybernet.—Part B: Cybernet. 30 (2000) 539–548.
[23] M. Lalonde, Y. Li, Detection of Road Signs Using Color Indexing, Technical Report CRIM-IT-95/
12-49, Centre de Recherche Informatique de Montreal. Available from: <http://www.crim.ca/sbc/
english/cime/> publications.html, 1995.
[24] W. Li, X. Jiang, Y. Wang, Road recognition for vision navigation of an autonomous vehicle by fuzzy
reasoning, Fuzzy Sets Syst. 93 (1998) 275–280.
[25] S.W. Lu, Recognition of traffic signs using a multilayer neural network, in: Proc. Canadian Conf. on
Electrical and Computer Engineering, Halifax, Nova Scotia, vol. 2, 1994, pp. 833–834.
[26] C. Martindale, Cognitive Psychology—A Neural-Network Approach, Brooks/Cole, Pacific Grove
California, 1991.

268 C.Y. Fang et al. / Computer Vision and Image Understanding 96 (2004) 237–268
[27] Y. Nakcogawa, A. Rosenfeld, Some experiments of variable threshold, Pattern Recognit. 11 (1979)
191–204.
[28] D. Nair, J.K. Aggarwal, Moving obstacle detection from a navigating robot, IEEE Trans. Robot.
Automat. 14 (1998) 404–416.
[29] L. Pacheco, J. Batlle, X. Cufi, A new approach to real time traffic sign recognition based on colour
information, in: Proceedings of the Intelligent Vehicles Symposium, Paris, 1994, pp. 339–344.
[30] G. Piccioli, E.D. Micheli, P. Parodi, M. Campani, A robust method for road sign detection and
recognition, Image Vis. Comput. 14 (1996) 209–223.
[31] L. Priese, J. Kileber, R. Lakmann, V. Rehrmann, R. Schian, New results on traffic sign recognition,
in: Proceedings of the Intelligent Vehicles Symposium, Paris, 1994, pp. 249–254.
[32] W. Ritter, F. Stein, R. Janssen, Traffic sign recognition using colour information, J. Math. Comput.
Modell. 22 (1995) 149–161.
[33] G. Sharma, H.J. Trussell, Digital color imaging, IEEE Trans. Image Process. 6 (1997) 901–932.
[34] H.D. Tagare, K. Toyama, J.G. Wang, A maximum-likelihood strategy for directing attention during
visual search, IEEE Trans. Pattern Anal. Mach. Intell. 23 (2001) 490–500.
[35] M. Yamada, K. Ueda, I. Horiba, N. Sugie, Discrimination of the road condition toward
understanding of vehicle driving environments, in: Proc. IEEE Int. Conf. on Intelligent Transpor-
tation Systems, Tokyo, Japan, 1999, pp. 20–24.
[36] Y. J. Zheng, W. Ritter, R. Janssen, An adaptive system for traffic sign recognition, in: Proceedings of
the Intelligent Vehicles Symposium, Paris, 1994, pp. 165–170.