an chen - ghent university...
TRANSCRIPT

Master’s dissertation submitted in partial fulfilment of the requirements for the joint degree of
International Master of Science in Environmental Technology and Engineering
an Erasmus Mundus Master Course
jointly organized by UGent (Belgium), ICTP (Prague) and UNESCO‐IHE (the Netherlands)
Academic year 2012 – 2014
Optimizing Nutrient Use Efficiency in Agriculture by Utilizing Manure and Digestate Derivatives as Bio-based Fertilizer
Host University:
Ghent University, Belgium
An Chen Promoter: Prof. dr. ir. Erik Meers Co-promoter: Dr. ir. Evi Michels This thesis was elaborated at Ghent University and defended at Ghent University within the framework of the European Erasmus Mundus Programme “Erasmus Mundus International Master of Science in
Environmental Technology and Engineering " (Course N° 2011-0172)
© [2014] [Ghent], [An Chen], Ghent University, all rights reserved.

I
Acknowledgement
I take this opportunity to express my sincere gratitude to my promoter, Prof. dr. ir. Erik Meers, for
giving me the opportunity to accomplish this dissertation in the Laboratory of Analytical Chemistry
and Applied Ecochemistry, and also for his help and guidance throughout thesis work.
I would like to express my appreciation to my co-promoter, Dr. ir. Evi Michels, and tutor, MSc. Ivona
Sigurnjak, for their patience in guiding me in the laboratory work as well as revising the thesis
manuscript.
I am especially grateful to Joachim Neri, Roseline Blanckaert and Katty Sabo for their patience and
selflessness in helping me to solve all the technical problems during the whole laboratory thesis work.
Thanks to the European Erasmus Mundus program for granting me scholarship to attend the IMETE
program. Thanks to the IMETE coordination office for supporting my study in UNESCO-IHE
Institute for Water Education in Delft, Institute of Chemical Technology in Prague, and Ghent
University.
Lastly, I want to thank my friends and my family, for their constant encouragement and help without
which this thesis would not be possible.
An Chen

II
This study has been funded by the European Commission under the Interreg IVb Project
―Accelerating Renewable Energies through valorization of Biogenic Organic Raw Material (ARBOR)‖
and by the Environmental & Energy Technology Innovation Platform (MIP) under the project
―Nutrient Recycling from Manure and Digestate‖ (Nutricycle)

III
Abstract
Flanders in Belgium, defined as intensive but highly productive livestock area, is confronted with the
dilemma between overproduction of manure and limited arable land for disposal. Moreover, the
enactment of European Nitrate Directive (91/676/EEG) and Flemish Manure Decree strictly limit the
maximal spreading of manure on the field. This region also faces the problem of excessive use of
mineral fertilizers in agriculture. In order to address these difficulties, manure and digestate, as
nutrients treasure, start to attract lots of attention by researchers. Plenty of technologies are developed
to recuperate nutrients from manure and digestate. The end products are called derivatives, including
LF of digestate, mixture digestate/LF of digestate, air scrubber water from ammonia removal, LF of
manure, urea derived from pig urine. To evaluate the nutrient use efficiency (NUE) of these
derivatives, a field trial with 11 fertilization scenarios was to cultivate energy maize. NUE was
assessed by ratio of nutrient uptake to input. Crop yield, nutrients uptake, nutrients residue in soil
were tested in order to get clear picture of NUE and its effects on plant and soil. Results showed that
NUE of the combinations of these derivatives were comparable with the conventional fertilizer
practice, that all NUE for N-P-K were bigger than 100%. No big differences were existent regarding
the effects of the 11 fertilization treatments on maize yield and soil quality. In addition, nitrate
residues for all scenarios were much lower than 90 kg ha-1
restricted by Flemish manure policy. In
general, the NUE of derivatives from manure and digestate were similar or higher than the
conventional fertilizers, thus these derivatives can be used as bio-based fertilizers to substitute manure
and/or artificial fertilizer.
Key words: bio-based fertilizer; nutrient use efficiency; digestate; LF of digestate; LF of manure; air
scrubber water; urea; NO3-N
IV
Table of Contents
Acknowledgement .................................................................................................................................... I
Abstract ................................................................................................................................................. III
Table of Contents ................................................................................................................................... IV
List of Tables ........................................................................................................................................ VII
List of Figures .................................................................................................................................... VIII
List of Appendices ................................................................................................................................. IX
List of Abbreviations .............................................................................................................................. X
1. INTRODUCTION ........................................................................................................................... 1
1.1. Background .......................................................................................................................... 1
1.2. Research objectives .............................................................................................................. 2
2. REVIEW OF LITERATURE ........................................................................................................... 3
2.1. Occurrence of the bio-based fertilizer .................................................................................. 3
2.2. Digestate and its properties .................................................................................................. 5
2.3. Nutrient recovery from digestate and manure ...................................................................... 8
2.3.1. Techniques of nutrient recovery ................................................................................ 8
2.3.2. Derivatives of manure and digestate ......................................................................... 9
2.4. Agronomic effects of the bio-based fertilizer ......................................................................11
2.4.1. Effects on soil properties..........................................................................................11
2.4.2. Effects on crop growth and yield ............................................................................ 13
2.5. Bottlenecks for the use of the bio-based fertilizer .............................................................. 14
2.6. Legislation of bio-based fertilizer utilization in agriculture ............................................... 15
3. MATERIALS AND METHODS ................................................................................................... 17
3.1. Experimental design ........................................................................................................... 17
3.1.1. Site description ....................................................................................................... 17
3.1.2. Fertilization regime and sowing .............................................................................. 17

V
3.1.3. Soil sampling and crop harvest ............................................................................... 18
3.2. Analytical methods ............................................................................................................. 19
3.2.1. Soil analysis ............................................................................................................ 19
3.2.2. Plant analysis .......................................................................................................... 23
3.3. Data processing methods .................................................................................................... 24
3.3.1. Nutrient use efficiency (NUE) algorithm ................................................................ 24
3.3.2. Statistical analysis ................................................................................................... 25
4. RESULTS ...................................................................................................................................... 26
4.1. Characterization of soil nutrient baseline (NB) and bio-based fertilizers .......................... 26
4.1.1. Characteristics of soil nutrients baseline before field experiment .......................... 26
4.1.2. Physical-chemical properties of bio-based fertilizers ............................................. 26
4.1.3. Fertilizers dosage for 11 scenarios and nutrient input (NI) in the field .................. 27
4.2. Biomass yield (fresh matter and dry matter) ...................................................................... 29
4.3. Nutrient use efficiency (NUE) ........................................................................................... 30
4.3.1. N-P-K Nutrients uptake (NU) in maize .................................................................. 30
4.3.2. Nutrient use efficiency for N-P-K fertilizers .......................................................... 31
4.3.3. Other nutrient uptake in maize ................................................................................ 32
4.4. Soil nutrients residue (NR) analysis ................................................................................... 33
4.4.1. Mineral nitrogen (NO3-N and NH4-N) and organic nitrogen (TKN) in soil ........... 33
4.4.2. Total phosphorus (P) and available phosphorus (P-AL) in soil .............................. 36
4.4.3. Total potassium (K) and available potassium (K-SOL) in soil ............................... 36
4.4.4. Other nutrients residues .......................................................................................... 37
4.5. Other parameters for soil quality ........................................................................................ 41
4.5.1. pH-H2O, pH-KCl, Electrical Conductivity (EC)..................................................... 41
4.5.2. Organic matter (OM) and organic carbon (OC) of soil ........................................... 41
4.5.3. Sodium Adsorption Ratio (SAR) ............................................................................ 41
5. DISCUSSION ................................................................................................................................ 43
5.1. Fertilizer impact on crop yield and quality ........................................................................ 43
5.2. Nutrient use efficiency of N-P-K fertilizers ....................................................................... 43

VI
5.3. Fertilizer impact on soil nutrients residues ......................................................................... 45
5.4. Fertilizer impact on soil quality of pH, EC, OM, OC and SAR ......................................... 48
6. CONCLUSIONS AND RECOMMENDATIONS ......................................................................... 50
REFERENCES ...................................................................................................................................... 52
APPENDICES ....................................................................................................................................... 57

VII
List of Tables
Table 1.1 Typical amending and fertilizing properties of agricultural-sourced digestate......................7
Table 1.2 Comparison of properties between digestate (D) and its derivatives: SF digestate (SFD) and
LF digestate (LFD) separated by rotating drum, SF product after screw press of SF digestate
(SPSF) and Concentrate after reversed osmosis treatment of LF digestate (C)............................9
Table 4.1 Characteristics of soil in the field trial before applying fertilizers........................................26
Table 4.2 Soil NO3-N and NH4-N baseline in the field trial before applying fertilizers.......................26
Table 4.3 Physical-chemical properties of bio-based fertilizers............................................................27
Table 4.4 Dosage of bio-based fertilizers and artificial fertilizers for the 11 the scenarios..................28
Table 4.5 Nutrient input (NI) of total N, effective N, P2O5 and K2O for the 11 scenarios....................28
Table 4.6 Comparison of NUE for 11 scenarios after maize harvest in October.............................32
Table 4.7 Nutrient uptake of Na, S, Ca, Mg, Cu, Zn in maize for the 11 scenarios...........................35
Table 4.8 Total phosphorus (P) and extraction ratio (by AL) in soil layer of 0 – 30 cm for the 11
scenarios during all monitoring moments................................................................39
Table 4.9 Total potassium (K) and extraction ratio (by CaCl2) in soil layer of 0 – 30 cm for the 11
scenarios during all monitoring moments...............................................................40

VIII
List of Figures
Figure 2.1 Scheme of manure and digestate derivatives and relevant techniques................................11
Figure 3.1 Experimental site situated in Beitem, Roeselare, Belgium.................................................17
Figure 3.2 Schematic layout of the 44 fully randomized subplots (the first number indicates the
repetition 1-4 and the last 2 numbers indicate the scenario 01-11)...........................18
Figure 3.3 Nutrients balance modeling of the field trial experiment....................................................24
Figure 4.1 Fresh matter of biomass yield for the 11 fertilization scenarios at harvest time on October
4.............................................................................................................................29
Figure 4.2 Dry matter of biomass yield for the 11 fertilization scenarios at harvest time on October
4.................................................................................................................29
Figure 4.3 Nutrient uptake of N/P/K for 11 treated scenarios at harvest time in October...................31
Figure 4.4 NO3-N and NH4-N contents in soil 0-90 cm for the 11 scenarios at post-harvest time on
November 22......................................................................................................................34
Figure 4.5 Mineral nitrogen concentrations in soil (0-30 cm) for the 11 scenarios during all
monitoring moments..........................................................................................................35
Figure 4.6 Total phosphorus (P) and plant-available phosphorus (P-AL) contents in 3 layers (0-90cm)
of soil on October 7............................................................................................................38
Figure 4.7 Total potassium (K) and Available potassium (K-SOL) contents in 3 layers (0-90cm) of
soil on October 7................................................................................................................38
Figure 4.8 Plant-available phosphorus (P-AL) concentrations in soil (0-30 cm) for the 11 scenarios
during all monitoring moments........................................................................................39
Figure 4.9 Soluble potassium (K-SOL) concentrations in soil (0-30 cm) for 11 scenarios during all
monitoring moments...........................................................................................40
Figure 4.10 Sodium adsorption ratio for the 11 scenarios in July.........................................................42
IX
List of Appendices
Appendix 1 SAS code for statistical analysis.......................................................................................57
Appendix 2 Organic nitrogen (TKN) content (g kg-1
DM soil) in soil 0-30 cm for the 11 scenarios
during all monitoring moments.......................................................................................59
Appendix 3 Nutrients residues (Na, S, Ca, Mg, Cu, Zn) in soil layer of 0 – 30 cm during all
monitoring moments.......................................................................................................59
Appendix 4 pH-H2O, pH-KCl and EC (μS cm-1
) in soil layer of 0 – 30 cm for the 11 scenarios during
all monitoring moments...........................................................................................61
Appendix 5 Organic matter (OM) and organic carbon (OC) in soil layer of 0 – 30 cm for the 11
scenarios during all monitoring moments.........................................................................62
Appendix 6 Dry matter content of maize for the 11 scenarios at the harvest time (October 4)..........63

X
List of Abbreviations
AD Anaerobic digestion
AL Ammonium lactate extraction
CEL/LIG Cellulose/lignin
DM Dry matter
EC Electrical conductivity
FM Fresh matter
GHG Greenhouse gas
GLM General linear model
ICP-OES Inductively coupled plasma optical emission spectroscopy
K-SOL Soluble potassium
LF Liquid fraction
NB Nutrients baseline
NI Nutrients input
NL Nutrients loss
NR Nutrients residue
NU Nutrients uptake
NUE Nutrient use efficiency
OC Organic carbon
OM Organic matter
RCBD Randomized complete block design
SAR Sodium absorption ratio
SF Solid fraction
TKN Total Kjeldahl nitrogen

Chapter 1. Introduction
1
1. INTRODUCTION
1.1. Background
Flanders in Belgium, defined as intensive but highly productive livestock area, has a considerable
animal population density with 3,000 animals per km2 related to pig breeding (Boets et al., 2011).
This has resulted in excessive animal manure production in this area. Disposal of the surplus pig
manure became troublesome, as there is very limited arable land in Flanders. In 2004, it was
estimated that a total of about 2.4 million tons of extra pig manure need to be treated annually (Meers
et al., 2006). Moreover, the enactment of the European Nitrate Directive (91/676/EEG) and the
Flemish Manure Decree has set more stringent restrictions on manure spreading on farmland. To
tackle these difficulties, manure treatment technology attracted lots of attention. An important
technology, hereby, anaerobic digestion (AD) was introduced to decrease the volume of manure. It
seems to provide an alternative abatement of excess manure, while generating economic benefit as
biogas energy. However, the produced digestate still poses environmental pressure on this region if
not handled properly, as they may cause greenhouse gas (GHG) emissions (NH3, N2O) and
eutrophication problems.
Taking in consideration the tremendous nutrients (N, P, K, Ca, Mg, etc.) in digestate/manure in raw
form, innovative technologies were developed to recuperate nutrients which can be used as bio-based
fertilizer, instead of simple disposal. This could lead to create a cradle-to-cradle model with
completely nutrient cycling in agriculture sector. Even though derivatives from manure and digestate
are considered with high potential as substitute for artificial fertilizer, the practical agriculture
application of derivatives is still rarely reported. It was reported that acidic air scrubbing water
generated from ammonia-removal could potentially be reused as N-S-fertilizer, and concentrates
derived from membrane filtration of liquid digestate could be reused as N-K-fertilizer (Vaneeckhaute
et al., 2013a).
In a field preceding trial conducted by Vaneeckhaute et al. (2013b), applying digestate derivatives had

Chapter 1. Introduction
2
caused small but insignificant improvement in crop yield, and there were no apparent effects of these
bio-based fertilizers on the field. However, the availability of derivatives of manure and digestate
could be suitable as fertilizer is still unclear, due to the agricultural potential and conflicting results of
its performance revealed in recent articles (Nkoa, 2014), as well as the lack of legislative permission
on its directly application on the arable land in Flanders. Therefore, the efficient and appropriate use
of manure/digestate derivatives in agriculture requires more in-depth understanding in terms of
agrochemical characteristics, as well as the ecological and economic feasibility as bio-based
fertilizers.
1.2. Research objectives
Due to the highly potential of derivatives of manure and digestate as bio-based fertilizer, the interest
in investigating their effects on crops and soil has increased recently. Nevertheless, much is still
unknown and further research is imperative. The overall goal of this thesis is to investigate the
optimal nutrient use efficiency by applying manure and digestate derivatives as fertilizers. More
specifically,
(1) To evaluate the nutrient use efficiency of these bio-based fertilizers with respect to total N,
effective N, P2O5 and K2O, as comparing to conventional fertilizer practice by farmers (artificial
fertilizers + manure);
(2) To track and compare the nutrients change in soil during crop growing season, harvest and
post-harvest time, with regard to NO3-N, NH4-N, plant available P and soluble K.
(3) To evaluate the impacts of bio-based fertilizers replacing artificial fertilizers and/or manure in
regard to crop nutrient uptake and soil nutrients residue (N, P, K, Na, S, Ca, Mg, Cu, Zn).
(4) To assess the potential environmental impacts of bio-based fertilizers through physical-chemical
properties of soil such as NO3-N residue, available P, pH, electrical conductivity, sodium
adsorption ratio (SAR), organic matter and organic carbon.

Chapter 2. Review of Literature
3
2. REVIEW OF LITERATURE
2.1. Occurrence of the bio-based fertilizer
As intensive livestock production systems prevailed in Europe over the last several decades, large
quantities of manure were produced. According to the FAOSTAT 2003 (Holm-Nielsen et al., 2009),
the estimated amounts of animal manure in EU-27 produced every year have reached more than 1,500
million tons. A more severe situation occurred in West European region e.g. Netherlands, Belgium,
Denmark (Van der Straeten et al., 2008). In Belgium Flanders region, it was estimated in 2004 that a
total of about 2.4 million tons of extra pig manure need to be treated annually, due to limited land for
disposal (Meers et al., 2006).
The continuous increase of manure production poses a constant pollution risk on the environment. If
untreated or poorly managed, it will become a major source of air and water pollution, mainly
resulting from (1) the emission of ammonia (NH3), methane (CH4) and nitrous oxides (NOX), which
contributes to the land acidification and global warming; (2) nitrate (NO3-) and phosphate (PO4
3-)
leaching to soil and surface water, which contributes to the eutrophication; and (3) the release of toxic
substances into the air, water, soil or the food chain, causing health problems due to the exposure of
human to heavy metals and pathogens (De Vries et al., 2012, De Boer, 2003, Amon et al., 2006).
In order to minimize the environmental impact, it is of great interest for livestock waste management
to adopt manure processing technologies such as anaerobic digestion (AD), biological treatment,
composting, incineration, and gasification (De Vries et al., 2012). Among them, AD is a renowned
sustainable technology contributing to an integrated management of manure, regardless of the scale of
the agriculture and farming (Garfí et al., 2011, Holm-Nielsen et al., 2009). AD can not only transform
manure into renewable bio-fuel through biogas (methane), but also decrease the quantity of the
manure (Teglia et al., 2011a, Makádi et al., 2012). Furthermore, it could control the pathogen
problems (Teglia et al., 2011a, Kearney et al., 1993). AD is also seen as a flexible technique by
combining manure with other organic matter (e.g. crop residues, energy crops). Moreover, AD has

Chapter 2. Review of Literature
4
been reported to produce benefits by increasing the agronomic value of the manure treated, through
the by-product of AD, i.e. digestate (Ward et al., 2008). Digestate can be used or further treated and
recycled as a soil conditioner (amendment) and bio-based fertilizer, as it conserves practically all the
crop nutrients contained in the initial feedstock of manure. Consequently, AD plants become popular
and have expanded significantly in Europe since 1970s (Nkoa, 2014). In particular, there are now 39
anaerobic digestion plants operational in Flanders region, and most of them are dealing in majority
with manure, energy crops and organic waste stream (Lebuf et al., 2013). It was reported that in 2010
approximately 1 million tons of these organic materials were anaerobically digested (Allen, 2012). As
a result of the booming AD market, an immense amount of digestate was produced along with the
biogas.
However, in nutrient rich areas of Flanders, the conflicting reality is that there is very limited tillable
land for spreading excess manure and the produced digestate (Lebuf et al., 2012, Vaneeckhaute et al.,
2013a). More severely, digestate is currently competing with surplus manure for nutrient disposal on
the arable land, due to the strict legislation of the Flemish Manure Decree (Lebuf et al., 2013). This
manure policy restricts maximum manure application of 170 kg ha-1
per year, which has dramatically
limited the digestate use as fertilizer. Besides, intensive agriculture system consumes large amount of
artificial fertilizer, and consumption rose from 136 million EUR in 2000 to 251 million EUR in 2008
in Flanders (Platteau and Van Bogaert, 2009).
A factual difficulty hereby is the fluctuating price of artificial fertilizer, which ascribes to the scarcity
of fossil fuel and its increasing cost (Vaneeckhaute et al., 2013a, Lebuf et al., 2012). It was reported in
2010 that the EU-27 consumed enormous amount of artificial fertilizer: 10.4 Mt of nitrogen (N), 2.4
Mt of phosphate (P2O5) and 2.7 Mt of potassium (K2O), which were produced at the expense of large
amount of fossil fuel, consequently resulting in adverse effects on the environment (Vaneeckhaute et
al., 2013a). In addition, the fact of continuous depletion of the P and K, which normally comes from
mining activity, urges us to find alternatives to mineral fertilizer (Vaneeckhaute et al., 2013a, Lebuf et
al., 2012, Fixen, 2009), as it was expected that the time for suffering from completed depletion of P
by this end of century (Vaneeckhaute et al., 2013a, Gerber et al., 2002, Fixen, 2009). These are the

Chapter 2. Review of Literature
5
main incentives to explore derivatives of manure and digestate as bio-based fertilizers for substituting
artificial fertilizer.
The derivatives of manure and digestate as bio-based fertilizers is attracting more attention in the
whole European region, as it can be expected that exploiting these green fertilizers could probably
decrease the fossil fuel consumption, valorize the current price of mineral fertilizer, solve the dilemma
between overproduction of manure/digestate with limited amount of arable land for disposal, and cope
with the fast depletion of P, and in final achieve sustainable development of nutrients cycle in
agriculture sector (Vaneeckhaute et al., 2013b, Vaneeckhaute et al., 2013a, Lebuf et al., 2012).
2.2. Digestate and its properties
In contrast with the manure and compost which have been extensively studied in the past, digestate
has not been thoroughly investigated yet (Nkoa, 2014, Bernal et al., 2009, Diacono and Montemurro,
2010). Recently research on digestate turned to the agronomic feasibility, other than the evaluation of
digestate stability for minimizing the detrimental influence to environment (Tambone et al., 2010,
Alburquerque et al., 2012b, Teglia et al., 2011a, Vaneeckhaute et al., 2013a). Hence, there is no
available standard for categorizing the different digestate and assessing its potential for agricultural
application (Teglia et al., 2011a). In general, digestate has lots of advantages in comparison with
manure and compost. Digestate possesses much higher inorganic N to total N ratio, decreased total
solids content, lower total and organic carbons, elevated pH value, higher concentration of total P and
K, and reduced viscosity etc. (Tambone et al., 2010, Möller and Müller, 2012).
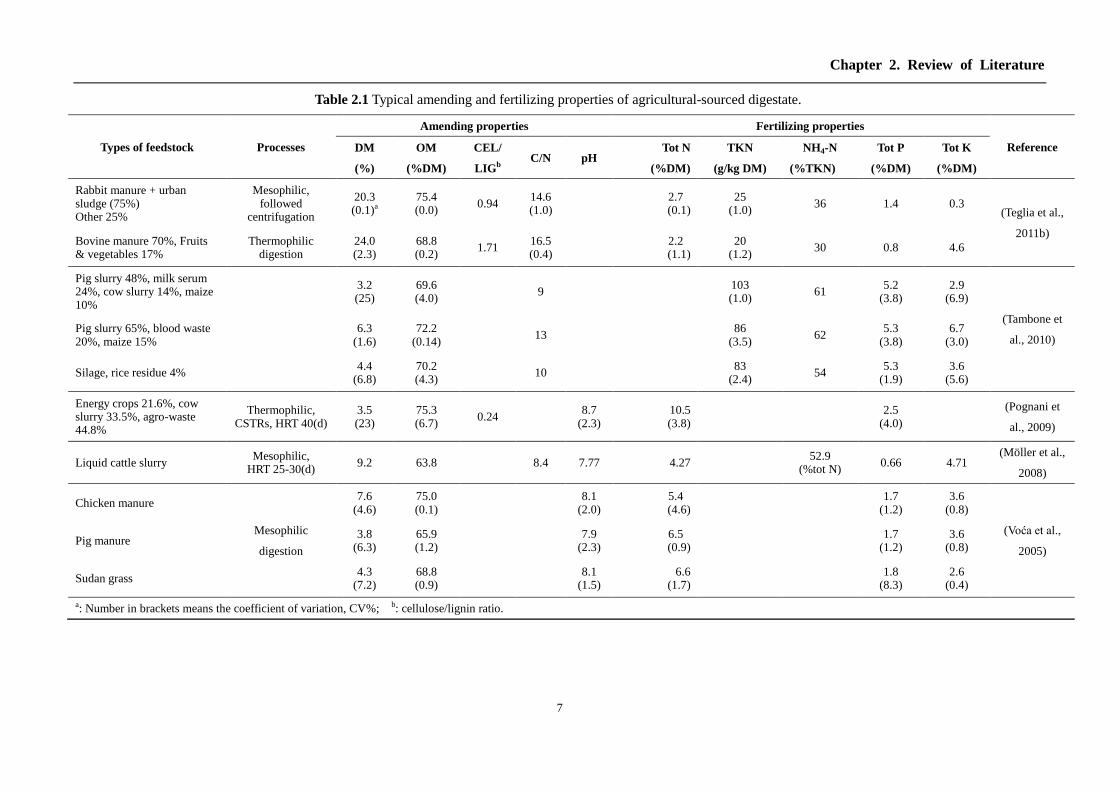
Teglia et al. (2011a) reviewed and suggested three main aspects of digestate properties: 1) organic
amendment properties such as organic matter (OM), dry matter (DM), carbon to nitrogen ratio (C/N),
etc.; 2) fertilizing effect mainly associated with contents of macro- and micro- nutrients; and 3)
innocuousness related to heavy metals (Cu, Zn, Cd, Co, Ni, Pb, etc.) and organic contaminants. Table
2.1 lists typical amending and fertilizing properties of agricultural-sourced digestate, with regard to
different AD processes and feedstock.

Chapter 2. Review of Literature
6
There is a big variation in biochemical/physical properties of digestate, which is highly dependent
upon the type of initial feedstock, the digestion process used and the configuration of the digester
(Nkoa, 2014, Möller and Müller, 2012). Big variation intervals exist in DM, total N and NH4-N as
shown in Table 2.1. OM is essential to improve or maintain the physical, chemical or biological
properties of soil, and digestate OM varies widely from 40 to more than 85% (Teglia et al., 2011a).
Cellulose/lignin or (cellulose + hemicellulose)/lignin ratios of digestate were also designated to
indicate the degree of humification of OM (Tambone et al., 2009, Teglia et al., 2011a). C/N ratio and
with respective mineral and organic portion in digestate dominate the function whether as soil
amendment or as fertilizer. Digestate with a lower C/N ratio and higher mineral N fraction is more
likely to be regarded as fertilizer. Easily available N (i.e. NH4-N) is the biggest advantage of digestate
as N fertilizer, in the range of 35-81% of total N as reviewed by Nkoa (2014). In addition, the
substantial amount of P and K in digestate supplys nutrition for crop growth, as long as the addition of
nutrients reaches the crop requirement. Aside from the pool of macro-nutrients of N/P/K, nutrients
such as Ca, Mg, Na, Cu, Zn, Fe, Mo, Co etc. in digestate can promote the crop growth, which actually
is heavily influenced by soil pH. The pH of digestate is slightly alkaline based on the available data,
which does not significantly impede the uptake by plant.
Promising though it is as fertilizer, digestate has disadvantages such as viscosity and odor, hard to
handle and transport. Besides, it may jeopardize crops and surroundings owing to its possible toxicity
(Alburquerque et al., 2012b, Arthurson, 2009). This necessitates post-treatment of digestate. Specific
nutrients demand in for example nitrate vulnerable zone or phosphorus saturated area in Flanders, also
requires the adequate treatment or selective separation of the nutrients in its raw form (Westeinde,
2009).
Chapter 2. Review of Literature
7
Table 2.1 Typical amending and fertilizing properties of agricultural-sourced digestate.
Types of feedstock Processes
Amending properties Fertilizing properties
Reference DM
(%)
OM
(%DM)
CEL/
LIGb C/N pH
Tot N
(%DM)
TKN
(g/kg DM)
NH4-N
(%TKN)
Tot P
(%DM)
Tot K
(%DM)
Rabbit manure + urban sludge (75%) Other 25%
Mesophilic, followed
centrifugation
20.3 (0.1)a
75.4 (0.0)
0.94 14.6 (1.0)
2.7 (0.1)
25 (1.0)
36 1.4 0.3 (Teglia et al.,
2011b) Bovine manure 70%, Fruits & vegetables 17%
Thermophilic digestion
24.0 (2.3)
68.8 (0.2)
1.71 16.5 (0.4)
2.2 (1.1)
20 (1.2)
30 0.8 4.6
Pig slurry 48%, milk serum 24%, cow slurry 14%, maize 10%
3.2 (25)
69.6 (4.0)
9 103 (1.0)
61 5.2
(3.8) 2.9
(6.9)
(Tambone et
al., 2010) Pig slurry 65%, blood waste 20%, maize 15%
6.3
(1.6) 72.2
(0.14) 13
86 (3.5)
62 5.3
(3.8) 6.7
(3.0)
Silage, rice residue 4% 4.4
(6.8) 70.2 (4.3)
10 83
(2.4) 54
5.3 (1.9)
3.6 (5.6)
Energy crops 21.6%, cow slurry 33.5%, agro-waste 44.8%
Thermophilic, CSTRs, HRT 40(d)
3.5 (23)
75.3 (6.7)
0.24 8.7
(2.3) 10.5 (3.8)
2.5
(4.0)
(Pognani et
al., 2009)
Liquid cattle slurry Mesophilic,
HRT 25-30(d) 9.2 63.8 8.4 7.77 4.27
52.9
(%tot N) 0.66 4.71
(Möller et al.,
2008)
Chicken manure
Mesophilic
digestion
7.6 (4.6)
75.0 (0.1)
8.1
(2.0) 5.4 (4.6)
1.7 (1.2)
3.6 (0.8)
(Voća et al.,
2005) Pig manure
3.8 (6.3)
65.9 (1.2)
7.9
(2.3) 6.5 (0.9)
1.7 (1.2)
3.6 (0.8)
Sudan grass 4.3
(7.2) 68.8 (0.9)
8.1
(1.5) 6.6
(1.7)
1.8 (8.3)
2.6 (0.4)
a: Number in brackets means the coefficient of variation, CV%; b: cellulose/lignin ratio.

Chapter 2. Review of Literature
8
2.3. Nutrient recovery from digestate and manure
2.3.1. Techniques of nutrient recovery
There are different derivatives originated from digestate/manure due to different treatment techniques.
Those techniques have been a hotspot recently, as the field of digestate processing is still quite new
and little detailed information about the performance of different technologies at industrial scale is
available (Fuchs and Drosg, 2013). The corresponding evaluation of those techniques is also rarely
reported (Fuchs and Drosg, 2013, Rehl and Müller, 2011, Helmut and Sebastian). According to Lebuf
et al. (2012), the meaning of digestate processing techniques differs from the nutrient recovery
techniques, as the latter could ―(1) create an end-product with higher nutrient concentrations than the
raw digestate or (2) separate the envisaged nutrients from organic compounds, with the aim to
produce an end-product that is fit for use in chemical or fertilizer industry or as a mineral fertilizer
replacement‖. Other classifications of relevant techniques are present in papers, such as partial
processing and completed processing (Al Seadi and Lukehurst, 2012), physical-chemical-biological
approaches (Möller and Müller, 2012).
The commonly used digestate processing techniques, based on the Inventory: techniques for nutrient
recovery from digestate (VCM, 2013), include mechanical separation, composting of the SF, thermal
drying, evaporation of the digestate/LF of digestate, biological nitrification/denitrification and
combustion/pyrolysis etc..
In terms of nutrient recovery techniques, they are currently still in developing stage, since most of
techniques have not been implemented into full industry scale yet. Acid air scrubbing is the one that
has been well-developed and adopted by many manure/digestate processing plants (Melse and Ogink,
2005, VCM, 2013), as it is an obligatory treatment after composting or drying manure/digestate, to
prevent emissions of ammonia and other noxious particles. At present, techniques such as ammonia
stripping, membrane filtration, and precipitation of phosphorus are developed into full-scale
application, though there are rare industrial examples (VCM, 2013). Other nutrient recovery
techniques have been attracting interests during the last couple of years, such as electrodialysis,
transmembrane-chemosorption, forward osmosis etc. Though most of them have been used in the

Chapter 2. Review of Literature
9
wastewater treatment sector, it is inevitable to generate new technical difficulty when transferring
these techniques into the manure/digestate domain (Lebuf et al., 2012). Also, further research in
reducing energy consumption, decreaseing the additives, improving the processes should be valued, in
order to valorize the bio-based fertilizer and make them economically feasible for end-users, i.e.
farmers.
Table 2.2 Comparison of properties between digestate (D) and its derivatives: SF digestate (SFD) and LF
digestates (LFD) separated by rotating drum, SF product after screw press of SF digestate (SPSF), and
Concentrate after reversed osmosis treatment of LF digestate (C). Number in brackets means standard
deviation (n=2), adapted from (Vaneeckhaute et al., 2012).
Products DM
(%)
EC
(mS/cm)
Tot N
(g/kg FM)
Tot P
(g/kg FM)
Tot K
(g/kg FM)
Na
(g/kg FM)
Ca
(g/kg FM)
Mg
(g/kg FM)
D 10
(0) 57
4.6
(0.4)
2.2
(0.8)
3.5
(0.9)
1.4
(0.6)
2.3
(0.1)
1.1
(0.1)
SFD 17 (1)
35 4.4
(0.0) 4.4
(1.9) 2.1
(0.2) 1.1
(0.1) 4.3
(0.1) 2.2
(0.2)
LFD 1.4
(0.0) 24
2.6 (0.3)
0.23 (0.11)
1.5 (0.1)
0.76 (0.13)
0.054 (0.002)
0.064 (0.024)
SPSF 23 (1)
24 5.7
(0.1) 6.0
(2.3) 2.1
(0.5) 1.1
(0.3) 6.3
(0.4) 2.7
(0.2)
C 7.4
(0.0) 66
7.3 (1.6)
0.42 (0.08)
2.9 (1.0)
1.0 (0.6)
0.19 (0.11)
0.13 (0.16)
2.3.2. Derivatives of manure and digestate
Derivatives, derived from manure or digestate based on different processing and nutrient recovery
techniques, vary a lot in existing form and properties, resulting in different agricultural utility as
bio-based fertilizers. For instance, Vaneeckhaute et al. (2012) separated digestate successfully with
different techniques and found different properties of derivatives from the origin digestate (Table 2.2).
Figure 2.1 displays a generally schematic overview of derivatives of manure and digestate with
current status of nutrient recovery and processing techniques. However, very few studies are till now
available concerning the research on the chemical, biochemical and biological properties of these
derivatives, nor the categorization of them (Vaneeckhaute et al., 2013a).
If not applied directly into a field, the first possible processing step of manure/digestate is a
solid-liquid separation process, leading to two derivatives, a liquid fraction (LF) and a solid fraction
(SF) (Vaneeckhaute et al., 2013a, Möller and Müller, 2012). Properties of both alternatives and
separation efficiency are highly dependent upon the types of separating systems and methods (Møller

Chapter 2. Review of Literature
10
et al., 2000, Burton and Turner, 2003, Gilkinson et al., 2007). Regardless of their different properties,
they can be utilized directly as fertilizer or still need to be stored and handled separately in order to
maximize the extraction of nutrients in the crude form and minimize the environmental side-effects
(Möller and Müller, 2012).
In general, the properties of LF of manure and LF of digestate are similar, with rather low DM and
phosphorous (P) contents and the majority of potassium (K) and inorganic nitrogen. It was estimated
that 45 – 85% of nitrogen (N) in the LF of digestate is present as ammonia nitrogen (NH4+-N) (Nkoa,
2014, Möller and Müller, 2012). Ammonia stripping is necessary for capturing the NH3, as the
NH4+-N in LF is heat-sensitive and easy to emit into the air. It results in another derivative of air
scrubber water, which consists mainly of (NH4)2SO4 (Lebuf et al., 2012). Other advanced techniques
such as membrane filtration also were reported to be used in treatment of LF of digestate, generating
new alternatives with different properties which are associated with micro- and macro- nutrients
(Vaneeckhaute et al., 2013a, Lebuf et al., 2012). It was also demonstrated that LF of digestate could
be converted into high grade liquid fertilizer through post anaerobic nitrification (Botheju et al.,
2010).
The SF of digestate tends to have higher DM content, high concentration of organic nitrogen and the
most of phosphorous (P) (Nkoa, 2014, Vaneeckhaute et al., 2013a, Möller and Müller, 2012). SF of
digestate may threaten water and air niche due to its relatively high mineral N content, which hint the
potential ammonia volatilization, leaching into the groundwater, and gaseous loss by denitrification
after nitrification during storage and handling (Möller and Müller, 2012). Therefore, post-treatments
are possible such as composting, thermal drying, combustion etc, which further develop various types
of specific derivatives (Lebuf et al., 2012). For instance, ash/biochars after pyrolysis/gasification of
solid fraction could be conducive to the extraction of P and its utilization (Lebuf et al., 2012).
Other derivatives like combination of different derivatives could function as new type of fertilizer. A
mixture of digestate (50%) and LF of digestate (50%) could be used as combined fertilizer as it could
achieve highest economic benefits while maintaining a high N and P2O5 dose, which is of important

Chapter 2. Review of Literature
11
interest in phosphorous restriction area in Europe (Vaneeckhaute et al., 2013b, Vaneeckhaute et al.,
2013a). Urea, derived from animal urine, could also be excellent alternative to artificial fertilizer due
to its effective N nutrient form (CO(NH2)2). The proper systems for collecting animal urine have also
been invented for farms, such as VedoWS system developed by Vermeulen Construct NV in Belgium.
Figure 2.1 Scheme of manure and digestate derivatives and relevant techniques
2.4. Agronomic effects of the bio-based fertilizer
2.4.1. Effects on soil properties
The complex and various properties of manure/digestate and their derivatives as well as different soil
types diversify the appraisal of agronomic effects. Short-term investigations have been conducted,
ranging from months to 2 – 3 years, while long-term investigation of the impact is still unexplored
(Nkoa, 2014). A 4-year field trial with application of different organic waste including digestate
showed few clear trends and few significant differences in chemical and microbiological properties in
soil (Odlare et al., 2008). This was in consistent with a 2-year field trial conducted by Alburquerque et
al. (2012a), who concluded that changes in soil physic-chemical characterization provoked by
digestate tended to decline with the time. Nevertheless, the analysis of long-term application of
organic fertilizer, running from several years to 15 years, has showed higher nitrogen use efficiency as
compared to those short-term applications (Gutser et al., 2005).
Organic matter (OM) can be seen as the first parameter to evaluate the soil properties, since
manure/digestate import OM directly on the arable field. Apart from its utility as a nutrient pool, OM
can improve soil aggregation, enhance nutrient retention and water holding capacity, resist to erosion
or curst, and stimulate microbial activity (Arthurson, 2009). Recalcitrant molecular such as cellulose,

Chapter 2. Review of Literature
12
hemi-cellulose and lignin, leads to formation of the humic substances by microbial reaction, further
amending soil structure (Schievano et al., 2009).
Digestate has lower C/N ratio, which inversely increases the nitrogen availability (Gutser et al., 2005).
Canali et al. (2011) confirmed that nitrogen mineralization is inversely proportion to the C/N ratio,
when comparing different organic waste in laboratory incubation. Taking account of higher
concentration of NH4-N in digestate, it would be expected to increase NH4-N content of treated soil,
and NO3-N thereof after nitrifying. Alburquerque et al. (2012a) observed that initial high NH4-N and
NO3-N concentration in the digestate treated soil decreased in the successive sampling period, and
finally no accumulation of NO3-N was found as compared with other fertilizers. Field trials performed
by Chantigny et al. (2007) showed similar residual NO3- levels on soils among the application of
digestate, raw manure and commercial fertilizer. Nitrogen leaching is one of main issues when
applying digestate into field, while Vaneeckhaute et al. (2013b) speculated the amount NO3-leaching
was not much influenced by the fertilizer types, based on the modeling of nitrogen dynamics. This
was also confirmed by Möller and Stinner (2009), in their research, where no differences of inorganic
nitrogen in the soil treated by different organic fertilizers were observed. Other reasons such as
rainfall, no cover crops were to blame for the nitrogen leaching.
Available P and available K are reported to increase in a short term application of digestate/manure
(Alburquerque et al., 2012a). Alburquerque et al. (2012a) found that digestate addition was more
effective, in terms of raising available P, than cattle manure and artificial fertilizer. Though available P
content was not significant high in the study, Odlare et al. (2008) found the available K was increased
by fertilizing digestate. Vaneeckhaute et al. (2013a) observed higher extraction efficiency of
macronutrients (P, K, Na, Ca, Mg) by NH4OAc-EDTA for digestate derivatives than for pig manure.
The author also emphasized the utility of LF of digestate, which has very high N/P ratio and can be
seen as a good strategy to alleviate P saturation problem in Flanders. In another study of the same
author, the potential of digestate/derivatives and manure as P-pool was highlighted, as P content
within these bio-fertilizers is stable (Vaneeckhaute et al., 2013b).

Chapter 2. Review of Literature
13
Results from nutrients modeling show a potential S-surplus in the soil when treated with air scrubber
water which contains high amount of S (Vaneeckhaute et al., 2013b). Heavy metals such as Cu and Zn
in digestate might be restriction for its recycling as fertilizer. The salinity, phyto-toxicity, hygiene
characteristics of variable digestate also might change the niche of soil, which requires more careful
analysis and evaluation (Alburquerque et al., 2012b).
2.4.2. Effects on crop growth and yield
Regarding the field performance of digestate, many studies have shown that similar or higher crop
yield was achieved, as compard to manure or other oganic fertilizers, while conflicting results were
obtained when compared digestate with mineral fertilizer. Montemurro et al. (2010) compared 5 kinds
of fertilizers applied to cultivate lettuce in a 3-year field experiment, and found that digestate-treated
crops reached the highest marketable yield with an increase of 52.9% compared to commercial
organic fertilizer, while no significant difference with treatment of artificial fertilizer. Another 2-year
field experiment, conducted by the same author, showed no significant differences in the dry weight
of alfalfa subjected to different fertilizer applications, including digestate and mineral fertilizer
(Montemurro et al., 2008). Bachmann et al. (2011) used co-digested slurry as fertilizer for maize and
amaranth in two types of soil (sandy and loamy), and the results demonstrated a higher maize yield
for artificial fertilizer in sandy soil, while no difference on maize yields in loamy soil occurred among
dairy slurry, digestate and mineral fertilizer. Alburquerque et al. (2012a) ascertained the watermelon
yields by utilization of digestate was comparable to the mineral fertilization in the summer periods. In
a field trail with 8 scenarios using artificial fertilizer, manure, digestate, digestate derivatives
(Vaneeckhaute et al., 2013b), the dry weight yields of maize for these scenarios were approximately
the same, 23±1 ton ha-1
. The applied derivatives in this study such as air scrubber water, LF of
digestate could function as well as the conventional fertilization (manure + artificial fertilizer).
Aside from the good performance in growth and yield that digestate brings, it was also reported that
the digestate utilization was conducive to the crop quality. Svensson et al. (2004) found higher grain
quality (i.e. N content) of oats and barley was obtained when using digestate derived from household
waste. Other finds reported digestate significantly increased the protein content of mushroom up to
57.0% and decreased the carbonhydrate content (Banik and Nandi, 2004).

Chapter 2. Review of Literature
14
Digestate and its derivatives can promote the crop growth and increase the productivity in effective
and efficient way like artificial fertilizer. Effective nitrogen is the core nutrient in the digestate. As
confirmed by Furukawa and Hasegawa (2006), using digestate resulted in effective N uptake during
growth as well harvest season of spinach and komastsuna. Odlare et al. (2008) also concluded that
higher amount of mineral N in digestate was more readily and efficiently took in by crops, in
comparison with other organic waste. Also, in the experiment of Vaneeckhaute et al. (2013b),
K-uptake in maize with the treatment of mixture of digestate and LF digestate was significantly
higher than the artificial fertilizer. The potential to improve the crop growth, yield and quality,
supports the digestate and its derivatives as a valuable substitute to artificial fertilizers. However,
appropriate storage and application methods, as well as monitoring action are necessary to guarantee
the maximum benefits from these bio-fertilizers.
2.5. Bottlenecks for the use of the bio-based fertilizer
The problems, triggered by using digestate and its derivatives as bio-based fertilizer, have been
inevitable challenge in all facets of agricultural domain, including the relative technique innovation,
fertilizer market relocation, digestate and its derivatives management, environmental issues, and the
whole agri-businesses etc.
Inorganic N can be regarded as big treasure in digestate and some kinds of derivatives, such as air
scrubber water, LF digestate, while it also threatens environment by the loss of N through the nitrate
leaching, NH3 volatilization and GHG emission (N2O) (Nkoa, 2014, Arthurson, 2009). The method of
injection was recommended into the application of digestate and air scrubber water to minimize the
NH3 loss (Nkoa, 2014, Vaneeckhaute et al., 2013a, Nyord et al., 2008). Vaneeckhaute et al. (2013a)
also suggested the addition of alkaline waste water to neutralize the pH of air scrubber water. These
methods might be considered the solutions to deal with the application problem, while others
concerned the sensitivity of the plants. Nkoa (2014) thought the trialing shoe could be the best
alternatives to distribute digestate into the field, considering the drawback of injection method with
higher cost and bigger damage to crops. Makádi et al. (2012) classified crops such as alfalfa,

Chapter 2. Review of Literature
15
sunflower, soybean into sensitive group with respect to the treatment of digestate, since they can only
treated by these bio-fertilizer in certain life stages. In order to avoid phyto-toxicity, application of
digestate should be down well in advance of sowing, avoiding direct contact with young plants or
germinating seeds (Alburquerque et al., 2012b).
Another environment concern is the problem of nutrients (N and P) leaching, of which prevention
action should be warranted. However, very few researches, at present, are available about the effect of
application of digestae on N accumulation in soil in a long-term perspective, since N immobilized in
organic form may release into soil. Odlare et al. (2008) confirmed in his 4-year field experiment that
digestate increased the rate of potential ammonia oxidation, which implicates the more production of
NO3-N. Phosphorus leaching has also received attention, since SF digestate and manure contain
abundant P and have the risk of releasing P into soil. Vaneeckhaute et al. (2013b) expected further
research on evaluating the partitioning among the different P-pools by applying these bio-fertilizers.
This sector, admittedly, has to face lot of difficulties and challenges, regardless of the N or P leaching
issues. Researches on digestate processing, nutrient recovery, storage/transportation/utilization,
entering the fertilizer market and other issues should be carrying on, in order to improve this
agricultural nutrient cycle by utilizing the digestate and its derivatives as bio-fertilizer.
2.6. Legislation of bio-based fertilizer utilization in agriculture
A sustainable development of recycling digestate as fertilizer requires well-developed legislation,
either in regulating the new fertilizer application or promoting innovative technologies. Nevertheless,
regulations associated with utilization of digestate differ according to the regions’ demands, use limits
and other political or economic factors.
Two Directives, issued by European Commission, to a large extent have influenced and changed the
fate of digestate/manure. The Nitrate Directive (1991) ―aims to protect water quality across the whole
Europe by preventing nitrate-pollution of groundwater and surface waters, and by promoting the use
of good farming practices‖ (Commission, 1991). Countries/regions in nitrate vulnerable zones should

Chapter 2. Review of Literature
16
be restricted in application of excess manure, and find solutions to cope with the dilemma between
manure overproduction and less disposable lands (Lebuf et al., 2012). The revision of the Waste
Framework Directive adopted on June 2008 (Commission, 2008), stated that ―Waste shall cease to be
waste when it has undergone a recovery (including recycling) operation and complies with specific
criteria to be developed in line with certain legal conditions. Meaning, the use of it will not lead to
overall adverse environmental or human health impacts.‖ In this context, it is imperative to explore
the new function of manure/digestate as bio-fertilizer.
National/local legislation also played an important role in framing the rules of application of
bio-based fertilizer. In the vulnerable zone Flanders in Belgium, NO3-N residue in soil is strictly
controlled below 90 kg ha-1
by the Flemish Manure Decree (Decree, 2011). Thus, the application of
high N loading manure/digestate should follow a general standard of 170 kg N ha-1
. In addition, the
Decree restricts the phosphorus application, as the current standards for maximum total P application
vary between 65 – 95 kg P2O5 ha-1
year-1
, and 80 kg ha-1
for maize in year of 2013 – 2014.
Nevertheless, in terms of digestate derivatives, no specific legislation or protocol was issued, since
they are quite new fertilizer products and less field trials performed. Vaneeckhaute et al. (2013b)
highly expected European legislation could stimulate the application of these bio-based fertilizers,
based on their good performance in field trial. Overall, legislation on utilizing digestate in agriculture
is in a developing stage, and acts as trade-off among innovative techniques, environmental
requirements and revenue of farmers.

Chapter 3. Materials and Methods
17
3. MATERIALS AND METHODS
3.1. Experimental design
3.1.1. Site description
The study was carried out at a 1 ha large sandy-loam field situated in Beitem, Roeselare (Belgium)
(50°54’51‖N, 3°07’05‖E) (Figure 3.1). The field was divided into 44 subplots of 7 m by 7 m. Eleven
different fertilization scenarios (Sc1-11) were tested in four replicate subplots (n=4) spread in the field
according to a fully randomized block design (Figure 3.2).
Figure 3.1 Experimental site situated in Beitem, Roeselare, Belgium
3.1.2. Fertilization regime and sowing
The first soil sampling before the field trial was performed on March 26, 2013. Given the
characteristics of the soil, the dosage of fertilizers was advised as 150 kg ha-1
for effective N, 70 kg
ha-1
for P2O5, and 270 kg ha-1
for K2O. Based on the Flemish Manure Decree (Decree, 2011), the
allowable dosage for P2O5 should be no more than 80 kg ha-1
when cultivating maize on non-sandy
soil.
At the end of March 2013, the fertilizers were collected and analyzed that by Provincial Research and
Advise Centre for Agriculture and Horticulture (Inagro vzw), located in Beitem, Belgium. The raw
digestate, LF of digestate and acidic air scrubber water were sampled from an anaerobic co-digestion

Chapter 3. Materials and Methods
18
plant at the site of Sap Eneco Energy, Merkem, Belgium. The feed of installation consisted of 30%
animal manure, 30% energy maize and 40% organic waste produced by the food industry. Pig manure
was collected at the pig farm of Huisman, Aalter, Belgium. Urea derived from pig urine was collected
at the pig farm of Vermeulen, Ieper, Belgium. All product samples were collected in polyethylene
bottles (2L), stored (<4°C) and analyzed to determine the required application rate for the different
cultivation treatments with respect to fertilizing advice and the Flemish Manure Decree (Decree,
2011).
On April 29, 2013, the fertilizers were applied to the field. The LF of digestate and raw digestate were
applied by PLC-injection (Bocotrance, NL). The urea derived from pig urine and acidic air scrubber
water (pH-adjusted by NaOH, ratio of 1:200) was applied to the plots by hand-application to ensure
high precision of the applied dosage. Maize seeds (KWS Saat AG maize, Atletico) were sown on 31,
April with a seed density of 100,000 ha-1
, and start fertilizers were applied.
403 406 410 411
403 404 408 407
401 405 409
308 304 307
309 306 302 303
311 305 301 310
209 206 203 202
208 204 207
210 205 211 201
103 104 107 108
102 105 109
101 106 111 110
Figure 3.2 Schematic layout of the 44 fully randomized subplots (the first number
indicates the repetition 1-4 and the last 2 numbers indicate the scenario 01-11
3.1.3. Soil sampling and crop harvest
During the growing season, soil samples were taken on three occasions (July 16, September 12 and
October 07), while plant samples were taken only at harvest time (October 4). On November 22, soil
samples were taken once again with the aim to evaluate the NO3- residue in the soil.

Chapter 3. Materials and Methods
19
At each sampling moment, soil sample was taken in three layers (0-30 cm, 30-60 cm and 60-90 cm)
by using soil core sampler. Each representative soil sample in each subplot was obtained as a mixture
of three to five random points in a diagonal line, collected in polyethylene sampling bags and
immediately conveyed to laboratory. One part of each soil sample was sealed in a polyethylene bottle
as fresh matter (FM) and stored in the freezer (-18 ℃). The other fraction of the soil sample was
air-dried at room temperature (25 ℃).
3.2. Analytical methods
3.2.1. Soil analysis
Soil samples (layer of 0 – 30 cm) during 4 sampling moments was analyzed in laboratory. Besides,
soil samples (layer of 30 – 60 cm and 60 – 90 cm) sampled on 7th October were also analyzed. To
evaluate the NO3-N residue in the soil according to the local legislation, NO3-N residues in all
three-layer soil samples taken on 11th November were measured.
pH-H2O, pH-KCl
To determine the pH-H2O, 10.0 g of air-dried soil was allowed to equilibrate for 16 h in 50 mL of
water, after stirring regularly with a glass rod. The equilibrated solution was subject to stirring and
equilibrating for minimum 30 min. The pH of the supernatant was measured using a pH glass
electrode (Model 520A, Orion, Boston, MA, USA). Soil pH-KCl was determined in a similar way by
transferring 10.0 g of air-dried soil into a 50 mL beaker with addition of 25 mL of 1M KCl solution,
stirring and equilibrating for 10 minutes before extract was measured by pH electrode.
EC (Electrical Conductivity)
10.0 g of air-dried soil was transferred into a 100 mL flask and 50 mL of deionized water was added.
After 1 hour shaking in a shaker with regular speed, the content was filtered with a filter paper
(MN640, Macherey-Nagel GmbH&Co.KG) and the filtrate was used to determine the EC of the soil
with a conductivity meter (WTW LF537 Electrode, Wissenschafltich–Technischen Werkstätten,
Weilheim, Germany) (Van Ranst, 1999)

Chapter 3. Materials and Methods
20
Dry matter (DM)
DM was determined by the difference in weight before and after drying of the fresh soil sample.
About 35.0 g of fresh soil was transferred into a paper tray and weighed with the paper tray. The
sample was put into the oven at 105 ℃ for 24 hours until the weight is constant. The dried sample
was allowed to cool and was weighed again with the paper tray.
Organic matter (OM)
±2.0000 g dry matter of soil was crushed into small particles and transferred into a tared porcelain
cup. Soil sample was incinerated at 550 ℃ for 4 hours in a muffle furnace (Nabertherm, GE). The
incinerated soil sample after cooling down was weighed together with the cup. The OM weight was
the difference in weight before and after incineration. The OM was calculated by the percentage of
OM weight in the total DM soil sample.
Mineral nitrogen (NO3-, NH4
+)
The mineral nitrogen was determined by transferring 10.0 g of fresh soil into a 100 mL flask and
adding 30 mL of 1M KCl. After 30 minutes shaking in a shaker with regular speed, the content was
filtered with a filter paper (MN640, Macherey-Nagel GmbH&Co.KG) and the filtrate was used to
determine the nitrate-N (ISO 13395: 1996) and ammonium-N (ISO 11732: 1997) by using flow
analysis (CFA and FIA) and spectrometric detection (BRAN+LUEBBE AA3, GE).
Total Kjeldahl nitrogen (TKN)
±1.0000 g of air-dried soil was transferred into digestion flask, and the flask was put under the fume
hood. 7.0 mL of a sulfuric/salicylic acid mixture was added and allowed to react for 30 minutes. Next,
0.5 g sodiumthiosulfate was added and allowed to react for 15 minutes. Finally, 5.0 mL concentrated
H2SO4, 0.2 g catalyst (a mixture of 100 g K2SO4, 20g CuSO4, 2 g Se) and 4.0 mL H2O2 were added
into the digestion flask. The flask was digested in the Bloc digestor (Vapodest 10, C. Gerhardt
GmbH&Co.KG) at 380℃ for 1 hour until the digest was clear. 30 mL of deionized water was added

Chapter 3. Materials and Methods
21
to the cooled digested product. The flask was connected to a distiller (Vapodest 10, C. Gerhardt
GmbH&Co.KG) which uses 30% (m/v) NaOH to release the NH3. NH3 was recovered in 20 mL boric
acid in a 250 mL Erlenmeyer flask, changing the indicator from wine red to blue-grey to green. The
distillate was titrated with 0.01 M HCl until the solution changed back to light wine red. A blank
steam distillation was conducted for each batch of test.
Aqua regia (Psuedo-total elements analysis)
±1.0000 g of air-dried soil was transferred into an 150 mL Erlenmeyer flask, and 2.5 mL
concentrated HNO3, 7.5 mL concentrated HCl and 2.5 mL deionized water were added. Each flask
was covered with a watch glass and allowed to react under a fume hood overnight (minimum 12
hours). Then the flasks were put above the hot plate and heated under 50 watt, 150 ℃ for 2 hours.
After cooling down, the extract was filtered on an acid-resistant filter paper (MN640,
Macherey-Nagel GmbH&Co.KG) into a 100 mL volumetric flask, which was rinsed by concentrated
HNO3 before along with the funnel. The flask was rinsed several times and the residue was transferred
to the filter paper with 1% (V/V) HNO3. Extra 1% (V/V) HNO3 was added up to the 100 mL scale.
The flask was sealed with paraffin paper.
The solution was analyzed for concentration of element K, Na, Ca, Mg, S, Cu, Zn by using
inductively coupled plasma optical emission spectroscopy (ICP-OES; Varian Vista MPX, Varian, Palo
Alto, CA, USA). Aqua regia also was used for determination of total P, based on method of Scheel
(see below). For quality control, standards were always re-analyzed 1 or 2 times in each batch of
analyses.
CaCl2 extraction for soluble K (K_SOL)
10.0 g of air-dried soil was transferred into a 150 Erlenmeyer flask, and 50 mL of 0.01 M CaCl2 was
added. The flask was placed onto an agitating table to shake for 2 hours with regular speed. The
mixture was filtered with a filter paper (MN640, Macherey-Nagel GmbH&Co.KG) and the filtrate
was collected into a polyethylene bottle. 2 – 3 drops of concentrated HNO3 were added. Concentration
of K_SOL was determined by ICP-OES. Standards were also measured as the quality control method.

Chapter 3. Materials and Methods
22
Ammonium lactate extraction for plant-available P (P_AL)
±2.5000 g of air-dried soil was transferred into a 150 mL Erlenmeyer flask, and 50 mL
ammonium-acetate lactate (0.01 M ammonium lactate (NH4CH3CH(OH)COO) and 0.40 M acetic
acid (CH3COOH)) was added. Then the mixture was shaken for 4 hours on a rotational shaker. It was
filtered with a filter paper (MN640, Macherey-Nagel GmbH&Co.KG) and the filtrate was collected in
a 50 mL beaker. Concentration of P_AL was determined by method of Scheel (see below).
Method of Scheel
Total P and plant available phosphorus was determined by method of Scheel, after aqua regia and
ammonium lactate extraction respectively. For total P, to 1.0 mL of aqua regia solution is added 5.0
mL deionized water, 2.0 mL Scheel I (1 g methol-phenol-sulphate, 5 g Na2SO3.7H2O, and 137 g
Na2S2O5 in 1 L distilled water), 2.0 mL Scheel II (50 g ammonium molybdate and 140 mL
concentrated H2SO4 in 1 L distilled water) and mixed carefully. After 15 minutes 2 mL Scheel III (205
g anhydrous sodium acetate in 1 L distilled water) are added and mixed again. After 15 minutes the
resultant color intensity is measured by a Jenway 6400 Spectrophotometer (Jenway Ltd. Felsted,
Dunmow, Essex) at wavelength of 700 nm. The standard series samples for calibration were treated in
the same way. To determine the available P, 0.5 mL ammonium acetate extract and 5.5 mL distilled
water was added and followed the same way as determination of total P.
Sodium absorption ratio (SAR)
Approximately 100.0 g of air-dried soil was transferred into 500 mL beaker and deionized water was
added with stirring until the soil became a paste, with no free water being present. The paste was left
to stand for 2 hours and subsequently transferred to a suction filter with a filter paper (MN640,
Macherey-Nagel GmbH&Co.KG). The filtrate was collected with addition of 1 – 2 drops of
concentrated HNO3 for determination of elemental content (Na, Ca and Mg) by ICP-OES. The SAR
(Lesch and Suarez, 2009) is defined as Equation (1):
SAR =[𝑁𝑎+]
√[𝐶𝑎2+]+[𝑀𝑔2+] Equation (1)
Where, all cation measurements are expressed in millimoles per liter (mmol/L).

Chapter 3. Materials and Methods
23
3.2.2. Plant analysis
Maize harvest was conducted by using maize chopper on 4th of October, and meanwhile maize yield
(fresh matter) per subplot was determined at the field. For determining dry matter of maize,
representative plant samples (6 plants) were subject to drying in oven at 55℃. After weighing, the dry
matter was squeezed into small pieces to pass a 1 mm sieve (Retsch SM-2000, GE) for chemical
analysis.
Ash contents
±1.0000 g of dry matter of maize was transferred into a tared crucible and incinerated for 4 hours at
550 ℃ in a muffle furnace. The ash weight was the difference in mass after incineration (and cooling
down) and the tared crucible. The ash content was calculated by the percentage of ash weight in dry
matter.
Total Kjeldahl nitrogen (TKN)
TKN was determined with ±0.1000 g of dry matter of maize by using the same method for the soil
analysis. One plant sample repetition in every 5 samples was also performed, in order to guarantee the
experimental quality.
Mineralization
After ashing, the porcelain crucible was placed onto the heating plate. 5 mL 6 M HNO3 was added,
and it was digested by gentle boiling until around 1 mL remains under 50 watt, 150 ℃. Next, 5 mL 3
M HNO3 was added for reheating the extract for 10 minutes. The warm solution was filtered into a 50
mL volumetric flask with an acid-resistant filter paper (MN640, Macherey-Nagel GmbH&Co.KG) by
using a glass rod to assure a quantitative transfer. The crucible and rod were rinsed several times with
1% (V/V) HNO3, and the residue on filter paper was recovered. The filtrate was allowed to cool down
and diluted to 50 mL with 1% (V/V) HNO3. The flask in the end was sealed with paraffin paper. The
extract was used for determination of the element P, K, Na, S, Ca, Mg, Cu, Zn. Element P in aqua
regia was quantified by method of Scheel (the same as the soil sample with the ratio of 1:10), while
Chapter 3. Materials and Methods
24
the other elements were measured by ICP-OES. Standard was also introduced in each batch of
analysis, and only when the measured standard concentrations were within 95 to 105% of the nominal
value retained the results.
Open microwave digestion
In order to determine S content of maize, ±0.2000 g of dry matter maize was transferred into a 50
mL polyethylene tube with lid. After adding 2.5 mL concentrated HNO3 and 2.5 mL (30% V/V) H2O2,
the tube sealed with lid was left overnight. The lid was unfastened a little bit before putting into the
microwave (CEM MARS 5, BE). The sample was destructed under 1200 watt, 200 ℃ for 1 hour and
after allowed to cool down. Mill-Q water (produced by MilliPAK 40) was added to dilute the treated
solution to 50 mL. The solution was filtered with before ICP-OES determination. Standard solution
and certified plant references were introduced to guarantee the quality.
3.3. Data processing methods
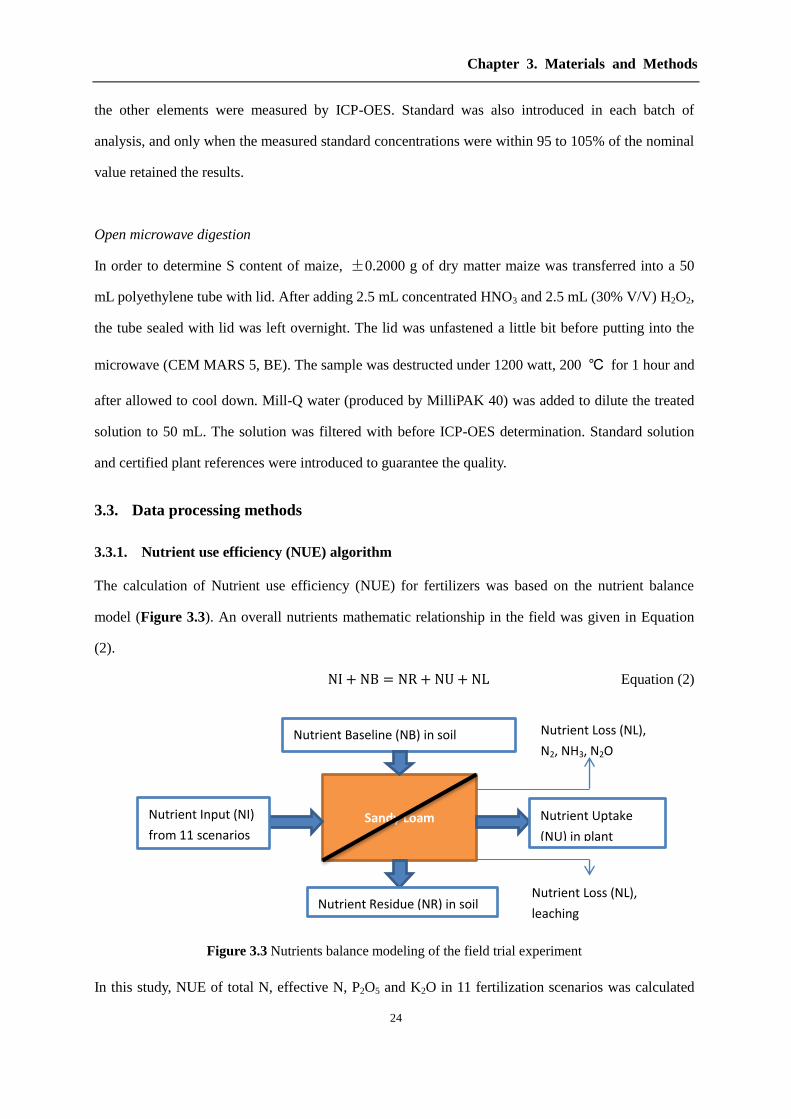
3.3.1. Nutrient use efficiency (NUE) algorithm
The calculation of Nutrient use efficiency (NUE) for fertilizers was based on the nutrient balance
model (Figure 3.3). An overall nutrients mathematic relationship in the field was given in Equation
(2).
NI + NB = NR + NU + NL Equation (2)
Figure 3.3 Nutrients balance modeling of the field trial experiment
In this study, NUE of total N, effective N, P2O5 and K2O in 11 fertilization scenarios was calculated
Sandy Loam Nutrient Input (NI)
from 11 scenarios
Nutrient Baseline (NB) in soil
Nutrient Uptake
(NU) in plant
Nutrient Residue (NR) in soil Nutrient Loss (NL),
leaching
Nutrient Loss (NL),
N2, NH3, N2O

Chapter 3. Materials and Methods
25
by Equation (3).
NUE (%) =𝑁𝑈
𝑁𝐼× 100% Equation (3)
Where, NI is expressed as total N, effective N, P2O5 and K2O fertilizer applied in each treatment (kg
ha-1
); NU is N/P/K uptake in crop (kg ha-1
), and it was necessary to convert P to P2O5, K to K2O
before using Equation (3).
3.3.2. Statistical analysis
Data of different parameters with respect to different scenarios measured were subjected to General
Linear Model (GLM) by using SAS (version 9.2). PROC GLM procedure was used to determine the
effect of variable fertilization treatments on plant yield (fresh matter and dry matter), plant nutrients
uptake (N, P, K, S, Na, Ca, Mg, Cu, Zn), nutrient use efficiency for N-P-K, soil nutrient residues (N,
NO3-N, NH4-N, P, P-AL, K, K-SOL, S, Na, Ca, Mg, Cu, Zn) as well as soil parameters such as
pH-H2O, pH-KCl, EC, organic matter, organic carbon, and SAR.
Scenario and Block were chosen as fixed factors in PROC GLM procedure, since the field
experiment was initially set as a Randomized Complete Block Design (RCBD) with 11 treatment
scenarios and 4 blocks. The normal distribution was checked by Shapiro-Wilk’s test with PROC
UNIVARIATE procedure. Homoscedasticity was checked by Levene’s test by choosing Scenario as
the unique fixed factor (Homoscedasticity can only be tested with one fixed factor). Means statement
was used to perform multiple comparisons only for fix factor of Scenario. Lsmeans statement was
used to certify the direction of overall significant terms. The multiple comparisons were performed by
Tukey’s (HSD) test for all scenarios, and Dunnett’s test for testing if any treatments are significantly
different from the control group. Tukey-Kramer test was used in the condition that the group sizes
are unequal. Conventional transformations (log, square root, arsin, reverse, and log10) were
introduced if non-normality and/or heteroscedasticity were obtained. A nonparametric Friedman’s
test was introduced, since the residuals were not normally distributed and homogeneous after
applying all conventional transformations. The Friedman’s test was realized by PROC FREQ
procedures together with PROC SORT and PROC RANK procedures. The SAS codes can be found
in the appendix 1.

Chapter 4. Results
26
4. RESULTS
4.1. Characterization of soil nutrient baseline (NB) and bio-based fertilizers
4.1.1. Characteristics of soil nutrients baseline before field experiment
Table 4.1 presents the nutrients baseline (NB) of the field experiment. The results showed higher
concentration of plant-available P (P-AL) and Mg (Mg-AL) for crops in this field compared to the
favorable ranges, which could be seen as the result of many years of extensive mineral and organic
fertilizer application in this zone. However, this land possessed rather lower contents of
plant-available Na and S, but contained appropriate plant-available K (K-AL). Organic carbon (OC)
content was quite favorable for crops planting. Only 26 kg ha-1
NO3-N was present in soil layer 0 – 90
cm (Table 4.2), which is far from the restrict limit of 90 kg ha-1
according to the Flemish Legislation.
However, baseline for NH4-N was not clearly specified in this field with scope lower than 18 kg ha-1
.
Table 4.1 Characteristics of soil in the field trial before applying fertilizers
Parameter Analysis Target zone Limit Rating
Texture Sandy loam
pH-KCl 6.3 5.5 – 6 5.50 Favorable
OC (% C on DM) 1.2 1 – 1.5 0.90 Favorable
P-AL (mg kg-1 DM) 363 120 – 200 High
K-AL (mg kg-1 DM) 191 140 – 230 Favorable
Mg-AL (mg kg-1 DM) 185 90 – 160 Rather high
Ca-AL (mg kg-1 DM) 1633 1020 – 2680 Favorable
Na-AL (mg kg-1 DM) <20 31 – 67 Rather low
S-AL (mg kg-1 DM) 11 23 – 30 Rather low
AL: using ammonium-lactate extraction method
Table 4.2 Soil NO3-N and NH4-N baseline in the field trial before applying fertilizers
Soil layer NO3-N (kg ha-1) NH4-N (kg ha-1)
0 – 30 cm 9 <6
30 – 60 cm 8 <6
60 – 90 cm 9 <6
4.1.2. Physical-chemical properties of bio-based fertilizers
Table 4.3 lists the physical-chemical properties of different bio-based fertilizers used in this study.

Chapter 4. Results
27
Manure and digestate have good amending property since both of them have high DM and OM
contents. Contents of Ca, Mg, P are highest for manure. Most values of parameters for digestate are
lower than manure, except for K2O. LF of digestate possesses higher NH4-N and K2O contents,
making it a potential substitution for N-K-fertilizer. It is notable that the NH4-N content is the highest
for air scrubber water, up to 71.74 g kg-1
FM. Urea could be used as N-K-fertilizer. The N/P/K ratio is
4/1/2 for manure, 5/1/4 for LF of manure, 3.9/1/3.6 for digestate and 12.6/1/8.3 for LF of digestate.
Table 4.3 Physical-chemical properties of bio-based fertilizers
Parameter Manure LF of
manure Digestate
LF of
digestate
Air scrubber
water Urea
DM (g kg-1 FM) 100 85.99 35
OM (g kg-1 FM) 75 60.85 15.5
C/N 6.2 6.9 1.4 4.0
TKN (g kg-1 FM) 6.8 4.6 4.91 6.3 64.7 3.7
NH4-N (g kg-1 FM) 3.9 2.2 1.40 5.4 71.74 2.8
P2O5 (g kg-1 FM) 3.9 2.1 2.88 1.14 <0.06 0.23
K2O (g kg-1 FM) 4.2 4.63 5.41 5.0 0.22 3.8
Na2O (g kg-1 FM) 1.2 1.01 4.5 0.19
CaO (g kg-1 FM) 4.6 2.90 0.19 0.37
MgO (g kg-1 FM) 1.98 1.49 0.178 0.10
4.1.3. Fertilizers dosage for 11 scenarios and nutrient input (NI) in the field
After analyzing the properties of each bio-based fertilizer, the required dosage of each of them was
calculated according to the fertilizer advice and legislative restriction for phosphorus, as listed in
Table 4.4. Scenario 1 (Sc1) was set as reference which uses conventional fertilizer practice (artificial
fertilizers + manure) to cultivate maize. Different fertilizer combinations were applied in the other 10
scenarios (Sc2-11). Air scrubber water was used in Sc2-3 as a substitute for artificial (start) fertilizers.
In Sc4-6, digestate, mixture of digestate (40%)/LF digestate (60%) and air scrubber water were
applied to replace artificial fertilizer and manure. In Sc7-11, LF of digestate, LF of manure and urea
were dosed as alternatives of artificial fertilizers. The nutrients input (NI) for total N, effective N,
P2O5, K2O were calculated and showed in Table 4.5.

Chapter 4. Results
28
Table 4.4 Dosage of bio-based fertilizers and artificial fertilizers for the 11 scenarios
Scenarios
Artificial start
fertilizer
(kg ha-1)
Pig
manure
(ton ha-1)
Artificial
fertilizer
(kg ha-1)
Air scrubber
water
(l ha-1)
Mixture
digestate/
LF digestate
(ton ha-1)
Digestate
(ton ha-1)
LF of
digestate
(ton ha-1)
LF of
manure
(ton ha-1)
Urea
(ton ha-1)
K2O
fertilizer
(kg ha-1)
Sc1 45 16 39 183
Sc2 45 16 970 183
Sc3 16 2125 183
Sc4 33 32 42
Sc5 45 31 16 121
Sc6 1925 16 121
Sc7 24 14 19 96
Sc8 14 600 19 96
Sc9 14 25 191
Sc10 24 14 19 106
Sc11 14 600 19 106
Table 4.5 Nutrient input (NI) of total N, effective N, P2O5 and K2O for the 11 scenarios
NI (kg ha-1) Sc1 Sc2 Sc3 Sc4 Sc5 Sc6 Sc7 Sc8 Sc9 Sc10 Sc11
Total N 192.8 222.7 259.7 179.2 155.5 216.2 238.9 257.5 187.7 204.3 222.9
Effective N 149.3 179.2 216.2 107.5 123.7 184.4 152.9 171.5 149.6 132.2 150.8
P2O5 62.4 62.4 62.4 64.5 46.7 46.7 76.3 76.3 54.6 58.9 58.9
K2O 250.0 250.0 250.0 250.0 250.0 250.0 250.0 250.0 250.0 250.0 250.0

Chapter 4. Results
29
4.2. Biomass yield (fresh matter and dry matter)
Differences for biomass yield, either in fresh matter (FM) or dry matter (DM), were not statistically
significant amongst 11 scenarios (Figure 4.1 and Figure 4.2). However, the 11 fertilization treatments
had the tendency to affect the biomass yield, since the p-values are quite low, which are 0.0867 and
0.0826 for fresh matter and dry matter respectively. Dunnett test (setting Sc1 as control) indicated a
significant difference (p<0.05) in fresh matter between reference Sc1 (74.0±3.8 ton ha-1
) and Sc4
(80.0±2.4 ton ha-1
) at the 0.05 level, while no significant difference was found with the Tukey (HSD)
test. For dry matter, Dunnett test did not find significant difference between Sc1 and other scenarios.
Figure 4.1 Fresh matter of biomass yield for the 11 fertilization scenarios at harvest time on October 4, (ns)
means no significance was observed among 11 scenarios through Tukey’s (HSD) test (n=4).
Figure 4.2 Dry matter of biomass yield for the 11 fertilization scenarios at harvest time on October 4, (ns)
means no significance was observed among 11 scenarios through Tukey’s (HSD) test (n=4).
0
10
20
30
40
50
60
70
80
90
Sc1 Sc2 Sc3 Sc4 Sc5 Sc6 Sc7 Sc8 Sc9 Sc10 Sc11
FM o
f b
iom
ass
yiel
d (
ton
ha-1
)
(ns)
0
5
10
15
20
25
30
Sc1 Sc2 Sc3 Sc4 Sc5 Sc6 Sc7 Sc8 Sc9 Sc10 Sc11
DM
of
bio
mas
yie
ld (
ton
ha-1
)
(ns)

Chapter 4. Results
30
4.3. Nutrient use efficiency (NUE)
4.3.1. N-P-K Nutrients uptake (NU) in maize
The total amount of N, P and K uptake by maize for each scenario is presented in Figure 4.3. General
Linear Model (GLM) results (0.05<p<0.1) indicated the potential effect of 11 fertilization scenarios
on the N uptake (Figure 4.3, A). It was observed that the harvested maize in Sc2 had the highest
content of N (325±27 kg ha-1
), while no statistically significant differences were observed among the
scenarios, except Sc7 (265±31 kg ha-1
) at the 0.05 level. For nutrient p uptake (Figure 4.3, B), the
low p-value (0.05<p<0.1) also showed that fertilization scenarios tended to impact the P uptake in
maize. Though P content in maize for Sc7 was the lowest again, but not significantly different from
the other scenarios at the 0.05 level. The average of K content in maize for 11 scenarios were quite
similar, and no statistically significant differences could be indicated (p>0.05) (Figure 4.3, C).
0
50
100
150
200
250
300
350
400
Sc1 Sc2 Sc3 Sc4 Sc5 Sc6 Sc7 Sc8 Sc9 Sc10 Sc11
NU
of
N in
mai
ze
(kg
ha-1
)
ab a
ab ab
ab ab ab b ab
ab ab
A
0
5
10
15
20
25
30
35
40
45
50
Sc1 Sc2 Sc3 Sc4 Sc5 Sc6 Sc7 Sc8 Sc9 Sc10 Sc11
NU
of
P in
mai
ze
(kg
ha-1
)
B (ns)

Chapter 4. Results
31
Figure 4.3 Nutrient uptake of N/P/K for the 11 scenarios at harvest time in October. Treatments with the
same letter are not significantly different at the 0.05 level. (ns) means no significance was observed among
11 scenarios through Tukey’s (HSD) test (n=4).
4.3.2. Nutrient use efficiency for N-P-K fertilizers
All the values of NUE for total N, effective N, P2O5, K2O fertilizers in 11 scenarios were bigger than
100% (Table 4.6), which indicates that nutrients supplied by fertilizers could not satisfy the growth
demand of maize. There was a statistically strong effect (p<0.001) of the 11 fertilization scenarios on
NUE of total N, effective N and P2O5 NUE, while no significant differences (p>0.05) were observed
among all scenarios for NUE of K2O at the 0.05 level.
For NUE of total N, Sc5 has a significantly highest use efficiency, up to 189%, compared to the other
scenarios including reference Sc1 with the Tukey HSD test (p<0.001). Analytical results also showed
significantly lower total N use efficiency (p<0.001) for Sc3, Sc7 and Sc8 when comparing with Sc1.
Remarkable difference (p<0.001) was obtained between Sc2 and Sc3, where Sc2 showed significantly
higher value than Sc3. There was no significant difference among Sc7-11 at the 0.01 level by Tukey
(HSD) test, though Sc7 was significantly different from Sc9 at the 0.05 level. Different results were
obtained in the case of NUE for effective N, which demonstrated NUE for Sc4 was significantly
higher than other scenarios, except for Sc5. In comparison with control group of Sc1, effective N
NUE for Sc3 was significantly lower.
For NUE of P2O5, Sc5-6 was significantly higher than other scenarios at the 0.05 level of significance,
while no significant difference exists between Sc5 and Sc6. P2O5 use efficiency for Sc7-8 was
0
50
100
150
200
250
300
350
Sc1 Sc2 Sc3 Sc4 Sc5 Sc6 Sc7 Sc8 Sc9 Sc10 Sc11
NU
of
K in
mai
ze
(kg
ha-1
)
C (ns)

Chapter 4. Results
32
significantly lower than Sc9-11. Dunnett test showed significant lower P2O5 use efficiency for Sc7-8
than Sc1 at the 0.05 level.
Table 4.6 Comparison of NUE for the 11 scenarios after maize harvest in October (n=4).
NUE (%) Sc1 Sc2 Sc3 Sc4 Sc5 Sc6 Sc7 Sc8 Sc9 Sc10 Sc11 p-value
Total N 155±13
b 146±12
bc 113±9
ed 157±6
b 189±19
a 138±10
bcde 111±13
e 118±9
cde 142±12
bcd 136±16
bcde 138±5 bcde
p<0.001
Effective
N
200±17 bcd
182±15 cd
136±11 e
262±10 a
238±24 ab
162±11 de
173±20 cd
177±14 cd
179±15 cd
210±25 bc
204±8 bc
p<0.001
P2O5 147±19
bc 144±10
bc 132±6
bcd 136±7
bc 197±18
a 190±10
a 101±9
d 121±3
cd 159±14
b 157±15
b 157±10
b p<0.001
K2O 130±17 129±9 126±6 128±8 125±17 126±6 131±6 134±14 130±5 126±11 123±9 p>0.05
Note: Treatments with the same letter are not significantly different at the 0.05 level with Tukey’s (HSD) test.
4.3.3. Other nutrient uptake in maize
Table 4.7 shows the nutrients (Na, S, Ca, Mg, Cu, Zn) contents in maize. For Na proportion in
harvested maize, big variation and standard deviation were found in 11 treatments, and no statistically
significant differences (p>0.05) were observed. Likewise, the variable treatments of 11 scenarios did
not affect the S content in maize in a statistically significant way (p>0.05). Similar results (p>0.05)
were also found in statistical analyses of Ca and Mg content in maize. In terms of heavy metals Cu
and Zn, also as micro-nutrients of maize, no statistically clear differences were observed amongst the
11 treatments with regard to Cu content in maize. However, diversified fertilization treatments
showed the potential (p<0.05) to affect crop Zn concentration, but Tukey’s (HSD) test found no
differences among the scenarios.

Chapter 4. Results
33
Table 4.7 Nutrient uptake of Na, S, Ca, Mg, Cu, Zn in maize for the 11 scenarios (n=4)
Nutrient
uptake
(kg ha-1)
Sc1 Sc2 Sc3 Sc4 Sc5 Sc6 Sc7 Sc8 Sc9 Sc10 Sc11 p-value
Na 2.69
±0.60 2.66
±0.76 2.88
±0.33 4.52
±1.23 2.95
±0.64 3.30
±0.61 2.79
±0.51 3.38
±1.04 3.59
±0.74 2.64
±0.45 2.95
±0.65 p>0.05
S 17.7 ±0.6
19.3 ±1.3
18.5 ±1.3
18.1 ±1.7
18.5 ±1.8
18.9 ±1.7
16.8 ±1.2
19.1 ±0.6
17.4 ±2.1
18.0 ±1.3
19.2 ±1.4
p>0.05
Ca 30.7 ±2.6
33.2 ±3.8
31.6 ±1.4
32.8 ±3.4
33.0 ±6.2
29.7 ±2.2
30.1 ±2.5
31.4 ±3.0
32.6 ±3.6
31.6 ±0.8
27.4 ±1.7
p>0.05
Mg 25.3 ±2.5
28.1 ±2.5
25.7 ±1.5
25.5 ±1.7
25.3 ±3.6
26.0 ±2.2
24.1 ±0.8
26.4 ±2.3
24.1 ±2.2
25.2 ±1.9
25.5 ±2.2
p>0.05
Cu 0.09 ±0.01
0.09 ±0.01
0.08 ±0.01
0.10 ±0.01
0.09 ±0.01
0.09 ±0.01
0.09 ±0.01
0.09 ±0.01
0.08 ±0.01
0.09 ±0.01
0.08 ±0.01
p>0.05
Zn 0.41 ±0.07
0.50 ±0.06
0.46 ±0.03
0.39 ±0.03
0.38 ±0.06
0.46 ±0.05
0.40 ±0.04
0.48 ±0.05
0.43 ±0.04
0.40 ±0.05
0.47 ±0.09
p<0.05
4.4. Soil nutrients residue (NR) analysis
4.4.1. Mineral nitrogen (NO3-N and NH4-N) and organic nitrogen (TKN) in soil
Figure 4.4 shows that NO3-N residues in soil layer 0 – 90 cm for all 11 scenarios were lower than 90
kg ha-1
at the end of cropping season as stated in the Flemish Manure Decree (Decree, 2011). The
highest NO3-N residue was observed in Sc3 with an average value of 35±7 kg ha-1
. One noticeable
portion was that NO3-N contents in deeper layer (30 – 60 and 60 – 90 cm) were bigger compared to
the first soil layer. The contents of NH4-N in soil layer 0 – 90 cm were in the normal range (20 – 30
kg ha-1
) for all scenarios. Both NO3-N and NH4-N residues in each soil layer showed rather high
variation and standard deviation. Statistical analysis (p>0.05) indicated NO3-N and NH4-N residues in
0 – 90 cm soil were not significantly affected by the variable treatments. This was confirmed by
analysis of NO3-N and NH4-N contents in each soil layer, as p-value were higher than 0.05.
The change of mineral nitrogen (NO3-N and NH4-N) contents in soil layer of 0 – 30 cm during the
whole field experiment period was displayed in Figure 4.5. NO3-N content in soil decreased
dramatically during the first monitoring moment in July and second in September. The soil NO3-N
residue was slightly higher for the third moment (just after harvest activity) compared to the second
moment in September, and became stable with low concentration in November. However, soil NH4-N
residues behaved in a totally opposite way, as it changed to higher in September than in July. The

Chapter 4. Results
34
concentration of NH4-N in soil was lower in October and November. No significant effects (p>0.05)
of variable fertilization treatments on mineral nitrogen contents in each of sampling stage, except for
NO3-N contents on September 12 (p<0.001) and in October 7 (p<0.01). On September 12, there was a
significant difference for NO3-N residue between Sc3 and Sc4, where NO3-N was higher for Sc3. No
significant differences were found among the other scenarios. However, Dunnett’s test showed NO3-N
residue for Sc4 was significant lower when using Sc1 as control group at the 0.05 level. On October 7,
there was unexpected high soil NO3-N concentration for Sc3, but it only showed significant difference
compared to Sc5 and Sc9, due to high variation and deviation of the test results. Finally, no significant
effects (p>0.05) of these bio-based fertilizers on organic nitrogen residue in soil (0 -30 cm) were
observed during the whole cropping season (Appendix 2). There was an apparent decline of organic
nitrogen in soil layer during the 4 sampling moments.
Soil (0 – 30 cm) Soil (30 – 60 cm) Soil (60 – 90 cm) Soil (0-90 cm)
NO3-N p>0.05 p>0.05 p>0.05 p>0.05
NH4-N p>0.05 p>0.05 p>0.05 p>0.05
Figure 4.4 NO3-N and NH4-N contents in soil 0-90 cm for the 11 scenarios at post-harvest time on
November 22, data of each soil layer for each parameter was performed with GLM analysis, (n=4).
31 30
35 35
28
33 33 33
26
23
30 29 26
20 23 25
28 28
21
24 24
30
0
5
10
15
20
25
30
35
40
Sc1 Sc2 Sc3 Sc4 Sc5 Sc6 Sc7 Sc8 Sc9 Sc10 Sc11
NO
3-N
an
d N
H4-
N in
so
il (k
g h
a-1)
NO3-N (60-90cm) NO3-N (30-60cm) NO3-N (0-30cm)
NH4-N (60-90cm) NH4-N (30-60cm) NH4-N (0-30cm)

Chapter 4. Results
35
Figure 4.5 Mineral nitrogen concentrations in soil (0-30 cm) for the 11 scenarios during all monitoring moments. Data of each moment was subject to GLM
analysis, and treatments with the same letter are not significantly different at the 0.05 level (n=4).
0
5
10
15
20
25
30
16/07/2013 (p>0.05) 12/09/2013 (p>0.05) 07/10/2013 (p>0.05) 22/11/2013 (p>0.05)
NH
4-N
(kg
ha-1
)
ab ab
ab ab
a
a
c
ab
bc
b bc
ab
bc ab
ab ab
bc b abc
ab ab ab
0
20
40
60
80
100
120
140
160
16/07/2013 (p>0.05) 12/09/2013 (p<0.001) 07/10/2013 (p<0.01) 22/11/2013 (p>0.05)
NO
3-N
(kg
ha-1
)
Sc1 Sc2 Sc3 Sc4 Sc5 Sc6 Sc7 Sc8 Sc9 Sc10 Sc11

Chapter 4. Results
36
4.4.2. Total phosphorus (P) and available phosphorus (P-AL) in soil
According to the GLM analysis, the 11 fertilizers treatments inclined to pose impacts on total
phosphorus (P) (0.05< p=0.0999< 0.1), but had no significant effects on available phosphorus (P-AL)
(p>0.05) in the soil layer 0 – 90 cm after maize harvest on October 4 (Figure 4.6). P content in 0 – 90
cm soil for Sc5 was significantly higher compared to Sc2, while both of them were not significantly
different from the other scenarios at the 0.05 level. In the soil layer 0 – 30 cm, no statistically
significant differences (p>0.05) were obtained for P and P-AL content among the 11 scenarios.
However, variable fertilizer treatments had a significant effect on P content in the soil layer 30 – 60
cm and 60 – 90 cm with p-values of 0.0125 and 0.0178 respectively. It is remarkable that P content for
Sc5 was significant higher than for Sc2 and Sc4 in both two soil layers of 30 – 60 cm and 60 – 90 cm.
For P-AL content, no significant differences (p>0.05 for 30-60 cm, p>0.05 for 60-90 cm) were found
among the scenarios in these two soil layers.
P and P-AL residues in soil layer of 0 – 30 cm for four monitoring moments are displayed in Table
4.8 and Figure 4.8. Soil P-AL residues for 11 scenarios in October were a little lower than the
Nutrient Baseline (NB), 363 mg kg-1
DM soil. It also can be seen that no big variation of soil P and
P-AL concentration along with the 4 monitoring moments. Compared to September 12, average P
concentration in each scenario on October 7 was higher but with lower extractable (available for crop)
ratio, resulting lower P-AL content in soil. This was due to the maize harvesting activity which halts
the P uptake from soil. There were no statistically significant differences for P and P-AL residues
during growing season, at harvest and post-harvest time, as all p-value are bigger than 0.05.
Noticeably, fertilization treatments had a tendency to affect the P-AL during growing season in July
(p=0.0704) and post-harvest time in November (p=0.0626). Tukey HSD test indicated P-AL in soil
layer 0 – 30 cm for Sc8 was significant higher than Sc11 on November 22.
4.4.3. Total potassium (K) and available potassium (K-SOL) in soil
In terms of total potassium (K) and available potassium (K-SOL) in the soil layer 0 – 90 cm in
October (Figure 4.7), no statistically significant differences (p>0.05) were resulted among the 11
different scenarios. This was in consistent with the separately analytical results for K and K-SOL
residues in each soil layer, which showed that all the p-values are bigger than 0.05.

Chapter 4. Results
37
Total potassium (K) and available potassium (K-SOL) contents in the 0 – 30 cm soil layer for all four
monitoring moments are shown in Table 4.9 and Figure 4.9. It also can be seen that soil K-SOL
contents in September were lower than in July as the great demand of K for maize growth. The
extraction ratio for K-SOL decreased gradually after the crop harvest. No significantly differences
(p>0.05) were obtained for K in soil layer 0 – 30 cm among the 11 different fertilization treatments
during the whole life time of maize and after harvest time. Nevertheless, variable treatments had
significant effect (p=0.0428<0.05) on K-SOL in soil layer 0 – 30 cm during growing season in July,
while Tukey (HSD) test results showed no significant difference at the 0.05 level due to the high
standard deviation of the data, however Dunnett’s test displayed K-SOL content for Sc4 was
significantly higher (p<0.05) when comparing to reference Sc1. The effects of fertilizer treatments on
K-SOL faded away in the growing season in September (p=0.0523) and no significant differences
were observed at the harvest in October and post-harvest time in November.
4.4.4. Other nutrients residues
Nutrients residues of Na, S, Ca, Mg, Cu, Zn in soil layer 0 – 30 cm for all four monitoring moments
are presented in Appendix 3. It was shown that the 11 different fertilization treatments had no
significant effects on the nutrients residues for Na, Ca, Mg, Cu and Zn during the whole growing
season, harvest and post-harvest periods. However, significant effects of fertilizers posed on S
residues in soil were observed in July (p<0.001), September (p<0.001) and October (p<0.05). In July,
the average S residue in soil was the highest for Sc3 and the lowest for Sc1. Soil S contents in Sc3 and
Sc6 were significant higher than Sc1 and Sc7. No significant differences were resulted among Sc2-3,
Sc6, Sc8 and Sc11, where air scrubber water was applied as N-S-fertilizer. In September, there was a
remarkable difference between Sc3, Sc6 and Sc8 compared to Sc1. While in October, only S residue
in soil for Sc3 was significantly different from Sc1. Finally, no statistically significant differences
were found in November for S residue in soil (p>0.05).

Chapter 4. Results
38
Soil (0 – 30 cm) Soil (30 – 60 cm) Soil (60 – 90 cm) Soil (0-90 cm)
P p>0.05 p<0.05 p<0.05 p=0.0999
P-AL p>0.05 p>0.05 p>0.05 p>0.05
Figure 4.6 Total phosphorus (P) and plant-available phosphorus (P-AL) contents in 3 layers (0-90cm) of
soil for the 11 scenarios on October 7. Data of each soil layer for each parameter was performed with GLM
analysis (n=4).
Soil (0 – 30 cm) Soil (30 – 60 cm) Soil (60 – 90 cm) Soil (0-90 cm)
K p>0.05 p>0.05 p>0.05 p>0.05
K-SOL p>0.05 p>0.05 p>0.05 p>0.05
Figure 4.7 Total potassium (K) and soluble potassium (K-SOL) contents in 3 layers (0-90cm) of soil for
the 11 scenarios on October 7. Data of each soil layer for each parameter was performed with GLM
analysis (n=4).
0
200
400
600
800
1000
1200
1400
1600
Sc1 Sc2 Sc3 Sc4 Sc5 Sc6 Sc7 Sc8 Sc9 Sc10 Sc11
P a
nd
P-A
L co
nte
nts
in s
oil
(m
g kg
-1)
P (60-90cm) P (30-60cm) P (0-30cm) P-AL (60-90cm) P-AL (30-60cm) P-AL (0-30cm)
ab b ab ab
a ab
ab ab ab ab ab
0
100
200
300
400
500
0
1000
2000
3000
4000
5000
6000
7000
8000
Sc1 Sc2 Sc3 Sc4 Sc5 Sc6 Sc7 Sc8 Sc9 Sc10 Sc11
K-S
OL
con
ten
t in
so
il (m
g kg
-1 D
M)
K c
on
ten
t in
so
il (m
g kg
-1 D
M)
K (60-90cm) K (30-60cm) K (0-30cm) K-AL (60-90cm) K-AL (30-60cm) K-AL (0-30cm)

Chapter 4. Results
39
Table 4.8 Total phosphorus (P) and extraction ratio (by AL) in soil layer of 0 – 30 cm for the 11 scenarios during all monitoring moments (n=4)
Figure 4.8 Plant-available phosphorus (P-AL) concentrations in soil (0-30 cm) for the 11 scenarios during all monitoring moments. Data of each moment was
subject to GLM analysis, and treatments with the same letter are not significantly different at the 0.05 level (n=4). The red line indicates the baseline of P-AL in soil
layer of 0 -30 cm (363 mg kg-1
DM).
ab ab
ab ab ab
ab ab
a ab
ab
b
0
50
100
150
200
250
300
350
400
450
500
16/07/2013 (0.05<p<0.1) 12/09/2013 (p>0.05) 07/10/2013 (p>0.05) 22/11/2013 (0.05<p<0.1)
P-A
L (m
g kg
-1 D
M)
Sc1
Sc2
Sc3
Sc4
Sc5
Sc6
Sc7
Sc8
Sc9
Sc10
Sc11
Date Parameter
(mg kg-1 DM) Sc1 Sc2 Sc3 Sc4 Sc5 Sc6 Sc7 Sc8 Sc9 Sc10 Sc11 p-value
16/07 P 757±57 674±80 716±12 729±44 729±25 730±43 718±47 735±26 727±37 773±44 723±16 p>0.05
Extractable (%) 52±8 50±6 55±3 56±4 57±3 58±4 54±5 51±7 55±4 54±4 59±7
22/09 P 724±53 706±28 715±35 740±26 741±48 720±55 717±34 721±22 703±29 734±39 730±13 p>0.05
Extractable (%) 57±4 51±5 50±4 56±4 54±10 57±7 53±8 53±9 56±6 54±5 53±5
07/10 P 752±36 782±107 740±25 765±18 761±36 775±67 736±29 760±11 736±38 748±35 739±40 p>0.05
Extractable (%) 43±2 44±1 47±7 47±0 48±2 44±7 46±3 47±4 46±3 49±3 45±7
22/11 P 726±32 722±60 742±47 701±35 723±53 746±37 697±27 731±8 732±42 760±24 708±57 p>0.05
Extractable (%) 53±5 50±8 51±8 52±4 51±6 52±7 54±5 56±4 53±4 49±9 46±8

Chapter 4. Results
40
Table 4.9 Total potassium (K) and extraction ratio (by CaCl2) in soil layer of 0 – 30 cm for the 11 scenarios during four monitoring moments (n=4)
Figure 4.9 Soluble potassium (K-SOL) concentrations in soil (0-30 cm) for the 11 scenarios during all monitoring moments. Data of each moment was subject to
GLM analysis, and treatments with the same letter are not significantly different at the 0.05 level (n=4).
0
20
40
60
80
100
120
140
16/07/2013 (p<0.05) 12/09/2013 (0.05<p<0.1) 07/10/2013 (p>0.05) 22/11/2013 (p>0.05)
K-S
OL
(mg
kg-1
DM
)
S1
S2
S3
S4
S5
S6
S7
S8
S9
S10
S11
Date Nutrients
(mg kg-1DM) Sc1 Sc2 Sc3 Sc4 Sc5 Sc6 Sc7 Sc8 Sc9 Sc10 Sc11 p-value
16/07 K 2,117±274 2,171±398 2,030±225 2,152±186 2,127±158 2,092±209 2,030±321 2,135±142 2,111±278 2,154±214 2,068±187 p>0.05
Extractable
(%)
4.9±0.3 4.9±0.9 5.2±0.6 5.8±0.4 5.3±1.0 5.7±0.4 5.3±0.5 5.2±0.8 4.9±0.2 5.6±0.5 5.0±0.3
22/09 K 1,959±225 1,955±272 1,768±57 1,866±164 1,900±215 1,742±349 1,903±148 1,879±264 1,932±51 1,961±85 1,844±245 p>0.05
Extractable
(%)
4.9±0.9 4.4±1.0 4.0±0.5 4.2±0.6 4.3±0.6 4.7±2.0 4.5±0.4 4.9±1.0 4.5±0.5 4.7±0.6 4.1±0.6
07/10 K 2,181±264 2,105±258 2,027±215 2,155±66 2,150±100 2,115±119 2,077±152 2,204±186 2,073±189 2,097±97 2,062±144 p>0.05
Extractable
(%)
4.7±0.5 4.1±0.2 4.6±0.5 4.9±0.6 4.5±0.4 4.5±0.8 4.5±1.0 4.8±0.5 4.7±0.4 5.1±0.5 4.9±0.7
22/11 K 1,918±174 1,833±247 1,871±200 1,901±132 1,950±225 1,860±198 1,845±188 1,917±189 1,894±150 1,882±190 1,890±160 p>0.05
Extractable
(%)
3.6±0.6 3.8±0.7 3.5±0.5 4.0±0.8 3.8±0.7 3.9±1.0 3.8±0.7 3.7±0.4 3.9±0.6 4.5±0.5 3.7±0.6

Chapter 4. Results
41
4.5. Other parameters for soil quality
4.5.1. pH-H2O, pH-KCl, Electrical Conductivity (EC)
The pH-H2O, pH-KCl and Electrical Conductivity (EC) of soil in the layer of 0 – 30 cm during the
four monitoring moments is presented in Appendix 4. It was shown that the different fertilization
treatments had significant effects on soil pH-H2O (p<0.001), and continued to affect pH-H2O of soil
in a significant way in September, however the significant difference (p<0.05) was weaker than in
July. No significant differences were observed at harvest time in October and post-harvest time in
November. Soil pH-H2O for Sc3 was significantly lower than Sc4-5 in both July and September at the
0.05 level. As compared to pH-H2O, there was only a weak effect (0.05<p<0.1) of diverse fertilization
treatments on pH-KCl in July, and no remarkable differences among the 11 scenarios in September
(p>0.05) and October (p>0.05). However, it was in November that statistical results (p=0.0496<0.05)
indicated significant difference exists among the 11 scenarios, while Tukey (HSD) test did not find
notable difference at the 0.05 level. For EC of soil, big variation and standard deviations for each
scenario were observed at the first three monitoring moments. The EC of 11 scenarios differed
significantly in July (p<0.001), September (p<0.001) and October (p<0.001), while no significant
differences were recorded in November. It was interesting that EC of soil for Sc3 and Sc6 were
significantly higher than Sc1 and Sc9 at the first three monitoring moments at the 0.05 level.
4.5.2. Organic matter (OM) and organic carbon (OC) of soil
Organic matter and organic carbon of soil in the layer of 0 – 30 cm for all four moments is presented
in Appendix 5. OM and OC of all scenarios were highest in July in comparison with the other three
monitoring moments. Both of them, to some extent, decreased gradually along with the crop growth.
Nevertheless, the bio-based fertilizers used in 11 scenarios had improved the OC in the field, as
compared to the Baseline (1.2%). There was also no statistical evidence that the OM and OC of soil
was significantly influenced by the variable treatments during the whole plant growing season,
harvest and post-harvest periods.
4.5.3. Sodium Adsorption Ratio (SAR)
The SAR in the soil solution from 0 – 30 cm layer in July is presented in Figure 4.10. Except for

Chapter 4. Results
42
Sc7-9, SAR for all scenarios was higher than 1. The highest average SAR was observed in Sc9 (1.3),
while the lowest was in Sc6 (0.4). The variable fertilization treatments had significant effects
(p<0.001) on the SAR of soil solution in July. SAR for Sc7-9 were significantly higher compared to
the Sc2-3 and Sc5-6. Though significant differences were obtained for SAR, the variable treatments
had no significant effects on soil Na, Mg, Ca concentration in July.
Figure 4.10 Sodium adsorption ratio for the 11 scenarios in July. Scenarios with the same letter are not
significantly different at the 0.05 level (n=4).
bcde
de de
abcd
cde
e
ab
abc a
abcd
bcde
0.0
0.2
0.4
0.6
0.8
1.0
1.2
1.4
1.6
1.8
Sc1 Sc2 Sc3 Sc4 Sc5 Sc6 Sc7 Sc8 Sc9 Sc10 Sc11
SAR

Chapter 5. Discussion
43
5. DISCUSSION
5.1. Fertilizer impact on crop yield and quality
Since energy maize was subject to anaerobic digestion, the DM yield and DM content of maize
(shown in Appendix 6) are the most suitable index to evaluate the performance of different
fertilization treatments (Vaneeckhaute et al., 2013b). The average DM yield in this study was 22.7±
1.3 ton ha-1
, which is comparable to the reported results of the field trial in 2012 in Wingene, Belgium,
conducted by Vaneeckhaute et al. (2013b). The DM content was averaged 29.8±1.3%, higher than
results of 2012 field trial, but still within the desired range (25 – 35%) for biogas production (Weiland,
2010). Dry matter yield was comparable for all scenarios (Sc2-11) in comparison with the control
group (Sc1). This is in line with the field trials conducted by Formowitz and Fritz (2010) and
Pastorelli et al. (2013), both of which ascertained that digestate-treated maize yield was not
significantly different from the artificial fertilizer treatment. This indicates that the bio-based
fertilizers can be as effective as the artificial fertilizers and manure, once the nutrients supply satisfy
the demands of maize.
In terms of crop quality, nutrients uptake (N, P, K, Na, S, Ca, Mg, Cu, Zn) for in this study did not
differ among 11 scenarios, except for slightly difference between Sc2 and Sc7 with respect to N
uptake. All nutrients contents in maize are similar with reported data (Mengel et al., 2001).
Surprisingly, air scrubber water, with special trait of high content of S, did not affect significantly the
crop S uptake. Pig manure, is enriched with Cu and Zn (Meers et al., 2005), also did not cause Cu and
Zn accumulation problem in maize. Therefore, a careful check for S-surplus, Cu and Zn residue in soil
is imperative in this study.
5.2. Nutrient use efficiency of N-P-K fertilizers
The nutrients supplied with different fertilizers could not satisfy the growth demand of maize. The
actual crop nutrients uptake should be higher than the calculated value NU, taking account of
withered flower and leaves, as well as the un-harvested root parts. Also, the actual value of NI was

Chapter 5. Discussion
44
smaller since the nutrients were released slowly from bio-based fertilizers. These resulted in higher
actual NUE than the values listed in Table 4.6. It is inevitable that crops uptake much more nutrients
in soil nutrient pool. In comparison with control group Sc1, comparable N-P-K fertilizers’ NUE for
most scenarios were observed.
Sc5, treated with digestate instead of manure, exhibited significantly higher fertilizer NUE of total N
and P2O5 compared to Sc1, mainly due to the lower total N and P2O5 input and comparable crop N/P
uptake. This indicated the nutrients of N, P in digestate are more readily for crop uptake than pig
manure. It is probably that digestate possesses higher inorganic nutrients of N (mainly NH4-N), P and
K, which were preserved and concentrated during the AD process (Tambone et al., 2010). This is in
line with the observation in study of Vaneeckhaute et al. (2013a) that extraction efficiency of
macronutrients such as P, K, Na, Ca, Mg is higher for digestate than for pig manure. Lots of studies
have shown the competence of digestate to replace manure regarding to the crop yield and nutrients
supply (Dahlberg et al., 1988, Kay et al., 1997, Alburquerque et al., 2012a, Tambone et al., 2010).
An important remark is that the amount of effective N applied to the soil in Sc2-3, Sc6-8 exceeded the
advised level of 150 kg ha-1
. However, this was still not enough for maize growth as NUE of effective
N were bigger than 100% for these scenarios. NUE of both total N and effective N for Sc3 were
significantly lower than for Sc1, due to the high dosage of air scrubber water. It was hard to evaluate
the N efficacy of air scrubber water in this case, therefore a decreased dosage can be applied in the
next field experiment. However, air scrubber water in Sc2 and Sc6 demonstrated comparable N
fertility as artificial fertilizers, due to the insignificant difference from Sc1. Acidic air scrubber water
has very high effective N content (64.7 g kg-1
DM, mainly in the form of (NH4)2SO4), which can
provide readily N for crops. This is also in consistency with the findings that N and S extraction
efficiency were 100% for acidic air scrubber water in research of Vaneeckhaute et al. (2013a).
However, there are three concerns regarding the application of air scrubber water: (1) NH3 loss in the
way of evaporation, denitrification and leaching; (2) problem of S surplus in soil, and; (3) the
appropriate application methods of air scrubber water should be selected, since it is with very low pH
that causes burning for leaves of seedlings.

Chapter 5. Discussion
45
Next, P2O5 use efficiency for Sc7 (using LF of digestate instead of artificial fertilizer) was lower than
for Sc1. The reason is that the relatively lower NU value of P and highest NI of P2O5 for Sc7.
However, the undesired result could not be explained by the utilization of LF of digestate, since it has
very high N:P ratio of 12.6:1, thus in Sc6 the nutrient P was mainly from manure.
Remarkable results for Sc9 indicates the potential of urea as N-K-fertilizer, which can serve as
substitution for artificial fertilizer, as its N-P-K NUE were comparable to Sc1. Urea is derived from
pig urine, which contains nutrients ions such as K+, NH4
+, PO4
3-, Ca
2+, SO4
2-. N is mainly present as
ammoniacal N (CO(NH2)2), which is readily N sources for plant uptake. It was also noticeable that
very few amount of artificial K2O (42 kg ha-1
) was supplemented into the field for Sc4 in this field
trial. The mixture digestate (40%)/ LF digestate (60%) showed good performance of N-P-K fertility
for Sc4. This is probably due to it has rather higher mineral P2O5 to total P2O5 ratio, and higher
mineral K2O to total K2O ratio in comparison with manure (Vaneeckhaute et al., 2013b), which could
supply crop with readily nutrient P, K, as well as N.
The fertilization treatment in Sc10-11 also showed similar NUE of N-P-K with Sc1, which indicates
the utility of LF pig manure partially as artificial fertilizers. It was reported that corn N and P uptake
were similar between LF of swine manure with artificial fertilizer on a clay and a loam soil over three
years field trial (Chantigny et al., 2008). In Flanders, LF pig manure is regarded as a general organic
fertilizer after separated from manure (Meers et al., 2005). Raw LF pig manure contains relatively
high TKN, NH4-N, inorganic P and K (Table 4.3), however its composition is highly dependent upon
the separation methods (Møller et al., 2000). A good separation approach should achieve low DM
while maintain high nutrients, also taking the cost-effective factor into the consideration.
5.3. Fertilizer impact on soil nutrients residues
Concerning N residue in soil, the first examined parameter is NO3-N residue in soil layer 0-90 cm.
Flemish Manure Decree (Decree, 2011) strictly limits NO3-N within norm of 90 kg ha-1
. NO3-N
concentrations for all scenarios were much less than the limitation, and close to baseline of 27 kg ha-1
.

Chapter 5. Discussion
46
Likewise, the relatively low NH4-N residues in soil were also recorded. In this study, the relatively
high mineral N contents (NO3-N and NH4-N) in soil before field trial had supplied crop considerable
readily N source. However, crops with big demand consumed up the effective N and continuously
took in the mineralized N from organically bound nitrogen in fertilizers and soil pool. This caused the
degradation of organic matter, and it can be ascertained the apparent decline of organic N (Appendix
2) and OM (Appendix 5) from July to October. A net loss of organic N will happen if supplying
insufficient N fertilizer in the long term. Therefore, a careful fertilizer application in this field should
be conducted in the next several years.
The N supply for 11 scenarios was asynchronous with the crop N demand, as nutrients were slowly
released from bio-based fertilizers. In July, NO3-N contents in soil layer 0 – 30 cm was rather high,
ranging from 44 to 87 kg ha-1
, caused by rapidly nitrification of NH4-N which were well present in
bio-based fertilizers. It was not enough, and increased NH4-N contents in soil layer 0 – 30 cm in
September were observed, which indicated the N mineralization occurred to supplement the N
deficiency during the growing season.
Normally, NH4-N takes up only a small fraction of mineral N in soil. However, NH4-N residues for
most scenarios were comparable, albeit a little lower, with the amount of NO3-N in September. This
phenomenon occurred because of (1) the acidic to slightly acidic soil (Appendix 4), which tends to
have a greater concentration of NH4-N and impede the activity of nitrifying bacteria (Cox and
Reisenauer, 1973, Pearson and Stewart, 1993); (2) the texture of sandy loam, which favors affinity for
NH4-N (Pearson and Stewart, 1993, Mengel, 1996). Thus, high concentration of NH4-N in soil seems
to occur. Also, it could not avoid the N-loss problem in this field experiment due to the high N loading
before the sowing. However, it is difficult to evaluate the N-loss in this field trial, as there was no
clear baseline for total N. Therefore, more careful observations and complex modeling are necessary
for addressing this environmental issue.
Regarding the status P in soil, two prerequisites should be addressed: (1) the applied amount of P2O5
in all of scenarios did not exceed the maximum limits of 80 kg ha-1
according to the Flemish manure

Chapter 5. Discussion
47
policy (Decree, 2011); (2) 85% of the arable fields of East Flanders exceeded the optimum value for
available P (120 –180 mg kg–1
in DM of topsoil) (De Neve et al., 2006), and baseline of this study
was 363 mg kg–1
P-AL in DM soil. It was noteworthy that the application of variable fertilizers did
not change the P-AL in topsoil for all scenarios in this field in October (Figure 4.8), which were
slightly lower than baseline. This is quite consistent with the NUE of P2O5 for most scenarios, except
for Sc5-6, up to more than 190%. In November, P-AL for all scenarios fluctuated around baseline,
which indicated the application of bio-based fertilizer will not decrease the soil fertilizing property
regarding to P nutrient. Special attention can be given to Sc5, with regard to the total P concentration
in deeper soil layers in October. With the lowest P2O5 input (47 kg ha-1
) by using digestate (Figure
4.6), however, the P content was significantly higher than Sc2 and Sc4 in both 30 – 60 cm (p<0.05)
and 60 – 90 cm (p<0.05) soil layers. These controversial results may ascribe to the intrinsic
heterogeneous P distribution in deep soil. Nevertheless, there is no comparative data in P and P-AL
baseline for deep soil layers, further research is recommended to perform, in order to get full picture
of P fertility.
For soil K residue, it was quite apparent that extra mineral K in top soil layer was absorbed by crop,
as the deficiency of K2O supply. However, owing to the non-comparative data of baseline (K-AL) and
residue (K-SOL) in this study, it is hard to accurately evaluate the K residues in soil. K-AL generally
consists of K-SOL plus the exchangeable K on clay particles, though exchangeable K may be only a
small portion due to the sandy-loam texture (Rehm and Schmitt, 2002, Kolahchi and Jalali, 2007).
As mentioned in section 5.2, S surplus in soil may be the risky problem. Apparently, application of air
scrubber water caused significantly higher total S residues in top soil layer in July, September and
October. However, in S-deficient soil like in this study (11 mg kg-1
S in soil baseline), appropriate
application of air scrubber water will not cause S-surplus in short-term. It was found that no
difference of soil S among 11 scenarios in November, the all S concentration was in the normal range
between 100 and 500 mg kg-1
soil (De Neve et al., 2006). In terms of long-term effect, Vaneeckhaute
et al. (2013b) suggested long-term follow-up for S monitoring in the similar research.

Chapter 5. Discussion
48
Nutrient Baseline of Ca content is quite favorable for plant in this field, while Mg content is a litter
higher. Additional supply of Ca and Mg may cause problems for plant growth (chlorosis) and soil
structure (Vaneeckhaute et al., 2013b). However, relatively high NH4+ concentration will decrease the
absorption of Ca2+
and Mg2+
for crop in this field (Havlin et al., 2005), while acidic soil can augment
the crop absorption efficiency. Complex interactions between soil and plant, as well as shortage of
supported data, make it difficult to evaluate the Ca and Mg status in soil. Ca and Mg residues were
quite stable for all scenarios. For Na, there was relatively high dosage of Na for Sc4 and Sc7-8,
mainly due to the high Na content in LF of digestate (4.5 g kg-1
FM). But, there is no significant effect
of fertilizers on Na residues in soil for all scenarios. Heavy metals Cu and Zn are one of major
environmental concerns for the application of manure and digestate, due to the relatively high content
of Cu and Zn in these two fertilizers (Vaneeckhaute et al., 2013b). Results have shown none of
treatments caused high Cu (lower than 20 mg kg-1
DM soil) and Zn (lower than 77 mg kg-1
DM soil)
residues that exceeded the background value for standard agricultural soil in Flemish Soil Decree
(Decree, 2006).
5.4. Fertilizer impact on soil quality of pH, EC, OM, OC and SAR
The pH of soil, ranging from 6.5 to 7.0, in July and September was significantly affected by the
applied fertilizers. Lower pH-H2O was observed in Sc2-3 due to the high dosage of air scrubber water.
Combination of digestate and air scrubber water in Sc6 could result in neutralization, since digestate
in general is slighly alkaline. As mentioned before, acidic soil could be one contributing factor for
high NH4-N remaining in soil, and for favoring cation nutrients uptake by crop. However, no
correlation was performed among them in this study. For the amending properties, the descending OM
and OC content along with the 4 moments indicated the degradation of organic materials occurred to
supplement the N nutrients supply for crops. The application of bio-based fertilizer can augment the
OC in soil (Nkoa, 2014, Tambone et al., 2010), as it showed OC was much bigger than baseline in
November.
Excess salts and high level of exchangeable Na in soil will detrimentally affect the crop growth
(Bernstein, 1975). SAR and EC of soil can be parameters to assess the salt-affected soil, as SAR

Chapter 5. Discussion
49
higher than 6 indicates the potential of soil dispersion problem. In this study, all SAR values were
within right range. SAR was highest for Sc7-9 compared to other scenarios. For Sc7-8, the high
concentration of Na and relatively low Ca and Mg contents present in LF of digestate could result in
high SAR in field, while for Sc9, the high HCO3- concentration in urea could precipitate Ca
2+ as
CaCO3, subsequently increase the SAR value. However, higher EC of LF digestate and urea could
mitigate the SAR value. Interestingly, EC for all scenarios in November were quite homogeneous.
However, big variations of EC were obtained in all scenarios during the first three sampling moments,
which can be explained by the variations of ions concentration in different fertilizers.

Chapter 6. Conclusions and Recommendations
50
6. CONCLUSIONS AND RECOMMENDATIONS
In this study, the results have displayed comparable performances for bio-based fertilizers with the
conventional fertilizer practice, due to the similar fresh (dry) matter yield of maize, almost identical
crop quality concerning nutrients uptake, similar or higher N-P-K use efficiency, non-variable effects
on field fertility and quality. It can be concluded that the digestate and its derivative, as well as LF of
manure, urea could be promising substitutes for manure and/or artificial fertilizers as bio-based
fertilizers:
Digestate could compete with manure as organic fertilizer, due to more readily available N and P
nutrients for crop, which resulting in higher N-P use efficiency, up to 189%.
Air scrubber water could be partially as substitution of artificial fertilizers, ascribed to its high
N-fertility efficacy. Thus, combinations of digestate and air scrubber water can be regarded as
alternatives for the farmers.
LF of digestate possesses highly potential as N-K fertilizer, which are promising in the
application in phosphorus saturated area or phosphorus restricted place of Flanders.
The mixture digestate/LF of digestate can function as manure and artificial fertilizers, since it
could afford all nutrients demand from crop growth.
LF of manure can be regarded as N-P-K fertilizer and partially as artificial fertilizer. However,
its properties are highly dependent upon the separation methods.
Urea derived from pig urine can thoroughly replace the artificial fertilizers, and it can maintain
comparable N-P-K NUE.
It was the high nutrient use efficiency of these bio-based fertilizers that guarantee the thoroughly
uptake of N-P-K by crops, and maintain low nutrients residue in soil. Nitrate residue in soil layer 0 –
90 cm was kept as low as 35±7 kg ha-1
, far from the limit of 90 kg ha-1
. Thus, the nitrate leaching
was no longer the environmental issue under the framework of Flemish Manure Decree.
However, the performance of N use efficiency for both bio-based fertilizers and conventional
fertilizers did not reach the optimum in this study. Relatively slowly-released N caused asynchrony

Chapter 6. Conclusions and Recommendations
51
with the crop N demand during growing season. Also, N-loss through ammonia emission could not be
tracked. Decreased OM and organic N of soil occurred to supplement the nitrogen demand for crop
growth. To optimize the N-fertilizer use efficiency, further research is necessary for addressing above
issues and approaching the best combination of bio-based fertilizers.
Overall, the derivatives from manure and digestate have exhibited the comparable performance as
manure and/or artificial fertilizers, and could serve as a promising strategy to tackle with the current
difficulties in agriculture sector in Flanders. Though it still needs the support from the legislative
framework, a sustainable and completed nutrient-circulation in agriculture has been approaching.

References
52
REFERENCES
AL SEADI, T. & LUKEHURST, C. Quality management of digestate from biogas plants used as
fertiliser. IEA Bioenergy, Task, 2012.
ALBURQUERQUE, J., DE LA FUENTE, C., CAMPOY, M., CARRASCO, L., N JERA, I.,
BAIXAULI, C., CARAVACA, F., ROLD N, A., CEGARRA, J. & BERNAL, M. 2012a.
Agricultural use of digestate for horticultural crop production and improvement of soil
properties. European Journal of Agronomy, 43, 119-128.
ALBURQUERQUE, J. A., DE LA FUENTE, C., FERRER-COSTA, A., CARRASCO, L.,
CEGARRA, J., ABAD, M. & BERNAL, M. P. 2012b. Assessment of the fertiliser potential of
digestates from farm and agroindustrial residues. Biomass and Bioenergy, 40, 181-189.
ALLEN, C. 2012. Flanders, Belgium. Europe’s Best Recycling and Prevention Program. C. Allen, V.
Gokaldas, A. Larracas, et al., On the Road to Zero Waste: Successes and Lessons from
Around the World.
AMON, B., KRYVORUCHKO, V., AMON, T. & ZECHMEISTER-BOLTENSTERN, S. 2006.
Methane, nitrous oxide and ammonia emissions during storage and after application of dairy
cattle slurry and influence of slurry treatment. Agriculture, ecosystems & environment, 112,
153-162.
ARTHURSON, V. 2009. Closing the global energy and nutrient cycles through application of biogas
residue to agricultural land–potential benefits and drawback. Energies, 2, 226-242.
BACHMANN, S., WENTZEL, S. & EICHLER‐L BERMANN, B. 2011. Codigested dairy slurry as
a phosphorus and nitrogen source for Zea mays L. and Amaranthus cruentus L. Journal of
Plant Nutrition and Soil Science, 174, 908-915.
BANIK, S. & NANDI, R. 2004. Effect of supplementation of rice straw with biogas residual slurry
manure on the yield, protein and mineral contents of oyster mushroom. Industrial Crops and
Products, 20, 311-319.
BERNAL, M. P., ALBURQUERQUE, J. & MORAL, R. 2009. Composting of animal manures and
chemical criteria for compost maturity assessment. A review. Bioresource technology, 100,
5444-5453.
BERNSTEIN, L. 1975. Effects of salinity and sodicity on plant growth. Annual review of
phytopathology, 13, 295-312.
BOETS, P., MICHELS, E., MEERS, E., LOCK, K., TACK, F. M. & GOETHALS, P. L. 2011.
Integrated constructed wetlands (ICW): ecological development in constructed wetlands for
manure treatment. Wetlands, 31, 763-771.
BOTHEJU, D., SVALHEIM, Ø. & BAKKE, R. 2010. Digestate Nitrification for Nutrient Recovery.
Open Waste Management Journal, 3.
BURTON, C. H. & TURNER, C. 2003. Manure management: Treatment strategies for sustainable
agriculture, Editions Quae.
CANALI, S., DI BARTOLOMEO, E., TITTARELLI, F., MONTEMURRO, F., VERRASTRO, V. &
FERRI, D. 2011. Comparison of different laboratory incubation procedures to evaluate
nitrogen mineralization in soils amended with aerobic and anaerobic stabilized organic
materials. Journal of Food, Agriculture & Environment, 9, 540-546.
CHANTIGNY, M. H., ANGERS, D. A., B LANGER, G., ROCHETTE, P., ERIKSEN-HAMEL, N.,

References
53
BITTMAN, S., BUCKLEY, K., MASS , D. & GASSER, M.-O. 2008. Yield and nutrient
export of grain corn fertilized with raw and treated liquid swine manure. Agronomy journal,
100, 1303-1309.
CHANTIGNY, M. H., ANGERS, D. A., ROCHETTE, P., B LANGER, G., MASS , D. & C T , D.
2007. Gaseous nitrogen emissions and forage nitrogen uptake on soils fertilized with raw and
treated swine manure. Journal of environmental quality, 36, 1864-1872.
COMMISSION, E. 1991. Nitrates Directive.
COMMISSION, E. 2008. Directive 2008/98/EC [Online].
COX, W. & REISENAUER, H. 1973. Growth and ion uptake by wheat supplied nitrogen as nitrate, or
ammonium, or both. Plant and Soil, 38, 363-380.
DAHLBERG, S., LINDLEY, J. & GILES, J. 1988. Effect of anaerobic digestion on nutrient
availability from dairy manure. Transactions of the ASAE (USA).
DE BOER, I. J. 2003. Environmental impact assessment of conventional and organic milk production.
Livestock Production Science, 80, 69-77.
DE NEVE, S., VAN DEN BOSSCHE, A., SLEUTEL, S. & HOFMAN, G. 2006. Soil nutrient status
of organic farms in Flanders: an overview and a comparison with the conventional situation.
Biological agriculture & horticulture, 24, 217-235.
DE VRIES, J., GROENESTEIN, C. & DE BOER, I. 2012. Environmental consequences of
processing manure to produce mineral fertilizer and bio-energy. Journal of environmental
management, 102, 173-183.
DECREE, F. M. 2011. Decree concerning the protection of water against nitrate pollution from
agricultural sources. Decree No.: BS13.
DECREE, F. S. 2006. Order of the Flemish Government of 14 December 2007 establishing the
Flemish soil remediation and protection regulations. Brussels, Belgium.
DIACONO, M. & MONTEMURRO, F. 2010. Long-term effects of organic amendments on soil
fertility. A review. Agronomy for Sustainable Development, 30, 401-422.
FIXEN, P. E. 2009. World fertilizer nutrient reserves—A view to the future. Better Crops, 93, 8-11.
FORMOWITZ, B. & FRITZ, M. Biogas digestates as organic fertilizer in different crop rotations.
Technology and Support Centre (TFZ) in the Centre of Excellence for Renewable Ressources,
Straubing, Germany. Tagungsbeitrag der European Biomass Conference, 2010.
FUCHS, W. & DROSG, B. 2013. Assessment of the state of the art of technologies for the processing
of digestate residue from anaerobic digesters. Water Science & Technology, 67.
FURUKAWA, Y. & HASEGAWA, H. 2006. Response of spinach and komatsuna to biogas effluent
made from source-separated kitchen garbage. Journal of environmental quality, 35,
1939-1947.
GARF , M., GELMAN, P., COMAS, J., CARRASCO, W. & FERRER, I. 2011. Agricultural reuse of
the digestate from low-cost tubular digesters in rural Andean communities. Waste
management, 31, 2584-2589.
GERBER, P., FRANCESCHINI, G. & MENZI, H. 2002. Livestock density and nutrient balances
across Europe. Livestock density and nutrient balances across Europe.
GILKINSON, S., FROST, P. & HILLSBOROUGH, N. I. 2007. Evaluation of mechanical separation
of pig and cattle slurries by a decanting centrifuge and a brushed screen separator. Research
Preport, Agri-Food and Biosciences Institute, Hillsborough, Northern Ireland.
GUTSER, R., EBERTSEDER, T., WEBER, A., SCHRAML, M. & SCHMIDHALTER, U. 2005.

References
54
Short‐term and residual availability of nitrogen after long‐term application of organic
fertilizers on arable land. Journal of Plant Nutrition and Soil Science, 168, 439-446.
HAVLIN, J., BEATON, J. D., TISDALE, S. L. & NELSON, W. L. 2005. Soil fertility and fertilizers:
An introduction to nutrient management, Pearson Prentice Hall Upper Saddle River, NJ.
HELMUT, D. & SEBASTIAN, W. Technical and economical evaluation of digestate processing
techniques.
HOLM-NIELSEN, J. B., AL SEADI, T. & OLESKOWICZ-POPIEL, P. 2009. The future of anaerobic
digestion and biogas utilization. Bioresource technology, 100, 5478-5484.
KAY, J., MITCHELL, D. & NEW, D. 1997. Suitability of the liquid produced from anaerobic
digestion as a fertiliser, Atomic Energy Research Establishment, Energy Technology Support
Unit, New and Renewable Energy Programme.
KEARNEY, T. E., LARKIN, M. & LEVETT, P. 1993. The effect of slurry storage and anaerobic
digestion on survival of pathogenic bacteria. Journal of Applied Microbiology, 74, 86-93.
KOLAHCHI, Z. & JALALI, M. 2007. Effect of water quality on the leaching of potassium from
sandy soil. Journal of arid environments, 68, 624-639.
LEBUF, V., ACCOE, F., VANEECKHAUTE, C., MEERS, E., MICHELS, E. & GHEKIERE, G.
Nutrient recovery from digestates: techniques and end-products. 4th International
symposium on Energy from Biomass and Waste, 2012.
LEBUF, V., VANELSACKER, S., ACCOE, F., VANEECKHAUTE, C., MEERS, E. & MICHELS, E.
Digestate management in Flanders: nutrient removal versus nutrient recovery. International
Anaerobic Digestion Symposium at BioGasWorld 2013, 2013. IBBK Fachgruppe Biogas.
LESCH, S. & SUAREZ, D. 2009. A short note on calculating the adjusted SAR index. Transactions of
the ASABE, 52, 493-496.
M LLER, H. B., LUND, I. & SOMMER, S. G. 2000. Solid–liquid separation of livestock slurry:
efficiency and cost. Bioresource Technology, 74, 223-229.
M LLER, K. & M LLER, T. 2012. Effects of anaerobic digestion on digestate nutrient availability and
crop growth: a review. Engineering in Life Sciences, 12, 242-257.
M LLER, K. & STINNER, W. 2009. Effects of different manuring systems with and without biogas
digestion on soil mineral nitrogen content and on gaseous nitrogen losses (ammonia, nitrous
oxides). European Journal of Agronomy, 30, 1-16.
M LLER, K., STINNER, W., DEUKER, A. & LEITHOLD, G. 2008. Effects of different manuring
systems with and without biogas digestion on nitrogen cycle and crop yield in mixed organic
dairy farming systems. Nutrient cycling in agroecosystems, 82, 209-232.
MAK DI, M., TOM CSIK, A. & OROSZ, V. 2012. Digestate: a new nutrient source–review. Energy, 4,
8.7.
MEERS, E., ROUSSEAU, D., LESAGE, E., DEMEERSSEMAN, E. & TACK, F. 2006.
Physico-chemical P removal from the liquid fraction of pig manure as an intermediary step in
manure processing. Water, air, and soil pollution, 169, 317-330.
MEERS, E., ROUSSEAU, D. P., BLOMME, N., LESAGE, E., DU LAING, G., TACK, F. M. &
VERLOO, M. G. 2005. Tertiary treatment of the liquid fraction of pig manure with
Phragmites australis. Water, air, and soil pollution, 160, 15-26.
MELSE, R. & OGINK, N. 2005. Air scrubbing techniques for ammonia and odor reduction at
livestock operations: Review of on-farm research in the Netherlands. Transactions of the
ASAE, 48, 2303-2313.

References
55
MENGEL, K. 1996. Turnover of organic nitrogen in soils and its availability to crops. Plant and Soil,
181, 83-93.
MENGEL, K., KOSEGARTEN, H., KIRKBY, E. A. & APPEL, T. 2001. Principles of plant nutrition,
Springer.
MONTEMURRO, F., CANALI, S., CONVERTINI, G., FERRI, D., TITTARELLI, F. & VITTI, C.
2008. Anaerobic digestates application on fodder crops: effects on plant and soil. Agrochimica,
52, 297-312.
MONTEMURRO, F., FERRI, D., TITTARELLI, F., CANALI, S. & VITTI, C. 2010. Anaerobic
digestate and on-farm compost application: Effects on lettuce (Lactuca sativa L.) crop
production and soil properties. Compost science & utilization, 18, 184-193.
NKOA, R. 2014. Agricultural benefits and environmental risks of soil fertilization with anaerobic
digestates: a review. Agronomy for Sustainable Development, 34, 473-492.
NYORD, T., S GAARD, H., HANSEN, M. & JENSEN, L. S. 2008. Injection methods to reduce
ammonia emission from volatile liquid fertilisers applied to growing crops. Biosystems
engineering, 100, 235-244.
ODLARE, M., PELL, M. & SVENSSON, K. 2008. Changes in soil chemical and microbiological
properties during 4 years of application of various organic residues. Waste management, 28,
1246-1253.
PASTORELLI, R., LAGOMARSINO, A., VIGNOZZI, N., VALBOA, G., PAPINI, R., FABIANI, A.,
SIMONCINI, S., MOCALI, S. & PICCOLO, R. Anaerobic digestate from biogas production
as a resource for improving soil fertility: effects on crop yield and soil properties. EGU
General Assembly Conference Abstracts, 2013. 7664.
PEARSON, J. & STEWART, G. R. 1993. The deposition of atmospheric ammonia and its effects on
plants. New phytologist, 125, 283-305.
PLATTEAU, J. & VAN BOGAERT, T. 2009. Agriculture and Horticulture in Flanders 2009. Pocket
Agricultural Indicators, Department of Agriculture and Fisheries, Brussels.
POGNANI, M., D’IMPORZANO, G., SCAGLIA, B. & ADANI, F. 2009. Substituting energy crops
with organic fraction of municipal solid waste for biogas production at farm level: A full-scale
plant study. Process biochemistry, 44, 817-821.
REHL, T. & M LLER, J. 2011. Life cycle assessment of biogas digestate processing technologies.
Resources, Conservation and Recycling, 56, 92-104.
REHM, G. & SCHMITT, M. 2002. Potassium for crop production. University of Minnesota.
SCHIEVANO, A., ADANI, F., TAMBONE, F., D'IMPORZANO, G., SCAGLIA, B. & GENEVINI, P.
2009. WHAT IS THE DIGESTATE? Anaerobic Digestion: opportunity for agriculture and
environment.
SVENSSON, K., ODLARE, M. & PELL, M. 2004. The fertilizing effect of compost and biogas
residues from source separated household waste. The Journal of Agricultural Science, 142,
461-467.
TAMBONE, F., GENEVINI, P., D’IMPORZANO, G. & ADANI, F. 2009. Assessing amendment
properties of digestate by studying the organic matter composition and the degree of
biological stability during the anaerobic digestion of the organic fraction of MSW.
Bioresource technology, 100, 3140-3142.
TAMBONE, F., SCAGLIA, B., D’IMPORZANO, G., SCHIEVANO, A., ORZI, V., SALATI, S. &
ADANI, F. 2010. Assessing amendment and fertilizing properties of digestates from

References
56
anaerobic digestion through a comparative study with digested sludge and compost.
Chemosphere, 81, 577-583.
TEGLIA, C., TREMIER, A. & MARTEL, J.-L. 2011a. Characterization of solid digestates: part 1,
review of existing indicators to assess solid digestates agricultural use. Waste and Biomass
Valorization, 2, 43-58.
TEGLIA, C., TREMIER, A. & MARTEL, J.-L. 2011b. Characterization of solid digestates: Part 2,
assessment of the quality and suitability for composting of six digested products. Waste and
Biomass Valorization, 2, 113-126.
VAN DER STRAETEN, B., BUYSSE, J., MARCHAND, F., LAUWERS, L., CLAEYS, D. & VAN
HUYLENBROECK, G. Fertilization: trade-offs between manure abatement and plant
productivity. XIIth EAAE congress: People, food and environments: global trends and
European strategies, 2008.
VAN RANST, E. 1999. Manual for the soil chemistry and fertility laboratory: Analytical methods for
soils and plants equipment and management of consumables, University of Ghent,
International Training Centre for Post-Graduate Soil Scientists.
VANEECKHAUTE, C., MEERS, E., MICHELS, E., BUYSSE, J. & TACK, F. 2013a. Ecological and
economic benefits of the application of bio-based mineral fertilizers in modern agriculture.
Biomass and Bioenergy, 49, 239-248.
VANEECKHAUTE, C., MEERS, E., MICHELS, E., CHRISTIAENS, P. & TACK, F. 2012. Fate of
macronutrients in water treatment of digestate using vibrating reversed osmosis. Water, Air, &
Soil Pollution, 223, 1593-1603.
VANEECKHAUTE, C., MEERS, E., MICHELS, E., GHEKIERE, G., ACCOE, F. & TACK, F. 2013b.
Closing the nutrient cycle by using bio-digestion waste derivatives as synthetic fertilizer
substitutes: A field experiment. Biomass and Bioenergy, 55, 175-189.
VCM 2013. INVENTORY:Techniques for nutrient recovery from digestate.
VOĆA, N., KRIĈKA, T., ĆOSIĆ, T., RUPIĆ, V., JUKIĆ, Ž. & KALAMBURA, S. 2005. Digested
residue as a fertilizer after the mesophilic process of anaerobic digestion. Plant Soil Environ,
51, 262-266.
WARD, A. J., HOBBS, P. J., HOLLIMAN, P. J. & JONES, D. L. 2008. Optimisation of the anaerobic
digestion of agricultural resources. Bioresource technology, 99, 7928-7940.
WEILAND, P. 2010. Biogas production: current state and perspectives. Applied microbiology and
biotechnology, 85, 849-860.
WESTEINDE, D. V. T. 2009. A nutrient and economic analysis of digestate processing in the region
of Salland. Master thesis, Wageningen University.
ZHANG, M., LAWLOR, P. G., WU, G., LYNCH, B. & ZHAN, X. 2011. Partial nitrification and
nutrient removal in intermittently aerated sequencing batch reactors treating separated
digestate liquid after anaerobic digestion of pig manure. Bioprocess and biosystems
engineering, 34, 1049-1056.

Appendices
57
APPENDICES
Appendix 1 SAS code for statistical analysis.
(1)
proc univariate data=mylb.XX normal plot;
var Y;
histogram/normal;
probplot/normal (mu=est sigma=est);
run;
proc glm data=mylb.XX;
class SC;
model Y=SC;
means SC/hovtest=levene;
run;
proc glm data=mylb.XX;
class SC Block;
model Y=SC block/ss3;
means SC /tukey alpha=0.05;
*means SC /lines tukey;
means SC /dunnett ('1');
lsmeans sc/pdiff;
run;
(2)
data want;
set mylb.XX;
*lg1=log(Y);
*sq1=sqrt(Y);
in1=1/(Y);
*ar1=arsin(sqrt(Y)/100)+0.001;
run;
proc univariate data=want normal plot;
var in1;
run;
proc glm data=want;
class SC;
model in1=SC;
means SC/hovtest=levene;
run;
(2)
proc glm data=want;
class SC Block;
model in1=SC Block/ss3;
means SC /tukey alpha=0.05;
*means SC /lines tukey;
means SC /dunnett ('1');
lsmeans SC /pdiff;
*lsmeans SC/ adjust=tukey pdiff;
run;

Appendices
58
(3) Friedman’s test
proc freq data=mylb.XX;
tables block*Sc*Y/ scores = rank cmh2
noprint;
run;
proc sort data=mylb.XX out=a;
by block ;
run;
proc rank data=a out=b;
var Y;
by block;
ranks r ;
run;
proc glm data=b ;
class sc block ;
model r = sc block/ ss3 ;
means sc/lines tukey;
lsmeans sc/ stderr pdiff ;
run;

Appendices
59
Appendix 2 Organic nitrogen (TKN) content (g kg-1
DM soil) in soil 0-30 cm for the 11 scenarios during all monitoring moments (n=4).
Appendix 3 Nutrients residues (Na, S, Ca, Mg, Cu, Zn) in soil layer of 0 – 30 cm for the 11 scenarios during all monitoring moments. Treatments with the same
letter are not significantly different at the 0.05 level (n=4).
Date Sc1 Sc2 Sc3 Sc4 Sc5 Sc6 Sc7 Sc8 Sc9 Sc10 Sc11 p-value
16/07 1.16±0.05 1.16±0.12 1.19±0.08 1.15±0.06 1.18±0.04 1.20±0.05 1.22±0.14 1.13±0.04 1.15±0.01 1.22±0.06 1.16±0.05 p>0.05
12/09 1.05±0.04 1.08±0.04 1.09±0.05 1.08±0.06 1.07±0.05 1.07±0.04 1.07±0.02 1.07±0.05 1.07±0.06 1.09±0.07 1.08±0.04 p>0.05
07/10 1.03±0.05 1.02±0.07 1.02±0.08 1.04±0.04 1.05±0.05 1.04±0.06 1.07±0.06 1.06±0.04 1.07±0.04 1.06±0.08 1.06±0.01 p>0.05
22/11 1.03±0.07 1.07±0.07 1.02±0.05 1.00±0.08 1.02±0.05 1.05±0.05 1.00±0.03 1.02±0.07 1.03±0.04 1.02±0.03 1.00±0.06 p>0.05
Nutrients
(mg kg-1) Date Sc1 Sc2 Sc3 Sc4 Sc5 Sc6 Sc7 Sc8 Sc9 Sc10 Sc11 p-value
Na 16/07/13 120±22 124±12 125±16 138±25 121±17 121±11 127±24 136±20 132±17 135±23 123±7 p>0.05
12/09/13 96±7 106±18 108±15 110±8 104±19 115±10 111±14 118±11 115±18 118±15 118±31 p>0.05
07/10/13 81±2 87±17 85±6 86±17 80±11 86±19 102±12 104±13 101±17 98±21 103±15 p=0.0858
22/11/13 94±11 95±8 102±19 98±12 101±16 94±11 88±23 101±4 111±20 99±11 103±6 p>0.05
S 16/07/13 146±17
c 162±25
abc 184±27
a 148±15
bc 148±12
bc 173±20
ab 147±15
c 158±13
abc 149±10
bc 157±15
abc 161±21
abc p<0.001
12/09/13 142±30
d 154±36
cd 203±36
ab 171±38
abcd 160±30
abcd 205±26
a 157±33
bcd 197±27
abc 158±31
abcd 161±34
abcd 167±31
abcd p<0.001
07/10/13 165±23
b 177±30
ab 206±45
a 164±15
b 171±16
ab 188±17
ab 169±23
ab 185±17
ab 156±19
b 166±18
ab 189±6
ab p<0.01
22/11/13 151±10 152±3 152±8 150±11 154±11 158±6 152±9 153±2 155±6 143±34 149±13 p>0.05

Appendices
60
Ca 16/07/13 1,994±285 1,952±288 1,929±224 2,001±187 2,128±101 2,014±251 1,931±318 2,155±215 1,920±212 2,102±177 1,918±307 p>0.05
12/09/13 2,053±338 1,954±335 1,920±219 1,961±215 2,058±140 2,014±235 1,969±346 1,976±261 1,870±149 2,010±223 1,884±266 p>0.05
07/10/13 2,000±223 2,035±339 2,086±515 2,013±187 2,088±76 2,024±276 1,904±225 1,975±243 1,861±157 1,994±209 1,892±176 p>0.05
22/11/13 2,222±497 1,877±236 1,946±128 1,903±112 1,984±57 1,969±217 1,872±275 1,898±215 1,855±141 1,949±266 1,888±241 p>0.05
Mg 16/07/13 1,492±94 1,566±225 1,432±80 1,525±115 1,526±52 1,479±59 1,442±104 1,521±39 1,467±94 1,470±79 1,505±86 p=0.081
12/09/13 1,540±238 1,555±316 1,443±189 1,507±100 1,439±46 1,518±151 1,513±114 1,455±33 1,321±136 1,376±157 1,400±194 p>0.05
07/10/13 1,479±75 1,493±189 1,394±110 1,468±85 1,476±76 1,455±103 1,411±94 1,483±93 1,403±129 1,425±83 1,418±126 p>0.05
22/11/13 1,464±79 1,454±123 1,420±128 1,408±93 1,471±115 1,421±136 1,402±141 1,505±119 1,399±97 1,470±198 1,478±123 p>0.05
Cu 16/07/13 15.8±1.0 15.2±2.1 16.0±0.7 15.8±1.0 16.0±0.7 21.2±9.7 15.5±0.3 16.3±1.4 16.5±1.0 17.0±1.0 16.3±0.7 p=0.0695
12/09/13 16.1±0.8 16.2±0.8 16.3±0.5 16.6±0.9 17.0±0.9 16.8±1.3 16.0±0.5 16.5±1.4 16.7±1.2 16.9±1.0 16.7±1.0 p>0.05
07/10/13 16.3±0.9 16.5±0.6 16.9±0.8 16.8±0.6 16.9±1.1 17.1±1.3 16.5±0.4 17.1±1.1 17.3±1.2 17.2±0.8 16.7±1.3 p>0.05
22/11/13 17.5±3.2 16.3±0.4 16.6±0.8 16.2±0.5 16.6±1.0 16.6±0.8 16.0±0.8 16.7±1.1 17.0±1.4 15.6±2.4 16.0±0.7 p>0.05
Zn 16/07/13 44.0±2.4 42.7±3.1 43.7±1.9 45.9±6.0 43.6±1.3 43.6±2.2 42.9±1.5 43.6±1.7 44.2±1.0 45.4±3.1 43.7±2.5 p>0.05
12/09/13 44.6±3.3 43.7±1.3 43.9±1.8 43.1±1.6 45.0±2.2 43.4±1.9 43.8±2.2 44.1±1.3 44.2±2.2 49.6±10.1 43.9±2.0 p>0.05
07/10/13 44.8±1.5 44.8±3.4 44.2±3.0 44.0±2.0 44.5±1.5 44.8±3.2 44.2±1.6 45.5±3.3 46.2±2.4 44.7±2.1 43.7±1.0 p>0.05
22/11/13 45.3±7.4 42.2±1.6 42.8±2.3 40.9±0.5 42.1±1.7 42.8±2.6 41.9±1.3 42.7±2.5 43.5±2.4 40.5±6.1 41.1±3.2 p>0.05

Appendices
61
Appendix 4 pH-H2O, pH-KCl and EC (μS cm-1
) in soil layer of 0 – 30 cm for the11 scenarios during all monitoring moments. Treatments with the same letter are
not significantly different at the 0.05 level (n=4).
Date Sc1 Sc2 Sc3 Sc4 Sc5 Sc6 Sc7 Sc8 Sc9 Sc10 Sc11 p-value
pH-H2O 16/07/13 6.7±0.1
abc 6.7±0.1
bc 6.5±0.1
c 6.8±0.1
ab 6.9±0.1
a 6.7±0.1
abc 6.8±0.0
ab 6.9±0.1
a 6.9±0.1
a 6.9±0.1
a 6.7±0.1
abc p<0.001
12/09/13 6.9±0.1
ab 6.8±0.2
ab 6.7±0.2
b 7.0±0.1
a 7.0±0.1
a 6.8±0.1
ab 7.0±0.2
ab 6.9±0.2
ab 6.9±0.1
ab 7.0±0.1
ab 6.9±0.2
ab p<0.05
07/10/13 7.0±0.2 6.9±0.2 6.7±0.2 7.1±0.1 7.1±0.1 7.0±0.2 7.0±0.2 6.9±0.2 7.0±0.2 7.1±0.2 6.9±0.2 p>0.05
22/11/13 7.0±0.1 6.8±0.1 6.8±0.1 6.9±0.1 7.0±0.0 6.9±0.1 6.9±0.2 6.8±0.1 6.8±0.2 7.0±0.1 6.8±0.1 p>0.05
pH-KCl 16/07/13 6.0±0.3 5.9±0.3 5.8±0.2 6.0±0.1 6.1±0.1 6.0±0.1 6.0±0.2 6.1±0.1 6.0±0.2 6.1±0.2 5.9±0.3 p=0.0693
12/09/13 6.1±0.2 5.9±0.3 5.9±0.2 6.1±0.1 6.2±0.0 6.1±0.1 6.1±0.2 6.0±0.3 6.1±0.2 6.1±0.2 6.0±0.3 p>0.05
07/10/13 6.0±0.2 6.0±0.2 5.8±0.4 6.1±0.1 6.1±0.0 6.0±0.1 6.0±0.2 6.0±0.2 6.0±0.2 6.1±0.2 6.0±0.2 p>0.05
22/11/13 6.0±0.1 5.8±0.2 5.8±0.2 6.0±0.1 6.0±0.1 5.9±0.1 5.9±0.2 5.8±0.1 5.9±0.2 6.0±0.2 5.9±0.2 p<0.05
EC 16/07/13 77.4±17.3
c 111.3±17.8
abc 146.8±29.6
a 105.2±8.6
abc 86.3±12.2
bc 130.1±22.8
ab 89.6±12.8
bc 107.3±26.9
abc 80.2±13.8
c 85.4±5.2
bc 101.6±27.5
abc p<0.001
12/09/13 45.7±6.5
c 58.5±7.6
abc 109.5±40.9
a 40.4±4.8
c 41.1±5.6
c 95.5±12.1
a 51.5±9.0
bc 87.3±32.7
ab 54.9±10.2
bc 53.8±11.7
bc 61.4±18.1
abc p<0.001
07/10/13 58.9±16.1
c 81.1±25.1
abc 121.5±42.4
a 61.3±14.2
c 59.8±11.2
c 101.3±19.4
a 64.9±18.3
bc 91.7±14.1
ab 61.4±21.8
c 63.2±14.6
bc 99.5±3.9
a p<0.001
22/11/13 38.0±5.0 39.7±6.5 36.3±5.1 37.1±4.2 36.2±4.2 35.1±2.6 37.9±2.2 37.3±2.4 41.2±7.1 34.4±2.8 36.4±2.5 p>0.05

Appendices
62
Appendix 5 Organic matter (DM) and organic carbon (OC) in soil layer of 0 – 30 cm for the 11 scenarios during all monitoring moments (n=4).
Date Sc1 Sc2 Sc3 Sc4 Sc5 Sc6 Sc7 Sc8 Sc9 Sc10 Sc11 p-value
OM
(% DM)
16/07/13 4.0±0.2 3.9±0.4 3.8±0.4 3.9±0.3 3.9±0.2 3.8±0.1 3.9±0.2 4.0±0.2 3.9±0.2 3.9±0.2 3.9±0.2 p>0.05
12/09/13 3.7±0.6 3.6±0.5 3.7±0.6 3.3±0.3 3.8±0.5 3.4±0.3 3.6±0.1 3.6±0.4 3.7±0.3 3.4±0.2 3.8±0.3 p>0.05
07/10/13 3.3±0.1 3.2±0.2 3.2±0.2 3.3±0.0 3.3±0.2 3.4±0.2 3.3±0.1 3.3±0.1 3.3±0.1 3.3±0.2 3.3±0.1 p>0.05
22/11/13 3.2±0.3 3.4±0.1 3.5±0.2 3.3±0.2 3.5±0.1 3.4±0.2 3.1±0.1 3.1±0.1 3.3±0.2 3.6±0.9 3.5±0.3 p>0.05
OC
(% DM)
16/07/13 2.3±0.1 2.3±0.2 2.2±0.2 2.3±0.2 2.3±0.1 2.2±0.1 2.2±0.1 2.3±0.1 2.2±0.1 2.2±0.1 2.3±0.1 p>0.05
12/09/13 2.1±0.3 2.1±0.3 2.2±0.4 1.9±0.2 2.2±0.3 2.0±0.2 2.1±0.0 2.1±0.2 2.1±0.2 2.0±0.1 2.2±0.2 p>0.05
07/10/13 1.9±0.1 1.9±0.1 1.9±0.1 1.9±0.0 1.9±0.1 1.9±0.1 1.9±0.1 1.9±0.1 1.9±0.1 1.9±0.1 1.9±0.1 p>0.05
22/11/13 1.9±0.1 2.0±0.1 2.0±0.1 1.9±0.1 2.0±0.1 2.0±0.1 1.8±0.1 1.8±0.0 1.9±0.1 2.1±0.5 2.0±0.2 p>0.05

Appendices
63
Appendix 6 Dry matter content of maize for the 11 scenarios at harvest time (October 4). Treatments with the same letter are not significantly different at the 0.05
level (n=4).
ab ab ab ab
a ab b ab ab ab ab
0%
5%
10%
15%
20%
25%
30%
35%
40%
Sc1 Sc2 Sc3 Sc4 Sc5 Sc6 Sc7 Sc8 Sc9 Sc10 Sc11
DM
co
nte
nt
(%)