an economic and financial analysis of a biomass energy project
TRANSCRIPT
An Economic and Financial Analysis of a BiomassEnergy ProjectAgata Matarazzo ( [email protected] )
Università degli Studi di Catania
Research
Keywords: cogeneration system, biomass, �nancial analysis
Posted Date: June 16th, 2020
DOI: https://doi.org/10.21203/rs.3.rs-33530/v1
License: This work is licensed under a Creative Commons Attribution 4.0 International License. Read Full License

An Economic and Financial Analysis of a Biomass Energy Project 1
2
Abstract: In the Region of Sicily the use of biomass as a raw material for producing energy could be 3
interesting for its particular nature and for the soil and climatic features of that territory, with 4
significant, highly positive socio-economic consequences. 5
The objective of this study is to evaluate the potential of a cogeneration system (i.e. electrical, thermal 6
and cooling) in the biomass sector, and to perform a reliable environmental, as well as financial and 7
economic analysis of a production process in an area of Eastern Sicily. With respect to the analysis 8
of financial risk linked to the plant, appropriate sensitivity analyses, calculations of particular 9
elasticities and of threshold values will be carried out, considering different scenarios corresponding 10
to diverse combinations of production capacities. This method of analysis has been chosen, rather 11
than using a fuzzy approach to consider the linguistic imprecision, because the data available are 12
always expressed in crisp figures, but they are subject to the uncertainty of temporal dynamics. The 13
results obtained outline a marginal economic advantage, sometimes negative for the majority of the 14
scenarios considered from the point of view of a private investor. 15
16
1. Introduction17
18 19
20
Biomass is often declared as renewable, but the degree of renewability always depends on the amount 21
of non-renewable inputs into the product system in question. Thus, environmental burdens can arise 22
during different biomass production steps. For instance, cultivation processes can have a significant 23
influence on the environmental impact of biomass products due to process inputs like fertilizers, 24
harvesting machineries, or site preparation [Zah et al. 2007]. There has been a focus on energy coming 25

from biomass especially for energetic purposes [AEBIOM 2012] and simultaneously increasing 26
public attention regarding environmental impacts of products in general [von Borgstede et al. 2013]. 27
This paper fits into a framework increasingly based upon bio-based economies or ‘bio-economies’, 28
characterized by both reduced dependence upon imported fossil fuels and reduced GHG emissions. 29
Moreover, sustainable production and consumption of renewable biological resources should involve 30
industrial and economic sectors that produce, manage and use resources such as: agriculture, 31
horticulture, forestry, bioenergy and bio-refineries [Schmid et al., 2012; Koukios, 2015; Lopes, 2015], 32
thus causing a wide ranging impact which involves different economic, social and environmental 33
profiles. These transitions must be planned, tested, and implemented to ensure sustainable production, 34
distribution and consumption of biomass, in particular for energy, to manufacture products, currently 35
made from fossil energy sources. 36
Sicily is one of the most suitable Italian regions for its geo-physical characteristics as far as the 37
production of electricity from renewable energy sources is concerned, in particular solar and wind 38
power as well as biomass, which can therefore represent a wager for the future of energy production 39
in Sicily. Despite it’s great potential, Sicily however, has still not managed to fully take advantage of 40
the opportunities arising from the option in question [Matarazzo and La Pira, 2016]. 41
Sicily has a land surface area of 2.6 million hectares, 15.2% of which is on lowland, 61.4% on hills 42
and the remaining 24.2% on mountains. Industry on the island is not very developed and the most 43
important sites are in Catania (particularly the electronic sector), Syracuse (some of the largest oil 44
refinery in Europe), and around Palermo and Trapani (agro-food industries an wine firms). 45
In the 1960s in Gela a very large petrochemical industry was established, with immediate advantages 46
in terms of employment and socio-economic benefits. As a consequence, some industries of small-47
medium sizes were therefore created, in order to provide different kind of services to the main 48
industry. However, the recent and deep economic crises has had a considerable impact in terms of 49
volume of production of that industry, with some plans to reduce its production capacity with 50
consequent unemployment problems for the area. Currently in Sicily, despite the ready supply of 51

natural resources, only few renewable energy plants have been established, and electricity is mainly 52
produced by oil plants and by some hydro-electrical plants. 53
The aim of this study is to conduct a detailed economic and financial analysis of a production project 54
planned in the territory of Eastern Sicily in the biomass sector. The structure used in this study is a 55
co-trigeneration biomass plant, fuelled by a local production line supplied by crops dedicated to agro-56
industrial waste with the installation of a district heating and cooling network. The technological, 57
environmental and energetic aspects are analysed in order to obtain a better understanding of the 58
relevance that such a sector could have in the territory concerned. Besides the undeniable 59
environmental impact, an economic-financial assessment has been carried out to analyse the real 60
impact of the project in economic terms, that is taking into consideration the consequences in terms 61
of production costs, project profitability and at macro level, in order to express a judgement on the 62
project in question’s validity, and to understand if it can really be a turning point in terms of public 63
and private benefits on the industrial area of Gela, as well as having a positive impact on the whole 64
region. 65
The paper is organized as follows. In Section 2 an overview of the industrial and economic context 66
in Sicily, and particularly in province of Caltanissetta, and the biomass availability is given; while a 67
description of the project with its technical, environmental and financial main features is given in 68
Section 3. The financial and economic analysis of the project, is carried out in Section 4. The results 69
of the study taking into account the public and private benefits is included in Section 5. The conclusive 70
considerations are grouped in Section 6. 71
72
2. Biomass Potential in Sicily 73
74
In Sicily the territory is very varied, influencing the types of farming carried out [Cherubini et al. 75
2010] as a result. Indeed, it varies from systems of intensive farming along the coastal areas, 76

represented by fruit and vegetable growing, flower growing and to a lesser degree citrus fruit growing, 77
whereas in inland areas an extensive farming exists, mainly made up of crops and livestock farming. 78
On this basis a whole series of problems arise defined by the excessive fragmentation of the farms, 79
by the insufficient and reduced maintenance of the infrastructures in existence, by the lack of 80
processing and manufacturing plants for local producers [Klein et al 2015]. All this contributes, 81
together with the isolated situation of the island, to explaining the reduced profitability of agriculture. 82
Structural difficulties often force farmers to make production plans that reduce the running costs as 83
much as possible, penalizing the operations which require a greater use of labour [Matarazzo and La 84
Pira, 2016]. So, despite good agronomic practice suggesting annual pruning cycles which do not use 85
pruning shears too dramatically, it is common to witness situations where pruning is carried out twice, 86
three-times or even five times a year. Conversely, there are local cases such as the olive trees in the 87
Valley of Belice (TP) or in some areas on Mt. Etna, where the establishment and recognition of 88
quality brands, for example that of olive oil, have contributed to developing techniques of cultivation 89
towards more rational systems, with pruning of trees yearly and not drastically, often limiting the 90
pruning to the shortening of the branches [Matarazzo and La Pira, 2016]. The geographical 91
differences and the different business choices have created and led to quite a varied management of 92
the policies related to the main destination of waste from pruning , specialized forage crops or agro-93
food in order to eventually exploit them for energy. The lack of a reference market and the high 94
incidence of costs for harvesting the residual biomass are the main reasons why this residual biomass 95
is hardly exploited for energy. In the inland areas all this is worsened by the limiting conditions of 96
altitude that prevent mechanical harvesting. 97
Nonetheless, in some areas, users sustain the costs for harvesting and storage especially for the largest 98
remainders as in the case of olive trees, almond trees, peach trees and to some extent citrus fruit trees. 99
Initially, for example it was common during the pruning period that the owners of wood-fired ovens 100
and pizza parlours were willing to pay temporary workers to harvest the remainders in the fields. In 101
these cases the farm company owners had an absolutely free cleaning service for their fields. In the 102
last decade, above all for the specialist wine growers and some fruit growers, the practice of shredding 103
pruned foliage waste became widespread, using working machinery often supplied by the fleet of 104
larger companies [Matarazzo a. 2016]. Other widespread practices concern burning the cuttings in 105
order to reduce any phyto-sanitary risk due to inoculated pathogens or the use the remainders for 106
home heating by the same company, especially when this corresponds to the main home of the farmer. 107
In Sicily, full of olive groves, there is a significant diffusion of the full use of products from olive 108
pulp produced by the oil producing industry for energy purposes. Indeed after the extraction of the 109
oil pulp, which represents about 60% of the incoming product i.e. the olives , the olives are sent to 110
the olive pulp factory that takes care of the operation of the extraction of the oil obtaining the used 111
pulp residue characterised by its good heat producing qualities as waste at the end of the process. The 112
use of nut shells is very widespread across Sicily which also has a real market run by the same 113
processors of nuts before sending the de-shelled product to the market for consumption [EU, 2006]. 114
A very common use that is made of these left-overs is for the firing of new generation stoves in 115
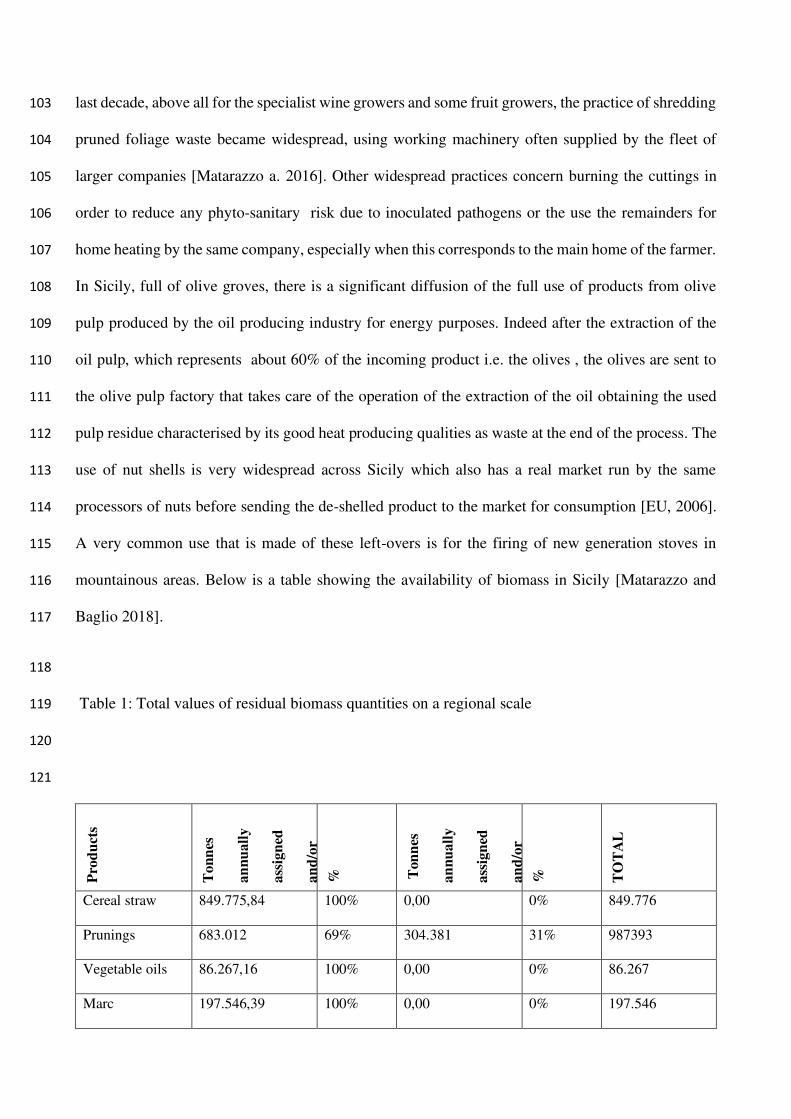
mountainous areas. Below is a table showing the availability of biomass in Sicily [Matarazzo and 116
Baglio 2018]. 117
118
Table 1: Total values of residual biomass quantities on a regional scale 119
120
121
Pro
du
cts
To
nn
es
an
nu
all
y
ass
ign
ed
an
d/o
r
%
Ton
nes
an
nu
all
y
ass
ign
ed
an
d/o
r
%
TO
TA
L
Cereal straw 849.775,84 100% 0,00 0% 849.776
Prunings 683.012 69% 304.381 31% 987393
Vegetable oils 86.267,16 100% 0,00 0% 86.267
Marc 197.546,39 100% 0,00 0% 197.546

Olive pulp 0,00 0% 152.703,33 100% 152.703
Fruit stones 11.150,92 100% 0,00 0% 11.151
Nut shells 9.832,87 15% 56.312,88 85% 66.146
TOTAL 1.837.585 78% 513.397 22% 2.350.982
122
123
124
Source: Report ENEA 2014 125
126
Table 1 explains very clearly, by sector and type, the huge unexploited potential of the region 127
compared to the existing capacity actually used for Energy purposes. Sicily is a large biological nest 128
of biomass that would allow for significant savings in terms of supplies from fossil fuels and a better 129
profitability for the farms that manage to diversify their own production and invest in the bio-energy 130
sector [IEA , 2008; Battiato 2011]. 131
132
Table 2 instead shows all the unused potential biomass in the region by a qualitative and quantitative 133
description on a provincial level of each individual type of biomass in each distinct Sicilian province; 134
the largest potential available is that of the by-products from farming, that is to say cereal straw and 135
pruning: pruning of vines, olive branches and citrus fruit tree pruning [Matarazzo and La Pira, 2015]. 136
137
Table 2: Maximum availability of pruning waste for biomass in the Sicilian provinces in 2014 in 138
Ktonn/year 139
PR
OV
INC
E
CE
RE
AL
ST
RA
W
OL
IVE
TR
EE
S
VIN
ES
FR
UIT
TR
EE
S
AR
BO
RE
A
L
CU
LT
IVA
T
Palermo 87,5 25 25 15 40
Trapani 65 25 87,5 5 150
Agrigento 40 40 40 25 62.5
Caltanissetta 40 15 5 15 25
Enna 62,5 25 0 25 25
Siracusa 15 15 0 40 40
Ragusa 25 0 0 5 15
Catania 40 15 5 40 62.5
Messina 5 40 0 40 63
Source: Data processing of the Enama Biomass Project 140
141
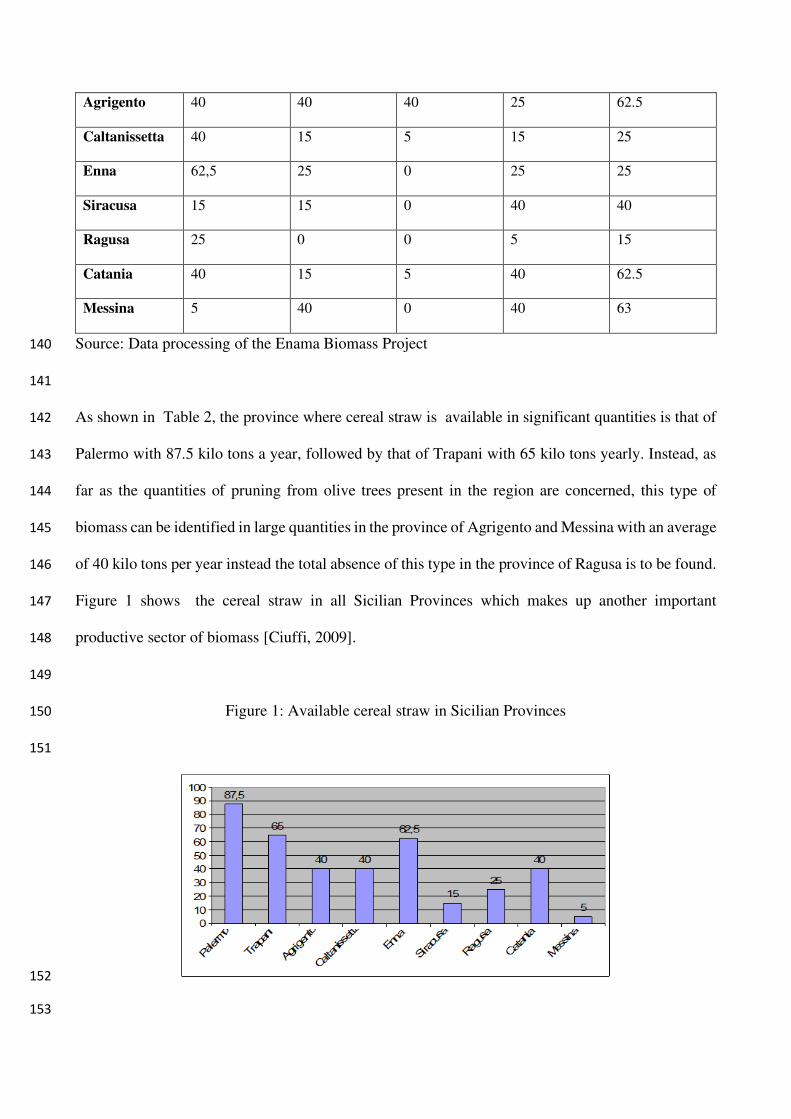
As shown in Table 2, the province where cereal straw is available in significant quantities is that of 142
Palermo with 87.5 kilo tons a year, followed by that of Trapani with 65 kilo tons yearly. Instead, as 143
far as the quantities of pruning from olive trees present in the region are concerned, this type of 144
biomass can be identified in large quantities in the province of Agrigento and Messina with an average 145
of 40 kilo tons per year instead the total absence of this type in the province of Ragusa is to be found. 146
Figure 1 shows the cereal straw in all Sicilian Provinces which makes up another important 147
productive sector of biomass [Ciuffi, 2009]. 148
149
Figure 1: Available cereal straw in Sicilian Provinces 150
151
152
153
Source: ENAMA Project 154
155
The presence of pruning cuttings from vines is also important. The province of Trapani is the regional 156
and national leader with a quantity equal to 87.5 kilo tons per year while in other provinces a total 157
absence is recorded for this biomass [RAEE, 2011; Matarazzo and La Pira, 2015]. 158
Sicily, however, has a significant availability of a particular type of biomass especially that related to 159
the pruning of fruit trees where it stands out as having the regional and national leadership. The region 160
manages to produce 210 kilo tons per year which represent 20% of the national production. 161
Another type of biomass that should not be neglected for its ready availability in the region is that 162
related to the cuttings from prunings of the arboreal cultivations which exist in Sicily where the 163
territorial supremacy is held by the province of Trapani with more than 150 kilo tons per year. 164
165
3. Description of the pilot plant project 166
The project's main objective is the creation of a biomass co-trigeneration plant, with an adjacent 167
network of district heating and cooling, to be allocated in the area of industrial development of Gela, 168
in the province of Caltanissetta. This project includes 6 different possible scenarios for configuration 169
and power production. 170
As far as the type of plant is concerned, the possible options to be assessed are: 171
• A network of district heating; 172
• A network of district heating and district cooling; 173
• Production of electrical energy only; 174
• Combining couples of all above alternatives into one plant. 175
As far as the power of the plant itself is concerned, the alternatives to be examined are: 176
• 1 MW; 177
• 1.8 MW. 178

Together with the plant, the intention is that of providing sustainable bio-energy production in a 179
highly degraded area from an environmental point of view, with the aim of obtaining immediately 180
reproducible and transferable results on the other industrial areas of the region as well. 181
The biomass coming from the agricultural production of the area is an extremely important energy 182
source which is readily available, can be stored for long periods, and which thus has economically 183
viable solutions .[Cherubini and Jungmeier, 2010 ]. The best way to exploit it is with the combined 184
production of electricity and heat in the cogeneration plants: in this specific case, small electricity 185
producing plants built near the users of this heating. This type of technology is generally feasible in 186
small plants and represents a very promising solution for the biomass cogeneration through the use 187
of turbo generators based on the Rankine cycle of organic fluid, referred to as the Organic Rankine 188
Cycle (ORC) given the nature of the fluid used [Matarazzo and La Pira, 2016]. 189
190
3.1 Technical features 191
By using a biomass heat generator the thermal oil is heated to very high operating temperatures, to 192
300 degrees, and then subsequently transferred to the turbo-generator. From this, by exploiting the 193
high oil temperature, steam is produced from an organic fluid which feeds the turbine inserted in its 194
interior, thus generating electricity. The thermal energy released by condensation is instead used to 195
heat buildings located in areas adjacent to the centre, via a district heating network. The plant 196
envisaged consists of a receiving station for the biomass, which will arrive by truck, together with a 197
system of elevation of the biomass which is fed into the boiler. A moving grate loads the fuel inside 198
the boiler. The products of combustion on leaving the kiln, go through a beam tuber economizer for 199
preheating the combustion air. The fumes produced are subsequently subjected to a dry cleaning 200
treatment by means of a double process of a cyclone separator and a bag filter reaching the atmosphere 201
through a chimney 14 and a half metres high and 1 meter wide. The combustion products give out 202
energy in the form of heat to the thermal oil which is circulated within a vertical axis exchanger 203
placed at the end of the kiln, which then transfers heat to organic fluid until it evaporates. The oil 204
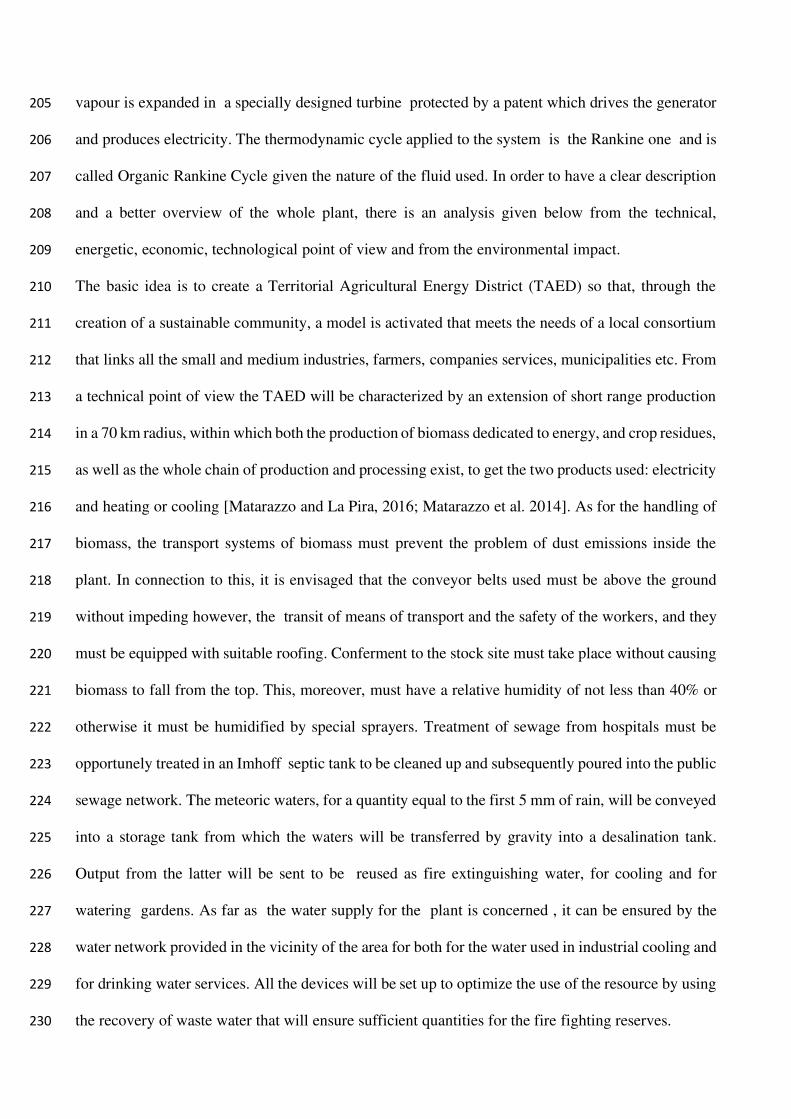
vapour is expanded in a specially designed turbine protected by a patent which drives the generator 205
and produces electricity. The thermodynamic cycle applied to the system is the Rankine one and is 206
called Organic Rankine Cycle given the nature of the fluid used. In order to have a clear description 207
and a better overview of the whole plant, there is an analysis given below from the technical, 208
energetic, economic, technological point of view and from the environmental impact. 209
The basic idea is to create a Territorial Agricultural Energy District (TAED) so that, through the 210
creation of a sustainable community, a model is activated that meets the needs of a local consortium 211
that links all the small and medium industries, farmers, companies services, municipalities etc. From 212
a technical point of view the TAED will be characterized by an extension of short range production 213
in a 70 km radius, within which both the production of biomass dedicated to energy, and crop residues, 214
as well as the whole chain of production and processing exist, to get the two products used: electricity 215
and heating or cooling [Matarazzo and La Pira, 2016; Matarazzo et al. 2014]. As for the handling of 216
biomass, the transport systems of biomass must prevent the problem of dust emissions inside the 217
plant. In connection to this, it is envisaged that the conveyor belts used must be above the ground 218
without impeding however, the transit of means of transport and the safety of the workers, and they 219
must be equipped with suitable roofing. Conferment to the stock site must take place without causing 220
biomass to fall from the top. This, moreover, must have a relative humidity of not less than 40% or 221
otherwise it must be humidified by special sprayers. Treatment of sewage from hospitals must be 222
opportunely treated in an Imhoff septic tank to be cleaned up and subsequently poured into the public 223
sewage network. The meteoric waters, for a quantity equal to the first 5 mm of rain, will be conveyed 224
into a storage tank from which the waters will be transferred by gravity into a desalination tank. 225
Output from the latter will be sent to be reused as fire extinguishing water, for cooling and for 226
watering gardens. As far as the water supply for the plant is concerned , it can be ensured by the 227
water network provided in the vicinity of the area for both for the water used in industrial cooling and 228
for drinking water services. All the devices will be set up to optimize the use of the resource by using 229
the recovery of waste water that will ensure sufficient quantities for the fire fighting reserves. 230

231
3.2 Energy features 232
The supply of the cogeneration plant will be provided not only by dedicated and implanted crops in 233
all those areas around the industrial area of Gela, but especially by the residual biomass available in 234
a radius of 70 km in an area spanning three provinces (Caltanissetta, Ragusa and Enna) characterized 235
by the presence of a widespread use of farm land. The land boundaries form a necessary limit to 236
minimize the impact and costs incurred in transporting the product from the farms to the processing 237
plant. To date in Sicily, only 22% of residual biomass is exploited for energy production: with respect 238
to almost 2,500,000 tons a year of residual biomass, only a small part (304,000 tons) is used annually 239
for the production of electricity. The implementation of a virtuous bio-energy plant, therefore, in the 240
Gela area and not only, would mean on the one hand the recovery and exploitation of crop residues 241
currently abandoned or burnt in the fields, on the other hand the production of electricity, heating or 242
cooling, with far lower unit costs than currently produced by the use of non-renewable sources. 243
As far as the thermal efficiency of the plant is concerned, defined by the ratio between the electric 244
and thermal energy produced and the energy input that is made available from the fuel used, in this 245
case the Best Available Technologies expect both the available energy components to be employable 246
in such a way that aforesaid ratio is between 75% and 90%. Moreover, some stratagems to improve 247
the thermal efficiency have been introduced, such as reduction of unburned waste, the elevation of 248
the enthalpy of the hot fluid in the inlet of the turbine, the reduction of heat losses by conduction, the 249
temperature of the ash. The optimum electrical efficiency of the plant, according to the BAT, must 250
not be less than 20%. The plant has a value of electric output equal to 20% thanks to a whole series 251
of expedients adopted for the recovery of heat. If there is no thermo-cooling load, the remaining 60% 252
of the thermal energy input will be dissipated in this way: 253
• 12% losses for route sensitive heat necessary for the release of smoke into the atmosphere; 254
• 3% radiation loss of the metallic parts of the oven; 255
• 45% available for horticultural greenhouses or district heating in general. 256

The Energy Return On Investment (EROI) is also calculated; this index is the ratio between energy 257
out (i.e., the energy content of the products) and the non-renewable energy in (i.e., all the non-258
renewable energy inputs, direct and indirect, required along the full life cycle [Hammerschlag 2006; 259
Cherubini and Jungmeier 2010]. 260
It is a coefficient that is used for a particular energy source, it indicates the expediency in terms of 261
energy efficiency and, algebraically, is the ratio between the energy produced and all the energy used 262
to obtain it. In particular, an energy source with an EROI lower than 1 is energetically at a loss; 263
therefore, energy sources with a EROI less than 1 cannot be considered primary sources of energy, 264
as their exploitation uses more energy than is produced. The EROI, therefore, proves to be an 265
important parameter for assessing, comparing and making strategic choices of supply among the 266
different energy sources available [Matarazzo and La Pira, 2016; Matarazzo et al. 2014]. 267
In order to fully assess the energy efficiency of the plant in question the following conditions have 268
been established: 7,000 hours of operation per annum and six different scenarios of production 269
configuration of the energy structure. In particular, three possible scenarios will be examined in 270
relation to the type of energy produced: 271
• Only the district heating network (scenario 1); 272
• Network of district heating and cooling (scenario 2); 273
• Production of electricity only (scenario 3). 274
and two different power levels in the plants: 275
• Plant with 1 MW 276
• Plant with 1.8 MW 277
After the computation of EROI index, i.e. the ratio Energy Gained (KW)/Energy Used (KW). 278
It can be said that the most competitive solution in terms of energy efficiency investment is related 279
to the district heating (scenario 1) with a power output of 1MW (EROI = 1.08). as a consequence, 280
our analysis is related to this kind of plant. 281

As already noted, the project involves the construction of a biomass cogeneration plant with the 282
installation of a network of district heating and cooling that will allow for the distribution of heat (hot 283
water, hot water or steam) and cooling energy (for a 6 °C) for most industrial and house users which 284
connected to the same network, will maintain their independence by autonomously managing their 285
own consumption. 286
As regards the co-trigeneration plant, a turbo generator will be installed integrated with a heating 287
system (i.e. a boiler) based on the ORC, technology for the combined production of electricity and 288
heat / cold, very similar to a traditional system of a turbine steam. Unlike the latter, the turbo generator 289
uses an organic working fluid with a high molecular mass thus allowing it to make effective use of 290
heat sources even at low temperature to produce electricity in a wide range of power, up to 10 MW 291
of electrical energy [Matarazzo and La Pira, 2016; Matarazzo et al. 2014]. 292
Compared to alternative technology (e.g. Steam cycles) the use of the ORC type of turbo generators 293
in the range from 0.5 to 5 MW entails many advantages, especially in terms of energy efficiency: 294
around 19% of the thermal power available at the source is converted into electricity, 79% is produced 295
at a high enough temperature for thermal use. 296
District heating and cooling is an innovative and environmentally friendly method for producing and 297
distributing heat for heating in winter and air-conditioning in the summer months. There are several 298
advantages that this type of innovation can offer both from the economic (lower maintenance costs; 299
lower energy consumption, lower noise) and from an environmental (total absence in the cooling of 300
chlorofluorocarbons - CFC's) point of view. 301
CFCs are a series of chemical compounds containing carbon, fluorine and chlorine and which are 302
normally used in the cooling industry. An investment that also includes the installation of a district 303
cooling network is justifiable only for those users who register high values of fuel consumption, as 304
in the case of an industrial area, where there can be companies that use also cooling energy, 305
specifically for their industrial processes. District cooling is an energy service that derives from the 306
same principle as district heating. Cold water is generally produced in the central co - trigeneration 307
plant by absorption machines powered by heat, that is, hot water, or superheated steam, sent to the 308
users thanks to networks similar to the district heating ones, consisting in pre-insulated steel pipes. In 309
the present case the district heating and district cooling network is made up of four pipes, which will 310
bring both hot and cold water. All this will allow users to be offered a full service winter and summer 311
air-conditioning, and from the point of view of production, make the most of the power plants and 312
networks. In particular, the cooling network will allow the use, at least in part, of the heat available 313
also in the summer period. 314
315
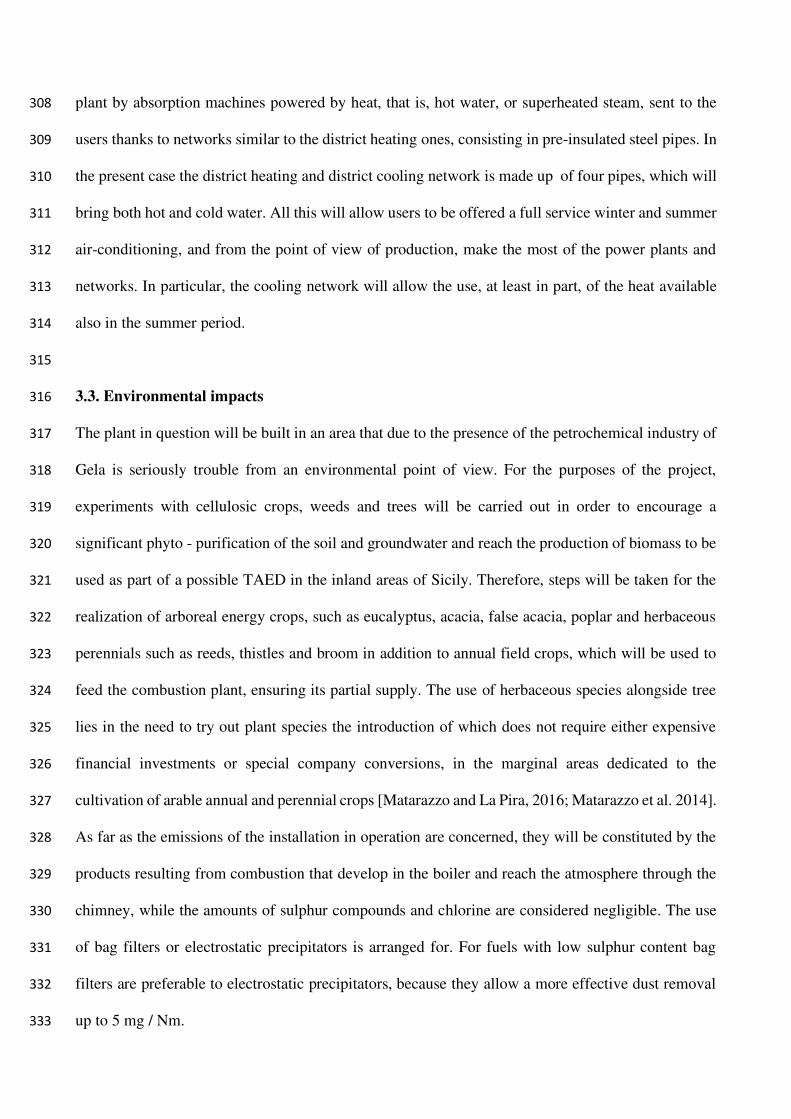
3.3. Environmental impacts 316
The plant in question will be built in an area that due to the presence of the petrochemical industry of 317
Gela is seriously trouble from an environmental point of view. For the purposes of the project, 318
experiments with cellulosic crops, weeds and trees will be carried out in order to encourage a 319
significant phyto - purification of the soil and groundwater and reach the production of biomass to be 320
used as part of a possible TAED in the inland areas of Sicily. Therefore, steps will be taken for the 321
realization of arboreal energy crops, such as eucalyptus, acacia, false acacia, poplar and herbaceous 322
perennials such as reeds, thistles and broom in addition to annual field crops, which will be used to 323
feed the combustion plant, ensuring its partial supply. The use of herbaceous species alongside tree 324
lies in the need to try out plant species the introduction of which does not require either expensive 325
financial investments or special company conversions, in the marginal areas dedicated to the 326
cultivation of arable annual and perennial crops [Matarazzo and La Pira, 2016; Matarazzo et al. 2014]. 327
As far as the emissions of the installation in operation are concerned, they will be constituted by the 328
products resulting from combustion that develop in the boiler and reach the atmosphere through the 329
chimney, while the amounts of sulphur compounds and chlorine are considered negligible. The use 330
of bag filters or electrostatic precipitators is arranged for. For fuels with low sulphur content bag 331
filters are preferable to electrostatic precipitators, because they allow a more effective dust removal 332
up to 5 mg / Nm. 333
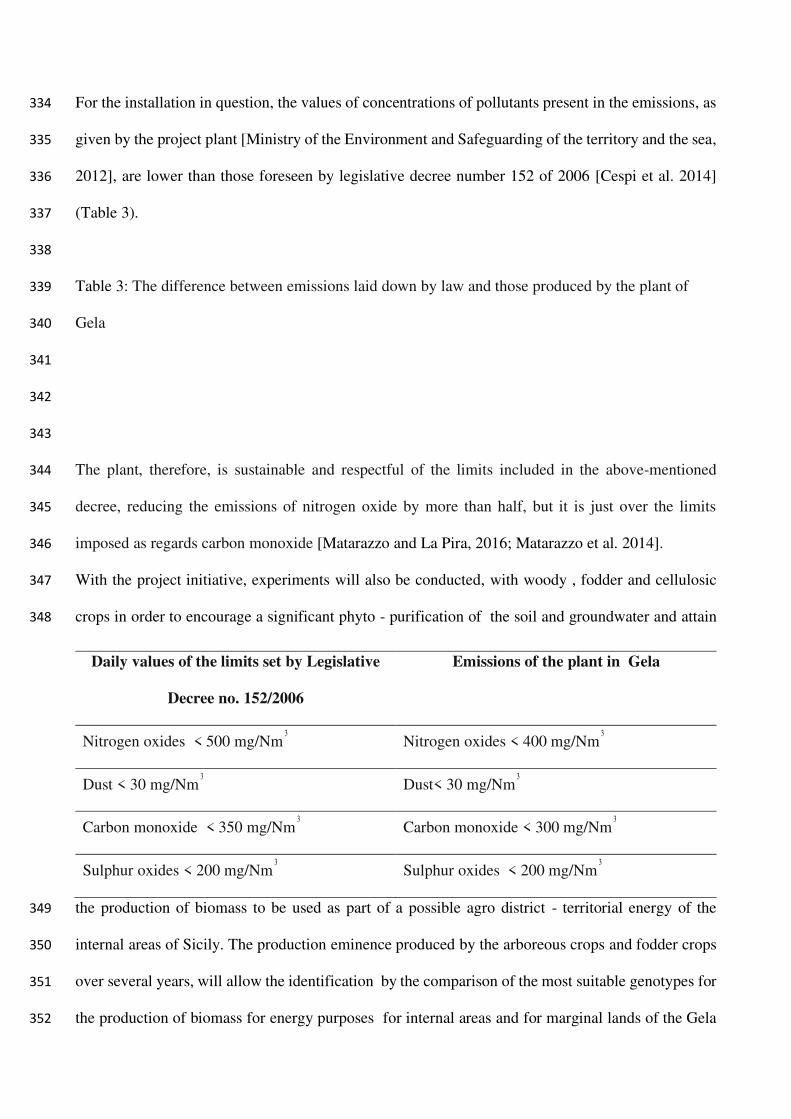
For the installation in question, the values of concentrations of pollutants present in the emissions, as 334
given by the project plant [Ministry of the Environment and Safeguarding of the territory and the sea, 335
2012], are lower than those foreseen by legislative decree number 152 of 2006 [Cespi et al. 2014] 336
(Table 3). 337
338
Table 3: The difference between emissions laid down by law and those produced by the plant of 339
Gela 340
341
342
343
The plant, therefore, is sustainable and respectful of the limits included in the above-mentioned 344
decree, reducing the emissions of nitrogen oxide by more than half, but it is just over the limits 345
imposed as regards carbon monoxide [Matarazzo and La Pira, 2016; Matarazzo et al. 2014]. 346
With the project initiative, experiments will also be conducted, with woody , fodder and cellulosic 347
crops in order to encourage a significant phyto - purification of the soil and groundwater and attain 348
the production of biomass to be used as part of a possible agro district - territorial energy of the 349
internal areas of Sicily. The production eminence produced by the arboreous crops and fodder crops 350
over several years, will allow the identification by the comparison of the most suitable genotypes for 351
the production of biomass for energy purposes for internal areas and for marginal lands of the Gela 352
Daily values of the limits set by Legislative
Decree no. 152/2006
Emissions of the plant in Gela
Nitrogen oxides < 500 mg/Nm3 Nitrogen oxides < 400 mg/Nm
3
Dust < 30 mg/Nm3 Dust< 30 mg/Nm
3
Carbon monoxide < 350 mg/Nm3 Carbon monoxide < 300 mg/Nm
3
Sulphur oxides < 200 mg/Nm3 Sulphur oxides < 200 mg/Nm
3

plain, also considering the contextual need for landscape and environmental improvement besides 353
the reclamation of agricultural or industrial areas. Nutrition tests will be carried out on soil and/or 354
fertilizers of organic origin. Water requirements will be analysed in relation to the types of plants. 355
Soil and weather conditions, as well as different types of equipment and machinery for planting and 356
harvesting will be checked [Faist Emmenegger et al. 2012]. 357
The use of switch grass in a bio-refinery offsets GHG emissions and reduces fossil energy demand: 358
GHG emissions are decreased by 79% and about 80% of non-renewable energy is saved. Soil C 359
sequestration is responsible for a large GHG benefit (65 kt CO2-eq/a, for the first 20 years), while 360
switchgrass production is the most important contributor to total GHG emissions of the system. If 361
compared with the fossil reference system, the bio-refinery system releases more N2O emissions, 362
while both CO2 and CH4 emissions are reduced. The investigation of the other impact categories 363
revealed that the bio-refinery has higher impacts in two categories: acidification and eutrophication. 364
Even if a reduction in GHG emissions and fossil energy consumption is achieved, it should not be 365
forgotten that additional environmental impacts (like acidification and eutrophication) may be caused. 366
This aspect cannot be ignored by policy makers, even if they have climate change mitigation 367
objectives as main goal. 368
This bio-refinery system is an effective option for mitigating climate change, reducing dependence 369
on imported fossil fuels, and enhancing cleaner production chains based on local and renewable 370
resources. 371
An important variable in LCA studies of biomass systems based on dedicated crops is the contribution 372
to GHG emissions of N2O, which evolves from nitrogen fertilizer application and organic matter 373
decomposition in soil [Stehfest and Bouwman 2006]. Emissions from fields vary depending on soil 374
type, climate, crop, tillage method, and fertilizer application rates [Larson 2005]. 375
376
4. Financial and economic analysis of the project 377
The most important information necessary for carrying out an economic analysis of the project in 378
terms of benefit-cost effectiveness of the construction of the plant concern the investment costs, 379
operating costs and potential income from the sale of electricity, heat and cooling. From the financial 380
point of view, the assessment and the analysis of cash flows, the capital market interest rate and other 381
parameters are necessary information for calculating the most important indicators, such as present 382
value of cash flows, internal rate of return and other indexes [Berck, et al. 2013] required for a correct 383
investment appraisal. 384
Firstly, it is necessary to know if the investment project is completely funded or only partly funded 385
by private capital and how additional financial resources are to be acquired [Brealey et al., 2015] . In 386
particular, if the market is resorted to through medium- long term loans and if public financial 387
incentives are envisaged, such as subsidies or interest or capital accounts to be paid entirely by the 388
State or other local authorities. 389
Actually the initial idea of the project comes from private investors, that were very interested to set 390
up this pilot plant in that area, taking into account its great potential development, also as example of 391
best practice in the Island. Therefore, seeing that recently government intervention in capital 392
contributions has not been made or planned [Polytechnic of Milan, 2016], also taking into account 393
their uncertainty both in normative terms and in provision time, private investors have sponsored this 394
project, without taking into consideration public financial funding, at national or local level. As a 395
consequence, despite the very important public advantages in socio-economic terms and the 396
environmental impact for the local area, in the present study – as suggested by the private investors - 397
for prudential reasons it was assumed that the entire project is financed by recourse to the capital 398
market, in particular through a ten-year loan. Consequently, profitability requirements at private level 399
have to be very carefully considered in this economic and financial analysis, concerning the cost-400
effectiveness of the project, and its financial equilibrium and cash flow analysis respectively, 401
regardless the public benefits of the project (e.g. impact on the unemployment, environmental benefits 402
and so on), which will be omitted, according to the particular scope of this study. 403

With reference to the interest rate applied by brokers, the rate usually used by banks for similar 404
investments has been considered. Of course, that rate depends on many factors such as the expected 405
profitability of the project, the risk level for similar investments and the duration of the loan, as well 406
as the contingent market situations. Considering these factors and the spread usually applied over 407
EURIBOR (Euro Interbank Offered Rate) in market periods before the current financial crisis, it was 408
believed that a reliable value of this rate may fluctuate between 5% and 7%. The mortgage period409
of 10 years was assumed. 410
Having outlined the assumptions concerning the financing of the project, all investment costs and 411
relevant accounting period were directly supplied by the company. In particular, it can be seen that 412
the equipment costs directly related to energy production (combustor, boiler, ORC group) make up 413
about 60% of the total investment cost. It is also noted that an estimate of the costs of the district 414
heating network and district cooling is very difficult to make in a preliminary phase of the project. 415
The planner has however provided an estimate of them to the extent of about 16% or 29% of the total 416
investment costs depending on whether only district heating or both services are envisaged. 417
As for the operating and maintenance costs, these were estimated on an annual basis, net of tax, 418
assuming a constant rate in real terms, i.e. after deduction of any inflationary phenomena, for the 419
whole economic life of the project, considered in 25 years, with the exception of depreciation and 420
amortization, calculated in 10 yearly fixed postponed instalments. The hypothesis of considering 421
constant periodic costs in real terms is the most frequently adopted one in similar studies. Disposal 422
costs were not included, since the useful life of the project is presumed to be longer than the economic 423
one used here for analysis, because a useful conversion of the plants is considered possible and 424
significant environmental reclamation costs are not envisaged. Moreover, an assessment of all these 425
costs is extremely difficult. But it should be kept in mind that the "new" RER plan (Polytechnic of 426
Milan, 2016] envisages an "economic" lifespan of 20 years for these plants. 427
Revenues envisaged from the plant construction are critically dependent on the actual electricity 428
produced and sold on the market and on the corresponding incentive rate, as well as other premiums 429

and special incentives for these types of plants. To this end, the elasticity of Net Present Value (NPV) 430
was calculated with respect to the most important economic (costs, price, premium of input and 431
energy, sales volume, time span) financial (interest rate, loan duration) variables. An effective power 432
production of 6790 MWh per year has been envisaged, with a sale price of euro 180 MWh. Production 433
and the actual supply of thermal energy and cooling energy to the network assume an equally 434
important role for this type of plant. The analysis has envisaged a production of only 28,560 MWh 435
of thermal energy, while, if cooling energy is also produced, a production of 20,000 MWh is assumed. 436
Predicting the proportion of this energy actually used is extremely difficult, even in view of the 437
novelty that it represents at least for the local market. In this study it was therefore considered 438
preferable to simulate different scenarios, corresponding to different combinations of heat and cooling 439
energy fractions actually used, considering fractions of respectively 20%, 40% and 60% for thermal 440
energy and 30% and 60% for cooling. For both of these forms of energy a 40 € / MWh sale price was 441
assumed [Polytechnic of Milan, 2016]. Finally, the extreme case of the sole production of electricity 442
or electricity and heat together was deliberately considered, assuming the use of the entire fraction of 443
the latter. 444
Founded on the information provided by the analysis, three different assumptions are also considered 445
regarding the manufacturability of CAR electricity, the technical and economic data are shown in 446
Tab. 4 (where 1K€ = 1,000€). Based on these, the cash flows of the project were constructed for the 447
calculation of the financial ratios to assess the cost effectiveness of the investment. To this end, a time 448
span of 25 years, and a loan equal to the amount of capital required C have been conjectured. This 449
loan started at the beginning of the plant’s construction ( "Year Zero") and was reimbursed in 10 450
yearly constant postponed instalments Ry calculated at 5% rate j, according to the formula jny CR ,=451
, where jn, denotes the annual instalment to amortize in n 452
years a unitary capital at the rate j. 453
454

Table 4: Technical and economic data relating to three scenarios 455
456
PR
ICE
S,
RA
TE
S,
UN
ITA
RY
INC
EN
TIV
ES
Mea
suri
ng
Unit
Ele
ctri
city
Ele
ctri
city
and
ther
mal
ener
gy
Ele
ctri
city
hea
t an
d
cooli
ng
Electricity sales
Euro/MWh 180 180 180
Award for emissions below the limits Euro/MWh 30 30 30
Price of thermal energy Euro/MWh 40 40 40
Price of cooling energy Euro/MWh 40 40 40
Biomass purchase price Euro/t 30 30 30
INVESTMENT COSTS
Combustor, boiler, flue gas treatment system(thousand) (K€) 2500 2500 2500
ORC group (K€) 1500 1500 1500
Power boards , services (K€) 1000 1000 1250
civilian works (thousand) (K€) 700 700 700
district heating network (thousand) (K€) 0 1100 2350
Total (K€) 5700 6800 8300
TECHNICAL DATA (per year)
Electricity production MWh 6790 6790 6790
Thermal energy production MWh 28560 28560 28560
Cooling energy production MWh 0 0 20000
Biomass consumption t 11331 14164 15545
% production % 20 40 60
CAR electricity MWh 1547 3093 4610
Yearly hourly equivalent Hours/year 7000 7000 7000

Plant’s lifetime years 25 25 25
457
In order to take into account the high degree of uncertainty in particular production and the actual use 458
of the heating and cooling energy produced, which also includes the construction of a district heating 459
network and possibly cooling within the project, but for which the randomness of the demand is very 460
high, different scenarios were simulated, as mentioned for the use of combinations of fractions of such 461
energy types. In particular, the calculations were made on the basis of the following three pairs of heat 462
/ cooling energy fractions used 0.2 / 0.3, 0.4 / 0.3 and 0.6 / 0.6. The scenarios corresponding to the 463
"extreme" situations are also taken into consideration, i.e. assuming the sole production of electricity 464
alone or electricity and heat, excluding the cooling energy. Such simulations are to be taken seriously 465
in any case in a preliminary study, where - as mentioned - the degree of uncertainty for the effective 466
use of renewable energy is very high. 467
For all of these scenarios, the Net Present Value (NPV), the Internal Rate of Return (IRR), and the 468
Profitability Index (PI) corresponding to a discount rate i of 6% are provided in Tab.5. Appropriate 469
sensitivity analyses were then carried out, by calculating the Discounted Cash Flow (DCF) of the 470
different scenarios varying the discount rate i in the interval 1-20% (Tab. 6). From this table and from 471
its graphic representation (Figure 2), moreover, it is also possible to see immediately how the DCF 472
varies according to the different rates assumed, by observing in particular also the IRR, that is the 473
discount rate in which the DCF changes sign (from positive to negative). The third graph (Figure 3) 474
shows the values of the cumulative NPV, on the basis of several years of the plant’s life. The 475
intersections of each curve with the x-axis represent respectively the IRR (Figure 2) and the 476
Discounted Payback (DPB) (Figure 3), at the rate of 6%, while from the performance of the same 477
graph it can be seen immediately how the cost-effectiveness (NPV) varies on the basis of the duration 478
of the life of the project. 479
480
481

Table 5: Values of the NPV, IRR, PI, computed at the discount rate of 6%. 482
Fractions of thermal energy 0.2 0.4 0.6
Fractions of cooling energy 0.3 0.3 0.6
NPV (K€) -3838.13079 -1315.72 4259.87
IRR 0.025815168 0.048591 0.095718
PI -0.4624254 -0.15852 0.513237
483
484
Table 6: DCF (K€) as a function of discount rate i for different thermal / cooling energy fraction 485
pairs 486
Fractions 0.2/0,3 0.4/0,3 0.6/0.6
Rate i
0.01 2835,841 7181.45 16787.07
0.02 941.6762 4794.045 13309.4
0.03 -614.653 2821.31 10416.23
0.04 -1897.54 1185.012 7998.738
0.05 -2958.33 -177.313 5969.902
0.06 -3838.13 -1315.72 4259.87
0.07 -4569.94 -2270.46 2812.368
0.08 -5180.36 -3074.02 1581.894
0.09 -5690.89 -3752.7 531.5177
0.1 -6118.96 -4327.88 -368.84
0.11 -6478.77 -4817 -1143.77
0.12 -6781.9 -5234.3 -1813.43
0.13 -7037.84 -5591.49 -2394.44

0.14 -7254.36 -5898.2 -2900.5
0.15 -7437.9 -6162.39 -3342.99
0.16 -7593.74 -6390.66 -3731.36
0.17 -7726.28 -6588.49 -4073.49
0.18 -7839.17 -6760.44 -4375.99
0.19 -7935.43 -6910.33 -4644.41
0.2 -8017.62 -7041.36 -4883.42
487
Figure 2: DCF (K€) graph as a function of i for different thermal / cooling energy fractions 488
489
490
491
It is observed that the NPV in the case of joint production of electricity, heating and cooling energy 492
is positive only in the case of heating and cooling energy use in fractions 0.60 / 0.60, with an NPV of 493
4259.87 K€, a PI of 0.513, a DPB of about 16 years and an IRR equal to 9.6%, while for the other 494
pairs of conjectured fractions the plant presents no economic advantage computed at the 6% discount 495
rate (there is indeed IRR equal to 2.6% and 4.9% respectively for couples 0.2 / 0.3, and 496
0.4 / 0.3). 497
The production of electrical and thermal energy, but not cooling, with reference to the pairs of thermal 498
/ cooling energy fractions still considered, the NPV is positive only in the case of the scenario 499
-10000
-5000
0
5000
10000
15000
20000
0,0
1
0,0
3
0,0
5
0,0
7
0,0
9
0,1
1
0,1
3
0,1
5
0,1
7
0,1
9
0.20/0.30
0.40/0.30
0.60/0.60

assuming an effective use of thermal energy in the fraction of 0.60. In this case, in fact, an NPV of 500
K€ 1583.22, a PI of 0.20 and a 7.6% IRR, with a DPB of about 20 years, are obtained, a scenario that 501
still highlights a cost effective situation but a less profitable one than that envisaging the joint 502
production also with cooling energy (previous scenario). It should be noted, however, that considering 503
the most optimistic scenario of just using thermal energy, without production of cooling energy, a 504
better economic situation would be obtained than all those previously considered, with an NPV of 505
K€ 7424.70, a PI of 1.09 and an IRR of 13.5%; these latest results are economically interesting and 506
highlight once again the crucial role of the actual use of the all thermal energy produced, in the 507
realistic hypothesis of foregoing cooling energy production. 508
509
Figure 3: Cumulative NPV (K€) as a function of the time (years) for different thermal/cooling energy 510
fractions. 511
512
513
Finally, in the scenario corresponding to the case of only producing electricity, whatever the level 514
conjectured for the manufacturability of CAR electricity, taking account of lower total cost of 515
purchasing biomass and while not taking into consideration the construction costs of a district heating 516
network, a negative NPV and an IRR between 1.1% and 3.3% is obtained in any case, depending on 517
the particular assumptions considered. However, the results indicate the lack of cost effectiveness for 518
the construction of the plant [Matarazzo et al. 2018].. 519
-10000
-8000
-6000
-4000
-2000
0
2000
4000
6000
0 2 4 6 8 10121416182022240.2/0.3
0.4/0.3
0.6/0.6

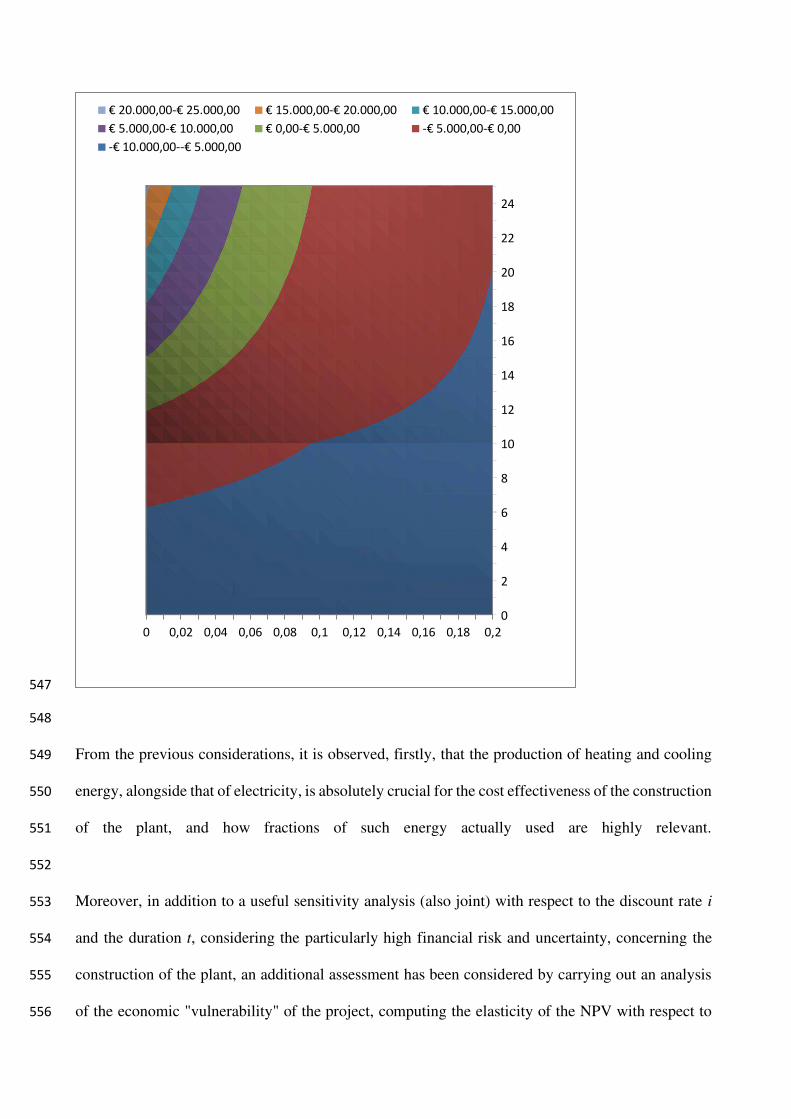
Two 3D graphs where then drawn up to show the combined effect on the NPV of the change of the 520
discount rate i (range of 0% - 20%) and the life t of the project (0-25 years). In the first graph (Figure. 521
4) the NPV as a function of (i, t) is graphically rshown in correspondence with the fractions 0.6 / 0.6 522
thermal / cooling energy used, namely the three-dimensional surface where the different colours 523
indicate particular ranges of NPV values, in K€. It is very interesting to see how extensive is the area 524
is corresponding to negative values of the NPV, that is - in the geometric-intuitive terms - how high 525
the "probability" is of having negative economic result by implementing the project under 526
consideration. Obviously, the most favourable results in terms of NPV can be seen immediately, these 527
are obtained for low values of the rate i (up to 5%) and high values of the time t (at least 22 years). In 528
Figure 5, instead, the horizontal sections of the surface described beforehand in correspondence with 529
various values of the NPV (in K€) are shown. The curves of the NPV level (so-called "indifference 530
curves") are clearly highlighted, showing the different pairs (i, t), i.e. interest rate - duration of the 531
project, that provide the same value of the NPV [Munda and Matarazzo 2019]. This graph also shows 532
very clearly the remarkable extension of the area corresponding to negative values of the NPV, that is 533
an immediate perception in intuitive terms of economic and financial "riskiness" of the investment 534
project based on the i and t parameters. 535
536
537
Figure 4: Three-dimensional graph of NPV (K€) as a function of the rate i and the time t 538
539

540
541
542
543
Figure 5: Horizontal sections of the NPV (K€) and indifference curves according to the pairs i, t 544
(discount rate, time) 545
546
02
46
810
1214
1618
2022
24
-10000
-5000
0
5000
10000
15000
20000
25000
0
0,0
2
0,0
4
0,0
6
0,0
8
0,1
0,1
2
0,1
4
0,1
6
0,1
8
0,2
20000-25000 15000-20000 10000-15000 5000-10000
0-5000 -5000-0 -10000--5000
547
548
From the previous considerations, it is observed, firstly, that the production of heating and cooling 549
energy, alongside that of electricity, is absolutely crucial for the cost effectiveness of the construction 550
of the plant, and how fractions of such energy actually used are highly relevant. 551
552
Moreover, in addition to a useful sensitivity analysis (also joint) with respect to the discount rate i 553
and the duration t, considering the particularly high financial risk and uncertainty, concerning the 554
construction of the plant, an additional assessment has been considered by carrying out an analysis 555
of the economic "vulnerability" of the project, computing the elasticity of the NPV with respect to 556
0
2
4
6
8
10
12
14
16
18
20
22
24
0 0,02 0,04 0,06 0,08 0,1 0,12 0,14 0,16 0,18 0,2
€ 20.000,00-€ 25.000,00 € 15.000,00-€ 20.000,00 € 10.000,00-€ 15.000,00€ 5.000,00-€ 10.000,00 € 0,00-€ 5.000,00 -€ 5.000,00-€ 0,00-€ 10.000,00--€ 5.000,00

some of the most significant economic variables, as a measure of the corresponding degree of 557
uncertainty. More precisely, the degree of elasticity of the NPV was calculated, that is, what 558
percentage the NPV varies on a variation of 1% of the quantities of the variables considered each 559
time, the local volatility of NPV. A positive value of this degree of elasticity indicates a movement 560
in the same direction of the quantities considered (either increasing or decreasing); a negative one, 561
in the opposite direction (one grows, the other decreases and vice versa). If this indicator is greater 562
than 1 in absolute value, it means that the sensitivity of the NPV, independently on the specific units 563
of measurement, is particularly high and, therefore, the assessment value in question must be 564
considered with particular care. 565
Table 6 shows the values of the degree of elasticity of the NPV with respect to the price of electricity 566
sold, the premium for emissions below legal limits, the premium for thermal energy and the unit 567
price of biomass, in the different scenarios considered of joint production of heating and cooling 568
energy with fractions 0.20 / 0.30, 0.40 / 0.30 and 0.60 / 0.60 or only thermal. 569
570
Table 6: Degree of elasticity of the NPV 571
% use of thermal/ cooling energy
Degree of elasticity of NPV with
respect to:
with cooling
energy.
0.2/0,3 0.4/0,3 0.6/0.6
Energy sale price
41.24915186 7,288434 3.667671
Inf. emissions award premium
6.874902645 1,214755 0.611263
Thermal energy premium.
9.799640414 3.462797 2.610267
Biomass price
-
14.3406667
-2.53396
-1.39948
% use of thermal energy
Degree of elasticity of NPV with
respect to:
without cooling
energy.
0.2 0.4 0.6
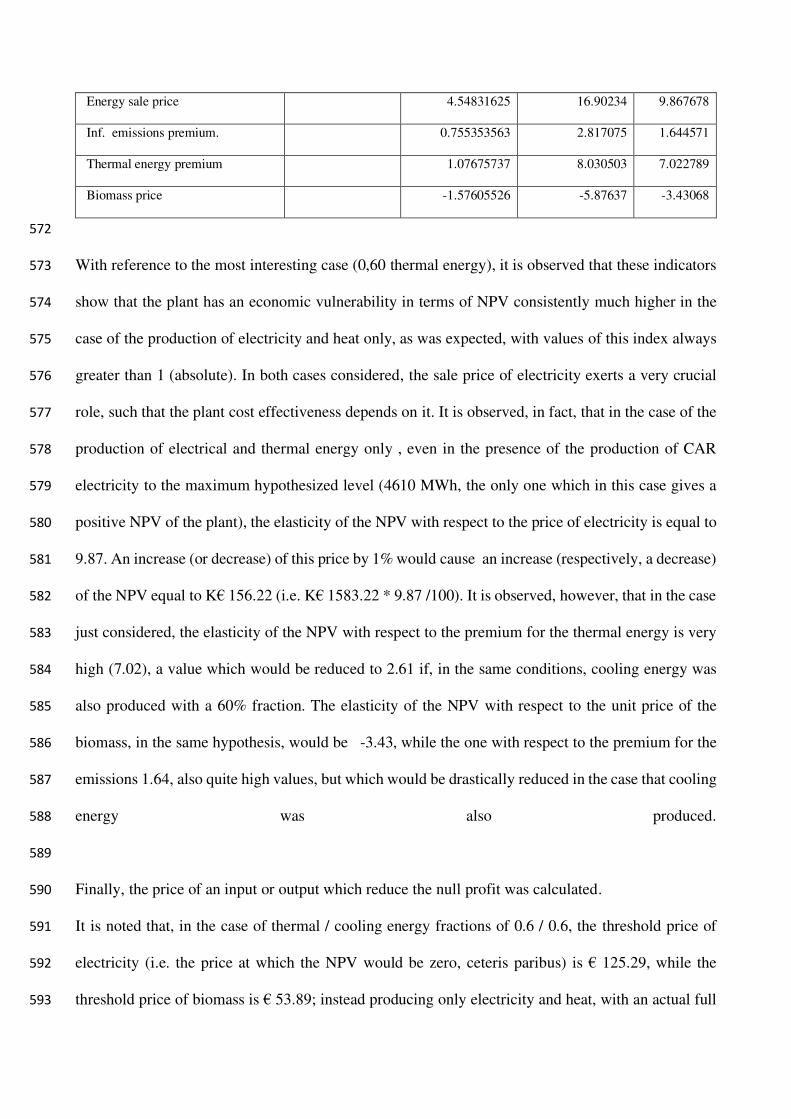
Energy sale price
4.54831625 16.90234 9.867678
Inf. emissions premium.
0.755353563 2.817075 1.644571
Thermal energy premium
1.07675737 8.030503 7.022789
Biomass price
-1.57605526 -5.87637 -3.43068
572
With reference to the most interesting case (0,60 thermal energy), it is observed that these indicators 573
show that the plant has an economic vulnerability in terms of NPV consistently much higher in the 574
case of the production of electricity and heat only, as was expected, with values of this index always 575
greater than 1 (absolute). In both cases considered, the sale price of electricity exerts a very crucial 576
role, such that the plant cost effectiveness depends on it. It is observed, in fact, that in the case of the 577
production of electrical and thermal energy only , even in the presence of the production of CAR 578
electricity to the maximum hypothesized level (4610 MWh, the only one which in this case gives a 579
positive NPV of the plant), the elasticity of the NPV with respect to the price of electricity is equal to 580
9.87. An increase (or decrease) of this price by 1% would cause an increase (respectively, a decrease) 581
of the NPV equal to K€ 156.22 (i.e. K€ 1583.22 * 9.87 /100). It is observed, however, that in the case 582
just considered, the elasticity of the NPV with respect to the premium for the thermal energy is very 583
high (7.02), a value which would be reduced to 2.61 if, in the same conditions, cooling energy was 584
also produced with a 60% fraction. The elasticity of the NPV with respect to the unit price of the 585
biomass, in the same hypothesis, would be -3.43, while the one with respect to the premium for the 586
emissions 1.64, also quite high values, but which would be drastically reduced in the case that cooling 587
energy was also produced. 588
589
Finally, the price of an input or output which reduce the null profit was calculated. 590
It is noted that, in the case of thermal / cooling energy fractions of 0.6 / 0.6, the threshold price of 591
electricity (i.e. the price at which the NPV would be zero, ceteris paribus) is € 125.29, while the 592
threshold price of biomass is € 53.89; instead producing only electricity and heat, with an actual full 593

use of the latter, the threshold prices would respectively be € 94.46 and € 71. Therefore, in the case 594
of the production of electricity and heat only, there is a greater margin of reduction in the threshold 595
price of electricity (i.e. from € 125.29 to € 94.96), while the threshold purchase price of biomass 596
would be confined to a narrower range (€ 53.89 to € 71), particularly for its greater consumption 597
required. 598
These threshold prices, while indicating that only quite a significant change from assumed prices (€ 599
180 and € 30 respectively) has an effective impact on the profit, however, draw attention in terms of 600
evaluation of uncertainty with regard to the analysis of cost effectiveness and the plant’s economic 601
and financial riskiness. 602
603
5. Results and discussion 604
605
The study carried out represents a detailed technical, economic and financial analysis of a pilot project 606
of energy plants using biomass sources. Bioenergy policy-making is fundamentally a future-oriented, 607
globally aware activity [Madlener and Koller 2007]. The use of biomass as a raw material for 608
bioenergy and biochemical production is encouraged by the need for a secure energy supply, a 609
reduction of fossil CO2 emissions, and a revitalization of rural areas. Biomass energy and material 610
recovery is maximized if a bio-refinery approach is considered, where many technological processes 611
are jointly applied [Cespi et al., 2014]. 612
The use of switch grass in a bio-refinery offsets GHG emissions and reduces fossil fuel demand: GHG 613
emissions are decreased if compared with the fossil reference system, the bio-refinery system releases 614
more N2O emissions, while both CO2 and CH4 emissions are reduced, so this system is an effective 615
option for mitigating climate change, reducing dependence on imported fossil fuels, and exploiting 616
cleaner production chains based on local and renewable resources. However, this assessment 617
highlights that an assessment of the real GHG and energy balance (and all other environmental impacts 618
in general) is complex (Cherubini 2010). 619

Energy conversion systems using woody biomass have not been fully developed compared to the 620
conventional fossil fuel or nuclear power generation systems [Verma et al. 2009].. The 621
commercialization of this technology has been rather slow because the cost of power generation is 622
rather expensive and because of the uncertainties of the newly developed system which is not as 623
common as the conventional ones [Solomon et al., 2007; Um van Walsum 2010]. However, 624
emergence of new technologies and future possible developments will possibly enable biomass 625
energy conversion systems to become a new and important renewable energy production system 626
[Helinet al 2014]. The use of biomass as raw materials for bioenergy and biochemical production is 627
encouraged by the need for a secure energy supply, a reduction of fossil CO2 emissions, and a 628
revitalization of rural areas. 629
In the light of this, the bio-energy project at the Gela plant could beneficially influence the territory 630
where it is based thanks to benefits linked to its building, clearly based on the hypotheses mentioned 631
above. The installation of networks of district heating and cooling allows for the distribution of heat 632
produced in various ways: hot water, overheated or in the form of steam. This diversification of the 633
indicated energy supply will permit a greater possibility of choice for the companies that exist in the 634
territory about the company’s needs with regard to the type of heat required for the optimal 635
functioning of production. The supply of cooling energy is also envisaged at a temperature of 6 636
degrees centigrade which could mean an excellent chance of supply and an incentive for companies 637
that need energy at low temperatures. Moreover, the foreseen system of energy supply will allow a 638
leap forward for the territory from the technological point of view, with its implementation. The 639
investment for the creation of a biomass plant also includes, as often pointed out, the installation of 640
a network of district cooling. This is justifiable only for those users, as in the case of the industrial 641
area, where there are companies that use it as well as cooling energy specifically for their industrial 642
processes. 643
The implementation on the territory of the bio-energy plant from a macro-economic point of view 644
could significantly increase employment in the area, without considering the impact it could have on 645

the industry and the firms using the plant and on the farmer income. In conclusion, the effects that 646
the initiative in question could have on the Sicilian socio-economic context take on significant 647
importance both in reference to improving the environment impact on soil and air and public health, 648
reducing greenhouse gas emission, and in consideration of the development in the energy supply 649
with the introduction of biomass technology and much lower management costs for the companies. 650
Local government must learn how to take advantage of the opportunity offered by the initiative of a 651
biomass energy producing plant in Gela. The regional province of Caltanissetta, in the sphere of such 652
an initiative, has staked a lot on a policy based on the green economy and therefore on a strategy 653
which allows them to pursue important targets in energy and environmental policy through the 654
sustainable management of the territory which would become a forerunner of a new energy model. 655
The cost effectiveness of the project is, however, very uncertain considering only the private point of 656
view, as formerly underline. From this perspective, it only seems interesting in the case of joint 657
production and effective use of heating and cooling energy and the actual duration of the plant 658
suggested 25-year time span. 659
Unfortunately, the evaluation of many of the physical and economic quantities magnitudes necessary 660
for the calculation of the cash flow is very difficult and presents a high degree of randomness. To 661
initially estimate this uncertainty, a sensitivity analysis was made (NPV compared to the interest 662
rate i and t the life time of the plant) and the degree of elasticity of the NPV compared to some 663
particularly significant units of measurement were also calculated. The results clearly show a very 664
high economic dependence (“volatility”) of the NPV, in particular with respect to the electricity 665
selling price and the premium for thermal energy, taking thus a crucial role in the cost effectiveness 666
of the project. 667
The reduced margins of the economic advantage in the construction of the plant considered by a 668
private investor, taking into account the very important and significant benefits in environmental, 669
economic and social impact on the area concerned, should urge the competent central and local 670
political authorities to encourage the construction of plants of this type. Public capital in financing 671
the project would thus be highly desirable and/or adequate financial measures in terms of capital 672
grants or tax incentives and economic rewards, to make the construction of biomass plants for energy 673
production financially attractive be significantly envisaged e.g. Searchinger et al. 2008; Hertel et al. 674
2010; Barona et al. 2010]. 675
State resources, moreover must be sufficient to give a substantial and crucial impulse to this kind of 676
plant, for the production of energy with a low environmental impact, without weighing on the budgets 677
in un unsustainable way, and assuring an equal division of the added value among all the plants of 678
the industrial sector. The role of the local and regional governments will be therefore decisive. 679
Finally, the building of plants of energy production and co-generation, and the related financial 680
measures for their support, like economic incentives and tax relief for virtuous initiatives, as well as 681
scientific and technological research, are the cornerstones which cannot be disregarded in order to 682
achieve an efficient, sustainable energy system capable of fostering the development of the territory. 683
Sicily could, indeed, exploit an extraordinary patrimony and revive a sector in serious crisis. It must 684
be underlined that agriculture could become the link between the economic recovery of the sector 685
and electricity production by using vegetable biomass, with several advantages for all the industrial 686
sector and for the people living in that area. 687
688
6. Conclusion 689
690
In this study an in-depth economic and financial analysis was made of a pilot production project 691
planned in the territory of Eastern Sicily in the biomass sector. After a brief drawing of the economic 692
context, concerning the industrial and agricultural sectors, and biomass availability in that area, the 693
technical, environmental, economic and financial features of the project were described. The most 694
important financial indicators (NPV, IRR, PI) were calculated with respect to different possible future 695
scenarios. Sensitivity analysis, elasticities and threshold prices were also calculated in order to take 696
into consideration the economic advantage, the uncertainty ,the dynamic of the input data and the 697
financial risk of the project. Also some useful graphs were drawn to illustrate in an intuitive way the 698
main financial results. 699
Taking into account the present uncertainty in normative terms about public financing of this kind of 700
projects, the economic and financial analysis was conducted from the point of view of a private 701
investor. Despite the cost effectiveness and the profit of the project are very uncertain and marginal 702
considering only the private perspective, its great benefits in terms of economic, social, healthy and 703
environmental public welfares recommend efficient government interventions in terms of financial 704
measures to support them, like economic incentives and tax relief for virtuous initiatives, as well as 705
promoting further scientific and technological research. 706
707
Availability of data and materials 708
The results of this study is applicable in all kind of biomass plants; a database has not been used but 709
financial and economic indices were used. All kind of plants with the same electricity capacity and power 710
could replicate this indices. The datasets used and analyzed during the current study are available 711
from the corresponding author on reasonable request and they were collected during interview with 712
the management of pilot plant. 713
Competing interests 714
“The author declares that I have no competing interests and if it is necessary, the Editor may ask for 715
further information relating to competing interests.” Agata Matarazzo 716
Funding 717
No funding has been provided for the study collection and interpretation of the data and writing this 718
paper. 719

Authors' contributions 720
All paper is written , read, analyzed and checked by myself 721
Acknowledgements 722
"Not applicable" in this section. 723
724
References 725
AEBIOM (2012) European Biomass Association. Annual report. Brussels, 32. 726
Barona E, Ramankutty N, Hyman G, Coomes OT (2010) The role of pasture and soybean in 727
deforestation of the Brazilian Amazon. Environ Res Lett 5:240-248. 728
Battiato R., L’Europa punta sulla biomassa. La Sicilia non sfrutta il tesoro, in “Quotidiano di Sicilia” 729
del 18/08/2011. 730
Berck J., DeMarzo P., Capital Budgeting, Addison Wesley, 2015; 731
Bodie Z., Kane A., Marcus A., Investments, McGraw Hill, 2013. 732
Brealey R. A., Myers S.C., Allen F., Principles of Corporate Finance, McGraw Hill, 2015, pp. 704-733
709. 734
Wyman C. E. (2003), Biotechnol. Progress, 19, 254. 735
Cespi D., Passarini F., Ciacci L ,Vassura L., Castellani V., Collina E., Piazzalunga A., Morselli L. 736
(2014), Heating systems LCA: comparison of biomass-based appliances, Int J Life Cycle Assess 737
19:89–99. 738
Cherubini F. , Jungmeier G. (2010), LCA of a biorefinery concept producing bioethanol, bioenergy, 739
and chemicals from switchgrass Int J Life Cycle Assess , 15:53–66. 740
Ciuffi A., 2009, Rilievo indici di relazione tra produzioni agricole a biomassa residuale associata, 741
analisi del mercato della biomasse residuale nelle province delle regioni Molise, Campania, Puglia, 742
Basilicata, Calabria, Sicilia, Sardegna, Enea, 1-80. 743

Faist Emmenegger M., Stucki M., Hermle S., (2012), LCA of energetic biomass utilization: actual 744
projects and new developments—April 23, 2012, Berne, Switzerland, Int J Life Cycle Assess 745
17:1142–1147. 746
Hammerschlag R. (2006) Ethanol energy return on investment: a survey of the literature 1990-747
present. Environ Sci Technol 40(6):1744–1750. 748
Hertel T, Golub WA, Jones AD, O'Hare M, Plevin RJ, Kammen DM (2010), Effects of US maize 749
ethanol on global land use and greenhouse gas emissions: estimating market-mediated responses. 750
Bioscience 60 (3):223–231. 751
IPCC (2007) Climate change 2007: the physical science basis. Contribution of working group 1 to 752
the fourth assessment report of the Intergovernmental Panel on Climate Change. In: Solomon S, Qin 753
D, Manning M, Chen Z, Marquis M, Averyt KB, Tignor M, Miller HL (eds), Cambridge: Cambridge 754
University Press. 755
Klein D., Wolf C., Schulz C., Weber-Blaschke G. (2015), 20 years of life cycle assessment (LCA) in 756
the forestry sector: state of the art and a methodical proposal for the LCA of forest production, Int J 757
Life Cycle Assess 20:556–575. 758
Koukios, E.G., 2015, Knowledge-based greening as a new bioeconomy strategy for development: 759
agroecological utopia or revolution? In: Monteduro, M., Buongiorno, P., Di Benedetto, S., Isoni, A. 760
(Eds.), Law and Agroecology: a Transdisciplinary Dialogue. Springer-Verlag, Berlin Heidelberg, pp. 761
439-450. 762
Larson E. (2005) A review of LCA studies on liquid biofuels for the transport sector. Scientific and 763
Technical Advisory Panel of the Global Environment Facility (STAP) workshop on Liquid Biofuels, 764
29 August to 1 September 2005. New Delhi, India. 765
Lopes, M.S.G., 2015, Engineering biological systems toward a sustainable bioeconomy. J. Ind. 766
Microbiol. Biotechnol. 42, 813 - 838. 767
Madlener R, Koller M (2007) Economic and CO2 mitigation impacts of promoting biomass heating 768
systems: an input–output study for Vorarlberg, Austria. Energ Policy 35:6021–6035. 769

Matarazzo A, La Pira F (2015). Analysis of Economic Market and Energy Potential Indicators for 770
Biomass in Sicily. THE INTERNATIONAL JOURNAL OF ENGINEERING AND SCIENCE, vol. 771
4, p. 19-32, ISSN: 2319-1813. 772
Matarazzo A. (2016). Air Micro-Pollutants Analyzed Through Rough Set Approach. PROGRESS IN INDUSTRIAL 773
ECOLOGY, vol. 10, p. 382-897, ISSN: 1476-8917 774
Matarazzo A, La Pira F (2016). Energy Potential Indicators to Analize Biomass Market in Sicily. 775
MODERN ENVIRONMENTAL SCIENCE AND ENGINEERING, ISSN: 2333-2581. 776
Matarazzo A, La Pira F, Zerbo A, Lo Giudice A (2016). PRELIMINARY ECONOMIC AND 777
ENVIRONMENTAL ANALYSIS FOR THE APPLICATION OF A LIFE CYCLE COST 778
ASSESSMENT -MODEL TO A BIOMASS ENERGY GENERATOR IN SICILY. In: "Qualità di 779
innovazione per una economia circolare ed un futuro sostenibile”. p. 371-379, ISBN: 978-88-780
94164701, VITERBO, 2-4 marzo 2016. 781
Matarazzo A, Loreto P, Clasadonte M T, La Pira F (2014). Analisi tecnico-economica di un impianto 782
pilota di co-trigenerazione a biomassa in Sicilia. In: (a cura di): ANGELA TARABELLA, 783
Innovazione, Sostenibilità e Tutela dei Consumatori: L’Evoluzione delle Scienze Merceologiche per 784
la Creazione di Valore e Competitività. vol. 1, p. 425-436, ISBN: 978-1-291-74318-0, Pisa, 13-15 785
Febbraio 2014. 786
Matarazzo A., Baglio L. (2018), The modern pillars of Circular Economy. ARCHIVES OF 787
BUSINESS RESEARCH, vol. 6, p. 228-240, ISSN: 2054-7404 788
MATARAZZO A., CLASADONTE, M T., Ingrao C. (2018), The (dominance based) rough set approach applied to 789
air pollution in a high risk rate industrial area. ENVIRONMENTAL ENGINEERING AND MANAGEMENT 790
JOURNAL, vol. 17, p. 591-599, ISSN: 1582-9596 791
Ministry of the Environment and Safeguarding of the territory and the sea , Area of Industrial 792
development of Gela, POI Renewable and Energy Saving Energy , 2007-2013- part II- Linea 2.5.1, 793
Feasibility Study, 2012. 794
Munda, Giuseppe; Matarazzo, Agata, (2019), On the Impossibility of Using “the Correct” Cost-795
Benefit Aggregation Rule, in “ Journal of Economic Studies”, vol:47, (5), ISSN: 0144-3585 . 796
Polytechnic of Milan, Renewable Energy Report, May 2016,87-90. 797
ENEA, RAEE, 2011, Rapporto annuale sull’ efficienza energetica, ROME, iTALY. 798
Renewable and Sustainable Energy Reviews 16, 4406-4414. 799
Schmid, O., Padel, S., Levidow, L., 2012, The bio-economy concept and knowledge base in a public 800
goods and farmer perspective. Bio-based Appl. Econ. 1, 47-63. 801
Searchinger T, Heimlich R, Houghton RA, Dong F, Elobeid A, Fabiosa J, Tokgoz S, Hayes D, Yu 802
TH (2008) Use of U.S. croplands for biofuels increases greenhouse gases through emissions from 803
land use change. Science 319(5867):1238–1240. 804
Solomon B. D., Barnes J. R. , Halvorsen K. E., (2007),Biomass and Bioenergy, 31, 416 . 805
Solomon B. D., Barnes J. R. and Halvorsen K. E. (2007), Biomass and Bioenergy, 31, 416. 806
Stehfest E, Bouwman L (2006), N2O and NO emission from agricultural fields and soils under natural 807
vegetation: summarizing available measurement data modelling of global annual emissions. Nutr 808
Cycl Agroecosys 74:207–228. 809
Sung-Ho Bae (2011), A study on the economic analysis and optical project model of woodchip 810
cogeneration systems, Korean J. Chem. Eng., 28(4), 1023-1028. 811
Tuomas Helin & Anne Holma & Sampo Soimakallio , Is land use impact assessment in LCA 812
applicable for forest biomass value chains? Findings from comparison of use of Scandinavian wood, 813
agro-biomass and peat for energy, Int J Life Cycle Assess (2014) 19:770–785. 814
Verma VK, Bram S, De Ruyck J (2009) Small scale biomass heating systems: standards, quality 815
labelling and market driving factors— an EU outlook. Biomass Bioenerg 33:1393–1402. 816
Von Borgstede C, Andersson M, Johnsson F (2013) Public attitudes to climate change and carbon 817
mitigation—implications for energy associated behaviours. Energ Policy 57:182–193. 818
Zah R, Boni H, Gauch M, Hischier R, Lehmann M,Wager P (2007), Life cycle assessment of energy 819
products: environmental assessment of biofuels. Final Report, EMPA—technology and society Lab, 820

Auftrag des Bundesamtes für Energie, des Bundesamtes für Umwelt und des Bundesamtes für 821
Landwirtschaft, Bern, Switzerland, 2. 822
823
824

Figures
Figure 1
Available cereal straw in Sicilian Provinces
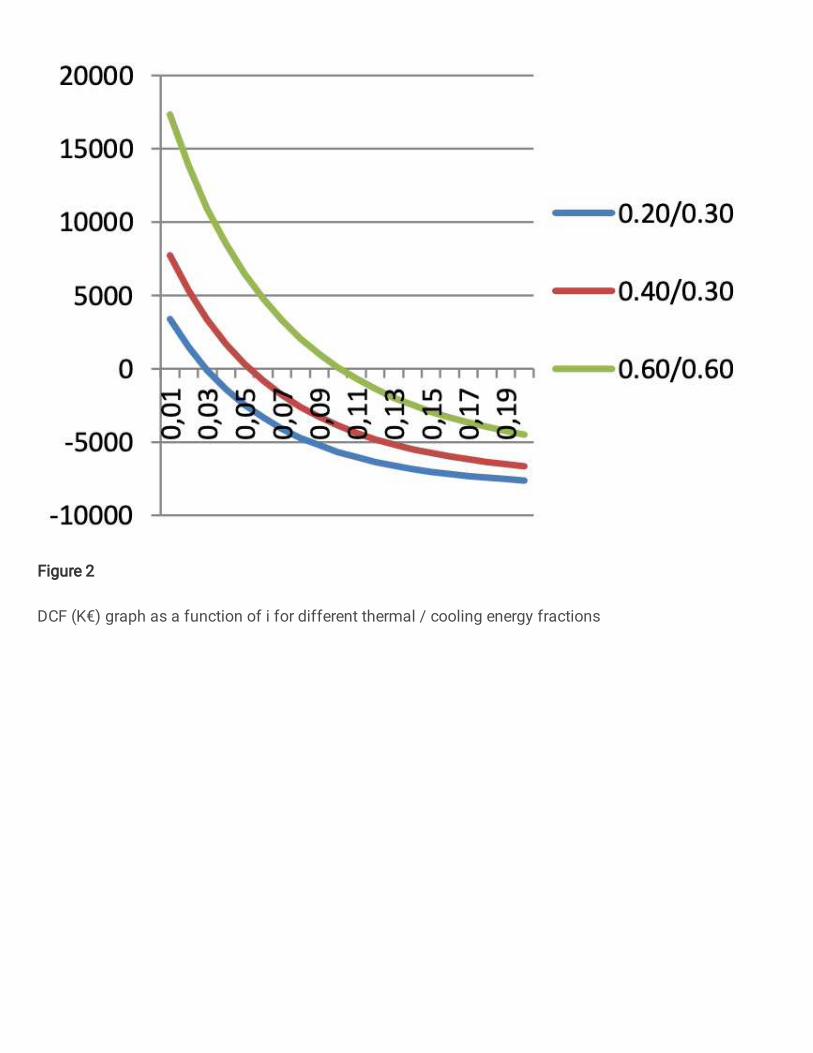
Figure 2
DCF (K€) graph as a function of i for different thermal / cooling energy fractions

Figure 3
Cumulative NPV (K€) as a function of the time (years) for different thermal/cooling energy fractions.

Figure 4
Three-dimensional graph of NPV (K€) as a function of the rate i and the time t

Figure 5
Horizontal sections of the NPV (K€) and indifference curves according to the pairs i, t (discount rate, time)