an economic outlook orlando, fl april 13 th, 2012 central florida chapter fgfoa
TRANSCRIPT

An Economic Outlook
Orlando, FL
April 13th, 2012
Central Florida Chapter FGFOA

U.S. Forecast Gone Wilde
Oscar Wilde 1854-1900

U.S. Forecast Are We Experiencing a Dorian
Gray Recovery?
Are the Sins, Transgressions and Policy Missteps Before, During, and in the Wake of the Great Recession Appearing on the Visage of the U.S. Economy?

U.S. Forecast
“Sooner or later we have all to pay for what we do.”
Oscar Wilde An Ideal Husband

U.S. Forecast
Lost Wealth
Languishing Labor Market
A downward force on consumer spending

U.S. Household Wealth(Trillions of $)
2005 2006 2007 20082009 Q1*
2011 Q4
Total Assets 71.3 78.6 79.5 66.6 62.8 72.2
Financial Assets
42.9 49.0 51.4 42.2 39.6 49.1
Home Equity 13.2 12.8 10.3 7.0 6.1 6.1
Net Worth 59.1 65.1 65.1 52.4 48.7 58.4

U.S. Economic Outlook
2011Q1
2011Q2
2011Q3
2011Q4
2012Q1
2012Q2
GDP% Change, Annual Rate 0.4 1.3 1.8 3.0 2.0 1.9
Consumer Price Index% Change, Annual Rate 5.2 4.1 3.1 1.1 2.6 1.8
Consumer Sentiment 73.1 71.9 59.6 65.3 71.6 72.2
Consumption% Change, Annual Rate 2.1 0.7 1.7 2.1 2.0 1.9

141312111009080706050403020100999897
11.0
10.0
9.0
8.0
7.0
6.0
5.0
4.0
Automobile and Light Truck Sales(Millions Vehicles)
Auto SalesLight Truck Sales
U.S. Forecast

151413121110090807060504030201009998
145.0
140.0
135.0
130.0
125.0
120.0
Total Nonfarm Payroll Employment(Millions)
Total Nonfarm Employment
U.S. Forecast
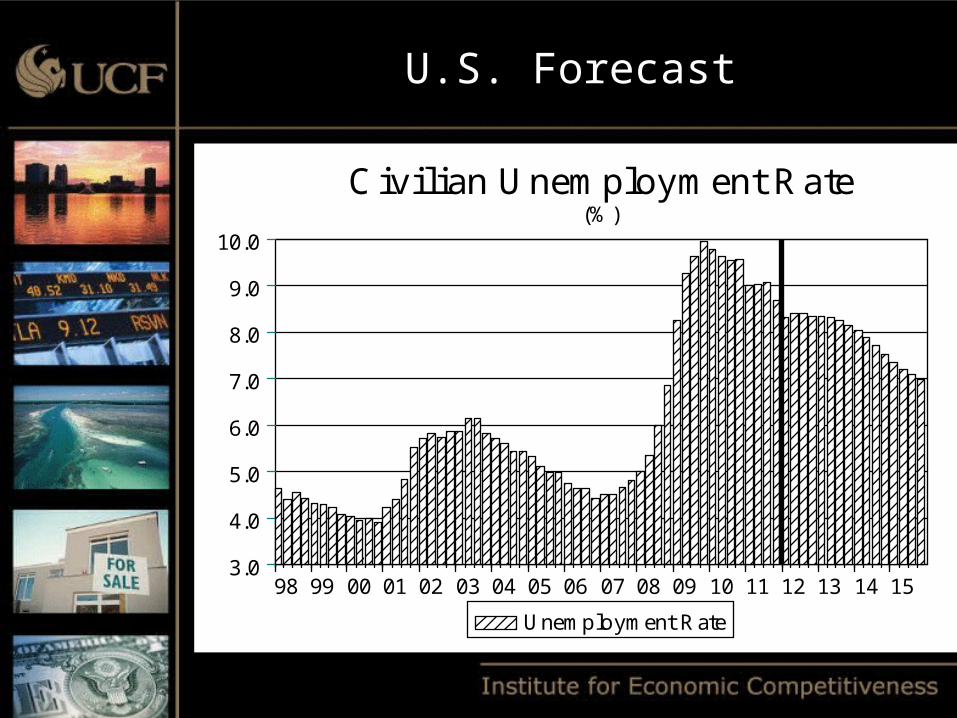
151413121110090807060504030201009998
10.0
9.0
8.0
7.0
6.0
5.0
4.0
3.0
Civilian Unemployment Rate(%)
Unemployment Rate
U.S. Forecast

Two Slippery Subjects (Again)
Greece and Oil
Greek Haircut
Contagion concerns (PIIGS) remain – Spain and Italy
Euro still facing greatest threat since inception

U.S. Forecast
The Euro and the Tacoma Narrows Bridge
U.S. Forecast The Arithmetic of Higher Oil
Prices:
Each $1 increase in the price of a barrel of oil will:
Increase price of gallon of gas 2.5 cents Push consumer gasoline bills up $3 billion Raise the CPI 0.03% Lower real disposable income 0.25%
U.S. Forecast The Economics of Higher Oil
Prices:
Each permanent $10 increase in the price of a barrel of oil will:
Lower forecast real GDP growth 0.2% in 1st year,
0.5% in the 2nd
Lower forecast of payroll employment 110,000 in 1st year and 390,000 in 2nd
Psychic Impact of $3 or $4 of $5 per gallon gasoline

151413121110090807060504030201009998
140.0
120.0
100.0
80.0
60.0
40.0
20.0
0.0
120
110
100
90
80
70
60
50
Oil and Consumer ConfidenceOil ($ Per Barrel) - Left Axis
Price of Oil WTI Consumer Sentiment
U.S. Forecast

U.S. Forecast
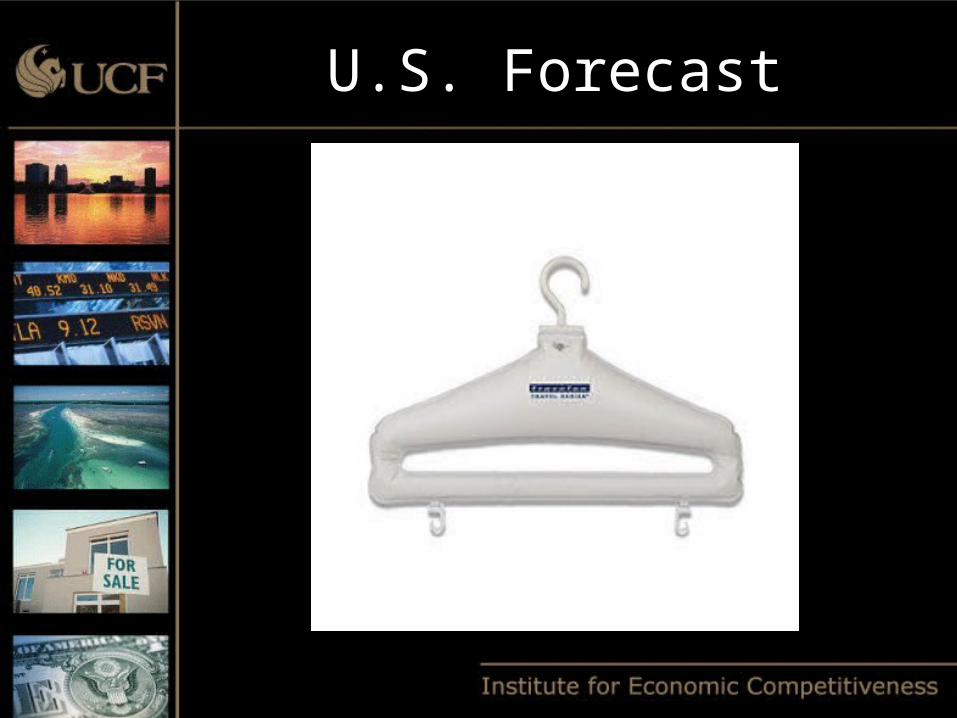
Did the debt downgrade put an end to Sky Mall™ Policies?
Sky Mall™ Policy:
An Expensive Policy that Fails to Achieve its Desired Outcome

U.S. Forecast
U.S. Forecast

U.S. Forecast

U.S. Forecast

U.S. Forecast

U.S. Forecast

U.S. Forecast

U.S. Forecast

U.S. ForecastSky Mall™ Policies:
ARRA of 2009Shovel ready projects?
Health Care ReformCommunity Living Assistance Services and Supports ended.Constitutionality of mandate
HIRE Act 2010American Jobs Act?

U.S. Forecast
14131211100908070605040302010099989796
40.0
30.0
20.0
10.0
0.0
-10.0
Money Supply(Annual Growth Rate %)
Annual Growth Rate of M2Annual Growth Rate of M1

U.S. Forecast
141312111009080706050403020100999897
6.0
4.0
2.0
0.0
-2.0
Consumer Prices(% Change Year Ago)
Consumer Price IndexCore Consumer Price Index

Chang and Eng Bunker

Economic Siamese Twins:
The Labor Market
The Housing Market
U.S. Forecast

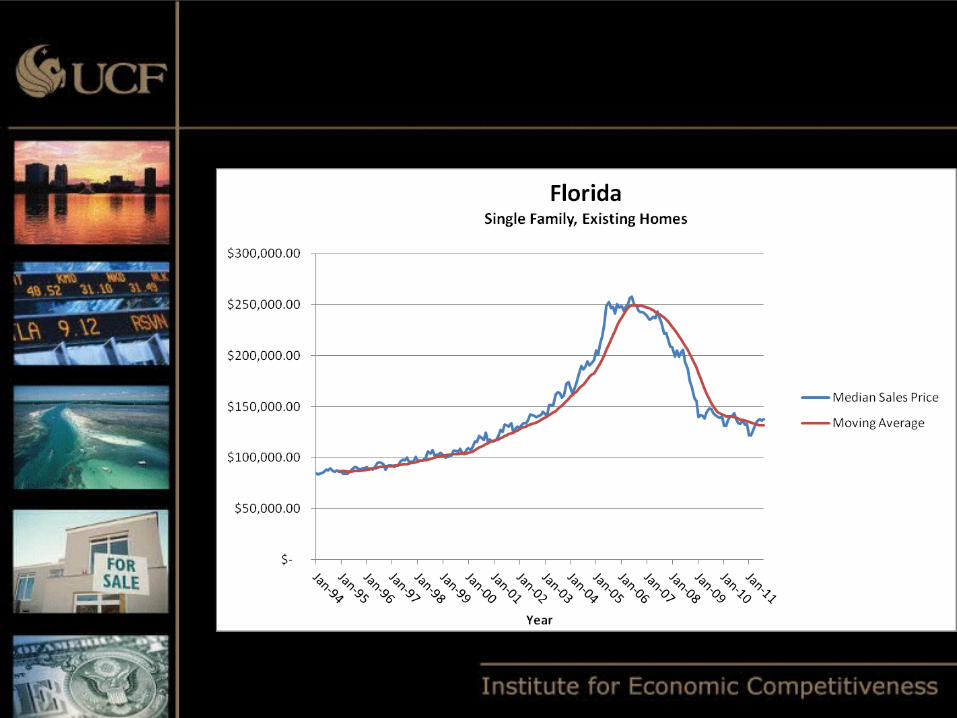
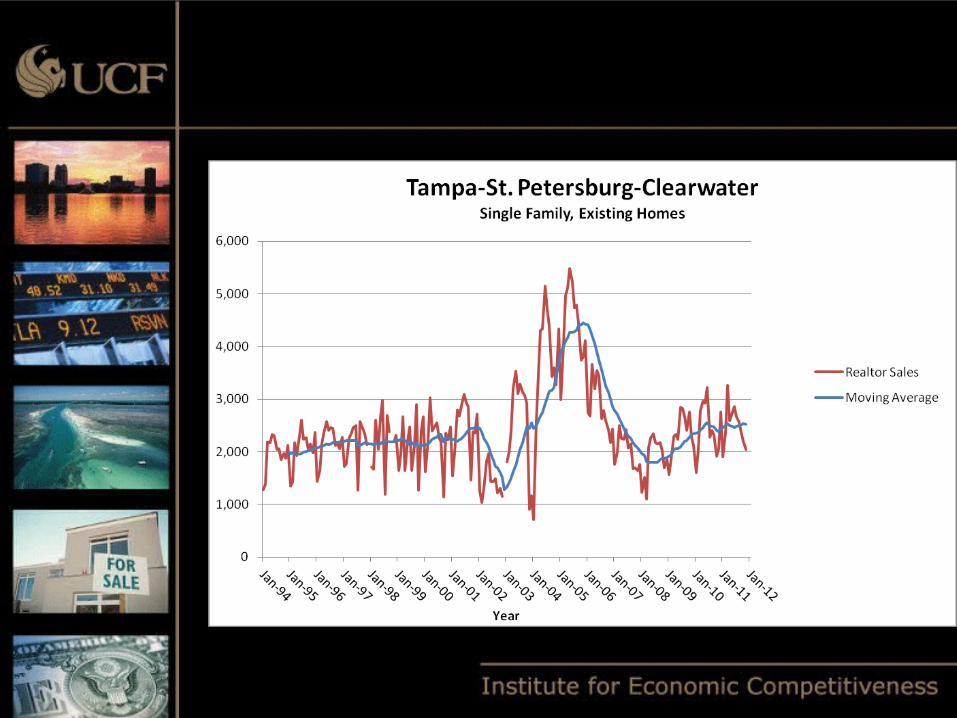
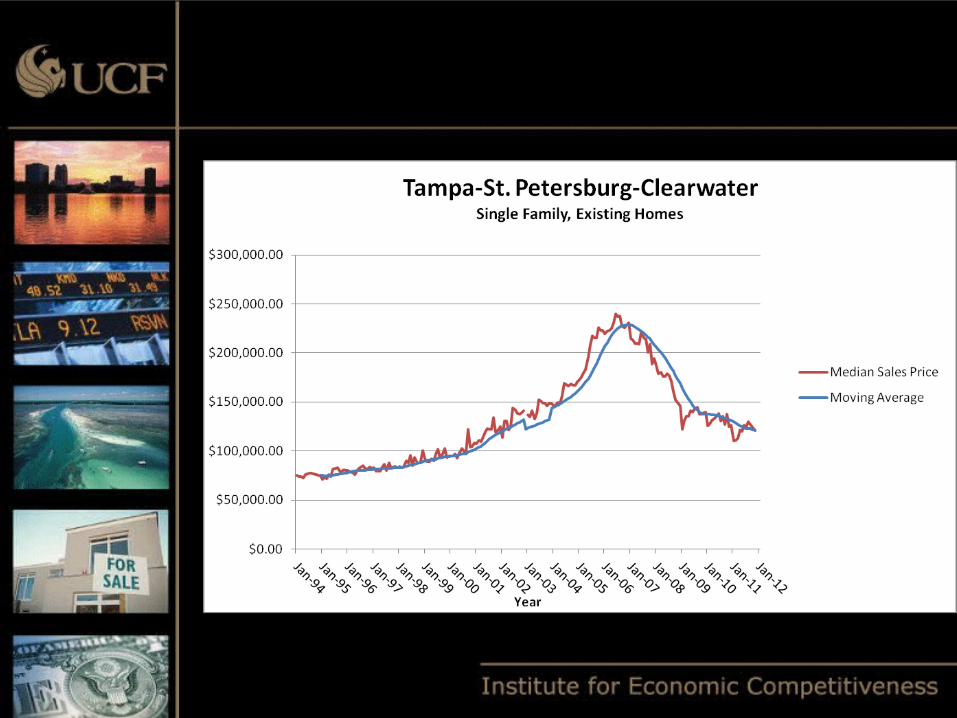
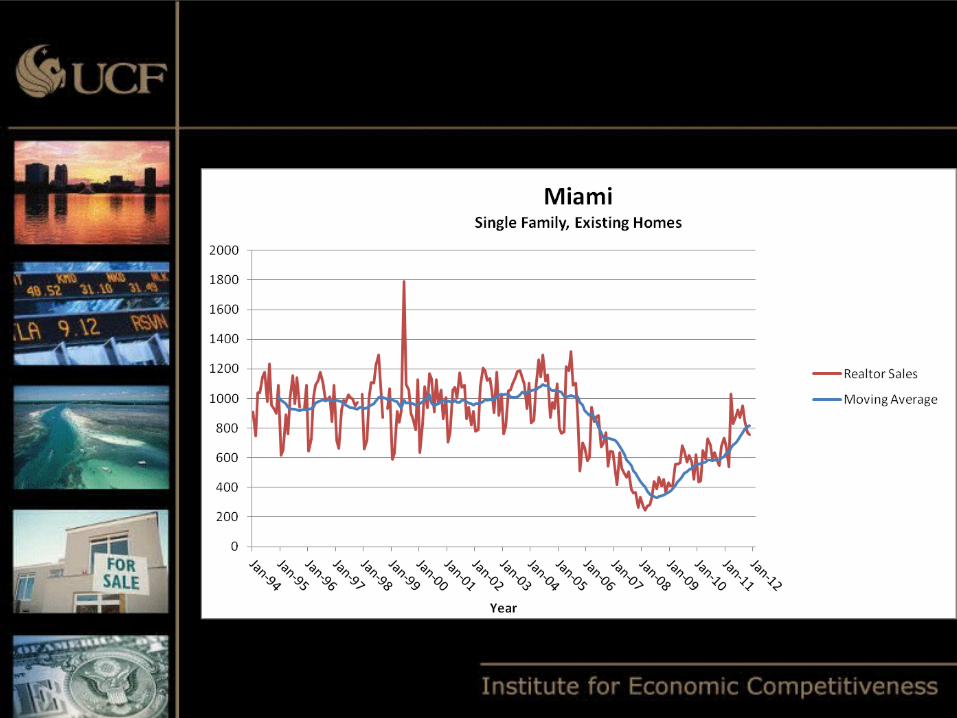
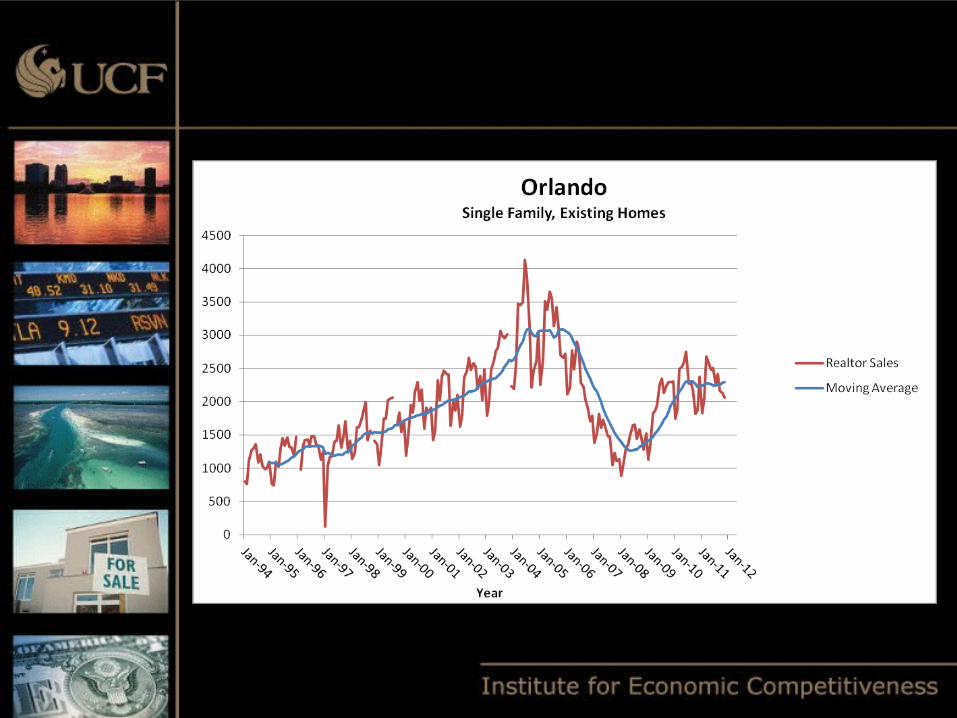
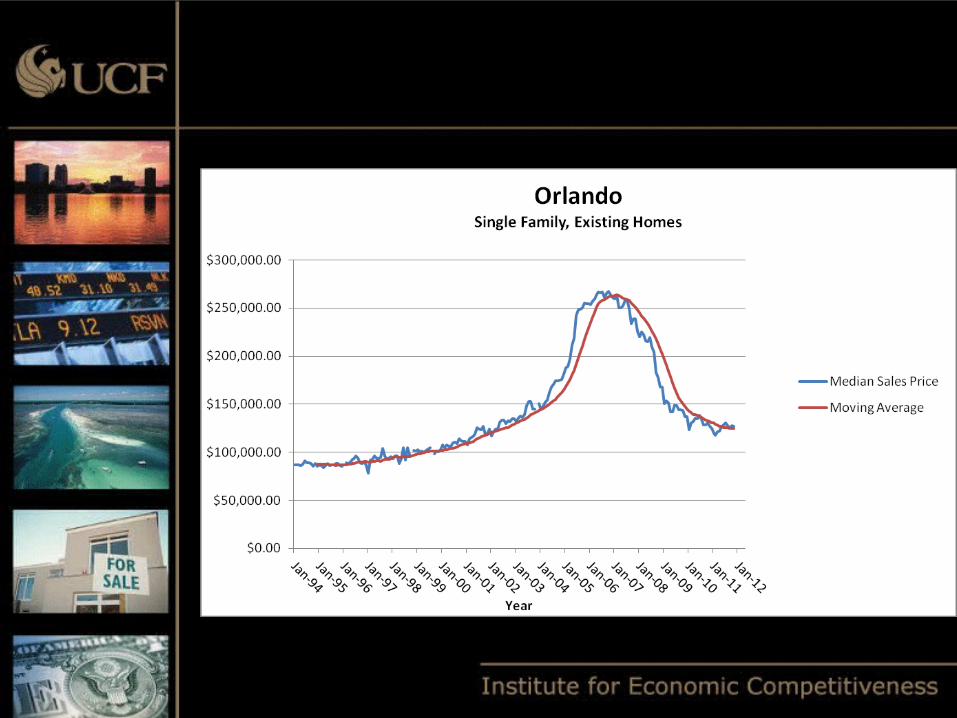
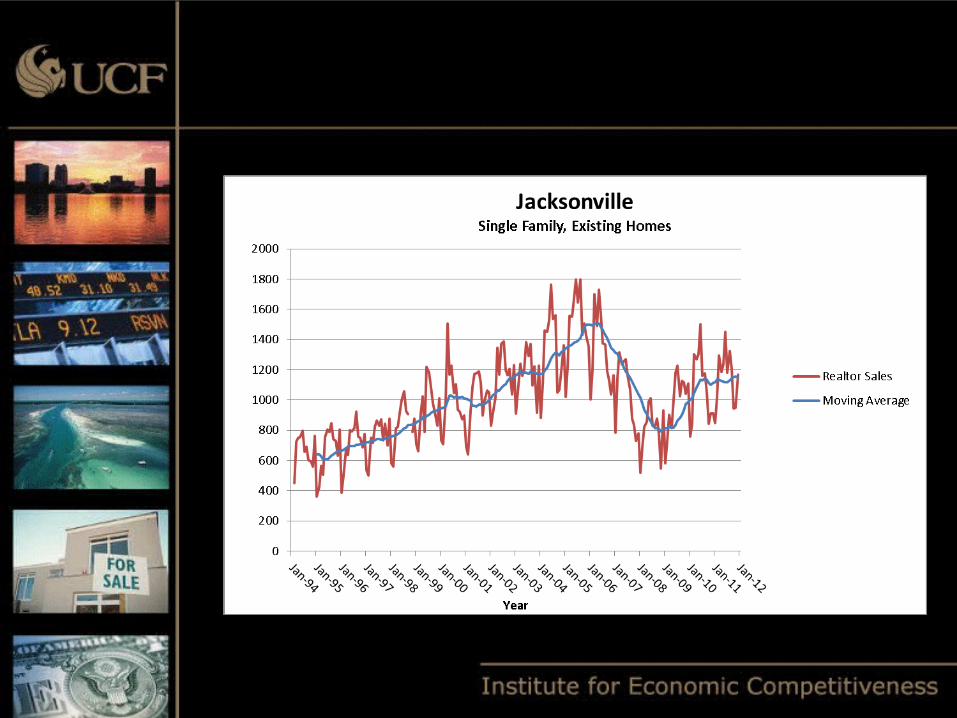
Florida’s Housing Market
Foreclosure Moratorium Delayed Recovery
Housing market still struggling to find the bottom
Tale of Two Markets
Distressed vs. Traditional


Florida Forecast In 2010 the recovery began
• 2012 is our new runway Heavy crosswinds in 2011 necessitated the
runway change Europe Debt Ceiling/ Debt Downgrade
Job growth doesn’t takeoff until 2013 and 2014
Turbulence Demographics hinder recovery Housing market Budget challenges: State & local government

Florida Forecast

15141312111009080706050403020100
8%
6%
4%
2%
0%
-2%
-4%
-6%
-8%
Florida Real Gross State Product(% change year ago)
Florida Economic Outlook IEC 1st Quarter 2012 Forecast

15141312111009080706050403020100
14.0%
12.0%
10.0%
8.0%
6.0%
4.0%
2.0%
Florida & U.S. Unemployment Rate(%)
FL Unemployment RateU.S. Unemployment Rate
Florida Economic Outlook IEC 1st Quarter 2012 Forecast

Florida Economic Outlook IEC 1st Quarter 2012 Forecast
15141312111009080706050403020100
8200.0
8000.0
7800.0
7600.0
7400.0
7200.0
7000.0
6800.0
Florida Employment(Thousands)
Wage & Salary Employment

Florida Economic Outlook IEC 1st Quarter 2012 Forecast
15141312111009080706050403020100
300.0
250.0
200.0
150.0
100.0
50.0
0.0
9%
8%
7%
6%
5%
4%
3%
Florida Housing Starts(thousands)
Total Private Housing Starts30 year Mortgage Rates
Florida Economic Outlook IEC 1st Quarter 2012 Forecast
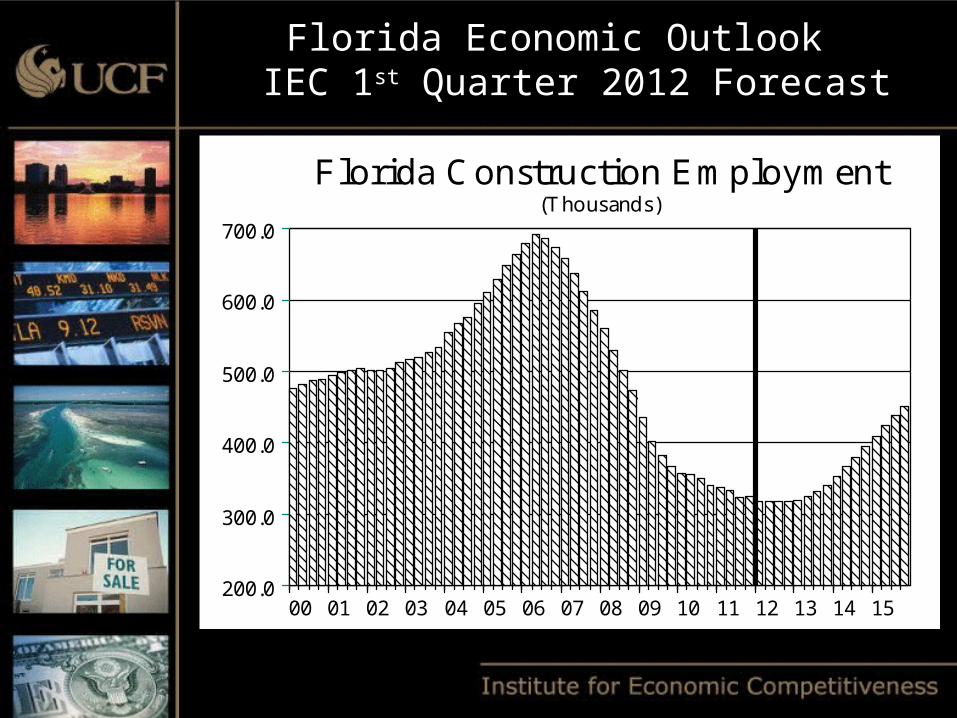
15141312111009080706050403020100
700.0
600.0
500.0
400.0
300.0
200.0
Florida Construction Employment(Thousands)

Florida Economic Outlook IEC 1st Quarter 2012 Forecast
15141312111009080706050403020100
1300.0
1200.0
1100.0
1000.0
900.0
800.0
Florida Professional & Business Services Employment
(Thousands)
Florida Economic Outlook IEC 1st Quarter 2012 Forecast
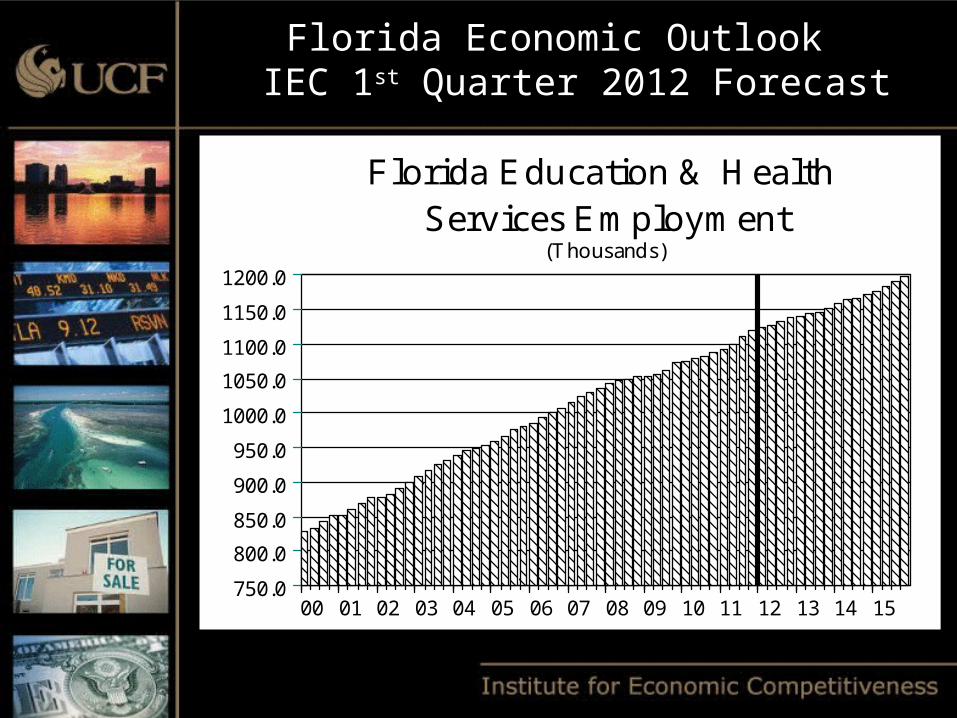
15141312111009080706050403020100
1200.0
1150.0
1100.0
1050.0
1000.0
950.0
900.0
850.0
800.0
750.0
Florida Education & Health Services Employment
(Thousands)

Florida Economic Outlook IEC 1st Quarter 2012 Forecast
15141312111009080706050403020100
1050.0
1000.0
950.0
900.0
850.0
Florida State & Local Government Employment
(Thousands)

RegionPopulation Growth
Average % Chg Rank
Florida 1.4 ---Deltona 0.9 8
Gainesville 0.8 9Jacksonville 1.5 3
Lakeland 1.4 4Miami 1.3 5Naples 2.0 1Ocala 1.9 2
Orlando 2.0 1Palm Bay 1.3 5Pensacola 1.1 7
Tallahassee 1.3 5Tampa 1.2 6
2012-2015 Averages;Q1 2012 Forecast
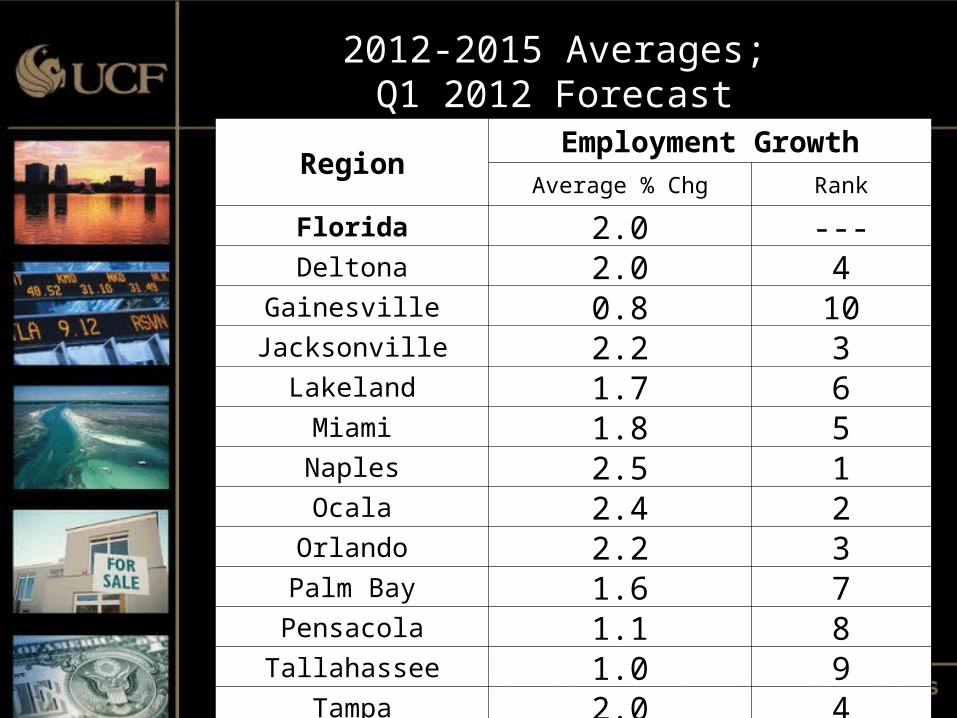
RegionEmployment Growth
Average % Chg Rank
Florida 2.0 ---Deltona 2.0 4
Gainesville 0.8 10Jacksonville 2.2 3
Lakeland 1.7 6Miami 1.8 5Naples 2.5 1Ocala 2.4 2
Orlando 2.2 3Palm Bay 1.6 7Pensacola 1.1 8
Tallahassee 1.0 9Tampa 2.0 4
2012-2015 Averages;Q1 2012 Forecast

Sean M. SnaithSean M. Snaith, Ph.D.
Director Director
Institute for Economic CompetitivenessInstitute for Economic Competitiveness
(407) 823-1453(407) 823-1453
[email protected]@SeanSnaith.com
WWW.IEC.UCF.EDUWWW.IEC.UCF.EDU
www.facebook.com/seansnaith www.facebook.com/seansnaith
Twitter: @seansnaithTwitter: @seansnaith
Thank you