an environmental analysis of recreational cannabis
TRANSCRIPT

i
An Environmental Analysis of Recreational
Cannabis Cultivation & Processing
A Major Qualifying Project Report
Submitted to the faculty of WORCESTER POLYTECHNIC INSTITUTE in partial fulfillment
of the requirements for the Degree of Bachelor of Science
Submitted by:
Stephanie Salerno
Jacquelyn Valsamis
Submitted to:
John Bergendahl, Ph.D., P.E., Associate Professor
Stephen Kmiotek, Ph.D., P.E., Professor of Practice
May 13, 2020
This report represents work of WPI undergraduate students submitted to the faculty as evidence of a degree
requirement. WPI routinely publishes these reports on its web site without editorial or peer review. For more
information about the projects program at WPI, see http://www.wpi.edu/Academics/Projects.

i
Abstract
The recreational cannabis industry has experienced rapid growth, yet the environmental impacts
of the industry are still largely unknown. This may be attributed to the lack of available data and
comprehensive studies. More fundamental and applied research is required in many areas of
cannabis production. Our research provides an overview of current recreational cannabis
regulations and an in-depth environmental analysis of five major concerns: water, pesticides, air,
energy, and waste. For each category, common industry practices were evaluated to assess their
environmental impacts. Based on our research, a series of recommendations were made to improve
the sustainability of the cannabis industry.

ii
Acknowledgements
We would like to thank our advisors, John Bergendahl and Stephen Kmiotek, for all of their help
and guidance throughout this project.

iii
Executive Summary
The recreational cannabis industry has experienced rapid growth, yet the environmental
impacts of the industry are still largely unknown. This may be attributed to the lack of available
data and comprehensive studies. More fundamental and applied research is required in many areas
of cannabis cultivation and processing. Our research provides an overview of current recreational
cannabis industry practices and current regulations, along with an in-depth environmental analysis
of five major concerns: water, pesticides, air, energy, and waste. For each category, an evaluation
of common industry practices was performed to assess their environmental impacts. Based on our
research, a series of recommendations were made to improve the sustainability of the cannabis
industry.
It is known in the industry that cannabis is a water-intensive crop. However, there is no
current research documenting the details of water use of current industry practices. To address this
gap, we calculated new values of water consumption based on more current growing practices and
facility sizes. We determined that plants grown indoors and outdoors require 0.096-0.251 and
0.453-1.12 gallons per plant per day, respectively. Furthermore, the quantity and characteristics of
wastewater produced by cannabis facilities has not been addressed in the literature. Constituents
of concern for wastewater treatment plants include pesticides, nutrients, and certain biological
agents, which may affect treatment processes. While the current loading rates are not a concern,
wastewater treatment plants may experience greater than average loading rates if multiple facilities
begin discharging to them at once.
The Federal Insecticide, Fungicide, and Rodenticide Act (FIFRA) requires that all
pesticides sold or distributed in the United States be registered by the EPA. Since cannabis cannot
be legally grown or possessed under federal law, the EPA has not evaluated the safety of pesticides
for the cannabis industry, or set tolerances for pesticide residues on cannabis products. If pesticides
are not federally designated for use on cannabis, it is technically illegal to use them on cannabis.
However, states can allow the use of pesticides exempt from FIFRA on cannabis. Of the states that
have legalized recreational cannabis, none have established the same pesticide restrictions.
Without federal oversight, the environment and consumer are left at risk. The environmental
impacts of pesticides are somewhat documented, but it is unknown how pesticides transform when
smoked or processed during extractions.
Through the use of temperature, pressure, and solvents (i.e. butane, ethanol, etc.),
extraction techniques are used to produce cannabis concentrates with high concentrations of
tetrahydrocannabinol (THC) and cannabidiol (CBD). Depending on the technique, extractions may
be energy intensive. To estimate energy consumption, the energy required for the phase changes
in each process was calculated. Butane, ethanol, supercritical CO2, cold water, and food-based
extractions require 4.34, 0.53, 14.91, 0.57, and 0.49 kWh/lb extract, respectively. In addition,
solvent residuals in final products may pose a health concern. More research is needed in this area
to determine the risk to consumers.
Air emissions from the cannabis industry have been the subject of many complaints and
concerns. The emissions include odor, volatile organic compounds (VOC), and carbon dioxide.
The characteristic odor and VOC emissions from cannabis is attributed to the release of terpenes
by the plants. High levels of VOC in the atmosphere can increase ozone levels, which can have
harmful health effects when present in high concentrations. VOC emissions are regulated on the
state and local level to keep ozone levels below the federal requirement. However, these

iv
regulations often omit agricultural contributors such as cannabis cultivation facilities. Air pollution
control technologies are available to mitigate odors and VOC emissions, with activated carbon
adsorbers being the most commonly recommended for the cannabis industry. In this work, a fixed-
bed carbon adsorber for a typical indoor cannabis production facility was designed; it was
determined that the scale required for effective odor and VOC treatment, as well as the cost, was
not feasible for this typical cannabis facility. Improved air pollution control approaches need to be
developed for this industry.
Cannabis cultivation uses a significant amount of energy primarily due to lighting needs,
dehumidification demands, and HVAC systems. As the industry continues to grow, so will the
energy demand and the associated CO2 emissions. A widely-cited study estimated that 4,600 kg of
CO2 are emitted for every kg of final product produced (Mills, 2012). This value and the future
industry sales were used to determine that approximately 7.4 billion kg of CO2 will be emitted from
recreational cannabis production in 2025. Research on energy efficient alternatives is required to
reduce the energy demand for the cannabis industry.
Cannabis cultivators can generate large amounts of organic waste, which can be on the
order of several tons per week. Most state regulations require cannabis plant waste to be disposed
of in a 50/50 mix with other organic material or trash. This requirement can either double the
amount of organic material ending up in a landfill or eliminates the option to compost organic
material if it is mixed with trash. Furthermore, the federal status of cannabis hinders sustainable
waste management, because many composting facilities are hesitant to accept a federally illegal
waste. Cannabis cultivation and processing facilities are then forced to dispose of their waste with
municipal waste (where it may be landfilled or incinerated depending on the practices of the local
municipality) if they do not have space for onsite composting. Therefore, a significant amount of
waste from the cannabis industry may be disposed of in non-sustainable practices.
The cannabis industry is projected to grow at a compound annual growth rate of 16%, and
sales are expected to reach more than $29 billion by 2025. As the industry continues to grow, so
will the environmental impacts. To mitigate these impacts, sustainable practices should be
implemented in the industry. However, the full scope of the environmental impacts are unknown,
and many known issues do not have practicable solutions. More fundamental and applied research
is needed to address these gaps. Additionally, as more states legalize recreational cannabis, the
gaps in knowledge will become greater due to the confusing state-by-state regulations.

v
Statement on Design
As the culmination of undergraduate studies in Environmental Engineering, Worcester
Polytechnic Institute requires a Major Qualifying Project with a capstone design element to fulfill
the Accreditation Board for Engineering and Technology (ABET) engineering requirements. Per
the ABET General Criterion 5, students must be prepared for engineering practice through “a
culminating major engineering design experience that incorporates appropriate engineering
standards and multiple constraints, and is based on the knowledge and skills acquired in earlier
course work.” The major design portion of this project involved the design of a fixed-bed activated
carbon adsorber, with the purpose of removing volatile organic compounds (VOCs) and odors, for
the air emissions of a typical cannabis facility. The design for this project included the following
constraints:
1. Public Health, Safety, and Welfare: The filter was designed to minimize the harmful
health impacts of ozone and nuisance odors on surrounding communities.
2. Social and Political: In many regions, cannabis cultivation facilities are exempt from air
emissions regulations, therefore there is limited pressure to install air pollution control
technology. The purpose of this design was to determine if a fixed-bed carbon adsorber
was practicable enough to encourage voluntary air emission control.
3. Environmental: As part of the design, regeneration of carbon was suggested, as opposed
to one-time use, in order to reduce the amount of waste produced by the filter.
4. Economic: To determine if a fixed-bed carbon adsorber was an affordable air pollution
control option for the cannabis facility, the total equipment cost was considered.

vi
Statement on Professional Licensure
A century ago, anyone could work as an engineer. To ensure an engineer is competent and
protect public health and safety, engineering licensure laws were enacted throughout the United
States. Every state regulates the practice of engineering to ensure public welfare by granting
Professional Engineers (PE) the authority to sign and seal engineering plans (NSPE, 2020).1
Engineers are licensed at the state level by professional licensing boards. To ensure an
engineer is competent, he or she must meet a combination of requirements in education, exams,
and experience. There are four main steps to become a licensed engineer. First, an engineer must
complete a four-year college degree. Generally, engineering licensing boards require candidates
to have an EAC/ABET-accredited bachelor’s degree. Next, an engineer must pass the
Fundamentals of Engineering (FE) exam. Then, four years of acceptable, progressive, and
verifiable work experience in the industry under a licensed PE is required. Finally, an engineer
must pass the Principles and Practice of Engineering (PE) exam (NSPE, 2020; NCEES, n.d.).2
To retain their licenses, PEs must continuously demonstrate their competency and maintain
and improve their skills by fulfilling continuing education requirements depending on the state in
which they are licensed. As a PE, an engineer may prepare, sign and seal, and submit engineering
plans and drawings to a public authority for approval, or seal engineering work for public and
private clients (NSPE, 2020). There are many benefits to becoming a licensed engineer. The title
“PE” recognizes an engineer's experience, knowledge, and accountability. A PE provides ability
for growth, as engineering positions at all levels of industry and government increasingly require
licensure. As a PE, an engineer can establish a private practice. When an engineer earns a PE in
one state, it is easier for them to apply for licensure in other states through a process known as
comity licensure. Lastly, salary studies show that PE’s earn significantly more throughout their
career (NCEES, n.d.).
1 National Society of Professional Engineers (NSPE). (2020). What is a PE? Retrieved from
https://www.nspe.org/resources/licensure/what-peStatement on Design 2 National Council of Examiners for Engineering and Surveying (NCEES). (n.d.). Engineering licensure. Retrieved
from https://ncees.org/engineering/engineering-licensure/

vii
Table of Contents Abstract ............................................................................................................................................ i
Acknowledgements ......................................................................................................................... ii
Executive Summary ....................................................................................................................... iii
Statement on Design ....................................................................................................................... v
Statement on Professional Licensure ............................................................................................. vi
Chapter 1: Introduction ..................................................................................................... 1
Chapter 2: Regulations ....................................................................................................... 2
Colorado .......................................................................................................................................... 2
California ........................................................................................................................................ 2
Massachusetts ................................................................................................................................. 3
Illinois ............................................................................................................................................. 4
Conclusions ..................................................................................................................................... 4
References ....................................................................................................................................... 5
Chapter 3: Water Use and Wastewater ..................................................................... 6
Introduction ..................................................................................................................................... 6
Cultivation....................................................................................................................................... 6
Seedling or Clone Stage .............................................................................................................. 7
Vegetative Growth Stage ............................................................................................................ 7
Flowering Stage........................................................................................................................... 7
Harvest ....................................................................................................................................... 8
Cultivation Methods .................................................................................................................... 8
Aeroponics ............................................................................................................................... 9
Drip Watering ........................................................................................................................ 10
Ebb and Flow (Flood Tables) ................................................................................................ 10
Nutrient Film Technique ....................................................................................................... 10
Water Culture Systems .......................................................................................................... 11
Wick System .......................................................................................................................... 11
Hand Watering ....................................................................................................................... 11
Water Use Analysis ................................................................................................................... 11
Water Use Discussion ............................................................................................................ 15

viii
Wastewater Sources ...................................................................................................................... 16
Point Source Pollution ............................................................................................................... 16
Disposal of Excess Irrigation Water ...................................................................................... 16
Air Pollution Control Equipment .......................................................................................... 17
Reverse Osmosis.................................................................................................................... 17
Reverse Osmosis Analysis ................................................................................................. 17
Nonpoint Source Pollution ........................................................................................................ 18
Cultivation Wastewater Constituents ............................................................................................ 19
Biological Oxygen Demand ...................................................................................................... 19
Total Suspended Solids ............................................................................................................. 19
Chemical Oxygen Demand ....................................................................................................... 19
Pesticides ................................................................................................................................... 20
Biological Agents ...................................................................................................................... 20
Nutrients .................................................................................................................................... 20
Nutrient Analysis ................................................................................................................... 22
Processing ..................................................................................................................................... 27
Wastewater Concerns in Extractions ......................................................................................... 27
Wastewater Concerns in Edibles Production ............................................................................ 28
Recommendations ......................................................................................................................... 28
THC in Water ............................................................................................................................ 28
Reduce Wastewater ................................................................................................................... 29
References ..................................................................................................................................... 31
Chapter 4: Pesticides ......................................................................................................... 37
Introduction ................................................................................................................................... 37
Current Pesticide Use .................................................................................................................... 37
Restricted Pesticides .................................................................................................................. 38
Unrestricted Pesticides .............................................................................................................. 38
Environmental Fate and Transportation........................................................................................ 39
Soil Half-Life ............................................................................................................................ 40
Water Solubility ........................................................................................................................ 41
Vapor Pressure .......................................................................................................................... 42
Partition Coefficients................................................................................................................. 43
ix
Octanol-water Partition Coefficient (KOW) ............................................................................ 43
Sorption Coefficients (KSW and KOC) .................................................................................... 43
Best Management Practices ...................................................................................................... 44
Health Concerns ............................................................................................................................ 45
Smoking .................................................................................................................................... 45
Extractions ................................................................................................................................. 46
Worker Safety ........................................................................................................................... 46
Recommendations ......................................................................................................................... 46
Tobacco’s Pesticide Regulations ............................................................................................... 46
Canada’s Pesticide Regulations ................................................................................................ 47
Integrated Pest Management ..................................................................................................... 47
Future Research ......................................................................................................................... 48
References ..................................................................................................................................... 49
Appendix A: Cross-Referenced List of Pesticides Allowed in CA and CO ................................. 53
Appendix B: California’s Restricted Category II Pesticide List ................................................... 57
Chapter 5: Extraction Methods ................................................................................... 65
Introduction ................................................................................................................................... 65
Closed-Loop Systems ................................................................................................................... 67
Hydrocarbon Extractions........................................................................................................... 67
Alcohols Extraction ................................................................................................................... 68
Supercritical CO2 Extraction ..................................................................................................... 69
Cold Water Extraction .................................................................................................................. 69
Food-based Extraction .................................................................................................................. 69
Extraction Method Analysis ......................................................................................................... 70
Recommendations ......................................................................................................................... 71
Supercritical CO2, ...................................................................................................................... 71
Dimethyl Ether .......................................................................................................................... 72
Water Reuse .............................................................................................................................. 72
Additional Considerations ......................................................................................................... 73
References ..................................................................................................................................... 74
Appendix A: Extraction Calculations ........................................................................................... 77
Butane Extraction ...................................................................................................................... 77

x
Ethanol Extraction ..................................................................................................................... 78
CO2 Extraction .......................................................................................................................... 80
Cold Water Extraction ............................................................................................................... 82
Food Extractions ....................................................................................................................... 83
Chapter 6: Air Emissions ................................................................................................ 85
Introduction ................................................................................................................................... 85
Odor .............................................................................................................................................. 85
Volatile Organic Compounds ....................................................................................................... 86
Case Study: Colorado ................................................................................................................ 87
Carbon Dioxide ............................................................................................................................. 89
Indoor Air Quality......................................................................................................................... 89
Air Pollution Control Technology ................................................................................................ 90
Carbon Filtration ....................................................................................................................... 90
Ozone Generators ...................................................................................................................... 91
Odor Absorbing Neutralizers .................................................................................................... 91
Masking and Counteractive Agents .......................................................................................... 91
Fog Systems .............................................................................................................................. 91
Negative Ion Generators/ Electrostatic Precipitators ................................................................ 91
Industrial Scrubbers................................................................................................................... 92
Outdoor Grow Facilities ............................................................................................................ 92
Future Research ......................................................................................................................... 92
Fixed-bed Carbon Adsorption Design .......................................................................................... 92
Terpene Volumetric Flow Rate ................................................................................................. 94
Vessel Dimensions .................................................................................................................... 95
Carbon Replacement ................................................................................................................. 97
Cost Analysis............................................................................................................................. 98
Carbon Cost ........................................................................................................................... 98
Vessel Cost ............................................................................................................................ 98
Total Equipment Cost ............................................................................................................ 98
Discussion ................................................................................................................................. 99
Future Air Pollution Control Research...................................................................................... 99
Recommendations ....................................................................................................................... 100

xi
Regulation Enforcement .......................................................................................................... 100
Planning Ahead ....................................................................................................................... 100
References ................................................................................................................................... 101
Appendix A: Total Molar Flow Rate .......................................................................................... 106
Appendix B: We Calculations ..................................................................................................... 107
Chapter 7: Energy............................................................................................................. 111
Introduction ................................................................................................................................. 111
Areas of Energy Use ................................................................................................................... 111
Dehumidification and Ventilation ........................................................................................... 112
Lighting ................................................................................................................................... 113
Carbon Dioxide Injection ........................................................................................................ 114
Drying Process ........................................................................................................................ 114
Water Handling ....................................................................................................................... 115
Natural Gas Generators ........................................................................................................... 115
Extractions ............................................................................................................................... 115
Industry Analysis ........................................................................................................................ 116
Projection of Carbon Dioxide Emissions ................................................................................ 116
Projection of Energy Costs ...................................................................................................... 117
Discussion ............................................................................................................................... 118
Recommendations ....................................................................................................................... 119
Planning Ahead ....................................................................................................................... 119
Alternative Lighting ............................................................................................................ 120
Ventilation and Dehumidification Alternatives ................................................................... 120
Combined Heat and Power Systems .................................................................................... 121
Greenhouses......................................................................................................................... 121
Regulatory Controls ................................................................................................................ 122
References ................................................................................................................................... 124
Appendix A: Carbon footprint of indoor Cannabis production, by end use ............................... 126
Appendix B: Price of Cannabis................................................................................................... 127
Appendix C: Projected CO2 Emissions....................................................................................... 128
Appendix D: Projected Energy Costs ......................................................................................... 129
Chapter 8: Solid and Hazardous Waste ................................................................. 130

xii
Introduction ................................................................................................................................. 130
Types of Waste ........................................................................................................................... 130
Plant Material .......................................................................................................................... 130
Growing Media ....................................................................................................................... 131
Fertilizers ................................................................................................................................. 131
Hazardous Waste ..................................................................................................................... 132
Methods of Disposal ................................................................................................................... 132
Compost .................................................................................................................................. 132
Landfills .................................................................................................................................. 133
In-vessel Digestion .................................................................................................................. 133
Incineration.............................................................................................................................. 134
Recommendations ....................................................................................................................... 134
Regulations .............................................................................................................................. 134
Reducing, Reusing, and Recycling ......................................................................................... 135
Solvents ............................................................................................................................... 135
Packaging............................................................................................................................. 136
Repurposing Plant Waste..................................................................................................... 136
Bioremediation ................................................................................................................. 136
Energy Production ........................................................................................................... 137
Future Research ............................................................................................................... 138
References ................................................................................................................................... 139
Chapter 9: Future Research ........................................................................................ 142
Ecosystem Degradation .............................................................................................................. 142
Land Use ..................................................................................................................................... 142
Life Cycle Assessment ................................................................................................................ 143
Industry Practices ........................................................................................................................ 143
Influence of Illegal Grows .......................................................................................................... 144
References ................................................................................................................................... 146
Chapter 10: Conclusions ................................................................................................ 147
References ................................................................................................................................... 148

1
Chapter 1: Introduction
The growing recreational cannabis market poses concerns for regulators, the public,
engineers, and scientists alike. Currently, recreational cannabis has been legalized in 11 states and
Washington D.C. Since it is not federally legal, federal agencies like the FDA and EPA are not
able to regulate the industry with standardized laws. This leads to regulations that vary widely
between states and leave gaps which have the potential to create environmental and public health
hazards.
Regulators and the public are starting to engage in a discourse about the public health
concerns of recreational cannabis, but the environmental impacts are still largely unknown or
overlooked. This is in part due to the lack of research in the industry. It has been noted that more
fundamental and applied research is required in many areas of cannabis production, specifically
the environmental impacts (Ashworth & Vizuete, 2016).
This document is intended to provide an overview of current recreational cannabis
regulations and an in-depth environmental analysis of five major concerns: water, pesticides, air,
energy, and waste. The caregories are summarized below in Figure 1.1. To clarify, the term
“recreational cannabis” in this document is used to describe any strain of Cannabis sativa L. with
a THC level of 0.3% or greater by weight (Seltenrich, 2019). It should be noted that the information
in this document could apply to other cannabis industries, such as hemp production or medical-
use cannabis, but the industry practices can vary. The goal is to compile and analyze current
research in these areas in one comprehensive document that can be used as a reference for future
policy making.
Figure 1.1. Overview of Environmental Analysis.

2
Chapter 2: Regulations
Of the 11 states and Washington D.C., that have legalized recreational cannabis in the
United States, Colorado, California, Massachusetts, and Illinois have taken the most steps to ensure
the industry is adequately regulated. Although recreational cannabis is legalized in 12 states, the
regulations for the industry in a handful of states are still being constructed. In Maine, Vermont,
and Washington D.C., there are currently no finalized regulations, resulting in a hold on the
commercial market until they can be created. In Nevada, the industry is not regulated beyond
taxation through the Department of Taxation (OHA, 2018). Oregon, Alaska, and Washington
currently have state regulations, however they are lacking as many are non-specific to issues
related cannabis production.
Colorado As one of the first states to legalize recreational cannabis in 2014, regulations of the
industry are comprehensive and innovative. Cannabis regulation in Colorado varies between
municipalities. Colorado’s state law dictates that local governments may regulate the industry
based on the community’s needs. Many counties have opted to ban recreational cannabis
production and dispensaries. However, in the counties that allow production, base regulations
include a disposal plan, proper ventilation to mitigate odor, proper waste management, and
pesticide use that is in accordance with state statutes. In the case of Boulder, CO, the local code
supports Colorado’s Sustainability and Climate Action Plan goals by requiring renewable sources
to grow recreational marijuana. Their local statutes state that, “a marijuana cultivation facility shall
directly offset one hundred percent of its electricity consumption through a verified subscription
in a Community Solar Garden, or renewable energy generated onsite, or an equivalent that is
subject to approval by the city,” (Boulder, CO Municipal Code § 6.16.8). Additionally, the county
only allows cold-water extraction rather than using chemical solvents, (Boulder, CO Municipal
Code § 6.16.8).
California California first legalized medical marijuana in 1996. Most regulation was conducted by
local governments until 2015, when the Medical Cannabis Regulation and Safety Act (MCRSA)
established a state regulatory framework. Under MCRSA, three licensing authorities were
established: the Bureau of Cannabis Control, CalCannabis Cultivation Licensing, and the
Manufactured Cannabis Safety Branch. In November 2016, Californians voted to legalize
recreational cannabis use and the regulated sale and distribution of cannabis. In June 2017, the
Medical Cannabis Regulation and Safety Act and the Adult Use of Marijuana Act were integrated
to create the Medicinal and Adult-Use Cannabis Regulation and Safety Act (MAUCRSA).
Under MAUCRSA, the BBC was established as the single regulatory system to govern the
medical and adult-use cannabis industry in California. The BBC is responsible for licensing
retailers, distributors, testing labs, microbusinesses, and temporary cannabis events. CalCannabis
Cultivation Licensing (CalCannabis) is a division of the California Department of Food and
Agriculture. It is responsible for public safety and environmental protection. CalCannabis is
organized into a Licensing Branch and a Compliance and Enforcement Branch. Together, these
two branches of CalCannabis license and regulate commercial cannabis cultivators and manages
all commercial cannabis and cannabis products from cultivation to sale. The Manufactured

3
Cannabis Safety Branch (MCSB) of the California Department of Public Health is responsible for
the regulation of all commercial cannabis manufacturing. The MCSB ensures that commercial
cannabis manufacturers maintain safe workplaces and that products are free of contaminants, meet
product guidelines, and are properly packaged and labeled. All three licensing authorities can
accept and issue licenses for commercial cannabis activity in California (State of California, 2019).
With more than 10,000 cannabis operators, California is the largest cannabis market in the
United States. California has arguably the most detailed cannabis regulations of any state,
especially considering environmental protections. All licensed cannabis businesses must be in
compliance with the California Environmental Quality Act, but many of the environmental
regulations fall under the jurisdiction of other established laws. For example, each licensee must
comply with the Water Code as implemented by the State Water Resources Control Board,
Regional Water Quality Control Boards, or California Department of Fish and Wildlife (Cal. Code
Regs. tit. 16, § 8307 (2018)). Licensed businesses must also comply with all pesticides laws and
regulations established by the Department of Pesticide Regulation. Of all the states, California has
the most comprehensive pesticide regulations. The regulations include pesticide application and
storage protocols. The pesticides must be labeled properly, stored in secured areas, and leaks must
be contained and immediately cleaned up. Producers are required to use the minimum amount of
pesticide necessary to control the target pest and prevent offsite drift. Pesticides cannot be applied
when pollinators are present or allow pesticide drift to plants that attract pollinators. Pesticides
cannot be sprayed directly to surface water or allowed to drift to surface water. To ensure no drift
occurs, pesticides may only be sprayed when the wind is blowing away from surface water bodies.
Finally, pesticides are not to be applied when they may reach surface or groundwater (Cal. Code
Regs. tit. 16, § 8307 (2018)).
In January 2019, new cannabis regulations were approved for cannabis businesses across
the supply chain, from cultivation to retail. The new cannabis regulations included some key
changes that further clarified and specified criteria for commercial cannabis businesses under
MAUCRSA. One addition of note is an additional waste-management plan that allows cannabis
waste to be reintroduced into the agricultural operation (CDFA, 2019).
Massachusetts In Massachusetts, cannabis became legal for persons 21 years of age or older to grow and
possess in December 2016. In July 2017, “An Act to Ensure the Safe Use of Marijuana” established
the Massachusetts Cannabis Control Commission (CCC). The purpose of the CCC is to develop
and enforce cannabis regulations and develop and execute a plan of public education. The most
recent set of regulations was filed on October 18, 2019 under 935 CMR 500.000: Adult Use of
Marijuana. Many of Massachusetts’ regulations are similar to states that have legalized
recreational cannabis previously. For example, marijuana establishments are required to provide a
plan to reduce energy demand and consider opportunities for renewable energy generation. In
addition, organic waste disposal must render any marijuana unusable for its original purpose.
However, the regulations are more explicit than others for liquid waste disposal, including a
separate requirement stating that all liquid waste containing marijuana or by-products of marijuana
processing “shall be disposed of in compliance with all applicable state and federal requirements,
including but not limited to, for discharge of pollutants into surface water or groundwater.”
Another unique regulation requires laboratory testing of environmental media, such as soil,
growing media, and water, along with the testing for mold mildew, heavy metals, plant growth
regulators, and the presence of pesticides.

4
Illinois Despite being the 11th state to legalize recreational cannabis in 2019, Illinois has arguably
the strictest regulations of the industry. As part of the application process for a production license,
the grower has to include their waste management plan, total water needs, and total energy needs.
The plan for each resource needs to include whether they have or will create a sustainable use plan
in the future. The application also includes, “a commitment to use resources efficiently, including
energy and water.... a cannabis cultivation facility commits to meet or exceed the technology
standard identified: (i) lighting systems, including light bulbs; (ii) HVAC systems; (iii) water
application system to the crop; and (iv) filtration system for removing contaminants from
wastewater,” (Ill. Admin. Code tit. 101-0027 (2019)).
Additionally, the law limits the amount of water and electricity that can be used during
production. It also places limits on water runoff and wastewater (Schmid, 2019). It requires
growers to collect and filter wastewater so that it could be used to water their plants in the future.
In addition, a grower can use no more than 36 watts per square foot for lighting the plants. The
lighting used must be high-efficiency lighting approved by the state (Schmid, 2019). This was
passed in an attempt to prevent new large-scale environmental issues before they occur. The state
government acknowledges how harmful the industry has the potential to be. Illinois is quickly
becoming a leader in regulating the recreational cannabis industry and stands as a prime example
for other states to follow.
Conclusions Since recreational cannabis has not been federally legalized, there is no overhead authority
to provide guidance for regulations. This leads to regulations varying greatly between states. Some
states have opted to form specific agencies to focus on cannabis, such as the Massachusetts’
Cannabis Control Commission, while others have chosen to regulate through already established
departments. Furthermore, these agencies and regulations fall under different branches of
government, from the state department of food and agriculture to the taxation department. This
variance has left states to rely on their own intuition to create regulations. As a consequence, the
regulators are often left playing catch up, trying to correct flaws in the regulations as the problems
appear. Recently, many of these issues have involved public health, such as the rise of dabbing-
related disease incidents. Because we have not seen the immediate effect of the lack of
environmental regulation, environmental policy in regard to cannabis has been slow moving to
nonexistent. For example, none of the states with legal recreational cannabis have any regulations
in regard to specific cannabis pollutants. Research needs to be conducted to determine if
regulations specific to the cannabis industry are needed.

5
References
Cal. Code Regs. tit. 16, § 8307 (2018). Retrieved from
https://static.cdfa.ca.gov/MCCP/document/CDFA%20Final%20Regulation%20Text_011
62019_Clean.pdf
California Department of Food and Agriculture (CDFA). (2019). Fact Sheet: Highlights of the
New California Cannabis Cultivation Regulations. Retrieved from
https://static.cdfa.ca.gov/MCCP/document/Fact%20Sheet--
Highlights%20of%20New%20Regulations_2.8.19.pdf
Denver’s Department of Environmental Health. (2016). Denver’s Approach to Protecting Public
Health Related to Legalized Marijuana. Retrieved from
http://www.denverpublichealth.org/-/media/dph-files-and-docs/community-health-
promotion/substance-misuse-and-addiction/dvs-december2016-marijuana-
final.pdf?la=en&hash=4570A7DBC78B3AD1FA00066D75151E7F9C494F1C
Mass. Gen. Laws. ch. 935, § 500.000 (2019). Retrieved from
https://www.mass.gov/regulations/935-CMR-50000-adult-use-of-marijuana
Oregon Health Authority (OHA). (2018). Oregon Medical Marijuana Program:
Current Marijuana Regulatory Regimes.
https://www.oregon.gov/oha/PH/DISEASESCONDITIONS/CHRONICDISEASE/MEDI
CALMARIJUANAPROGRAM/Documents/commission/OCC_Report_on_Other_States_
May2018.pdf
Ill. Admin. Code tit. 101-0027 (2019). Retrieved from
http://www.ilga.gov/legislation/publicacts/101/101-0027.htm
Schmid, E. (2019). “Illinois Sets Strict Energy Efficiency Rules For Cannabis Growers.” St.
Louis Public Radio. Retrieved from https://news.stlpublicradio.org/post/illinois-sets-
strict-energy-efficiency-rules-cannabis-growers#stream/0

6
Chapter 3: Water Use and Wastewater
Introduction Many of the environmental impacts of the cannabis industry are unknown, but there is great
concern about the effects cannabis cultivation and processing facilities have on water quality. In
certain parts of the United States, there is a lot of discussion regarding the demand these facilities
will have on local water resources and infrastructure. More research needs to be conducted to
determine the potential impacts cultivation facilities could have on local wastewater treatment
plants. It is unknown what kind of effect pesticide residues, plant matter, nutrients, solvents, and
other constituents have on the quality of a facility’s wastewater.
There is little industry data available about the water use of cannabis cultivation. Some
estimates suggest cannabis requires upwards of 22.7 liters (5.8 gallons) of water per plant per day,3
while others estimate about 5,000 gallons per 1,000 plants per day (5 gallons) (U.S. National Drug
Intelligence Center, 2007). The widely cited value of 22.7 liters includes estimates of both legal
and illegal grow facilities in California. Including illegal facilities inflates the estimated water
consumption of the industry, since they are known to engage in illegal management practices
(California Council of Land Trusts, 2017; Everett, 2018; Bauer et al, 2015). It also assumes that
cannabis plants grown indoors and outdoors use the same amount of water. However, research
suggests that different cultivation methods require different amounts of water. There are many
water-saving techniques that can be used in indoor environments to reduce consumption and cost.
Additionally, the duration and number of growing seasons for indoor and outdoor can vary
significantly depending on the location of the facilities. Ultimately, a more accurate number for
both outdoors and indoors is required to properly assess the true impacts of the cannabis industry
on water resources in the United States.
The goal of this chapter is to address some of these gaps in research by identifying sources
and constituents of wastewater in the cannabis industry and by providing a better estimation of the
amount of water used in cultivation. The production process of cannabis was broken down into
two sections: cultivation and processing.
Cultivation
The stages of cannabis cultivation are summarized in Figure 3.1 below.
Figure 3.1. Cultivation stages for cannabis (Desjardins, 2018).
3Ashworth & Vizuete, 2017; Bauer et al., 2015; Butsic & Brenner, 2016; Dillis et al, 2019; California Council of Land
Trusts, 2017; ORIHIDTA, 2018; CA Department of Fish and Wildlife, 2018; Sawyer & Keeler-Wolf, 1995.

7
(2) Seedling or Clone Stage
The seedling or clone stage is the first stage in our analysis. Seedlings are cannabis plants
grown directly from a seed, while clones are cuttings from a mother plant. Some research states
that there is negligible water consumption for seedlings (Surna Technology, 2018). Other research
states that seeds require less water than clones, since they are hardier and more resistant to disease.
They may require more water initially, but the growth period overall is shorter for seeds than for
clones (CCC, 2019). Clones are preferred by most grow facilities because the exact strain and
properties of the mature plants are known. The tradeoff is increased nutrient consumption and
reduced resistance to disease (CCC, 2019).
(3) Vegetative Growth Stage
The vegetative growth stage is recognized as the most water intensive portion of the
growing process. The vegetative growth stage can last anywhere from 2 weeks to 2 months, lasts
about 4 weeks on average (Griffith, 2019). During this stage, root zones and robust branches
continue to develop. The humidity is usually kept around 50%, with temperatures around 20-24℃
(Royal Queen Seeds, n.d.). An estimation of total water consumption by square foot is shown
below in Table 3.1.
Table 3.1. Vegetative Growth Stage4
Indoor Outdoor
Duration 4 weeks
Quantity of water 0.096 - 0.48 𝑔𝑎𝑙
𝑠𝑞.𝑓𝑡 𝑥 𝑑𝑎𝑦
Total Consumption 8.74 - 43.67𝑔𝑎𝑙
𝑠𝑞.𝑓𝑡
(4) Flowering Stage Harvesting takes place at the end of the flowering stage. The flowering stage typically lasts
6-12 weeks. Not all cannabis plants require the same amount of time for flowering, but most strains
will not be ready before week 8 (Royal Queen Seeds, 2017). At this stage, the plants begin to
indicate their sex and produce buds. The humidity is usually reduced to 40-50%, with temperatures
around 20-28℃ (Royal Queen Seeds, n.d.). During this stage, a 12-12 (hour) light-dark cycle is
used to artificially stimulate flower development. When grown outdoors, the flowering stage
typically begins at the end of summer or beginning of autumn, when the daylight hours begin to
decrease (Royal Queen Seeds, n.d.). Table 3.2 shows the quantity of water consumed by indoor
flowering plants versus outdoor.
4 Data from: CCC, 2019; Surna Technology, 2018

8
Table 3.2. Flowering Stage5
Indoor Outdoor
Duration 10 weeks
Quantity of water 0.096 - 0.16 𝑔𝑎𝑙
𝑠𝑞.𝑓𝑡 𝑥 𝑑𝑎𝑦 0.12 - 0.2
𝑔𝑎𝑙
𝑠𝑞.𝑓𝑡 𝑥 𝑑𝑎𝑦
Total Consumption 6.72 - 11.2𝑔𝑎𝑙
𝑠𝑞.𝑓𝑡 8.4 - 14.0
𝑔𝑎𝑙
𝑠𝑞.𝑓𝑡
The flowering stage consists of the early bloom, late bloom, and flush phases. The early
bloom phase is about 4-5 weeks long. During this phase, the focus is to produce strong sturdy
plants with heavy buds and a robust root system (Griffith, 2019). The late bloom phase is about 4
weeks long. During this phase, the plant has an intense, pungent odor and the plants’ pistols may
turn darker, into a brown or amber color (Royal Queen Seeds, 2017). The flush phase typically
occurs 2 weeks before harvest. During this phase, the plants are “flushed”; they stop receiving
nutrients and are given pure, pH-balanced water. The goal is to flush out any salts and minerals
that may remain (Royal Queen Seeds, 2017).
(5) Harvest
The time to harvest can be determined by the plant’s physical appearance. At the beginning
of flowering, the trichomes have a transparent color (Ryan, 2019). When it is time to harvest, 60%
or more of the trichomes should be milky white. Some cultivators wait until 90% of the trichomes
have changed color, which produces a product with a more sedative effect. Another indicator is
the foliage. When the leaves turn yellow, it indicates that the buds are fully utilizing nutrients,
signaling the optimum point of ripening of the plant (Royal Queen Seeds, 2017). Depending on
the strain, the pistils may also turn an amber color (Ryan, 2019).
Cultivation Methods
There are many methods to grow cannabis plants indoors. The two core methods of indoor
growing are soil growing and hydroponics. Hydroponics is a growing technique that involves the
cultivation of plants without the use of a substrate. Hand watering is classified as a soil growing
technique and hydroponic techniques include: aeroponics, drip watering, ebb and flow, nutrient
film, water culture, and wick systems. The methods are briefly summarized below in Table 3.3.
5 Data from: CCC, 2019; Surna Technology, 2018

9
Table 3.3. Cultivation Methods
Irrigation Method Automated Recycle
Potential Difficulty
Aeroponics Y Y Advanced
Drip Watering Y Y Intermediate
Ebb and Flow Y Y Beginner
Hand Watering N N Beginner
NFT Systems Y Y Advanced
Water Culture System Y Y Beginner
Wick System Y Y Beginner
Aeroponics
Aeroponic systems use spray nozzles to mist the stem or roots of the plants with nutrients.
For large-scale systems, a channel system is often used, where the roots of the plants are enclosed
in a channel lined with spray misters. Another method of aeroponics is the bucket system, in which
nutrified water and air are maintained in buckets into which the roots grow (CCC, 2019; DEH-
CSWG, 2017).
There are many environmental benefits to growing in aeroponic systems. Aeroponically
grown plants require less pesticides. The lack of soil in the system means that the plants are not
vulnerable to pests typically found in soil. Aeroponic systems are very efficient in terms of
nutrients, water, and space. Any nutrient solution or water that is not absorbed by the roots of the
plant can be recycled. Furthermore, aeroponic systems have a faster growth cycle than soil-based
systems. Some aeroponic systems can reduce the average growth cycle from 90 to 60 days.
Aeroponic systems take up less space because the roots of the plant are not constrained by a pot
or the amount of available soil. This means that more plants can be grown closer together. An
additional benefit to growers is that aeroponic systems offer a high degree of control for the
grower. Plants grown in these systems also have the highest yield of trichomes (Kavanagh, 2018;
Youngblood, 2017).
Aeroponic systems require a 24/7 supervision because the system is vulnerable. Minor
problems in the setup such as power outages, poorly mixed nutrient solution, or clogged pipes, can
result in compromised crops. If the roots do not receive a constant stream of water and nutrients,
they can start to die within an hour. Due to the high level of supervision and expertise required,

10
aeroponic systems are not recommended for beginners. There is also a risk of molds developing
in an aeroponic system. The roots require darkness and moisture, which creates ideal conditions
for molds to thrive (Kavanagh, 2018; Youngblood, 2017).
Drip Watering
Drip irrigation involves irrigation systems that feed directly to each plant through thin drip
tubes. Nutrified water is pumped through irrigation tubes and drip emitters. This method is
considered the most water efficient way of irrigating a crop. The amount of water can be controlled
directly or on an automated schedule. Drip irrigation allows the grower to fine tune how much
water is given to each plant, and drip emitters can be pressure compensated so that each plant gets
the same amount of water. Drip irrigation systems allow growers to water several times per day to
deliver the total desired volume of water over a longer period. This virtually eliminates excess
water waste and runoff from the plants (CCC, 2019; DEH-CSWG, 2017).
The main benefits of drip watering, as discussed above, are automation and precision. Drip
watering is also applicable for both small-scale and large-scale growers. One of the major
drawbacks of drip irrigation is maintenance. Drip irrigation requires a monthly flush-out to ensure
there is no algae or mineral build up. Build-up can prevent water flow, preventing plants from
getting their required water and nutrients. If the drip irrigation is under the soil, a clog may go
undetected until the plant exhibits signs of nutrient deficiency, which may be too late (Royal Queen
Seeds, 2017; Worms, 2019).
Ebb and Flow (Flood Tables)
Ebb and flow (E&B) systems use large, shallow tables that flood periodically on an
automated schedule. When the table floods, a layer of water and/or nutrients is provided to the
plants. These tables are generally used with plants seed trays, plug trays or small pots that can wick
up water or nutrient solution through drainage holes. With E&B systems, there is less of a chance
of under-watering plants. These systems are also easy and inexpensive to build. However, E&B
systems do require large amounts of water to be used at once. This can cause increased humidity
if the table does not have a lid. E&B systems must also be maintained to ensure the system is clean,
there is no mineral buildup, and enough water is available for the next flood cycle. To mitigate this
impact, E&B systems are best used when the majority of the water will be absorbed or when the
operator is prepared to sanitize, re-nutrify and re-use the water. Any water that is not taken up by
the plants can be recycled. The recycled water is typically treated to kill any pathogens using
chemicals or UV light prior to reuse (CCC, 2019; DEH-CSWG, 2017).
Nutrient Film Technique
The Nutrient Film Technique (NFT) consists of a very shallow nutrient solution that runs
downward in a tube or tray towards a reservoir (CCC, 2019; DEH-CSWG, 2017). The plants sit
on top of the angled channel, so that the nutrient solution runs over the roots. The reservoir collects
excess nutrient solution to be reused (Tomoski, 2019). NFT is similar to ebb and flow in the sense
that both methods use water pumps. However, ebb and flow systems flood the plants and then
drain the water, while NFT uses a small, constant water stream. A typical flow rate for NFT is
about one liter of water per minute (Royal Queen Seeds, 2018).
This method is normally used on smaller plants with a short crop cycle. This is so that large
root systems do not block the pipes and flow of nutrient solution. The overcrowding or
overgrowing of roots can also lead to disease and loss of crops (DEH-CSWG, 2017). NFT can be

11
difficult to maintain since the roots need to receive a constant stream of water and nutrients to
protect the roots from drying out (Tomoski, 2019).
Water Culture Systems
In water culture systems, the plants are suspended so the roots hang down into a nutrient
solution. The nutrient solution is held in a reservoir. The reservoir is continuously aerated to
prevent the roots from suffocating and ensure the plants receive an ideal amount of nutrients and
oxygen (CCC, 2019; DEH-CSWG, 2017).
Water culture systems are good for water loving, rapid growing plants. They allow for
flexible plant sizes, including large root masses. Water culture systems reuse water and provide a
larger yield with fewer plants. However, plants in a water culture system can be prone to root
diseases. The roots of the plants may also grow too large and clog the irrigation lines (Flo-n-Gro
Grow Systems, 2020).
Wick System
Wick systems employ a reservoir that provides water and nutrients for a plant. The plants
pull up the nutrient solution via capillary action through the wick material. This system is well-
suited for small plants. In regard to cannabis plants, seedlings and newly vegetating plants are
occasionally watered sing wick systems. However, the system can be insufficient for large plants
with increased water needs. Plants with high water demands, such as cannabis, can lose weight
and yield if the wicking process is too slow (CCC, 2019; DEH-CSWG, 2017). While this is
considered one of the simplest systems, it is also one of the least efficient (Tomoski, 2019).
Hand Watering
Hand watering is one of the most common practices since it does not require expensive
equipment or heavy maintenance. Watering by hand involves the use of hoses or watering cans.
This method allows growers to get a “hands on” feel for mixing and feeding each plant. However,
hand watering allows for a large margin of error. The amount of water applied to each plant can
vary greatly, especially between applicators. The amount of nutrients can also vary by day or
applicator. Therefore, there is much greater potential for water and nutrients to be wasted through
either over application or by missing the plant root system. If hand watering is being used, the
facility should have a good operating procedure on how to hand water (CCC, 2019; DEH-CSWG,
2017).
Water Use Analysis
In order to estimate the amount of water used by facility size, as well as by plant, an analysis
was conducted using the water requirements of cannabis at each life stage, shown in Table 3.4.
12
Table 3.4. Water Use by Stage
Stage of Life
Water Use
(𝒈𝒂𝒍
𝒔𝒒 ⋅ 𝒇𝒕 𝒙 𝒅𝒂𝒚)
Indoor Outdoor
Vegetative Growth 0.096 - 0.48
Flowering 0.096 - 0.16 0.12 - 0.20
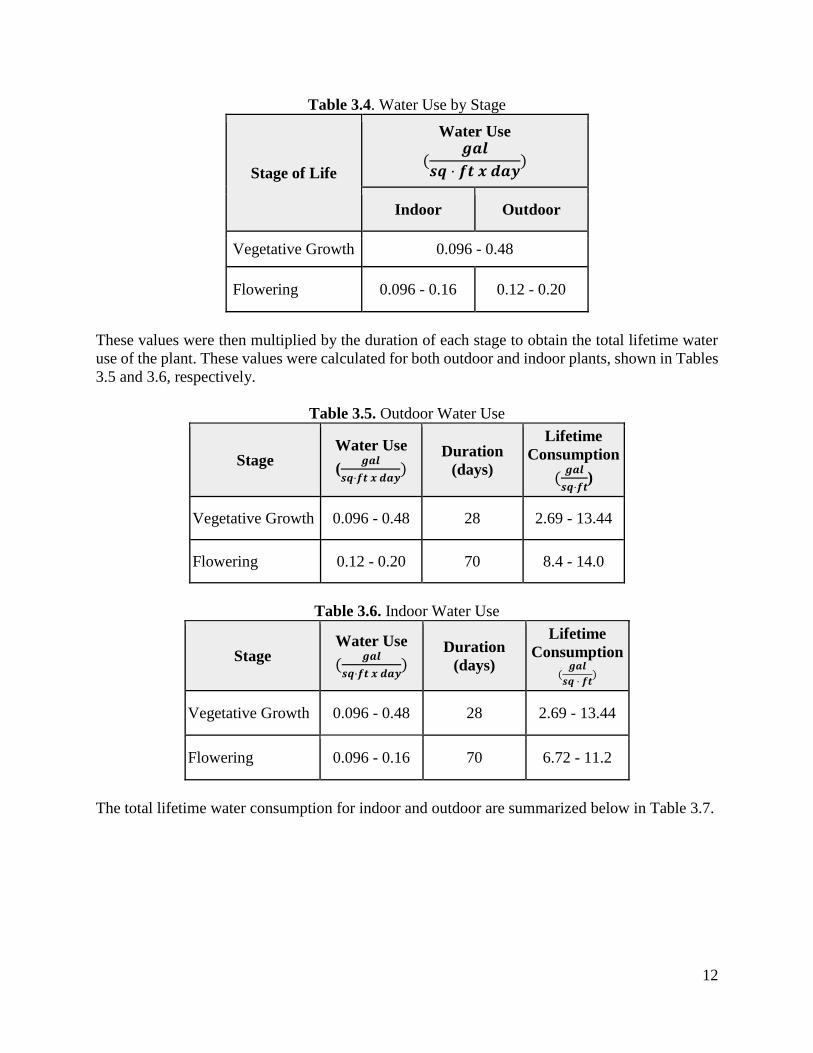
These values were then multiplied by the duration of each stage to obtain the total lifetime water
use of the plant. These values were calculated for both outdoor and indoor plants, shown in Tables
3.5 and 3.6, respectively.
Table 3.5. Outdoor Water Use
Stage Water Use
(𝒈𝒂𝒍
𝒔𝒒⋅𝒇𝒕 𝒙 𝒅𝒂𝒚)
Duration
(days)
Lifetime
Consumption
(𝒈𝒂𝒍
𝒔𝒒⋅𝒇𝒕)
Vegetative Growth 0.096 - 0.48 28 2.69 - 13.44
Flowering 0.12 - 0.20 70 8.4 - 14.0
Table 3.6. Indoor Water Use
Stage Water Use
(𝒈𝒂𝒍
𝒔𝒒⋅𝒇𝒕 𝒙 𝒅𝒂𝒚)
Duration
(days)
Lifetime
Consumption
(𝒈𝒂𝒍
𝒔𝒒 ⋅ 𝒇𝒕)
Vegetative Growth 0.096 - 0.48 28 2.69 - 13.44
Flowering 0.096 - 0.16 70 6.72 - 11.2
The total lifetime water consumption for indoor and outdoor are summarized below in Table 3.7.

13
Table 3.7. Lifetime Water Consumption
Facility Type Water Use (𝒈𝒂𝒍
𝒔𝒒⋅𝒇𝒕)
Indoor 9.40 - 24.64
Outdoor 11.09 - 27.44
To determine the amount of water used by facility size, the total water use in gal/sq.ft was
multiplied by the canopy size in sq.ft. The canopy size refers to the total size of the grow space
within a facility. To determine the standard canopy sizes, a range of canopy sizes from the
Massachusetts Cannabis Commission (CCC, 2018) were used. The results are summarized in
Tables 3.8 and 3.9 for outdoor and indoor, respectively.
Table 3.8. Outdoor Water Use by Facility Size
Canopy Size (sq.ft) Water Use (gal)
5,000 55,440 - 137,200
10,000 110,880 - 274,400
20,000 221,760 - 548,800
30,000 332,640 - 823,200
40,000 443,520 - 1,097,600
50,000 554,400 - 1,372,000
60,000 665,280 - 1,646,400
70,000 776,160 - 1,920,800
80,000 887,040 - 2,195,200
90,000 997,920 - 2,469,600
100,000 1,108,800 - 2,744,000
14
Table 3.9. Indoor Water Use by Facility Size
Canopy Size (sq.ft) Water Use (gal)
5,000 47,040 - 123,200
10,000 94,080 - 246,400
20,000 188,160 - 492,800
30,000 282,240 - 739,200
40,000 376,320 - 985,600
50,000 470,400 - 1,232,000
60,000 564,480 - 1,478,400
70,000 658,560 - 1,724,800
80,000 752,640 - 1,971,200
90,000 846,720 - 2,217,600
100,000 940,800 - 2,464,000
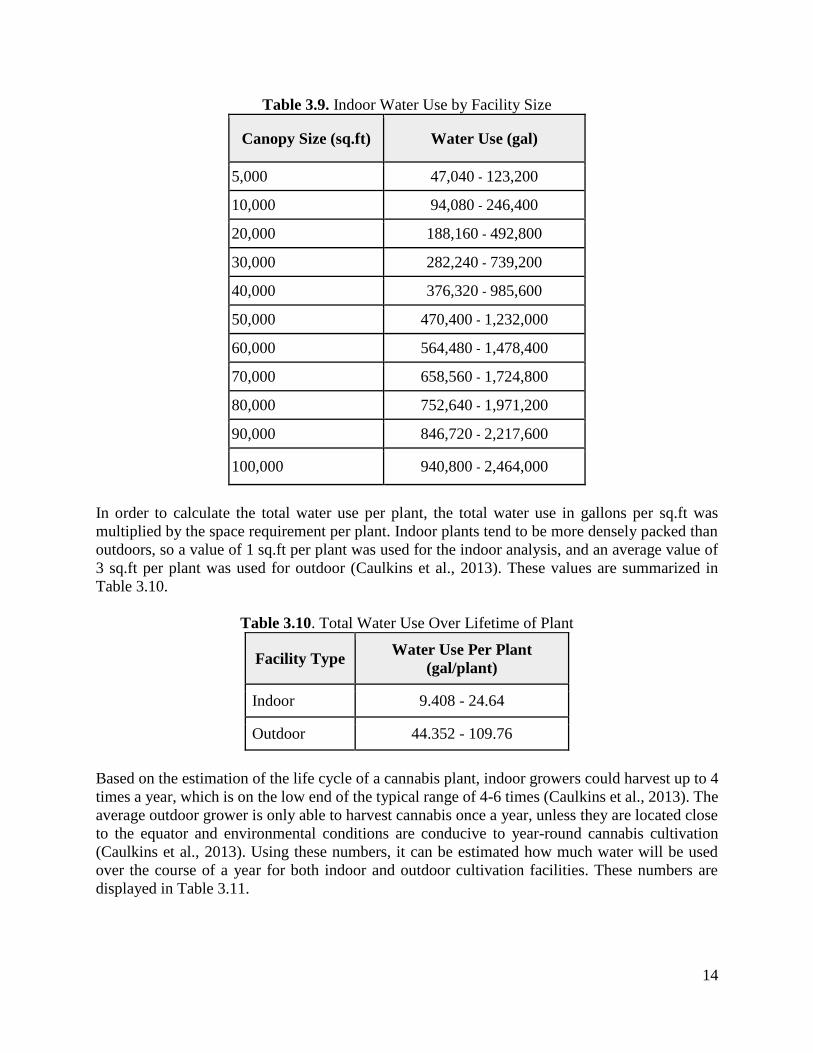
In order to calculate the total water use per plant, the total water use in gallons per sq.ft was
multiplied by the space requirement per plant. Indoor plants tend to be more densely packed than
outdoors, so a value of 1 sq.ft per plant was used for the indoor analysis, and an average value of
3 sq.ft per plant was used for outdoor (Caulkins et al., 2013). These values are summarized in
Table 3.10.
Table 3.10. Total Water Use Over Lifetime of Plant
Facility Type Water Use Per Plant
(gal/plant)
Indoor 9.408 - 24.64
Outdoor 44.352 - 109.76
Based on the estimation of the life cycle of a cannabis plant, indoor growers could harvest up to 4
times a year, which is on the low end of the typical range of 4-6 times (Caulkins et al., 2013). The
average outdoor grower is only able to harvest cannabis once a year, unless they are located close
to the equator and environmental conditions are conducive to year-round cannabis cultivation
(Caulkins et al., 2013). Using these numbers, it can be estimated how much water will be used
over the course of a year for both indoor and outdoor cultivation facilities. These numbers are
displayed in Table 3.11.

15
Table 3.11. Water Use Over a Grow Year
Canopy Size
(sq.ft)
Indoor Water Use (gal)
(4 Harvests)
Outdoor Water Use (gal)
(1 Harvest)
5,000 188,160 - 492,800 55,440 - 137,200
10,000 376,320 - 985,600 110,880 - 274,400
20,000 752,640 - 1,971,200 221,760 - 548,800
30,000 1,128,960 - 2,956,800 332,640 - 823,200
40,000 1,505,280 - 3,942,400 443,520 - 1,097,600
50,000 1,881,600 - 4,928,000 554,400 - 1,372,000
60,000 2,257,920 - 5,913,600 665,280 - 1,646,400
70,000 2,634,240 - 6,899,200 776,160 - 1,920,800
80,000 3,010,560 - 7,884,800 887,040 - 2,195,200
90,000 3,386,880 - 8,870,400 997,920 - 2,469,600
100,000 3,763,200 - 9,856,000 1,108,800 - 2,744,000
Water Use Discussion
Many researchers suggest that the amount of water used per plant per day is a much higher
value of 22.7 L (5.8 gal) as compared to the calculated value of 0.096 - 0.251 gal per plant per day
for indoor growing and 0.453 - 1.12 gal per plant per day for outdoor. This may be contributed to
the fact that the calculations above were solely based on the estimated amount of water applied
during the cultivation process over one harvest cycle. It does not include humidifiers, heating,
processing, landscaping, or water for sanitary purposes. It was assumed based on research that the
water required to clean processing machines would be negligible compared to the amount of water
required for growing. Additionally, the use of humidifiers would be highly variable depending on
the lighting to space requirements of individual facilities. It also did not account for the fact that
growers may apply more water knowing that a certain amount may runoff or the effect leaks may
have on total water consumption. The value calculated for outdoor plants may also vary depending
on the climate the plants are grown in. This would lead to variability in numbers across the country.
This estimation can be considered a conservative estimate based on the water-saving techniques
many growers use and what the cannabis plant actually requires.
The numbers may vary for additional reasons. The first reason is that there is a lack of
comprehensive research on cannabis growth in the United States. The numbers selected for this
analysis were selected from Surna Technology, a company specializing in technology for the
cannabis industry. These numbers were supported by Massachusetts’ Best Management Practices
for Water Use for Cannabis Cultivation and a study assessing the carbon footprint of indoor
cannabis cultivation (CCC, 2019; Mills, 2012).
Secondly, the duration of growth cycles vary based on the strains that are being grown.
Depending on the length of the growth cycle, the amount of water consumed per harvest may be
higher. Some estimates put the growth cycle at 150 days, as compared to the value used in the

16
analysis of 98 days (Butsic & Brenner, 2016). New strains and techniques are being developed by
growers to shorten the duration of the growth cycle and increase yearly yields. In the future, this
may further reduce the water consumption per harvest cycle, but may increase yearly water
consumption.
Despite the fact that the above analysis is a conservative estimation, cannabis cultivation
facilities still have a demand on local water treatment plants. For example, a mid-sized indoor
canopy of 50,000 sq. ft requires 4,800 - 12,571 gal per day from cultivation operations alone. If
this facility was located in a small municipality with a water treatment capacity of 650,000 gal/day,
it could use anywhere from 0.7% to 2% of the town’s daily water supply on irrigation. This does
not take into account water required by the rest of the facility. This demand would be multiplied
if more than one facility were to move into a municipality. This could strain a region’s water supply
in drought-prone states like California.
When comparing the water consumption to other crops, cannabis has a similar value to
tobacco. Peak water consumption for tobacco plants reaches 3-5 liters of water per plant per day
(0.79-1.32 gallons) in the seedling phase (FAO, n.d.). However, many articles compare cannabis
to wine grapes, which use approximately 12.6 liters (3.32 gallons) of water per plant per day (Bauer
et al., 2015).
Wastewater Sources Water pollution can come in many different forms from many different sources. Sources
of water pollution are often classified into two categories: point source and nonpoint source. Point
and nonpoint sources are legally defined by the Clean Water Act. According to section 502(14) of
the Clean Water Act, the term point source means ‘any discernible, confined and discrete
conveyance, including but not limited to any pipe, ditch, channel, tunnel, conduit, well, discrete
fissure, container, rolling stock, concentrated animal feeding operation, or vessel or other floating
craft, from which pollutants are or may be discharged.” The term nonpoint source is defined to
mean any source of water pollution that does not meet the legal definition of a point source.
Consequently, agricultural stormwater and return flows from irrigated agriculture are considered
nonpoint sources (EPA, 2018).
Point Source Pollution
An indoor cultivation facility can be considered an industrial source and therefore a point
source of pollution. Many regulations prohibit the dumping of cannabis wastewater. It is required
to be stored and hauled to a wastewater treatment facility. California allows cannabis cultivation
wastewater to be discharged to a community sewer system if the wastewater meets the sewer
system requirements. California also allows cannabis cultivation facilities to be exempt from this
requirement if they qualify. In this case, they are issued a permit to allow wastewater to be
discharged to on-site treatment systems, like septic tanks and leach fields, to land, or surface water.
There are multiple ways in which wastewater is produced in indoor facilities.
Disposal of Excess Irrigation Water
Hydroponic systems are designed to be open or closed. Open hydroponics systems
discharge the water once it has gone through the system and do not recirculate it. Some growers
look to reduce their wastewater by selecting closed systems. Closed systems may use less water
by reusing the water once it passes through the system. The water is only discharged once the

17
salinity and nutrient concentrations of the water reach a certain level and is no longer usable
(Kumar & Cho, 2014).
Irrigation tail water is wastewater that is generated when excess water drains from the
growth media (California Water Control Board, 2019). The water may contain excess macro and
micronutrients such as phosphates, nitrates, calcium, magnesium, iron, and zinc. The water can
have a high salinity or contain pesticide residue (California Water Control Board, 2019).
In cultivation facilities where water is recaptured, stored in tanks, and reused, the watering
tanks have to be refreshed when the salinity and nutrient concentrations become too high. When
there are too many nutrients present, nutrients will build up in the growth media and not be
conducive to plant growth (Surna Technology, 2018). The constituents present in this wastewater
are similar to irrigation tail water, but the concentrations vary due to varying nutrient requirements
at different stages of growth.
Air Pollution Control Equipment
Blowdown from air pollution control equipment is another potential source of wastewater
in a cannabis cultivation facility (EPA, 2006). Air pollution control equipment, like wet scrubbers,
are used to remove contaminants and odor from a facility’s air stream. They remove contaminants
in the vapor by converting them to their liquid or condensate form or by trapping particulates in
water droplets (EPA, 2002). The content of the air emissions will determine what ends up in the
wastewater blowdown. Air pollution control equipment will be discussed further in Chapter 6.
Reverse Osmosis
Reverse osmosis (RO) is a common industry practice for growers who wish to control the
amount of nutrients their plants receive. RO is the process of purifying municipal or well water by
using a semipermeable membrane to remove ions and large particles. It is performed prior to the
application of water to plants to allow the grower to start at the lowest possible concentrations of
ions (Surna Technology, 2018). This also prevents excess salts from accumulating in the growing
medium. The ions that are removed by RO include metals and salts such as iron, sodium,
potassium, phosphorus, nitrate, and more. The RO process increases the amount of concentrated
wastewater on site, producing approximately 0.5 to 5 gallons of RO brine (wastewater) for 1 gallon
of usable water (Surna Technology, 2018; DEH-CSWG, 2017). For facilities that use thousands
of gallons per day, this can create massive amounts of wastewater that is discarded to sanitary
drains (DEH-CSWG, 2017). This is not accounted for in the amount of water usage per plant or
sq. ft. Based on the numbers calculated in the water use analysis, an analysis of the wastewater
produced by using RO was conducted.
Reverse Osmosis Analysis
To estimate the amount of wastewater produced in the RO process, the range 0.5 to 5
gallons of wastewater (WW) to 1 gallon of usable water was used. Using water use per one harvest
cycle, the ranges of RO wastewater produced by canopy size were calculated using the equations
below.
(𝐿𝑜𝑤 𝑜𝑟 ℎ𝑖𝑔ℎ) 𝑊𝑎𝑡𝑒𝑟 𝑢𝑠𝑒 (𝑔𝑎𝑙) ∗ 0.5 𝑔𝑎𝑙 𝑜𝑓 𝑊𝑊
1 𝑔𝑎𝑙 𝑜𝑓 𝑢𝑠𝑎𝑏𝑙𝑒 𝑤𝑎𝑡𝑒𝑟= 𝑔𝑎𝑙 𝑜𝑓 𝑅𝑂 𝑊𝑊
(𝐿𝑜𝑤 𝑜𝑟 ℎ𝑖𝑔ℎ) 𝑊𝑎𝑡𝑒𝑟 𝑢𝑠𝑒 (𝑔𝑎𝑙) ∗ 5 𝑔𝑎𝑙 𝑜𝑓 𝑊𝑊
1 𝑔𝑎𝑙 𝑜𝑓 𝑢𝑠𝑎𝑏𝑙𝑒 𝑤𝑎𝑡𝑒𝑟= 𝑔𝑎𝑙 𝑜𝑓 𝑅𝑂 𝑊𝑊

18
Using the canopy size of 5,000 sq.ft and the low water use value of 47,040 gal (Table 3.9), an
example calculation is shown below.
47,040 𝑔𝑎𝑙 ∗ 0.5 𝑔𝑎𝑙 𝑜𝑓 𝑊𝑊
1 𝑔𝑎𝑙 𝑜𝑓 𝑢𝑠𝑎𝑏𝑙𝑒 𝑤𝑎𝑡𝑒𝑟= 23,520 𝑔𝑎𝑙 𝑜𝑓 𝑅𝑂 𝑊𝑊
47,040 𝑔𝑎𝑙 ∗ 5 𝑔𝑎𝑙 𝑜𝑓 𝑊𝑊
1 𝑔𝑎𝑙 𝑜𝑓 𝑢𝑠𝑎𝑏𝑙𝑒 𝑤𝑎𝑡𝑒𝑟= 235,200 𝑔𝑎𝑙 𝑜𝑓 𝑅𝑂 𝑊𝑊
The calculations were repeated for high water use (Table 3.9) and for each canopy size. The values
are outlined below in Table 3.12. It should be noted that RO wastewater was calculated for only
indoor water use.
Table 3.12. Reverse Osmosis Wastewater Quantity
Canopy
Size (sq.ft)
RO WW produced by
low water use (gal)
RO WW produced by
high water use (gal)
5,000 23,520 - 235,200 61,600 - 616,000
10,000 47,040 - 470,400 123,200 - 1,232,000
20,000 94,080 - 940,800 246,400 - 2,464,000
30,000 141,120 - 1,411,200 369,600 - 3,696,000
40,000 188,160 - 1,881,600 492,800 - 4,928,000
50,000 235,200 - 2,352,000 616,000 - 6,160,000
60,000 282,240 - 2,822,400 739,200 - 7,392,000
70,000 329,280 - 3,292,800 862,400 - 8,624,000
80,000 376,320 - 3,763,200 985,600 - 9,856,000
90,000 423,360 - 4,233,600 1,108,800 - 11,088,000
100,000 470,400 - 4,704,000 1,232,000 - 12,320,000
Because of the large quantity of wastewater produced, states like Massachusetts and
Colorado do not recommend the use of RO in their best management practices (CCC, 2019; DEH-
CSWG, 2017). Additionally, the Denver Best Management Practices cautions against the use of
RO due to the high concentration of salts and minerals in wastewater, since it can create difficulties
in wastewater treatment plants (DEH-CSWG, 2017). The RO process also requires periodic
flushing, which would lead to more cleaning solvents and descaling compounds in the wastewater
(California Water Control Board, 2018) To reduce wastewater, some growers use their RO
wastewater in humidifiers (California Water Control Board, 2018).
Nonpoint Source Pollution
Outdoor cultivation is considered a nonpoint source of pollution. The runoff cannot be
collected or easily controlled. Nonpoint source pollution generally results from land runoff,

19
precipitation, drainage, and seepage. The main concern for nutrients is runoff from rainfall or
snowmelt. As the runoff moves, it washes away excess nutrients and deposits them into lakes,
rivers, wetlands, coastal waters, and ground waters. Nonpoint source pollution is a leading cause
of water quality issues since it is much more difficult to control than point sources. Excess runoff,
particularly from nonpoint sources, can have significant impacts on water bodies (EPA, 2018).
The main contaminants of concern in nonpoint cannabis cultivation runoff are the pesticides and
nutrients in the water. It is necessary to quantify any potential nutrient runoff in order to meet the
necessary water quality standards.
Cultivation Wastewater Constituents The constituents of wastewater are a concern for facility owners and wastewater treatment
plants (WWTPs) alike. Constituents of concern include pesticides, nutrients, and certain biological
agents. These constituents can affect the biological oxygen demand (BOD), chemical oxygen
demand (COD), and total suspended solids (TSS).
Biological Oxygen Demand
The biological oxygen demand is a measurement of how much oxygen is being consumed
by microorganisms to decompose biodegradable material under aerobic conditions
(Tchobanoglous et al., 2013). The COD test is used along with the BOD test to estimate the amount
of nonbiodegradable organic material in a wastewater (Woodard & Curran, Inc., 2006). If the BOD
is high, then a large quantity of dissolved oxygen is being consumed by microorganisms to break
down the organic matter. Dissolved oxygen is required to sustain aquatic life, and if concentrations
are too low the water body can become anoxic. These conditions are lethal for aquatic ecosystems.
Additionally, excessively high BOD can lead to algal blooms. As part of a WWTPs’ NPDES
permit, they are required to reduce the BOD to a certain level. If high quantities of wastewater
with high BOD are entering WWTPs, then it may cause the WWTPs to make extensive and
expensive changes to accommodate this new influent. It may also interrupt or inhibit current
processes within the treatment plant.
Total Suspended Solids
In addition to affecting the BOD, the organic material in the effluent of cannabis facilities
affects the TSS of wastewater. Total suspended solids is the measure of solids that cannot pass
through a 1.58 micron pore filter (Tchobanoglous et al., 2013). Essentially, it is the portion of
solids in wastewater that are large enough to remain suspended in a waterbody. They are an
important indicator for turbidity. The higher the amount of suspended, the lower the water clarity,
and the higher the turbidity. Turbid waters have reduced light flow to the bottom of the waterbody
and are not conducive to plant growth and can smother aquatic organisms. Cannabis wastewater
has high levels of plant matter from rinsing, extractions, and runoff. Cannabis fibers are very rigid
and difficult to break down. They are often found at high concentrations, which may inhibit a
facility from being able to send their wastewater to municipal drains (Micron Waste Technologies,
n.d.). They are also a problem for WWTPs, and may require additional processes to remove them.
Chemical Oxygen Demand
The COD is the amount of oxygen that is required to chemically oxidize organic and
inorganic chemicals in the water. This test is typically performed using oxidizing agents including
dichromate (Tchobanoglous et al., 2013). COD is classified by nonbiodegradable COD and

20
biodegradable COD. Nonbiodegradable COD includes pharmaceuticals, persistent organic
pollutants, industrial chemicals, pesticides, and organic pollutants. Biodegradable COD is used to
estimate the BOD of a sample and includes fatty acids, nutrients, proteins, sugars, alcohols, and
others (Arvia Technology, n.d.). High COD is generally caused by inorganic substances and
organic substances that are difficult to oxidize biologically such as lignin (Tchobanoglous et al.,
2013). Lignin is the compound in plants that gives them a rigid and woody texture. This may be
the source of high COD experienced by WWTPs receiving effluent from cannabis facilities.
Wastewater treatment plants are able to remove approximately 75-85% of COD through primary
and secondary treatments, but recalcitrant compounds like pesticides, industrial chemicals, and
other organic pollutants remain (Arvia Technology, n.d.).
Pesticides
Pesticides are one of the sources of high COD if large quantities end up in a facility’s
effluent. They are poorly removed in conventional WWTPs, since many are resistant to microbial
degradation (Misra et al., 2013). Pesticides are toxic to certain microorganisms and can be
metabolized or bioaccumulated by microorganisms (DeLorenzo, Scott, & Ross, 2001). This can
inhibit photosynthesis and in turn limit process efficiency (Misra et al., 2013). Their concentrations
are often higher in the effluent than the influent (Köck-Schulmeyer et al., 2013). This may be
because transformation products of pesticides are converted back by WWTP processes or the
desorption from particulates during treatment (Köck-Schulmeyer et al., 2013). This leads to high
levels of pesticides entering surface waters from wastewater effluent. The environmental impacts
of pesticides are discussed further in Chapter 4.
Biological Agents
The biological agents that are of concern in cannabis production are pathogens such as
certain bacteria and fungus. Bacteria and other pathogens can be present in manure-based
fertilizers, compost, biosolids, and soil amendments (California Water Control Board, 2018). If a
facility is using any of the listed materials, there is the potential for salmonella or E. coli bacteria
to be present. These pathogens may get caught in irrigation water and when the water is disposed,
the pathogens may enter the wastewater. WWTPs have treatment processes in place to remove
such contaminants, but should be aware that they are constituents of the WWTP influent.
Fungus such as Trichothecium roseum (pink mildew) and of the Penicillium genus are
some of the most common fungus species found in cannabis grow facilities (Fundacion Canna,
n.d.). Handling crops contaminated with these fungi can release up to 500,000 spores per square
meter (Fundacion Canna, n.d.) These spores can end up in the runoff irrigation water or in the air
ventilation systems. The fungus spores can then end up in the blowdown water from these air
ventilation systems and exit in the facility’s wastewater effluent.
Nutrients
When cultivating any type of plant, fertilization is a key component of success. Proper
plant nutrition will determine if a plant thrives or struggles. In general, there are 17 essential
nutrients for proper plant growth. Plants obtain hydrogen, oxygen, and carbon from water or the
atmosphere. The remaining 14 nutrients must be provided by the grower (Whipker et al., 2019).
The required nutrients are summarized below in Table 3.13.

21
Table 3.13. Types of Fertilizers
Macronutrients Micronutrients
Nitrogen (N) Boron (B)
Phosphorus (P) Chlorine (Cl)
Potassium (K) Copper (Cu)
Calcium (Ca) Iron (Fe)
Magnesium (Mg) Manganese (Mn)
Sulfur (S) Molybdenum (Mo)
Nickel (Ni)
Zinc (Zn)
By providing all of the essential nutrients to plants, the plant growth is maximized. In
addition to these nutrients, cobalt, selenium, silicon, and sodium also promote plant growth.
However, they are not considered necessary to complete the plant life cycle. Some cannabis
growers choose to apply silicon to their plants to promote overall plant health, but it is not required
(Whipker et al., 2019).
The major component of optimizing plant growth is to provide a proper balance of
nutrients. The proper balance of nutrients will vary depending on the specific growing situation.
Table 3.14 provides general guidelines that have “produced many successful cannabis crops”
(Griffith, 2019). These values assume that there are virtually no nutrients in the potting mix.
Table 3.14. Macronutrient Application
Stage of Life Nitrogen6,7
(ppm-N)
Phosphorus6
(ppm P2O5)
Potassium6
(ppm K2O)
Calcium8
(ppm Ca)
Magnesium8
(ppm Mg)
Seedling/Clone 100 100 100 50 25
Vegetative Growth 200 120 200-250 100-125 50-62.5
Early Bloom 200-250 200-250 200-250 100-125 50-62.5
Late Bloom 100-150 “adequate” 187.5 93.75 46.875
Flush 0 0 0 0 0
6Griffith, 2019. According to Cervantes (2006), nitrogen should be applied in equal amounts or higher to phosphorus
and potassium during the vegetative stage. Cervantes (2006) also states that higher phosphorus quantities are meant
for flowering plants. It was assumed that at minimum the phosphorus levels would need to be equal to the nitrogen
levels. 7Whipker et al. (2019). How to Meet the Nitrogen Needs of Cannabis: Nutrient Matters. 8Whipker et al. (2019). Balancing the Nutrient Equation in Cannabis Cultivation.
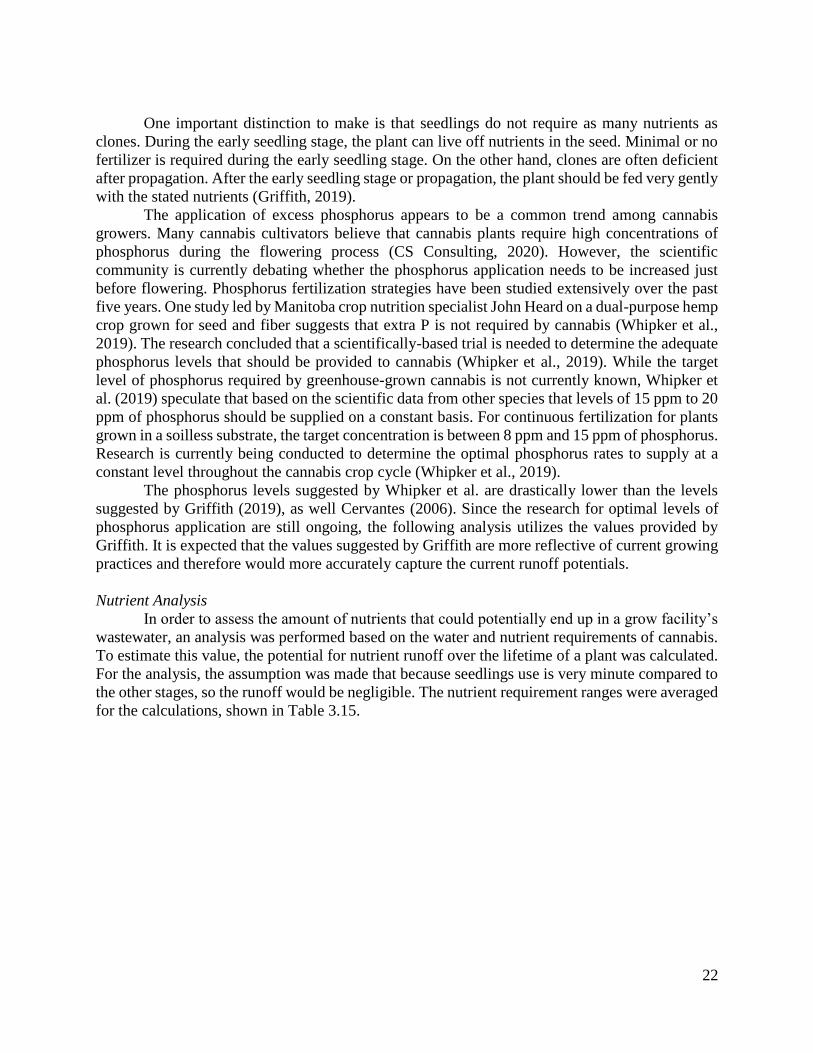
22
One important distinction to make is that seedlings do not require as many nutrients as
clones. During the early seedling stage, the plant can live off nutrients in the seed. Minimal or no
fertilizer is required during the early seedling stage. On the other hand, clones are often deficient
after propagation. After the early seedling stage or propagation, the plant should be fed very gently
with the stated nutrients (Griffith, 2019).
The application of excess phosphorus appears to be a common trend among cannabis
growers. Many cannabis cultivators believe that cannabis plants require high concentrations of
phosphorus during the flowering process (CS Consulting, 2020). However, the scientific
community is currently debating whether the phosphorus application needs to be increased just
before flowering. Phosphorus fertilization strategies have been studied extensively over the past
five years. One study led by Manitoba crop nutrition specialist John Heard on a dual-purpose hemp
crop grown for seed and fiber suggests that extra P is not required by cannabis (Whipker et al.,
2019). The research concluded that a scientifically-based trial is needed to determine the adequate
phosphorus levels that should be provided to cannabis (Whipker et al., 2019). While the target
level of phosphorus required by greenhouse-grown cannabis is not currently known, Whipker et
al. (2019) speculate that based on the scientific data from other species that levels of 15 ppm to 20
ppm of phosphorus should be supplied on a constant basis. For continuous fertilization for plants
grown in a soilless substrate, the target concentration is between 8 ppm and 15 ppm of phosphorus.
Research is currently being conducted to determine the optimal phosphorus rates to supply at a
constant level throughout the cannabis crop cycle (Whipker et al., 2019).
The phosphorus levels suggested by Whipker et al. are drastically lower than the levels
suggested by Griffith (2019), as well Cervantes (2006). Since the research for optimal levels of
phosphorus application are still ongoing, the following analysis utilizes the values provided by
Griffith. It is expected that the values suggested by Griffith are more reflective of current growing
practices and therefore would more accurately capture the current runoff potentials.
Nutrient Analysis
In order to assess the amount of nutrients that could potentially end up in a grow facility’s
wastewater, an analysis was performed based on the water and nutrient requirements of cannabis.
To estimate this value, the potential for nutrient runoff over the lifetime of a plant was calculated.
For the analysis, the assumption was made that because seedlings use is very minute compared to
the other stages, so the runoff would be negligible. The nutrient requirement ranges were averaged
for the calculations, shown in Table 3.15.
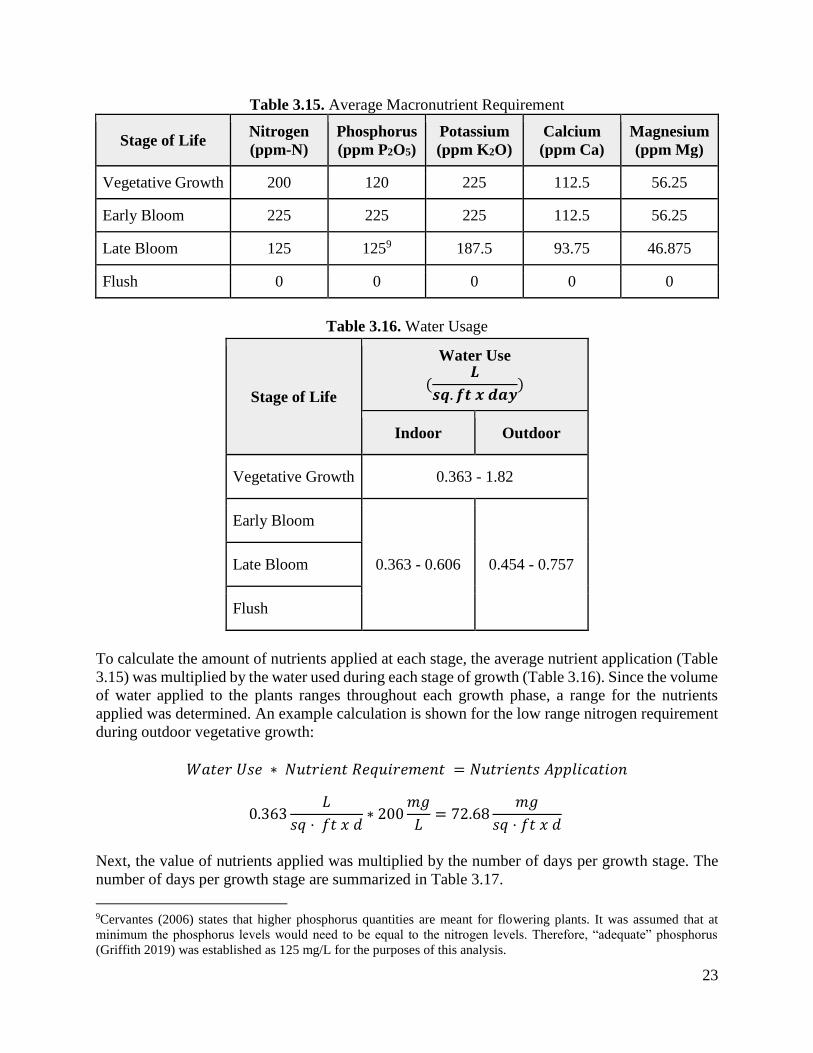
23
Table 3.15. Average Macronutrient Requirement
Stage of Life Nitrogen
(ppm-N)
Phosphorus
(ppm P2O5)
Potassium
(ppm K2O)
Calcium
(ppm Ca)
Magnesium
(ppm Mg)
Vegetative Growth 200 120 225 112.5 56.25
Early Bloom 225 225 225 112.5 56.25
Late Bloom 125 1259 187.5 93.75 46.875
Flush 0 0 0 0 0
Table 3.16. Water Usage
Stage of Life
Water Use
(𝑳
𝒔𝒒. 𝒇𝒕 𝒙 𝒅𝒂𝒚)
Indoor Outdoor
Vegetative Growth 0.363 - 1.82
Early Bloom
0.363 - 0.606 0.454 - 0.757 Late Bloom
Flush
To calculate the amount of nutrients applied at each stage, the average nutrient application (Table
3.15) was multiplied by the water used during each stage of growth (Table 3.16). Since the volume
of water applied to the plants ranges throughout each growth phase, a range for the nutrients
applied was determined. An example calculation is shown for the low range nitrogen requirement
during outdoor vegetative growth:
𝑊𝑎𝑡𝑒𝑟 𝑈𝑠𝑒 ∗ 𝑁𝑢𝑡𝑟𝑖𝑒𝑛𝑡 𝑅𝑒𝑞𝑢𝑖𝑟𝑒𝑚𝑒𝑛𝑡 = 𝑁𝑢𝑡𝑟𝑖𝑒𝑛𝑡𝑠 𝐴𝑝𝑝𝑙𝑖𝑐𝑎𝑡𝑖𝑜𝑛
0.363𝐿
𝑠𝑞 ⋅ 𝑓𝑡 𝑥 𝑑∗ 200
𝑚𝑔
𝐿= 72.68
𝑚𝑔
𝑠𝑞 ⋅ 𝑓𝑡 𝑥 𝑑
Next, the value of nutrients applied was multiplied by the number of days per growth stage. The
number of days per growth stage are summarized in Table 3.17.
9Cervantes (2006) states that higher phosphorus quantities are meant for flowering plants. It was assumed that at
minimum the phosphorus levels would need to be equal to the nitrogen levels. Therefore, “adequate” phosphorus
(Griffith 2019) was established as 125 mg/L for the purposes of this analysis.

24
Table 3.17. Length of Growth Stage
Stage of Life Number of Days
Vegetative Growth 28
Early Bloom 28
Late Bloom 28
Flush 14
Total 98
An example calculation is shown below for the low range nitrogen requirement during outdoor
vegetative growth:
𝑁𝑢𝑡𝑟𝑖𝑒𝑛𝑡𝑠 𝐴𝑝𝑝𝑙𝑖𝑒𝑑 ∗ 𝐷𝑎𝑦𝑠 𝑜𝑓 𝐺𝑟𝑜𝑤𝑡ℎ 𝐶𝑦𝑐𝑙𝑒 = 𝑁𝑢𝑡𝑟𝑖𝑒𝑛𝑡𝑠 𝐴𝑝𝑝𝑙𝑖𝑒𝑑 𝑝𝑒𝑟 𝐺𝑟𝑜𝑤𝑡ℎ 𝑆𝑡𝑎𝑔𝑒
72.68𝑚𝑔
𝑠𝑞 ⋅ 𝑓𝑡 𝑥 𝑑∗ 28 𝑑𝑎𝑦𝑠 = 2,035.4
𝑚𝑔
𝑠𝑞 ⋅ 𝑓𝑡
Using these values for each stage, the total nutrients applied over the lifetime of the plant was
determined. The values for applied nutrients during the vegetative, early bloom, late bloom, and
flush were summed. An example calculation is shown below for the low range nitrogen
requirement during outdoor growth:
2,035.4𝑚𝑔
𝑠𝑞 ⋅ 𝑓𝑡+ 2,861.8
𝑚𝑔
𝑠𝑞 ⋅ 𝑓𝑡+ 1,589.9
𝑚𝑔
𝑠𝑞 ⋅ 𝑓𝑡+ 0.0
𝑚𝑔
𝑠𝑞 ⋅ 𝑓𝑡= 6,486.7
𝑚𝑔
𝑠𝑞 ⋅ 𝑓𝑡
Plants are typically watered so that 10-20% of the water comes out as runoff (Cervantes, 2006;
Botanicare, 2016; Coco, 2018; Haze, n.d.). This means 10-20% of the nutrients applied would
runoff as well. Assuming an average runoff of 15%, the amount of nutrient runoff was calculated.
An example calculation is shown below for the low range nitrogen requirement during outdoor
growth:
𝑇𝑜𝑡𝑎𝑙 𝑁𝑢𝑡𝑟𝑖𝑒𝑛𝑡𝑠 𝐴𝑝𝑝𝑙𝑖𝑒𝑑 ∗ 0.15 = 𝑁𝑢𝑡𝑟𝑖𝑒𝑛𝑡 𝑅𝑢𝑛𝑜𝑓𝑓
6,486.7𝑚𝑔
𝑠𝑞 ⋅ 𝑓𝑡∗ 0.15 = 973.0
𝑚𝑔
𝑠𝑞 ⋅ 𝑓𝑡
The nutrient runoff for outdoor and indoor grow facilities are summarized below in Table 3.18.

25
Table 3.18. Nutrient Runoff
Nutrient Outdoor Runoff
(g/sq.ft)
Indoor Runoff
(g/sq.ft)
Nitrogen 0.97 - 2.64 0.84 - 2.42
Phosphorus 0.68 - 1.74 0.58 - 1.57
Potassium 0.87 - 2.59 0.76 - 2.42
Calcium 0.43 - 1.29 0.38 - 1.20
Magnesium 0.22 - 0.65 0.19 - 0.60
The total nutrient runoff was used two-fold. First, the total runoff over the lifetime of each plant
was calculated. This is an estimate based on an average number of plants per square-foot. Outdoor
grows usually require 2-4 square-feet per plant, so an average of 3 sq.ft per plant was used
(Caulkins et al., 2013). The amount of space per plant is highly variable for indoor grows
depending on growing technique. A value of 1 sq.ft per plant was used (Caulkins et al., 2013). The
results are summarized in Table 3.19.
Table 3.19. Lifetime Requirements
Nutrient Outdoor Runoff
(g/plant)
Indoor Runoff
(g/plant)
Nitrogen 3.89 - 10.56 0.84 - 2.42
Phosphorus 2.70 - 6.94 0.58 - 1.57
Potassium 3.47 - 10.36 0.76 - 2.42
Calcium 1.73 - 5.16 0.38 - 1.20
Magnesium 0.87 - 2.59 0.19 - 0.60
The total runoff was also used to predict the amount of runoff based on the canopy size of a facility.
The canopy size refers to the total size of the grow space within a facility. To determine the
standard canopy sizes, a range of canopy sizes from the Massachusetts Cannabis Control
Commission were used (CCC, 2018). This estimation is calculated in grams per square foot in
order to eliminate the variability in the amount of plants per square foot. The results for outdoor
and indoor grow facilities are summarized in Tables 3.20 and 3.21, respectively.

26
Table 3.20. Outdoor Facility Nutrient Runoff (1 Harvest Cycle)
Canopy
Size
(sq.ft)
Nitrogen
(g/d)
Phosphorus
(g/d)
Potassium
(g/d)
Calcium
(g/d)
Magnesium
(g/d)
5,000 49.6 - 134.7 34.5 - 88.6 44.2 - 132.1 22.0 - 65.8 11.1 - 33.0
10,000 99.3 - 269.3 68.9 - 177.2 88.5 - 264.3 44.1 - 131.6 22.1 - 66.1
20,000 198.6 - 538.6 137.8 - 354.3 177.0 -528.6 88.1 - 263.2 44.2 - 132.1
30,000 297.9 - 807.9 206.8 - 531.5 265.5 - 792.9 132.2 - 394.8 66.4 - 198.2
40,000 397.1 - 1,077.2 275.7 - 708.7 354.0 - 1,057.1 176.3 - 526.4 88.5 - 264.3
50,000 496.4 - 1,346.5 344.6 - 885.8 442.4 - 1,321.4 220.3 - 658.0 110.6 - 330.4
60,000 595.7 - 1,615.8 413.5 - 1,063.0 530.9 - 1,585.7 264.4 - 789.5 132.7 - 396.4
70,000 695.0 - 1,885.1 482.4 - 1,240.1 619.4 - 1,850.0 308.5 - 921.1 154.9 - 462.5
80,000 794.3 - 2,154.4 551.4 - 1,417.3 707.9 - 2,114.3 352.5 - 1,052.7 177.0 - 528.6
90,000 893.6 - 2,423.7 620.3 - 1,594.5 796.4 - 2378.6 396.6 - 1,184.3 199.1 - 594.6
100,000 992.9 - 2,693.0 689.2 - 1,771.6 884.9 - 2,642.9 440.7 - 1,315.9 221.2 - 660.7

27
Table 3.21. Indoor Facility Nutrient Runoff (1 Harvest Cycle)
Canopy
Size
(sq.ft)
Nitrogen
(g/d)
Phosphorus
(g/d)
Potassium
(g/d)
Calcium
(g/d)
Magnesium
(g/d)
5,000 42.8 - 123.3 29.4 - 80.2 38.9 - 123.2 19.4 - 61.4 9.7 - 30.8
10,000 85.7 - 246.6 58.9 - 160.4 77.8 - 246.5 38.7 - 122.7 19.4 - 61.6
20,000 171.3 - 493.2 117.7 - 320.8 155.6 - 492.9 77.5 - 245.4 38.9 - 123.2
30,000 257.0 - 739.8 176.6 - 481.3 233.4 - 739.4 116.2 - 368.1 58.3 - 184.9
40,000 342.6 - 986.4 235.5 - 641.7 311.2 - 985.9 155.0 - 490.9 77.8 - 246.5
50,000 428.3 - 1,233.0 294.4 - 802.1 389.0 - 1,232.4 193.7 - 613.6 97.2 - 308.1
60,000 514.0 - 1,479.6 353.2 - 962.5 466.8 - 1,478.8 232.5 - 736.3 116.7 - 369.7
70,000 599.6 - 1,726.1 412.1 - 1,122.9 544.6 - 1,725.3 271.2 - 859.0 136.1 - 431.3
80,000 685.3 - 1,972.7 471.0 - 1,283.4 622.4 - 1,971.8 309.9 - 981.7 155.6 - 492.9
90,000 770.9 - 2,219.3 529.9 - 1,443.8 700.2 - 2,218.2 348.7 - 1,104.4 175.0 - 554.6
100,000 856.6 - 2,465.9 588.7 - 1,604.2 778.0 - 2,464.7 387.4 - 1,227.2 194.5 - 616.2
It should be noted that Tables 3.20 and 3.21 only account for one harvest cycle. As
mentioned previously in the water consumption analysis, outdoor grow facilities typically have 1-
3 harvest per year and indoor facilities typically have 4-6 (Caulkins et al., 2013).
It is important to quantify the amount of nutrients that may runoff from cannabis facilities
in order to prevent adverse environmental effects such as eutrophication. The current rates of
fertilizer application appear to follow standard fertilization practices used with floriculture
production (Whipker et al., 2019). Therefore, it does not appear that the actual rate of fertilizer
application will be the concern. Rather, the concern will be with how quickly the cannabis industry
scales. Nutrient loadings at WWTPs will be greatly increased if multiple facilities are discharging
to them at once.
Processing There are both water and wastewater concerns specific to the processing of cannabis
products. Cold water extraction is the only extraction process that relies on a large quantity of
water to concentrate trichomes. This is briefly discussed in Chapter 5.
Wastewater Concerns in Extractions
It can be assumed that wastewater from the extraction process would be a main concern
for WWTPs. However, most extractions are required to be closed loop and/or treated a hazardous
waste by state regulations. In closed loop extractions, almost all of the solvent is collected at the
end of the process to be reused. States like California, Colorado, and Washington have regulations

28
that extractions involving the use of volatile organic solvents must be performed in a closed loop
system (Al-Zouabi et al., 2018). Liquid solvents used in extractions such as hexane and ethanol,
are considered hazardous waste due to their flammability and must be disposed of as such (City of
Portland, 2007; EBMUD, n.d.). Assuming the industry is complying with these regulations, this
eliminates the potential wastewater concerns of extraction solvents. Solvents used to the clean
extraction machinery, like isopropyl alcohol, ethanol, and other VOCs, should be diluted and used
according to the label to prevent high concentrations from entering municipal sewers (DEH-
CSWG, 2017).
Wastewater Concerns in Edibles Production
Food service or production involving cannabis usually must meet requirements of food
service establishments. The contaminants of concern are fats, oils, and grease (FOG), BOD, COD,
and TSS. FOG are a main concern of the edibles process. When creating cannabis concentrates
with oils and butter, there is the potential for FOG to be in wastewater. Excessive FOG can cause
serious pipe and sewer blockages and greatly interrupt the wastewater treatment process (City of
Portland, 2007). To mitigate these issues, facilities where foods containing cannabis are cooked,
processed, or prepared are usually required to install a food-related oil and grease interceptor (City
of Portland, 2007; ACRWC, n.d.). The issues with BOD, COD, and TSS are discussed prior.
Recommendations THC in Water
THC (Δ9-tetrahydrocannabinol) is an emerging contaminant of concern with the increased
legalization of cannabis. When cannabis is consumed, the THC is metabolized into THC
carboxylic acid (THC-COOH). THC-COOH is a non-psychoactive metabolite eliminated by the
body in urine and feces that is disposed of via sewers. The THC-COOH ends up at wastewater
treatment facilities where it is ultimately released into freshwater bodies (Sharma, Murthy, &
Bharath, 2012).
The presence of THC and THC-COOH has been shown to affect the health status of
freshwater species. A study by Parolini and Binelli (2014) found that zebra mussels exposed to a
THC concentration of 0.5 μg/L for 14 days exhibited significant oxidative stress. However, it
should be noted that this concentration (0.5 μg/L) is greater than the highest reported THC
concentration detected in sewer water (13.6 ng/L). It is also unlikely that unmetabolized THC
would be found in these high concentrations due to its low solubility in water (Park, Mackie, &
Gagnon, 2017). In another study by Parolini et al. (2017), the results showed that exposure to
increasing concentrations of THC‐COOH could represent a threat for the health status of the zebra
mussel. The study was designed to mimic THC-COOH levels currently found in aquatic
ecosystems and contractions that may be found in the future due to increased cannabis use. The
zebra mussels showed increasing oxidative stress and damage to DNA when exposed to 3
concentrations of THC-COOH (100, 500, and 1000 ng/L) over 14 days (Parolini et al., 2017).
Although many studies have detailed the analysis and detection of THC and THC-COOH in
environmental waters, more studies are needed to determine the risk to aquatic ecosystems and
clarify their true ecological hazard. Furthermore, research into the basic characteristics of THC,
THC-COOH, and other THC metabolites and how they are transformed during water and
wastewater treatment processes are needed (Park, Mackie, & Gagnon, 2017).
Currently, there are no specific regulations regarding THC and its metabolites in drinking
water or effluent wastewater, except indirectly as a part of acute toxicity testing requirements for

29
effluent wastewater (Park, Mackie, & Gagnon, 2017). Once THC and its metabolites are
transported to WWTPs, they are subjected to various physical, chemical, and biological treatment
processes that can remove them to varying extents (Yadav et al., 2017). Removal rates for THC
and THC-OH (another THC metabolite) range from 8% to 100% and 38% to 100%, respectively
(Park, Mackie, & Gagnon, 2017). The removal efficiency of THC-COOH in WWTPs has been
reported to vary between 31% and 98% (Boix et al., 2014). Other reports have summarized THC-
COOH removal rates in the range of -18.3% to 100%. THC-COOH sometimes has a negative
removal rate that may be attributed to desorption from solids during treatment (Park, Mackie, &
Gagnon, 2017). These removal rates may be reduced by increased chemical loads in the raw
wastewater and insufficient hydraulic retention or contact times. They also vary depending on the
technology used, such as trickling filters versus activated-sludge, and how the treatment process
is operated (Yadav et al., 2017). Any remaining THC or THC metabolite is transferred in the final
effluent into a receiving aquatic system, where they can bioaccumulate, affect water quality, or
potentially reach drinking water sources. THC and its metabolites are continuously discharged
from WWTPs (even states where it is not legal, due to medical use or illegal use) into the
environment despite the fact that their effects on human and environmental health are essentially
unknown (Yadav et al., 2017). More research into the treatment methods for the removal of THC
and THC-COOH from wastewater is required.
Reduce Wastewater
Many facilities are not taking advantage of potential sources of reuse water (DEH-CSWG,
2017). When reuse water is captured, it can help save money and energy. There are a variety of
different techniques to reduce a cannabis facility’s water use. Systems can include ones that
capture water from watering the plant and reusing and/or capturing water condensation from the
HVAC system (CCC, 2019).
Depending on the system, the water could be captured through drain pipes and lines,
ditches, dehumidifiers, or condensation recapture modules (CCC, 2019). The effectiveness of drain
pipes and lines or ditches will depend on the cultivation method, as discussed above in the
Cultivation Methods section. Dehumidifiers and condensation recapture modules collect the
condensate water that is generated by a number of processes in a growing facility. These systems
mainly re-condense the humidity produced from transpiration (Hanson, 2018). Often, growers will
not reuse their dehumidifier water because they believe it is not clean. There are concerns with
mold and fungus growing in and around drains, pans, and hoses, as well as concerns about heavy
metals related to the copper tubing and soldered connections in the dehumidifiers (Steffes, 2018).
However, studies have shown that there is no significant difference in plant growth between the
use of recycled water versus the use of freshwater (CCC, 2019). The captured water can also be
filtered and disinfected prior to application to address these concerns.
If the captured water is to be applied to plants, it needs to be treated to prevent the spread
of microbial pathogens and to reduce the amount of ionic and toxic elements that may be present.
Common practices include reverse osmosis and carbon filtration (CCC, 2019). While the main
purpose of reverse osmosis (RO) is to improve the quality of the incoming water, some facilities
have used RO to treat reuse water. RO allows for approximately 97% reuptake, but produces a
brine that is difficult to dispose of (CCC, 2019). The process works the same as when filtering tap
water, as discussed above in the Reverse Osmosis section. Carbon filters are less common in
cannabis facilities (Manke, 2018), but carbon filtration is commonly used in drinking water and
wastewater treatment. During water filtration, contaminants adhere to the activated carbon and
become trapped in the small pores of the filter (Mazille & Spuhler, n.d.). Carbon filters can adsorb

30
relatively small quantities of soluble organics and inorganic compounds such as nitrogen, sulfides,
and heavy metals remaining in the wastewater (EPA, 2000). Unlike RO, carbon filters do not
produce wastewater. However, the filters do need to be replaced periodically.
To ensure that the water does not contain any harmful bacteria, it is important to sanitize
the water before reapplication. There are several sanitation options available, but the operator
should know what they are trying to remove from their irrigation water. The technology should be
able to kill waterborne pathogens such as pythium, phytophthora, fusarium and rhizoctonia (DEH-
CSWG, 2017). Chemicals, such as hydrogen peroxide or iodine, may be added to clean the water
before reapplication to reduce microbe levels (CCC. 2019; Manke, 2018). These chemicals must
not be added in too high of a concentration, otherwise they can be toxic to the cannabis plants
(Manke, 2018). Other sanitation techniques include pasteurization, ozonation, and UV
disinfection. Pasteurization uses high temperatures to kill bacteria in the water. It involves using
heat exchangers to rapidly heat the water (Manke, 2018; Royal Queen Seeds, 2018). Ozonation
involves infusing water with ozone (O3) to kill any contaminants. Ozonation is highly effective,
but it is an expensive process and the equipment can be damaged if the system is not used properly
(Royal Queen Seeds, 2018). UV radiation is a chemical-free disinfection method that exposes the
water to high-intensity UV rays to inactivate bacteria and pathogens (Manke, 2018; Royal Queen
Seeds, 2018).
Facilities may also employ the use of an aerobic treatment unit to reduce chemical and
microbial levels in the returned water to a satisfactory level (CCC, 2019). One Canadian company,
Aurora Cannabis, has set a goal to recycle 90% or more of the water they use. The company has
implemented measures such as water recirculation, rainwater harvesting, and retaining ponds at
several of its sites. In addition, the wastewater is treated onsite with an aerobic waste digester
(Westcott, 2018). The system grinds down the cannabis waste with a blend of microbes and
enzymes that denatures the cannabinoids. As an added benefit, effluent from the system is treated
in order to generate clean, potable water that can be reused in growing operations (Micron Waste
Technologies, n.d.). The use of onsite treatment methods should be encouraged to reduce the
impact of the cannabis industry on wastewater treatment plants.

31
References
Alberta Capital Region Wastewater Commission (ACRWC). (n.d.). Cannabis Wastewater Fact
Sheet. [PDF File]. Retrieved from https://acrwc.ab.ca/wp-content/uploads/2019/04/
Cannabis-Wastewater-Fact-Sheet.pdf
Al-Zouabi, I., Stogner, J. M., Miller, B. L., & Lane, E. S. (2018). Butane hash oil and dabbing:
insights into use, amateur production techniques, and potential harm mitigation.
Substance abuse and rehabilitation, 9, 91.
Arvia Technology. (n.d.). COD Reduction and Removal. Retrieved from
https://www.arviatechnology.com/our-solution/cod-reduction/
Ashworth, K., & Vizuete, W. (2017). High Time to Assess the Environmental Impacts of
Cannabis Cultivation. Environmental Science Technology, 51(5), 2531-2533.
Bauer, S., Olson, J., Cockrill, A., Van Hattem, M., Miller, L., Tauzer, M., & Leppig, G. (2015).
Impacts of surface water diversions for marijuana cultivation on aquatic habitat in four
northwestern California watersheds. PloS one, 10(3).
Boix, C., Ibáñez, M., Bijlsma, L., Sancho, J. V., & Hernández, F. (2014). Investigation of
cannabis biomarkers and transformation products in waters by liquid chromatography
coupled to time of flight and triple quadrupole mass spectrometry. Chemosphere, 99, 64-
71.
Botanicare. (2016). “Feeding and watering frequency: Drain-to-waste setups and coir based
media.” Retrieved from http://blog.botanicare.com/feeding-and-watering-frequency-
drain-to-waste-setups-and-coir-based-media-by-botanicare/
Butsic, V., & Brenner, J. C. (2016). Cannabis (Cannabis sativa or C. indica) agriculture and the
environment: a systematic, spatially-explicit survey and potential impacts. Environmental
Research Letters, 11(4), 044023.
California Council of Land Trusts. (2017). Environmental Impacts of Illegal Marijuana
Cultivation. Conservation Frontiers, vol. 6.1. [PDF File]. Retrieved from
https://www.calandtrusts.org/wp-
content/uploads/2014/03/CCLT_Frontiers6.1.2017final.pdf
California Department of Fish and Wildlife: Habitat Conservation Planning Branch. (2018).
A Review of the Potential Impacts of Cannabis Cultivation on Fish and Wildlife
Resources. Retrieved from
https://nrm.dfg.ca.gov/FileHandler.ashx?DocumentID=160552&inline.

32
California Water Resources Control Board. (2017). Cannabis Cultivation Policy Principles and
Guidelines for Cannabis Cultivation. [PDF File]. Retrieved from
https://www.waterboards.ca.gov/board_decisions/adopted_orders/resolutions/2017/final_
cannabis_policy_with_att_a.pdf
California Water Resources Control Board. (2018). Proposed Updates to the Cannabis
Cultivation Policy Staff Report. [PDF File]. Retrieved from
https://www.waterboards.ca.gov/water_issues/programs/cannabis/docs/staffreport_sept27
2018.pdf
California Water Resources Control Board. (2019). General Waste Discharge Requirements and
Waiver of Waste Discharge Requirements for Discharges of Waste Associated with
Cannabis Cultivation Activities. [PDF File]. Retrieved from
https://www.waterboards.ca.gov/board_decisions/adopted_orders/water_quality/2019/wq
o2019_0001_dwq.pdf
Cannabis Control Commission (CCC). (2018). Guidance on Types of Marijuana Establishment
Licenses. [PDF File]. Retrieved from https://mass-cannabis-control.com/wp-
content/uploads/2018/04/Guidance-License-Types.pdf
Cannabis Control Commission (CCC). (2019). Guidance on Best Management Practices for
Water Use. [PDF File]. Retrieved from https://mass-cannabis-control.com/wp-content/
uploads/2019/04/Guidance-on-Best-Management-Practices-for-Water-Use.pdf
Caulkins, J., Cohen, M., & Zamarra, L. (2013). Estimating Adequate Licensed Square Footage
for Production. [PDF File] Retrieved from https://lcb.wa.gov/publications/Marijuana/
BOTEC%20reports/5a_Cannabis_Yields-Final.pdf
Cervantes, J. (2006). Marijuana Horticulture: The Indoor/Outdoor Medical Grower's Bible.
Van Patten Publishing.
City of Portland. (2007). Environmental Services Regulatory Requirements for the Cannabis
Industry. [PDF File]. Retrieved fromhttps://www.portlandoregon.gov/bes/article/632708
Coco, M. J. (2018). Coco for Cannabis: A Grower's Guide. Green Harvest Press.
CS Consulting. (2020). Marijuana Water Usage, Management & Disposal. Retrieved from
https://www.marijuanapropagation.com/marijuana-water-usage-and-disposal.html
DeLorenzo, M. E., Scott, G. I., & Ross, P. E. (2001). Toxicity of pesticides to aquatic
microorganisms: a review. Environmental Toxicology and Chemistry: An International
Journal, 20(1), 84-98.
Denver Environmental Health Cannabis Sustainability Work Group (DEH-CSWG). (2017).
Cannabis Environmental Best Management Practices Guide Draft 1.0 [PDF File].
Retrieved from

33
https://www.denvergov.org/content/dam/denvergov/Portals/771/documents/EQ/MJ%20S
ustainability/Draft%20Cannabis%20Environmental%20BMP%20Guide.pdf
Desjardins, J. (2018). The Anatomy of a Cannabis Plant, and its Lifecycle. Retrieved from
https://www.visualcapitalist.com/anatomy-cannabis-plant/
Dillis, C., McIntee, C., Grantham, T., Butsic, V., Le, L., & Grady, K. (2019). Water storage and
irrigation practices associated with cannabis production drive seasonal patterns of water
extraction and use in Northern California watersheds. BioRxiv, 618934.
EBMUD. (n.d.). Best Management Practices for Cannabis Facilities. Retrieved from
https://www.ebmud.com/wastewater/commercial-waste/commercial-pollution-
prevention/cannabis-facilities/
Everett, Y. (2018). A Challenge to Socio-Ecological Resilience: Community Based Resource
Management Organizations’ Perceptions and Responses to Cannabis Cultivation in
Northern California. Humboldt Journal of Social Relations, 40, 89-115.
Food and Agriculture Organization of the United Nations. (n.d.) Crop Information: Tobacco.
Retrieved from http://www.fao.org/land-water/databases-and-software/crop-
information/tobacco/ en/
Flo-n-Gro Grow Systems. (2020). Five Methods of Hydroponics. Retrieved from
https://www.flo-n-gro.net/page/five-methods-of-hydroponics/
Fundacion Canna. (n.d.). Pollutants in Cannabis. Retrieved from
https://www.fundacion-canna.es/en/pollutants-in-cannabis
Griffith, L. (2019). Cannabis Fertilization Requirements at Each Stage of Growth. Retrieved
from https://www.cannabisbusinesstimes.com/article/cannabis-fertilization-requirements
-harrells/
Hanson, J. (2018). Cannabis Cultivation: Slash Your Water Use by 50 Percent or More.
Retrieved from https://www.cannabisbusinesstimes.com/article/slash-your-water-use-by-
50-or-more/
Haze, N. (n.d.). How Often to Water Coco Coir. Retrieved from
https://www.growweedeasy.com/how-often-to-water-coco-coir
Kavanagh, R. (2018). Aeroponics for Cannabis: Pros and Cons. Retrieved from
http://cannabizdaily.co/blog/aeroponics-cannabis-pros-cons/
Köck-Schulmeyer, M., Villagrasa, M., de Alda, M. L., Céspedes-Sánchez, R., Ventura, F., &
Barceló, D. (2013). Occurrence and behavior of pesticides in wastewater treatment plants
and their environmental impact. Science of the total environment, 458, 466-476.
34
Kumar, R. R., & Cho, J. Y. (2014). Reuse of hydroponic waste solution. Environmental Science
and Pollution Research, 21(16), 9569-9577.
Manke, E, (2018). Keep Cannabis Green: What To Do With Your Weed Wastewater So It Won’t
Wound The World. Retrieved from https://bigbudsmag.com/how-to-discard- cannabis-
wastewater-in-an-environmentally-frindly-manner/
Mazille, F. & Spuhler, D. (n.d.). Adsorption (Activated Carbon). Retrieved from
https://sswm.info/sswm-university-course/module-6-disaster-situations-planning-and-
preparedness/further-resources-0/adsorption-(activated-carbon)
Micron Waste Technology Inc. (n.d.). Solutions for the Cannabis Industry. Retrieved from
https://micronwaste.com/solutions/cannabis-waste/
Mills, E. (2012). The Carbon Footprint of Indoor Cannabis Production. Energy Policy, 46,
58-67.
Misra, R., Satyanarayan, S., & Potle, N. (2013). Treatment of agrochemical/pesticide wastewater
by coagulation/flocculation process. International Journal of Chemical and Physical
Sciences, 2, 39-51.
Oregon – Idaho High Intensity Drug Trafficking Area (ORIHIDTA). (2018). An Initial
Assessment of Cannabis Production, Distribution, and Consumption in Oregon 2018 - An
Insight Report. Retrieved from http://oridhidta.org/cannabis-production-distribution-
consumption-assessment.
Park, Y. R., Mackie, A. L., & Gagnon, G. A. (2017). A critical review of the occurrence,
detection, and treatment of [[DELTA]. sup. 9]-tetrahydrocannabinol in aquatic
environments. Environmental Reviews, 25(3), 255-269.
Parolini, M., & Binelli, A. (2014). Oxidative and genetic responses induced by
Δ-9-tetrahydrocannabinol (Δ-9-THC) to Dreissena polymorpha. Science of the total
environment, 468, 68-76.
Parolini, M., Castiglioni, S., Magni, S., Della Torre, C., & Binelli, A. (2017). Increase in
cannabis use may indirectly affect the health status of a freshwater species.
Environmental toxicology and chemistry, 36(2), 472-479.
Royal Queen Seeds. (2017). Drip Irrigation With Cannabis Cultivation. Retrieved from
https://www.royalqueenseeds.com/blog-drip-irrigation-with-cannabis-cultivation-n724
Royal Queen Seeds. (2017). The Flowering Stage Of Cannabis Week By Week. Retrieved from
https://www.royalqueenseeds.com/blog-the-flowering-stage-of-cannabis-week-by-week-
n611

35
Royal Queen Seeds. (2018). How To Clean And Reuse The Water From Your Hydroponic
System. Retrieved from https://www.royalqueenseeds.com/blog-how-to-clean-and-
reuse-the-water-from-your-hydroponic-system-n1030
Royal Queen Seeds. (2018). The Many Benefits Of The Nutrient Film Technique. Retrieved
from https://www.royalqueenseeds.com/blog-the-many-benefits-of-the-nutrient-film-
technique-n1038
Royal Queen Seeds. (n.d.). Chronology of cannabis cultivation. Retrieved from
https://www.royalqueenseeds.cat/content/143-the-cannabis-cultivation-timeline
Ryan, J. (2019). 10 Cannabis Harvesting and Post-Harvest Tips. Retrieved from
https://www.cannabisbusinesstimes.com/article/10-harvesting-and-post-harvest-tips/
Sawyer, J. O., & Keeler-Wolf, T. (1995). A manual of California vegetation.
Sharma, P., Murthy, P., & Bharath, M. S. (2012). Chemistry, metabolism, and toxicology of
cannabis: clinical implications. Iranian Journal of Psychiatry, 7(4), 149.
Steffes, M. (2018). Don’t waste a renewable water source. Retrieved from
https://www.marijuanaventure.com/dont-waste-a-renewable-water-source/
Surna Technology. (2018). Water and Cannabis: Use, Waste and Conservation. [PDF File].
Retrieved from https://www.green-technology.org/gcsummit18/images/Water-
Cannabis.pdf
Tchobanoglous, G., Burton, F. L., Tsuchihashi, R., Stensel, H. D., & Metcalf & Eddy, Inc.
(2013). Wastewater Engineering: Treatment and Resource Recovery. (5th ed.). McGraw-
Hill Education.
Tomoski, M. (2019). What is Hydroponic Weed? The Pros and Cons of Hydroponics vs. Soil.
Retrieved from https://herb.co/learn/what-is-hydroponic-weed/
United States Department of Justice National Drug Intelligence Center (2007). “Domestic
Cannabis Cultivation.” [PDF File]. Retrieved from
https://www.justice.gov/archive/ndic/pubs22/22486/22486p.pdf
United States Environmental Protection Agency (EPA). (2000). Wastewater Technology Fact
Sheet Granular Activated Carbon Adsorption and Regeneration.” [PDF File]. Retrieved
from https://www3.epa.gov/npdes/pubs/carbon_absorption.pdf
United States Environmental Protection Agency (EPA). (2002). Particulate Matter Controls:
Chapter 2 Wet Scrubbers for Particulate Matter. [PDF File]. Retrieved from
https://www3.epa.gov/ttncatc1/cica/Files/cs6ch2.pdf

36
United States Environmental Protection Agency (EPA). (2006). Final Engineering Report:
Tobacco Products Processing Detailed Study. [PDF File]. Retrieved from
https://www.epa.gov/sites/production/Files/2015-09/documents/tobacco-products-
processing-study_2006.pdf
United States Environmental Protection Agency (EPA). (2018). Basic Information about
Nonpoint Source (NPS) Pollution. Retrieved from https://www.epa.gov/nps/basic-
information-about-nonpoint-source-nps-pollution
Westcott, T. (2018). Cannabis Legalization Spurs a Need for Targeted Wastewater Treatment.
Retrieved from https://www.watercanada.net/feature/cannabis-legalization-spurs-a-need-
for-targeted-wastewater-treatment/
Whipker, B., Cockson, P., Veazie P., Smith, J. T., Landis, H. (2019). Balancing the Nutrient
Equation in Cannabis Cultivation. Retrieved from
https://www.cannabisbusinesstimes.com/article/balancing-the-nutrient-equation-
cannabis-cultivation/
Whipker, B., Smith, J. T., Cockson, P., & Landis, H. (2019). How to Meet the Nitrogen Needs
of Cannabis: Nutrient Matters. Retrieved from
https://www.cannabisbusinesstimes.com/article/yellowing-leaves/
Woodard & Curran, Inc. (2006). Waste Characterization. Industrial Waste Treatment Handbook
(2nd ed.).
Worms, B. (2019). Pros and cons of drip irrigation for cannabis growing. Retrieved from
https://www.dinafem.org/en/blog/pros-cons-drip-irrigation-cannabis-growing/
Yadav, M. K., Short, M. D., Aryal, R., Gerber, C., van den Akker, B., & Saint, C. P. (2017).
Occurrence of illicit drugs in water and wastewater and their removal during wastewater
treatment. Water research, 124, 713-727.
Youngblood, T. (2017). Aeroponics 101. Retrieved from https://www.cannabistech.com/
articles/aeroponics-101/

37
Chapter 4: Pesticides
Introduction The term pesticide covers a wide range of compounds. They can be classified by eight
major groups based on use against specific pests: insecticides, fungicides, herbicides, rodenticides,
plant growth regulators, acaricides, molluscicides, and nematocides (Birkett & Taylor, 2019; EPA,
2014). There are many benefits and consequences of using pesticides. The benefits include
increased crop production, decreased crop cost, and disease control. Some of the drawbacks
include the potential for contamination of soil, groundwater, surface water, and air, as well as
possible human health risks and decline of non-target species (Aktar, Sengupta, & Chowdhury,
2009).
Pesticides are regulated by the EPA under the Federal Insecticide, Fungicide, and
Rodenticide Act (FIFRA) and the Federal Food, Drug, and Cosmetic Act (FFDCA). FIFRA
requires that all pesticides sold or distributed in the United States be registered by the EPA. To
register a pesticide, the EPA examines the ingredients, the site or crop where it will be used, the
amount, frequency, and timing of its use, and the storage and disposal practices. The evaluation
also includes an assessment of a variety of potential human health and environmental effects
associated with the pesticide. FFDCA requires the EPA to set pesticide tolerances for all pesticides
used in or on food or in a manner that will result in a residue in or on food or animal feed. A
tolerance is the maximum permissible level for pesticide residues allowed in or on human food
and animal feed (EPA, 2019). The pesticide tolerances are established by the EPA and enforced
by the Food and Drug Administration (FDA).
Since cannabis is not a legal agricultural crop under federal law, the EPA has not evaluated
the safety of any pesticide on cannabis plants. Therefore, there are no established tolerances or
exemptions from tolerances for pesticide residue on cannabis. The use of a pesticide not registered
by the EPA is illegal. Therefore, without federal regulations to govern pesticide use in cannabis
production, the use of pesticides on cannabis plants is technically illegal (Beyond Pesticides,
2019).
Under FIFRA, states have the broad authority to regulate pesticides. However, it is
unlawful for States to “impose or continue in effect any requirements for labeling of packaging in
addition to or different from those required under FIFRA” (7 U.S.C. §136 v(b)). Due to this law,
pesticide regulations and tolerances vary from state to state. Some states prohibit the use of all
federally registered pesticides on cannabis. Other states have no pesticide regulations because a
state regulation would be arbitrary since registered pesticide use on cannabis is illegal (Beyond
Pesticides, 2019).
Current Pesticide Use
Of the states that have legalized recreational cannabis, none have established the same
pesticide restrictions. Even in neighboring states, consumers may experience dramatically
different levels of protection. For example, Oregon requires testing for a different set of pesticides
and enforces different limits for residue levels on cannabis products than California. In some cases,
Oregon’s limits are stricter than California’s and they are more lenient in others (Seltenrich, 2019).
In Washington, the state regulations prohibit the use of certain pesticides on cannabis, but pesticide
testing is not required for recreational cannabis (Beadle, 2019; Seltenrich, 2019).
In this chapter, two groups of pesticides were analyzed: restricted pesticides and
unrestricted pesticides. The pesticides categorized as “restricted” were retrieved from the
38
California Department of Pesticide Regulation’s Category II pesticides list. The pesticides
categorized as “unrestricted” were selected by combining the allowable pesticides lists from
California and Colorado. The reasoning for each selection and categorization are explained in the
respective sections.
Restricted Pesticides
The first list that was analyzed is California’s list of Category II pesticides. California’s
pesticide regulations are considered the strictest in the United States. This can be attributed to
California’s Department of Pesticide Regulation (DPR), which has significant expertise in
toxicology and human-health risk assessment (Seltenrich, 2019). Since no pesticides are federally
registered for use on cannabis, California law states that a pesticide can be used on cannabis only
if meets two specific criteria: (1) the active ingredients found in the product are exempt from
residue tolerance requirements and (2) the product is either exempt from registration requirements
or registered for a use that’s broad enough to include use on cannabis (CDPR, n.d.).
The DPR acknowledged that many pesticides that do not satisfy the criteria stated above
would be present in detectable levels in final cannabis products. Because of this, the DPR
established appropriate residue limits, rather than ban the complete presence of these pesticides on
final products. The DPR established these limits by first compiling a list of commonly used
pesticides by growers in other states, like Colorado and Washington, which could be tested for in
third-party laboratories. Based on these consultations, the DPR created a list of 66 pesticides that
pose a risk to the environment or human health and could be used on cannabis, but do not meet
California’s standards for allowable use on cannabis. A list of 66 pesticides was established.
Twenty-one of these pesticides are classified as Category I and are outright banned because they
are banned federally or pose significant risk to the environment or human health (Seltenrich, 2019).
These pesticides may not be present at any residue concentration. The other 45 pesticides are
classified as Category II pesticides. Category II pesticides are on California’s Groundwater
Protection List (3CCR section 6800) or are considered a restricted use material federally and/or in
California (California Cannabis Cultivation, n.d.). The DPR established separate action levels for
both ingestible and inhalable products for these pesticides (Seltenrich, 2019). Despite the fact that
these 45 pesticides are not allowed to be used on cannabis because they do not meet California
regulations, “a grower may still be able to apply these pesticides under certain conditions,”
according to David Chen, lab director at Sonoma Lab Works (Seltenrich, 2019). As long as
residues do not exceed the limit, the product is considered safe enough for sale (Seltenrich, 2019).
Unrestricted Pesticides
The unrestricted pesticide list is an amalgamation of pesticides allowed in California and
Colorado. Because they were one of the first states to legalize cannabis, Colorado has been
developing regulations for the industry the longest. The Colorado Department of Agriculture
(CDA) determined which pesticides may be used on cannabis based on three principles. The first
two principles are the same basis California uses to select pesticides, however, the third principle
is based on which pesticides are legal for use on tobacco. The CDA acknowledged that cannabis
is typically smoked, whereas the products the pesticides and tolerances were set for are not.
Because of this, “any pesticide product allowed for use on cannabis must also have active
ingredients that are allowed for use on tobacco to ensure EPA has considered use on commodities
intended to be smoked in their risk assessment,” (CDA, n.d.). Colorado’s list has 74 different active
ingredients and California’s list has 37, 31 of which overlapped between the two states (Appendix

39
A). This provided a list of 80 pesticides to review (74 on Colorado’s list in addition to the 6 on
California’s list that were not on Colorado’s list). Of the 80, 11 were identified as having possible
risk to human or environmental health if used improperly, shown below in Table 4.1 with their
GHS Hazard Statements.
Table 4.1. Pesticides with Possible Harmful Effects
Pesticide/Pesticide Synergist GHS Hazard
Ammonium Nonanoate Moderately toxic to aquatic ecosystems
Azadirachtin Very toxic to aquatic ecosystems and bees
Mono- and Dibasic Sodium, Potassium,
and Ammonium Phosphates Toxic to aquatic invertebrates
Piperonyl Butoxide10 Moderately toxic to fish; Moderately to
highly toxic to aquatic invertebrates
Potassium Laurate Toxic to aquatic invertebrates
Pyrethrins10 Highly toxic to bees; Highly to very highly
toxic to fish
Rhamnolipid Biosurfactant Toxic to aquatic invertebrates and bees
Sodium Lauryl Sulfate Mildly to moderately toxic to aquatic
ecosystems
Environmental Fate and Transportation
Before allowing a pesticide product to be sold on the market, the EPA ensures that the
pesticide will not pose any unreasonable risks to wildlife and the environment. An ecological risk
assessment is performed to determine what risks are posed by a pesticide and whether changes to
the use or proposed use are necessary to protect the environment (EPA, 2019a). As part of an
ecological risk assessment, the EPA considers the interaction of a pesticide with soils, air, sunlight,
surface water, and groundwater. The EPA needs to know how the pesticide breaks down in water,
soil, and light, how easily it evaporates in air, and how quickly it travels through soil. Important
parameters to consider are how fast and by what means does a pesticide degrade, what are the
breakdown chemicals, and how much of a pesticide or its breakdown chemicals will travel from
the application site, and where will they accumulate in the environment (EPA, 2019a).
The transportation and fate of a pesticide includes how a pesticide is transported,
transferred, or transformed in the environment. Transport involves the different mechanisms by
which the pesticide moves, including diffusion or advection. Pesticides can transfer from one
medium or storage site through a number of mechanisms, including sorption on soil. Pesticides
10These compounds were listed on Colorado’s Allowable Pesticide List and were listed on California’s Category II
Restricted Pesticide List. They were included here due to their toxicity and inconsistency in categorization between
the two states.

40
can transform into other contaminants under different environmental conditions. A pesticide may
break down into CO2 and water or may degrade in products that are more toxic than the original
chemical (LaGrega et al., 2010). Once a pesticide is applied, it can meet a variety of fates.
Pesticides may be volatilized into the atmosphere, carried away into surface waters by runoff, or
leach into groundwater. Pesticides may also be taken up by plants or break down in the soil.
The physical and chemical properties of a pesticide determines how it will interact in the
environment. These properties control how the pesticide moves in the environment and how
effectively it can be removed by various methods (LaGrega et al., 2010). The transportation and
fate of a pesticide is dependent on various factors, including the pesticide’s properties, the soil
properties, climate conditions, and management practices. Once a pesticide is applied, it can meet
a variety of fates, as summarized in Figure 4.1.
Figure 4.1. Pesticides in the Environment.
Soil Half-Life
The ability of a pesticide to remain present and active before degrading is called
persistence. A pesticide’s persistence is quantified by its half-life. A half-life is the time it takes
an amount of pesticide to reduce by half. The longer a pesticide’s half-life, the more persistent it
is. If a persistent pesticide is applied to or spilled on soil, plants, or other surfaces, it can later harm
the environment, including humans. They can also drift, leach, or runoff and contaminate other
soils, surface water bodies, and groundwater. Since persistent pesticides do not break down
quickly, they can remain on crops, resulting in the presence of illegal residue levels (Fishel, 2017).
The half-life of a pesticide is important because it characterizes the degradation process of
that pesticide. Degradation processes break down pesticide compounds into simpler and often less-
toxic chemicals (Fishel, 2017). Each pesticide can have many half-lives depending on the
conditions in the environment. Pesticides can break down at different rates in soil, in water, on
plants, and indoors. Environmental factors such as sunlight, temperature, oxygen, soil type, soil
acidity, and microbe activity also affect the half-life. Since environmental conditions can change

41
over time, it is impossible to establish a single, consistent half-life for pesticide. Therefore,
pesticide half-lives are often given as a range. They are grouped into three groups in order to
estimate persistence (Hanson et al., 2015). The ranges are shown below in Table 4.2.
Table 4.2. Half Life Rankings (Hanson et al., 2015).
Persistence Soil Half-Life (days)
Low Less than 16
Moderate 16 to 59
High Greater than 60
The excessive application of pesticides has the potential for land degradation. Pesticides
with a longer half-life are more likely to degrade soil. Pesticides can damage the biomass and
microorganisms living in the soil, such as bacteria, fungi, and earthworms. These microorganisms
are an important component of soil health (Joko et al., 2017). Furthermore, pesticides with a longer
half-life are more likely to contaminate groundwater. If the pesticide does not readily degrade and
moves freely with water, it can move downward through the soil. Since it does not degrade quickly,
its likelihood of reaching groundwater is much higher than a pesticide that moves freely with water
but degrades quickly. This scenario can be thought of as a race in time between their degradation
into nontoxic by-products and their leaching into groundwater (Trautmann et al., 1989).
The soil half-life of a pesticide is greatly dependent on the type and conditions of soil,
therefore the soil half-life is not as straightforward as other parameters. It can be difficult to
estimate a value for the half-life due to the variability of soil conditions, including, pH, microbe
populations, and several other factors (Harper et al., 2009). These factors range greatly between
soil type and conditions (i.e. sandy loam, silty clay soil). For example, studies exploring the soil
half-life of the pesticide diazinon, calculated a soil half-life of 21 to 103 days depending on the
type of soil. Other studies showed half-lives of 1-5 weeks in non-sterile soils, and 6-12 weeks in
sterile soils. Other research estimated the half-life of diazinon in sandy loam soils to be 37 days at
pH 5.4 and 39 days at pH 7.8 (Harper et al., 2009).
Water Solubility
Solubility is the degree to which one substance, a solute (i.e. a pesticide), will dissolve into
another, a solvent (i.e. water). The solubility of a pesticide in water is dependent on temperature
and the particular pesticide (LaGrega, 2001). Pesticides that are highly soluble are more likely to
be absorbed by the roots of plants. However, highly soluble pesticides dissolve in water more
easily, making it more likely that the pesticide will move in surface runoff or move through the
soil in water (Fishel, 2017).
Runoff occurs when irrigation, rain, or snow melt adds water to a surface faster than it can
enter the soil. Pesticide movement in runoff occurs when a soluble or insoluble pesticide moves
from the application site across the surface. It may be either dissolved or suspended in runoff
waters that often enters surface water bodies such as canals, streams, rivers, and lakes (Gardner,

42
n.d.). Leaching to groundwater occurs when soluble pesticides move downward through the soil
to the groundwater. The more soluble a pesticide is, the more readily it will leach into groundwater
(Gardner, n.d.). Often, groundwater contamination lasts for years and can be extremely difficult to
clean up. Pesticide degradation in groundwater occurs more slowly than at the soil surface due to
cold temperatures and low microbial activity. Groundwater also moves slowly, meaning it can take
decades for the contaminated water to flow beyond the affected wells or aquifers (Trautmann et
al., 1989).
Pesticide solubility is measured as the mass of pesticide that will dissolve in one liter of
water (mg/L). The water solubility of pesticides can be categorized into three groups: low,
moderate, and high (Ney, 1995). The ranges are shown below in Table 4.3.
Table 4.3. Solubility in Water (Ney, 1995).
Category Solubility (mg/L or ppm)
Low Less than 10
Moderate 10 to 1,000
High Greater than 1,000
Vapor Pressure
Volatility is the tendency of a pesticide to evaporate. The potential for a pesticide to
volatilize is measured by its vapor pressure. The higher the vapor pressure, the more volatile a
pesticide is (Fishel, 2017). A pesticide’s vapor pressure can be used to predict if the pesticide will
volatilize, how long it will stay in water, on plants, and in soil, how much of the pesticide will
enter the air, and whether people and animals are at risk of breathing in the pesticide (Hanson et
al., 2016). When a pesticide volatizes, it can be carried off-site by the wind and settle in unintended
areas (Fishel, 2017).
This can be an issue for outdoor cannabis growers. In large agricultural areas, such as
California, pesticides can easily drift from one farm to another. Therefore, if a neighboring farm
is using pesticides, an outdoor cannabis crop can become contaminated with pesticides the
cannabis grower never applied. Sometimes, the contamination levels are at high enough levels that
a cannabis crop will fail residue testing. One solution to this issue is to move cannabis cultivation
indoors to avoid incidental pesticide contamination. In Canada, legal cannabis comes solely from
greenhouse and indoor growers, due to its zero-tolerance policy on pesticide residues. However,
indoor cannabis cultivation requires more energy and water consumption than outdoor cultivation.
It should be noted that outdoor cultivation is legal in Canada, but the government has yet to approve
any outdoor cultivation projects (Seltenrich, 2019). While indoor cultivation would reduce the
environmental impacts of pesticides, air controls would need to be installed to protect the indoor
growers.
The vapor pressure of a pesticide is affected by various environmental conditions.
Temperature, wind conditions, humidity, and soil type each affect volatility. Of these, temperature
can have the largest effect In general, pesticides have a lower vapor pressure at lower temperatures,

43
and vice versa (Hanson et al., 2016). If the vapor pressure of a pesticide is known, it is easier to
predict how it will act indoors and outdoors. This can help lower risk to people and the
environment. For example, plastic row covers could be used to prevent a highly volatile pesticide
from escaping the soil and drifting to nearby areas. If a highly volatile pesticide is used indoors,
the employees can wear respirators and other protective equipment (Hanson et al., 2016). The
volatility of a pesticide can be categorized into three groups: nonvolatile, low, and intermediate to
high (EPA, 2019b). The ranges are shown below in Table 4.4.
Table 4.4. Vapor Pressure Ranges (EPA, 2019b).
Category Vapor Pressure (atm)
Nonvolatile ≤ 1.32 x 10⁻⁹
Low Volatility 1.32 x 10⁻⁹ - 5.13 x 10⁻⁸
Intermediate to
High Volatility ≥ 5.13 x 10⁻⁸
Partition Coefficients
Partition coefficients are empirically derived constants that describe how a chemical
distributes itself between two phases. They are expressed as a concentration ratio, assuming that
dissolution is the only interaction between the two phases. Partition coefficients are used to
describe the environmental fate of organic compounds, particular regarding the sorption of
organics in the subsurface. Sorption is the process by which a component (a pesticide) moves from
one phase to another across a boundary (LaGrega et al., 2010).
Octanol-water Partition Coefficient (KOW)
The octanol-water partition coefficient (Kow) is the ratio of a pesticide’s concentration in
the octanol phase to its concentration in the aqueous phase. Kow is a dimensionless constant. It
provides an indication of how much of a pesticide will be taken up by aquatic organisms. Kow is
also related to the soil adsorption coefficients and the water solubility (LaGrega et al., 2010).
Values of Kow can range from 10-3 to 107 and are often reported as log Kow, which can
range from -3 to 7. Pesticides with high values of Kow tend to be hydrophobic and are more likely
to sorb. Pesticides with low values of Kow tend to be hydrophilic. Hydrophilic pesticides are less
likely to sorb, remain in the aqueous phase, and are generally more mobile in the environment
(LaGrega et al., 2010).
Sorption Coefficients (KSW and KOC)
The physical binding of pesticide molecules to soil particles is called adsorption. The
stronger a pesticide bonds to the soil, the less likely it is to leach or runoff. The strength of these
bonds depends on the pesticide’s chemical properties, the pesticide concentration in the soil water,
the soil pH, and the composition of the soil. For example, the more clay particles and organic
matter that are in the soil, the more the pesticide is held by the soil and becomes immobile. A

44
strongly adsorbed pesticide will not leach or move unless the soil particles which they are bonded
to move, usually due to erosion. The longer the pesticide molecules are held, the more likely that
microbiological degradation will occur, which reduces the risk of leaching and runoff (Gardner,
n.d.).
The soil-water partition coefficient (Ksw) is the tendency of a pesticide to be adsorbed by
soil or sediment in an aqueous suspension. Pesticides with high values of Ksw tend to adsorb to
soil. Pesticides with low values of Ksw tend to stay in solution (LaGrega et al., 2010). Almost all
of the sorption of a pesticide by a soil is due to the organic carbon component of the soil. The
organic carbon partition coefficient (Koc) is the ratio of the concentration of pesticide in organic
carbon component of soil to the concentration of pesticide in water (LaGrega et al., 2010). Ksw is
estimated by multiplying Koc by the fraction of organic carbon in the soil.
Ksw and Koc are commonly used to model the fate and transport of chemicals in rivers,
stormwater runoff, and soil/groundwater transport. The values of Ksw and Koc are relatively
independent of soil type, but can vary greatly depending on other environmental factors.
Temperature, pH, particle size distribution and surface area, salinity, and the presence of dissolved
organic matter or suspended particulate matter can all influence Ksw and Koc values (LaGrega et
al., 2010).
Best Management Practices
States have established best management practices (BMPs) to ensure the proper use and
control of pesticides. The Central Valley Regional Water Quality Control Board issued best
management practices for the application of pesticides in general agricultural facilities. To avoid
surface and groundwater contamination, these BMPs recommend the mixing and loading of
pesticides take place, “more than 50 feet away from any wells, streams, canals, irrigation ditches,
riparian areas or sinkholes, and more than 200 feet away from any potable water supply wells”
(Zhang & Goodhue, 2010). Mixing and loading should also take place on a containment pad, which
is a concrete slab that drains to a central sump. If this type of structure is unable to be constructed,
mixing and loading pesticides should be conducted on a tilled site, rather than hard packed or
paved, where runoff can occur. In addition, sites should be rotated in order to prevent concentrating
pesticide runoff in one location.
These BMPs also include recommendations to properly time the application of pesticides.
By timing the application of pesticides to not coincide with a rainfall or irrigation event, the risk
of runoff or leaching can be mitigated. However, this may not apply to pesticides with long half-
lives (Zhang & Goodhue, 2010). Furthermore, the wind speed is another important consideration
to take into account when applying pesticides. It is recommended that pesticides be applied at wind
speeds of 2 to 10 mph. At wind speeds less than 2 mph, small droplets may remain suspended in
the air and be carried offsite. At wind speeds above 10 mph, small droplets of pesticides may be
carried long distances (Zhang & Goodhue, 2010).
Certain equipment can also alleviate the transportation of pesticides. Certain sprayer and
nozzle designs can provide a more targeted approach to prevent pesticides from being caught in a
wind gust. Nozzles can be selected to produce large or small droplets; it is generally thought that
although large droplets fall straight down rather than drift, they are less effective and might require
higher doses (Zhang & Goodhue, 2010). Protective equipment and clothing may also be utilized
to ensure worker safety and equipment should be checked regularly to check for leaks.
These management practices also include recommendations on proper storage, disposal,
and more application techniques for pesticides. These recommendations are generally accepted

45
standards that agricultural facilities should follow. In most cases, when best management practices
are followed, the harmful effects of certain pesticides can be greatly mitigated. For example, the
pesticide and the synergist, pyrethrins and piperonyl butoxide, are used in various states including
Massachusetts and California for mosquito control (Orth, 2019; CDPH, 2014).
States like Massachusetts and Colorado have issued BMPs specifically for pesticide use in
cannabis cultivation facilities. These BMPs encourage the use of Integrated Pest Management
(IPM) to avoid the use of pesticides altogether. This will be discussed in the Recommendations
section.
Health Concerns The health concerns associated with pesticide use on cannabis result from the gap in
regulations between the EPA and state governments. These concerns are related to the
consumption of cannabis, through smoking and extracts, and the safety of the facility workers.
Smoking
The health hazard created when cannabis with pesticide residue is burned is one of the
largest health concerns associated with cannabis consumption. When smoked, the pesticide residue
directly reaches the bloodstream through lung gas exchange, which results in a much higher
bioavailability than if the product was ingested orally (Taylor & Birkett, 2019). Additionally,
cannabis smokers have a much higher risk of inhaling smoke contaminated with pesticides and
plant growth regulators than tobacco smokers. Common cannabis smoking methods, such as bongs
and joints, do not have included filters like most cigarettes. The exact health impacts of inhaling
pesticides are unknown (Seltenrich, 2019).
A study was conducted in 2013 that measured the pesticide residue in the smoke from cannabis
contaminated with insecticides, bifenthrin, diazinon, and permethrin, and paclobutrazol, a plant
growth regulator (Sullivan et al., 2013). The study found that 60% to 70% of the residue was
recovered in the smoke condensate of water pipes and glass pipes (Sullivan et al., 2013). These
devices did not include a cotton filter. When the smoking device had an incorporated filter, the
pesticide recovery in the smoke was much lower at 10% to 13% (Sullivan et al., 2013).
The compounds that pesticides break down into when burned are also largely unknown
(Seltenrich, 2019). It is reported that the metabolites of many pesticides are more toxic than their
parent compounds and it is unknown how they may react with each other (Taylor & Birkett, 2019).
For example, the fungicide myclobutanil breaks down into hydrogen cyanide when heated.
Hydrogen cyanide is associated with neurological, respiratory, cardiovascular, and thyroid
problems (Craven et al., 2019). Additionally, it is unknown how pesticides react with the terpenes
and cannabinoids in the matrix structure of cannabis (Taylor & Birkett, 2019).
The problem of pesticide residues on cannabis is similar to the problem of pesticide
residues on tobacco, since both plants are consumed but are not considered a food crop. Because
tobacco is not a food crop, the EPA has not set tolerances for the residue levels (Sullivan et al.,
2013). Additionally, there have been actions taken to prevent overtreatment to reduce the exposure
of tobacco consumers to high residue levels, but they are not federally enforced (Sullivan et al.,
2013). It can be assumed that when cannabis is federally legal, the same problem with pesticides
will occur. However, cannabis consumers will be at a higher risk than tobacco smokers, since most
cannabis is smoked without filters. This problem may be corrected by a stronger set of regulations
for products that are not classified as food but are still consumed.

46
Extractions
There is scarce information about how pesticide residues are altered during the extraction
process (Stone, 2014). It may result in decomposition or increased bioavailability of the
compounds. Based on current research, it may be expected that lipophilic compounds remain in
oil-based extraction products, posing a risk to consumers (Stone, 2014).
Worker Safety
Workers at cannabis growing facilities mainly face hazards related to inhalation and dermal
contact exposure, although ingestion is a risk as well. Workers can be exposed during spills, mixing
and loading the chemicals, misapplication, and entering treated areas (Stone, 2014). A study
conducted in Oregon found that pesticide residue levels on cannabis products were so high that
the proper safety pesticide practices were not followed (Evoy & Kincl, 2019). This means that
pesticide label laws were not followed, and may indicate that workers are involved in the use of
restricted-use pesticides without knowing the laws for safe pesticide application (Evoy & Kincl,
2019). Another study in Colorado found that 35% of the workers experienced “adverse health
symptoms” after handling pesticides (Walters et al., 2018). These examples suggest a need for
more research into proper pesticide use and practices to protect the safety of workers.
Recommendations Tobacco’s Pesticide Regulations
Many researchers and regulators are looking to the tobacco industry for guidance on how
to regulate cannabis. In theory this would be the appropriate method of regulating pesticides for
cannabis, however, there are major issues with tobacco pesticide regulations. Tobacco regulations
were determined based on a report by the U.S. General Accounting Office (GAO) which included
an analysis by the EPA (GAO, 2003). The EPA concluded that pesticide residues declined on
tobacco as it was stored, cured, manufactured, and burned (Stone, 2014). The report also includes
pyrolysis studies conducted by manufacturers that determined how much residue was collected
from combustion smoke (Stone, 2014). The EPA determined these values were low enough to not
warrant tolerance levels, since they did not cause short-term health concerns (Stone, 2014). While
the EPA regulates the specific pesticides that may be used on tobacco crops, it does regulate
pesticide residues on tobacco (GAO, 2003). However, pesticide residues are regulated by the U.S.
Department of Agriculture (USDA). Under the Dairy and Tobacco Adjustment Act, the USDA
tests imported and domestic tobacco for residues of pesticides not approved by EPA for use on
tobacco that federal officials believe are used in other countries (GAO, 2003).
Based on cannabis research, pesticide residues are much higher in concentration in
cannabis smoke than tobacco smoke (Sullivan et al., 2013). As stated previously, this is of major
concern considering very little is known about how pesticides transform when burned and cannabis
users inhale greater amounts of smoke than tobacco users (Sullivan et al., 2013). Cannabis
regulations should not be strictly modeled after tobacco regulations due to the different concerns
associated with the products. Additionally, cannabis is ingested orally through edibles while
tobacco is not. The edibles market is the largest sector of the cannabis industry (New Frontier Data,
2019). Because of this, cannabis should be classified as a food crop, and pesticide residues should
be tested by the EPA. Stricter regulations are needed to ensure the safety of consumers and the
environment. Canada serves as an example for more well-defined pesticide regulations.

47
Canada’s Pesticide Regulations
As of July 30, 2019, Canada has registered 29 pesticides for lawful use on cannabis plants.
The majority of them are biological fungicides and herbicides. The pesticides pose minimal risk
to humans and most of them do not contain any chemicals found in many popular pesticides. If
any cannabis pesticides do contain dangerous ingredients, such as sulfur, the concentration is too
small to harm human health (Chem Service, 2019). Canada also has a list of pesticides not entirely
banned for use on cannabis similar to California’s restricted use pesticides. However, the residue
limits for these pesticides are generally, and in some cases significantly, stricter than the limits set
by California (Health Canada, 2018).
In 2017, there were multiple large-scale recalls of medical cannabis due to illegal pesticide
use.11 After these findings, Health Canada began enforcing strict pesticide testing requirements.
Prior to this, the specific regulations regarding pesticide use were not strictly enforced. Health
Canada began to suspend or terminate cannabis licenses for those who did not conduct mandatory
testing. In November 2018, Health Canada enhanced the existing pesticide testing regulations.
Cannabis cultivators are required to deliver samples of their products to products to independent
laboratories for testing that tests for approximately 100 different chemicals (Chem Service, 2019).
Before Canada enhanced its pesticide regulations, the specifications as to how the testing was
implemented were not clear. By strictly defining and enforcing the regulations, there is little
leniency for unauthorized pesticide use on cannabis. This forces cultivators to make sure their
growth and processing practices are up to code (Chem Service, 2019).
There are many takeaways from the example set by Canada. First, the pesticide limits
should be lowered until acceptable tolerance limits can be established and studied for
effectiveness. Second, a national regulatory body should be established to ensure an equal level of
regulation across the States. If recreational cannabis is federally legalized, this responsibility
would fall to the EPA. However, the industry should not wait for this possibility and take initiative
to self-regulate. Lastly, recreational cannabis regulations need to be clearly defined and easily
accessible. Some requirements are vaguely defined and difficult to understand what is legal or not.
The exact regulations can also be difficult to locate. This can make it more difficult for well-
intentioned cultivators to ensure their practice is legal.
Integrated Pest Management
Both the Massachusetts and Denver Best Management Practices recommend the use of an
Integrated Pest Management (IPM) program, “to prevent, reduce, or maintain pest populations at
non-damaging levels by utilizing a variety of mechanical, physical, and biological controls”
(DDPHE, 2018; CCC, 2019). IPM plans are structured to include the following approach:
prevention, suppression, and eradication. Prevention of pests includes: spacing out the plants;
sealing cultivation areas; maintaining a controlled environment; removing pest habitats; trap
setting; pest scouting; and applying natural oils to deter pests. Any new plants or products that
enter the facility must be quarantined for 21 days to prevent the introduction of a pest to the closed
system. IPM also relies on extensive documentation of pest populations, treatment methods, and
treatment results. Grow media must always be replaced with sterile media and never reused. The
facility must also be maintained to ensure a dry, clean, and trash-free environment. Windows and
11In the U.S, medical and recreational cannabis are regulated under two separate systems. In
Canada, medical and recreational cannabis are regulated under the same system. Therefore,
medical cannabis laws apply to recreational cannabis.

48
doors must be free of cracks and remain sealed at all times. Additionally, eradication of pests
surrounding the facility should be done in order to minimize the risk of infiltration (DDPHE,
2018). If a pest problem does arise, biological control agents, including the pest’s natural predator
or parasites, are applied. The only time synthetic controls (pesticides) are used is if they are
approved by the appropriate regulatory agency. In the case of Denver and Massachusetts, 25b
Minimum Risk Pesticides may be applied (DDPHE 2018; CCC, 2019; C.F.R. 40 § 152.25, 2013).
Future Research
There is extensive research about the harmful effects of pesticides on the environment;
however, there is much uncertainty about the health risks of pesticide use on cannabis. Little
research has been conducted to determine the risk posed by smoking cannabis with pesticide
residue and even less research has been conducted to explore how pesticides may transform during
the extraction process. If cannabis becomes federally legal, these concerns will need to be brought
to the forefront of the discussion when determining which pesticides are suitable for use on
cannabis.

49
References
Aktar, W., Sengupta, D., & Chowdhury, A. (2009). Impact of pesticides use in agriculture: their
benefits and hazards. Interdisciplinary Toxicology, 2(1), 1-12.
Beadle, A. (2019). Washington State Cannabis Regulators Consider Mandatory Pesticide
Testing. Analytical Cannabis. Retrieved from
https://www.analyticalcannabis.com/articles/washington-state-cannabis-regulators-
consider-mandatory-pesticide-testing-311447
Beyond Pesticides. (October 2019). Take Action: Congressional Oversight Needed on Illegal
Pesticide Use in Cannabis Production and Resulting Contamination. Retrieved from
https://beyondpesticides.org/dailynewsblog/2019/10/take-action-congressional-oversight-
needed-on-illegal-pesticide-use-in-cannabis-production-and-resulting-contamination/
California Cannabis Cultivation. Cannabis Pesticides that Cannot be Used. Retrieved from
https://www.cdpr.ca.gov/docs/cannabis/index.htm
California Department of Pesticide Regulation (CDPR). Legal Pest Management Practices for
Cannabis Growers in California. Retrieved from
https://www.cdpr.ca.gov/docs/cannabis/index.htm
California Department of Public Health (CDPH). (2014). Safety of Pyrethrin and Pyrethroid
Pesticides Used to Control Adult Mosquitoes Questions and Answers for Public Health
Professionals. [PDF File]. Retrieved from
http://westnile.ca.gov/downloads.php?download_id=3167&filename=SafetyofPesticides0
9-14-2.pdf
Cannabis Control Commission (CCC). (2019). Guidance on Integrated Pest Management. [PDF
File]. Retrieved from https://mass-cannabis-control.com/wp-
content/uploads/2019/04/Guidance-on-Integrated-Pest-Management.pdf
Chem Service (2019). Examining the Cannabis Pesticide Guidelines in Canada.
Retrieved from https://www.chemservice.com/news/2019/08/examining-the-cannabis -
pesticide-guidelines- in-canada/
Colorado Department of Agriculture (CDA). Pesticide Use in Cannabis Production Information.
Retrieved from https://www.colorado.gov/pacific/agplants/pesticide-use- cannabis-
production-information
Craven, C. B., Wawryk, N., Jiang, P., Liu, Z., & Li, X. F. (2019). Pesticides and trace elements
in cannabis: Analytical and environmental challenges and opportunities. Journal of
Environmental Sciences.

50
Denver Department of Public Health and Environment (DDPHE). (2018). Denver Best
Management Practices Guide. [PDF File]. Retrieved from
https://www.denvergov.org/content/dam/denvergov/Portals/771/documents/EQ/MJ%20S
ustainability/Cannabis_BestManagementPracticesGuide_FINAL.pdf
Evoy, R., & Kincl, L. (2019). Evaluation of Pesticides Found in Oregon Cannabis from 2016 to
2017. Annals of Work Exposures and Health.
Exemptions for pesticides of a character not requiring FIFRA regulation, 40 § 152.25 (2013).
Fishel, F. M. (2017). Pesticide Characteristics. Gainesville: University of Florida Institute of
Food and Agricultural Sciences. Retrieved from https://edis.ifas.ufl.edu/pi202
Gardner, R. (n.d.). Understanding the Fate of Pesticides after Application. Retrieved from
https://pesticidestewardship.org/water/pesticide-fate/
Gustafson, D. I. (1989). Groundwater ubiquity score: a simple method for assessing pesticide
leachability. Environmental Toxicology and Chemistry: An International Journal, 8(4),
339-357.
Hanson, B., Bond, C., & Buhl, K. (2016). Pesticide Vapor Pressure Fact Sheet. National
Pesticide Information Center, Oregon State University Extension Services. Retrieved
from http://npic.orst.edu/factsheets/vaporpressure.html
Hanson, B., Bond, C., Buhl, K., & Stone, D. (2015). Pesticide Half-life Fact Sheet. National
Pesticide Information Center, Oregon State University Extension Services. Retrieved
from http://npic.orst.edu/factsheets/half-life.html
Hanson, B., Cross, A., Bond, C., & Jenkins, J. (2017). Pesticide Binding Affinity Fact Sheet.
National Pesticide Information Center, Oregon State University Extension Services.
Retrieved from npic.orst.edu/factsheets/bindingaffinity.html.
Harper, B., Luukinen, B., Gervais, J. A., Buhl, K., & Stone, D. 2009. Diazinon Technical Fact
Sheet. National Pesticide Information Center, Oregon State University Extension
Services. Retrieved from http://npic.orst.edu/factsheets/archive/diazinontech.html.
Health Canada. (2018). Mandatory Cannabis Testing for Pesticide Active Ingredients—List and
Limits. Retrieved from https://www.canada.ca/en/public-health/services/publications/
drugs-health-products/cannabis-testing-pesticide-list-limits.html
Joko, T., Anggoro, S., Sunoko, H. R., & Rachmawati, S. (2017). Pesticides usage in the soil
quality degradation potential in wanasari subdistrict, Brebes, Indonesia. Applied and
Environmental Soil Science, 2017.
LaGrega, M. D., Buckingham, P. L., & Evans, J. C. (2010). Hazardous waste management.
Waveland Press.

51
New Frontier Data. (2019). Global Cannabis Report: 2019 Industry Outlook. Retrieved from
https://newfrontierdata.com/product/global-cannabis-2019/
Ney, R. (1995). Fate and Transport of Organic Chemicals in the Environment. P.10. Retrieved
from http://npic.orst.edu/envir/watersol.html
Orth, J. F. (2019). Massachusetts Emergency Operations Response Plan for Mosquito-Borne
Illness. Massachusetts Department of Agricultural Resources, State Reclamation and
Mosquito Control Board. [PDF File]. Retrieved from
https://www.mass.gov/files/documents/2019/08/06/2019SRBEmergencyResponsePlan.pd
f
Seltenrich, N. (2019). Into the Weeds: Regulating Pesticides in Cannabis. Environmental Health
Perspectives, 127(4).
Stone, D. (2014). Cannabis, pesticides and conflicting laws: the dilemma for legalized States and
implications for public health. Regulatory Toxicology and Pharmacology, 69(3), 284-
288.
Sullivan, N., Elzinga, S., & Raber, J. C. (2013). Determination of pesticide residues in cannabis
smoke. Journal of toxicology, 2013.
Taylor, A., & Birkett, J. W. (2020). Pesticides in cannabis: A review of analytical and
toxicological considerations. Drug testing and analysis, 12(2), 180-190.
Trautmann, N. M., Porter, K. S., & Wagenet, R. J. (1989). Pesticides and groundwater: a guide
for the pesticide user. Cornell Cooperative Extension. Retrieved from
https://ecommons.cornell.edu/bitstream/handle/1813/3930/Pesticides%20and%20Ground
water.pdf?sequence=2&isAllowed=y
United States Environmental Protection Agency (EPA). (2014). Label Review Manual.
Retrieved from https://www.epa.gov/pesticide-registration/label-review-manual
United States Environmental Protection Agency. (2019a). Factsheet on Ecological Risk
Assessment for Pesticides. Retrieved from https://www.epa.gov/pesticide-science-and-
assessing-pesticide-risks/factsheet-ecological-risk-assessment-pesticides
United States Environmental Protection Agency. (2019b). Guidance for Reporting on the
Environmental Fate and Transport of the Stressors of Concern in Problem Formulations.
Retrieved from https://www.epa.gov/pesticide-science-and-assessing-pesticide-
risks/guidance-reporting-environmental-fate-and-transport
United States General Accounting Office (GAO). (2003). Pesticides on Tobacco: Federal
Activities to Assess Risks and Monitor Residues. Retrieved from
https://www.gao.gov/new.items/d03485.pdf

52
Vogue, P. A., Kerle, E. A., & Jenkins, J. J. (1994). OSU extension pesticide properties database.
National Pesticide Information Center, Oregon State University Extension Services.
Retrieved from http://npic.orst.edu/ingred/ppdmove.htm
Walters, K. M., Fisher, G. G., & Tenney, L. (2018). An overview of health and safety in the
Colorado cannabis industry. American Journal of Industrial Medicine, 61(6), 451-461.
Zhang, M., & Goodhue, R. (2010). Agricultural Pesticide Best Management Practices Report A
Final Report for the Central Valley Regional Water Quality Control Board. Retrieved
from https://www.waterboards.ca.gov/rwqcb5/water_issues/tmdl/central_valley_projects
/central_valley_pesticides/ag_practices/final_22mar10_bmp_rpt.pdf

53
Appendix A: Cross-Referenced List of Pesticides Allowed in CA and CO
Colorado California California but not Colorado
Acetic Acid Bacillus thuringiensis sub.
israelensis
Ammoniated soap of fatty acids Horticultural oils (petroleum oil)
Ammonium Nonanoate Iron phosphate
Auxin Potassium bicarbonate
Azadirachtin Azadirachtin Sodium bicarbonate
Bacillus amyloliquefaciens
Strain D747
Bacillus amyloliquefaciens
strain D747
Bacillus pumilus Strain GHA
180
Bacillus subtilis MBI 600
Bacillus subtilis QST713 Strain
Bacillus thuringiensis SSP.
Aizawai
Bacillus thuringiensis SSP.
Kurstaki
Bacillus thuringiensis sub.
kurstaki
Beauveria bassiana Strain GHA Beauveria bassiana
Burkholderia sp strain A396 Burkholderia spp. strain
A396
Canola Oil
Capric Acid/Caprylic Acid
Capsicum Oleoresin Extract Capsaicin
Castor Oil Castor oil
Cedar Oil
Chromobacterium Sub Strain
PRAA4-1 Cells
Cinnamon Oil Cinnamon oil
Citric Acid Citric acid
Clarified Hydrophobic Extract of
Neem Oil Neem oil
Clove Oil Clove oil

54
Complex polymeric polyhydroxy
acid (CPPA)
Copper Octanoate
Corn Oil Corn oil
Cottonseed Oil Cottonseed oil
Cytokinin (Kinetin)
Diatomaceous Earth
Eugenol
Garlic Oil Garlic oil
Geraniol Geraniol
Gibberellins (Gibberellic Acid)
Gliocladium catenulatum strain
J1446 Gliocladium virens
GS-omega/kappa-Hxtx-Hv1a
Harpin Alpha Beta
Helicoverpa armigera
nucleopolyhedrovirus strain BV-
0003
Hydrogen Peroxide
IBA (Indole-3-Butyric Acid)
Indole-3-butyric acid
Isaria fumosorosea Isaria fumosorosea
Kaolin
Lemon Grass Oil
Linseed Oil
Mineral Oil
Mono- and Dibasic Sodium,
Potassium, and Ammonium
Phosphites
Monopotassium Phosphate
Myrothecium verrucaria
Peppermint Oil Peppermint oil
Peroxyacetic Acid

55
Phosphorous Acid, Mono- and
Di-Potassium Salts of
Piperonyl Butoxide
Potassium Laurate
Potassium Salts of Fatty Acids
Insecticidal soaps
(potassium salts of fatty
acids)
Potassium Silicate Potassium silicate
Potassium Sorbate Potassium sorbate
Pseudomonas chlororaphis strain
AFS009
Pyrethrins
Reynoutria sachalinensis Reynoutria sachalinensis
extract
Rhamnolipid Biosurfactant
Rosemary Oil Rosemary oil
Sesame Oil Sesame oil
Sodium Chloride Sodium Chloride
Sodium Ferric EDTA Sodium Ferric EDTA
Sodium Lauryl Sulfate
Soybean Oil Soybean oil
Streptomyces sp. Strain K61
Streptomyces Strain K61
Sulfur Sulfur
Thyme oil Thyme oil
Trichoderma asperellum Strain
ICC 012
Trichoderma gamsii Strain ICC
080
Trichoderma harzianum Rifai
Strain KRL-AG2 Trichoderma harzianum
Trichoderma virens Strain G-41
Total 74 31 6

56
Data Sources
12California Department of Pesticide Regulation. Cannabis Pesticides That are Legal to Use.
[PDF File]. https://www.cdpr.ca.gov/docs/cannabis/can_use_pesticide.pdf
13Colorado Department of Agriculture. Colorado pesticides allowed for use in cannabis
production. [PDF File]. Retrieved from https://drive.google.com/file/d/1JLP-Z2-
88TLpShucZ4bowA38cuqBaM8A/view
12This is not an exhaustive list of active ingredients that may fit the legal use criteria. 13Pesticides allowed for use in Cannabis production in accordance with the PAA Rule: Effective February 14th, 2020.
Accessed on April 21, 2020. List was filtered by “YES” for Commercial Use.
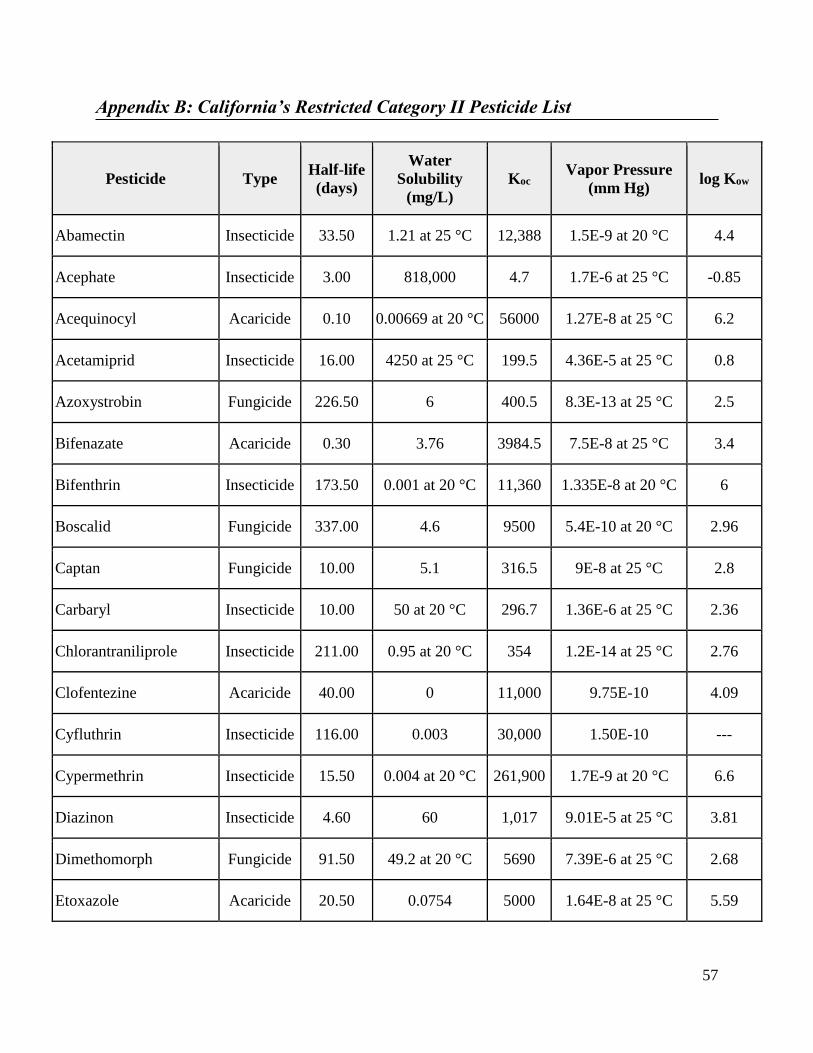
57
Appendix B: California’s Restricted Category II Pesticide List
Pesticide Type Half-life
(days)
Water
Solubility
(mg/L)
Koc Vapor Pressure
(mm Hg) log Kow
Abamectin Insecticide 33.50 1.21 at 25 °C 12,388 1.5E-9 at 20 °C 4.4
Acephate Insecticide 3.00 818,000 4.7 1.7E-6 at 25 °C -0.85
Acequinocyl Acaricide 0.10 0.00669 at 20 °C 56000 1.27E-8 at 25 °C 6.2
Acetamiprid Insecticide 16.00 4250 at 25 °C 199.5 4.36E-5 at 25 °C 0.8
Azoxystrobin Fungicide 226.50 6 400.5 8.3E-13 at 25 °C 2.5
Bifenazate Acaricide 0.30 3.76 3984.5 7.5E-8 at 25 °C 3.4
Bifenthrin Insecticide 173.50 0.001 at 20 °C 11,360 1.335E-8 at 20 °C 6
Boscalid Fungicide 337.00 4.6 9500 5.4E-10 at 20 °C 2.96
Captan Fungicide 10.00 5.1 316.5 9E-8 at 25 °C 2.8
Carbaryl Insecticide 10.00 50 at 20 °C 296.7 1.36E-6 at 25 °C 2.36
Chlorantraniliprole Insecticide 211.00 0.95 at 20 °C 354 1.2E-14 at 25 °C 2.76
Clofentezine Acaricide 40.00 0 11,000 9.75E-10 4.09
Cyfluthrin Insecticide 116.00 0.003 30,000 1.50E-10 ---
Cypermethrin Insecticide 15.50 0.004 at 20 °C 261,900 1.7E-9 at 20 °C 6.6
Diazinon Insecticide 4.60 60 1,017 9.01E-5 at 25 °C 3.81
Dimethomorph Fungicide 91.50 49.2 at 20 °C 5690 7.39E-6 at 25 °C 2.68
Etoxazole Acaricide 20.50 0.0754 5000 1.64E-8 at 25 °C 5.59

58
Fenhexamid Fungicide 1.00 20 4100 3E-9 at 20 °C 3.51
Fenpyroximate Miticide 36.50 0.0231 at 25 °C 12000 5.58E-8 at 25 °C 5.01
Flonicamid Insecticide 12.75 5200 25 7.073E-9 at 20 °C 0.3
Fludioxonil Fungicide 246.50 1.8 at 25 °C 3388 2.93E-9 at 25 °C 4.12
Hexythiazox Ovacide
(miticide) 23.20 0.5 6,200 2.55E-8 at 20 °C 5.57
Imidacloprid Insecticide 119.00 610 478 7E-12 at 25 °C 0.57
Kresoxim-methyl Fungicide 1.00 2 1700 1.72E-8 at 20 °C 3.4
Malathion Insecticide 2.74 143 at 20 °C 9,274 3.97E-5 at 30 °C 2.36
Metalaxyl Fungicide 55.00 8,400 157 5.62E-6 at 25 °C 1.71
Methomyl Insecticide 30.00 58,000 160 5.4E-6 at 25 °C 0.6
Myclobutanil Fungicide 66.00 142 950 1.6E-6 at 25 °C 2.94
Naled
Insecticide,
Acaricide,
Fungicide
0.25 1.5 242 2.0E-4 at 20 °C 1.38
Oxamyl Insecticide 34.50 282,000 8 0.00023 at 20-25 °C -0.47
Pentachloronitrobenzene Fungicide 468.00 0.44 20000 5E-5 at 20 °C 4.22
Permethrin Insecticide,
Acaricide 42.00 0.0111 48,236 5.18E-8 at 25 °C 6.5
Phosmet Insecticide 12.00 25 660 4.9E-7 at 20-25 °C 2.95
Piperonylbutoxide Insecticide
synergist 14.00 0 614.5 5.2E-6 at 25 °C 4.75
Prallethrin Insecticide 25.85 8 3082 3.5E-5 at 20 °C 4.49
Propiconazole Fungicide 110.00 110 650 10-6 at 25 °C 3.72

59
Pyrethrins Insecticide 12.00 0 100,000 2.03E-5 at 25 °C 6.15
Pyridaben Acaricide 13.00 0.012 5000 1.18E-6 at 20 °C 6.37
Spinetoram Insecticide 18.40 29 at 20 °C 22836 4275.351 at 20 °C 4.2
Spinosad Insecticide 13.00 89.4 1000 2.25E-9 at 25 °C 4.1
Spiromesifen Insecticide 10.25 0.13 34,000 1.5E-4 at 20 °C 4.55
Spirotetramat Incesticide 0.20 29.9 4.55 4.20E-11 at 20 °C,
1.13E-10 at 25 °C 2.5
Tebuconazole Fungicide 400.00 36 1023 1.28E-8 at 20 °C 3.7
Thiamethoxam Insecticide 50.50 4,100 60 4.95E-11 at 25 °C -0.13
Trifloxystrobin Fungicide 3.00 0.61 4504.5 2.55E-8 at 25 °C 4.5
Data Sources
Australia National Registration Authority for Agricultural and Veterinary Chemicals. (September
2000). Evaluation of the new active TRIFLOXYSTROBIN in the product FLINT
FUNGICIDE.[PDF File]. Retrieved from
https://apvma.gov.au/sites/default/files/publication/14081-prs-trifloxystrobin.pdf
Australian Pesticides and Veterinary Medicines Authority. (April 2009). Evaluation of the new
active SPIROTETRAMAT in the product MOVENTO 240 SC INSECTICIDE. [PDF
File]. Retrieved from https://apvma.gov.au/sites/default/files/publication/14016-prs-
spirotetramat.pdf
Cornell University. EXTOXNET: Pesticide Information Project. Carbaryl. Retrieved from
http://pmep.cce.cornell.edu/profiles/extoxnet/carbaryl-dicrotophos/carbaryl-ext.html
Food and Agriculture Organization of the United Nations. Fenpyroximate. [PDF File]. Retrieved
from http://www.fao.org/fileadmin/templates/agphome/documents/Pests_Pesticides/
JMPR/Evaluation95/fenpyro.pdf
Food and Agriculture Organization of the United Nations. (2008). Spinetoram. [PDF File]
Retrieved from http://www.fao.org/fileadmin/templates/agphome/documents/Pests
_Pesticides/JMPR/Evaluation08/Spinetoram.pdf.

60
Food and Agriculture Organization of the United Nations. (2008). Spirotetramat. [PDF File].
Retrieved from http://www.fao.org/fileadmin/templates/agphome/documents/Pests
_Pesticides/JMPR/Evaluation08/Spirotetramat.pdf
International Union of Pure and Applied Chemistry. IUPAC database. Acequinocyl. Retrieved
from https://sitem.herts.ac.uk/aeru/iupac/Reports/10.htm
International Union of Pure and Applied Chemistry. IUPAC database. Spinosad (Ref: XDE 105)
Retrieved from https://sitem.herts.ac.uk/aeru/iupac/Reports/596.htm
National Center for Biotechnology Information. PubChem Database. Abamectin, CID=6435890,
Retrieved from https://pubchem.ncbi.nlm.nih.gov/compound/Abamectin
National Center for Biotechnology Information. PubChem Database. Acephate, CID=1982,
Retrieved from https://pubchem.ncbi.nlm.nih.gov/compound/Acephate
National Center for Biotechnology Information. PubChem Database. Acequinocyl, CID=93315,
Retrieved from https://pubchem.ncbi.nlm.nih.gov/compound/Acequinocyl
National Center for Biotechnology Information. PubChem Database. Acetamiprid, CID=213021,
Retrieved from https://pubchem.ncbi.nlm.nih.gov/compound/Acetamiprid
National Center for Biotechnology Information. PubChem Database. Azoxystrobin,
CID=3034285. Retrieved from
https://pubchem.ncbi.nlm.nih.gov/compound/Azoxystrobin
National Center for Biotechnology Information. PubChem Database. Bifenazate, CID=176879,
Retrieved from https://pubchem.ncbi.nlm.nih.gov/compound/Bifenazate
National Center for Biotechnology Information. PubChem Database. Bifenthrin, CID=5281872,
Retrieved from https://pubchem.ncbi.nlm.nih.gov/compound/Bifenthrin
National Center for Biotechnology Information. PubChem Database. Boscalid, CID=213013,
Retrieved from https://pubchem.ncbi.nlm.nih.gov/compound/Boscalid
National Center for Biotechnology Information. PubChem Database. Captan, CID=8606,
Retrieved from https://pubchem.ncbi.nlm.nih.gov/compound/Captan
National Center for Biotechnology Information. PubChem Database. Carbaryl, CID=6129,
Retrieved from https://pubchem.ncbi.nlm.nih.gov/compound/Carbaryl
National Center for Biotechnology Information. PubChem Database. Chlorantraniliprole,
CID=11271640, Retrieved from
https://pubchem.ncbi.nlm.nih.gov/compound/Chlorantraniliprole
National Center for Biotechnology Information. PubChem Database. Clofentezine, CID=73670,

61
Retrieved from https://pubchem.ncbi.nlm.nih.gov/compound/Clofentezine
National Center for Biotechnology Information. PubChem Database. Cypermethrin, CID=2912,
Retrieved from https://pubchem.ncbi.nlm.nih.gov/compound/Cypermethrin
National Center for Biotechnology Information. PubChem Database. Cyfluthrin, CID=104926,
Retrieved from https://pubchem.ncbi.nlm.nih.gov/compound/Cyfluthrin
National Center for Biotechnology Information. PubChem Database. Diazinon, CID=3017,
Retrieved from https://pubchem.ncbi.nlm.nih.gov/compound/Diazinon
National Center for Biotechnology Information. PubChem Database. Dimethomorph,
CID=86298, Retrieved from
https://pubchem.ncbi.nlm.nih.gov/compound/Dimethomorph
National Center for Biotechnology Information. PubChem Database. Etoxazole, CID=153974,
Retrieved from https://pubchem.ncbi.nlm.nih.gov/compound/Etoxazole
National Center for Biotechnology Information. PubChem Database. Fenhexamid, CID=213031,
Retrieved from https://pubchem.ncbi.nlm.nih.gov/compound/Fenhexamid
National Center for Biotechnology Information. PubChem Database. CID=107760,
Retrieved from https://pubchem.ncbi.nlm.nih.gov/compound/Fenpyroximate
National Center for Biotechnology Information. PubChem Database. Flonicamid, CID=9834513,
Retrieved from https://pubchem.ncbi.nlm.nih.gov/compound/Flonicamid
National Center for Biotechnology Information. PubChem Database. Fludioxonil, CID=86398,
Retrieved from https://pubchem.ncbi.nlm.nih.gov/compound/Fludioxonil
National Center for Biotechnology Information. PubChem Database. Hexythiazox,
CID=13218777, Retrieved from
https://pubchem.ncbi.nlm.nih.gov/compound/Hexythiazox
National Center for Biotechnology Information. PubChem Database. (E)-Imidacloprid,
CID=135541675, Retrieved from https://pubchem.ncbi.nlm.nih.gov/compound/E_-
Imidacloprid
National Center for Biotechnology Information. PubChem Database. Kresoxim-Methyl,
CID=6112114, Retrieved from https://pubchem.ncbi.nlm.nih.gov/compound/Kresoxim-
Methyl
National Center for Biotechnology Information. PubChem Database. Malathion, CID=4004,
Retrieved from https://pubchem.ncbi.nlm.nih.gov/compound/Malathion
National Center for Biotechnology Information. PubChem Database. Metalaxyl, CID=42586,

62
Retrieved from https://pubchem.ncbi.nlm.nih.gov/compound/Metalaxyl
National Center for Biotechnology Information. PubChem Database. Methomyl, CID=4109,
Retrieved from https://pubchem.ncbi.nlm.nih.gov/compound/Methomyl
National Center for Biotechnology Information. PubChem Database. Myclobutanil, CID=6336,
Retrieved from https://pubchem.ncbi.nlm.nih.gov/compound/Myclobutanil
National Center for Biotechnology Information. PubChem Database. Naled, CID=4420,
Retrieved from https://pubchem.ncbi.nlm.nih.gov/compound/Naled
National Center for Biotechnology Information. PubChem Database. Oxamyl, CID=31657,
Retrieved from https://pubchem.ncbi.nlm.nih.gov/compound/Oxamyl
National Center for Biotechnology Information. PubChem Database. Pentachloronitrobenzene,
CID=6720, Retrieved from
https://pubchem.ncbi.nlm.nih.gov/compound/Pentachloronitrobenzene
National Center for Biotechnology Information. PubChem Database. Permethrin, CID=40326,
Retrieved from https://pubchem.ncbi.nlm.nih.gov/compound/Permethrin
National Center for Biotechnology Information. PubChem Database. Phosmet, CID=12901,
Retrieved from https://pubchem.ncbi.nlm.nih.gov/compound/Phosmet
National Center for Biotechnology Information. PubChem Database. Piperonyl butoxide,
CID=5794, Retrieved from https://pubchem.ncbi.nlm.nih.gov/compound/Piperonyl-
butoxide
National Center for Biotechnology Information. PubChem Database. d,d-T80-Prallethrin,
CID=31621, Retrieved from https://pubchem.ncbi.nlm.nih.gov/compound/d_d-T80-
Prallethrin
National Center for Biotechnology Information. PubChem Database. Propiconazole,
CID=43234, Retrieved from https://pubchem.ncbi.nlm.nih.gov/compound/Propiconazole
National Center for Biotechnology Information. PubChem Database. Pyrethrin I, CID=5281045,
Retrieved from https://pubchem.ncbi.nlm.nih.gov/compound/Pyrethrin-I
National Center for Biotechnology Information. PubChem Database. Pyridaben, CID=91754,
Retrieved from https://pubchem.ncbi.nlm.nih.gov/compound/Pyridaben
National Center for Biotechnology Information. PubChem Database. Spinosyn A, CID=443059,
Retrieved from https://pubchem.ncbi.nlm.nih.gov/compound/Spinosad-factor-A
National Center for Biotechnology Information. PubChem Database. Spiromesifen,

63
CID=9907412, Retrieved from
https://pubchem.ncbi.nlm.nih.gov/compound/Spiromesifen
National Center for Biotechnology Information. PubChem Database. Tebuconazole, CID=86102,
Retrieved from https://pubchem.ncbi.nlm.nih.gov/compound/Tebuconazole
National Center for Biotechnology Information. PubChem Database. Thiamethoxam,
CID=5485188, Retrieved from https://pubchem.ncbi.nlm.nih.gov/compound/5485188
National Center for Biotechnology Information. PubChem Database. CID=11664966, Retrieved
from https://pubchem.ncbi.nlm.nih.gov/compound/11664966
National Pesticide Information Center. Index. Bifenthrin. Retrieved from
http://npic.orst.edu/factsheets/archive/biftech.html
National Pesticide Information Center. Index. Imidacloprid. Retrieved from
http://npic.orst.edu/factsheets/archive/imidacloprid.html
National Pesticide Information Center. Index. Spinosad. Retrieved from
http://npic.orst.edu/factsheets/spinosadgen.html (accessed on Jan. 18, 2020)
New York Department of Environmental Conservation. (2004). Flonicamid NYS DEC Letter -
Registration of Technical Flonicamid and F1785 GH 50 WG Insecticide. Retrieved from
http://pmep.cce.cornell.edu/profiles/insect-mite/fenitrothion-
methylpara/flonicamid/flonicamid_let_604.html
New York Department of Environmental Conservation. Registration of Delegate WG (EPA Reg.
o. 62719-541) and Radiant SC (EPA Reg. No. 62719-545), Both of Which Contain the
New Active Ingredient Spinetoram (Chemical Code 110008 and 110009). Retrieved from
http://pmep.cce.cornell.edu/profiles/biopest-
biocont/bacterium/spinetoram/spinet_reg_1108.pdf
New York State Department of Environmental Conservation. (June 2002). Thiamethoxam -
Registration of Special Local Need Labeling for Actara Insecticide (EPA Reg. No. 100-
938). Retrieved from http://pmep.cce.cornell.edu/profiles/insect-mite/propetamphos-
zetacyperm/thiamethoxam/thiameth_sln_0602.html
Rand, G.M., Clark, J.R. (2000). Hazard/Risk Assessment of Pyridaben: I. Aquatic Toxicity and
Environmental Chemistry. Ecotoxicology, 9, 157–168.
United States Environmental Protection Agency. (1998) Pesticide Fact Sheet: Dimethomorph.
[PDF File]. Retrieved from https://www3.epa.gov/pesticides/chem_search/reg_actions/
registration/fs_PC-268800_30-Sep-98.pdf
United States Environmental Protection Agency. Ecological Risk Assessment for Section 3

64
Registration of Tebuconazole on Wheat, Cucurbits, Bananas, Turnips, Tree nuts, Hops,
and Sunflowers. [PDF File] Retrieved from https://www3.epa.gov/pesticides/
chem_search/cleared_reviews/csr_PC-128997_25-Jul-00_a.pdf
University of Hertfordshire. Pesticide Properties Database. Clofentezine (Ref: NC 21314)
Retrieved from https://sitem.herts.ac.uk/aeru/ppdb/en/Reports/167.htm
University of Hertfordshire. Pesticide Properties Database. Metalaxyl-M (Ref: CGA 329351)
Retrieved from https://sitem.herts.ac.uk/aeru/ppdb/en/Reports/445.htm
University of Hertfordshire. Pesticide Properties Database. Spinetoram (Ref: XDE 175)
Retrieved from https://sitem.herts.ac.uk/aeru/ppdb/en/Reports/1144.htm

65
Chapter 5: Extraction Methods
Introduction One of the leading concerns in cannabis production is the type of solvent used during
extraction. Extraction is the process of purifying and concentrating cannabinoids, flavonoids, and
terpenes from the cannabis plants. Through the use of temperature, pressure, and solvents, the
purpose of extraction is to make cannabinoids and other beneficial components available in a
highly concentrated form (Romano & Hazekamp, 2013; The Valens Company, 2019). Cannabis
concentrates are created to contain high amounts of desired compounds, such as
tetrahydrocannabinol (THC) and cannabidiol (CBD). These concentrates can be grouped into
categories, seen in Figure 5.1. Recent advances in high-level THC extractions have led to an
increase in the number of concentrate products in the United States.
Figure 5.1. Categories of Products and Extraction Methods.
There are several methods and solvents used to extract compounds from the cannabis plant.
Mechanical methods rely on temperature and pressure to force cannabis compounds out of the
plant, whereas solvent-based methods rely on a solvent to extract the compounds from the plant.
The mixture is then processed, in a variety of ways, to separate the solvent from the desired product
(The Valens Company, 2019). Non-polar solvents are commonly used for extraction, such as
petroleum ether, naphtha, alcohol and olive oil (Romano & Hazekamp, 2013). Table 5.1 displays
the different categories of solvents allowed by states.
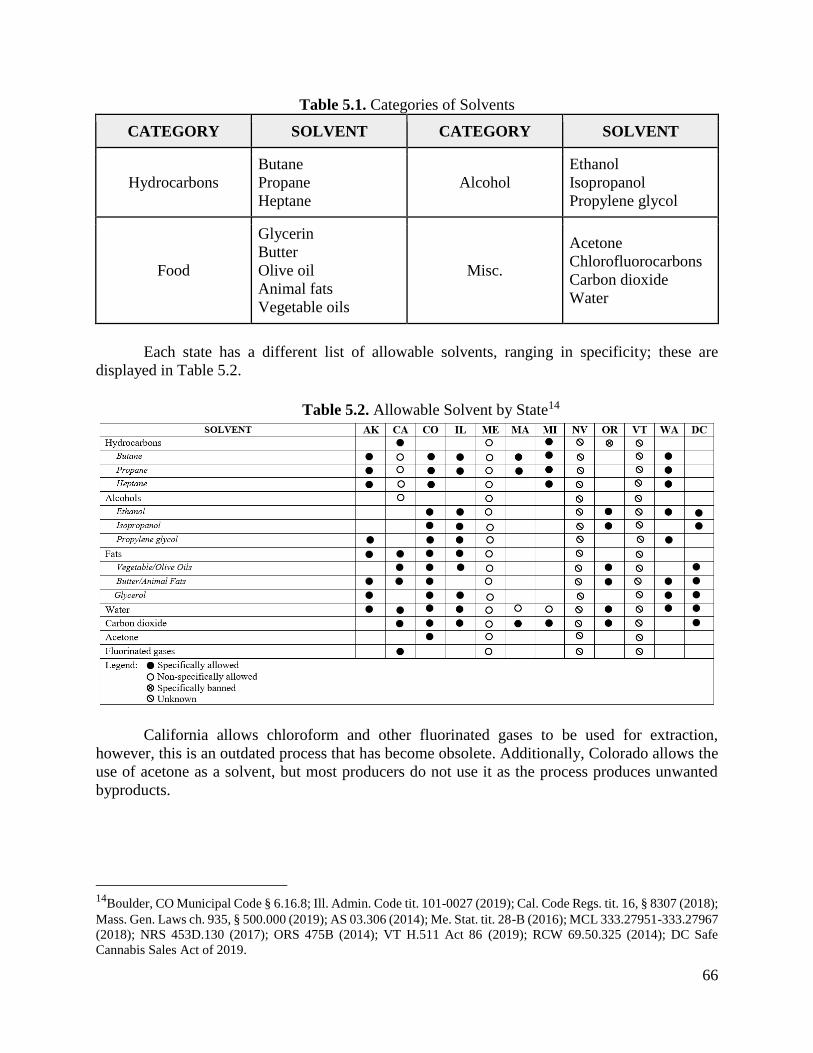
66
Table 5.1. Categories of Solvents
CATEGORY SOLVENT CATEGORY SOLVENT
Hydrocarbons
Butane
Propane
Heptane
Alcohol
Ethanol
Isopropanol
Propylene glycol
Food
Glycerin
Butter
Olive oil
Animal fats
Vegetable oils
Misc.
Acetone
Chlorofluorocarbons
Carbon dioxide
Water
Each state has a different list of allowable solvents, ranging in specificity; these are
displayed in Table 5.2.
Table 5.2. Allowable Solvent by State14
California allows chloroform and other fluorinated gases to be used for extraction,
however, this is an outdated process that has become obsolete. Additionally, Colorado allows the
use of acetone as a solvent, but most producers do not use it as the process produces unwanted
byproducts.
14
Boulder, CO Municipal Code § 6.16.8; Ill. Admin. Code tit. 101-0027 (2019); Cal. Code Regs. tit. 16, § 8307 (2018);
Mass. Gen. Laws ch. 935, § 500.000 (2019); AS 03.306 (2014); Me. Stat. tit. 28-B (2016); MCL 333.27951-333.27967
(2018); NRS 453D.130 (2017); ORS 475B (2014); VT H.511 Act 86 (2019); RCW 69.50.325 (2014); DC Safe
Cannabis Sales Act of 2019.
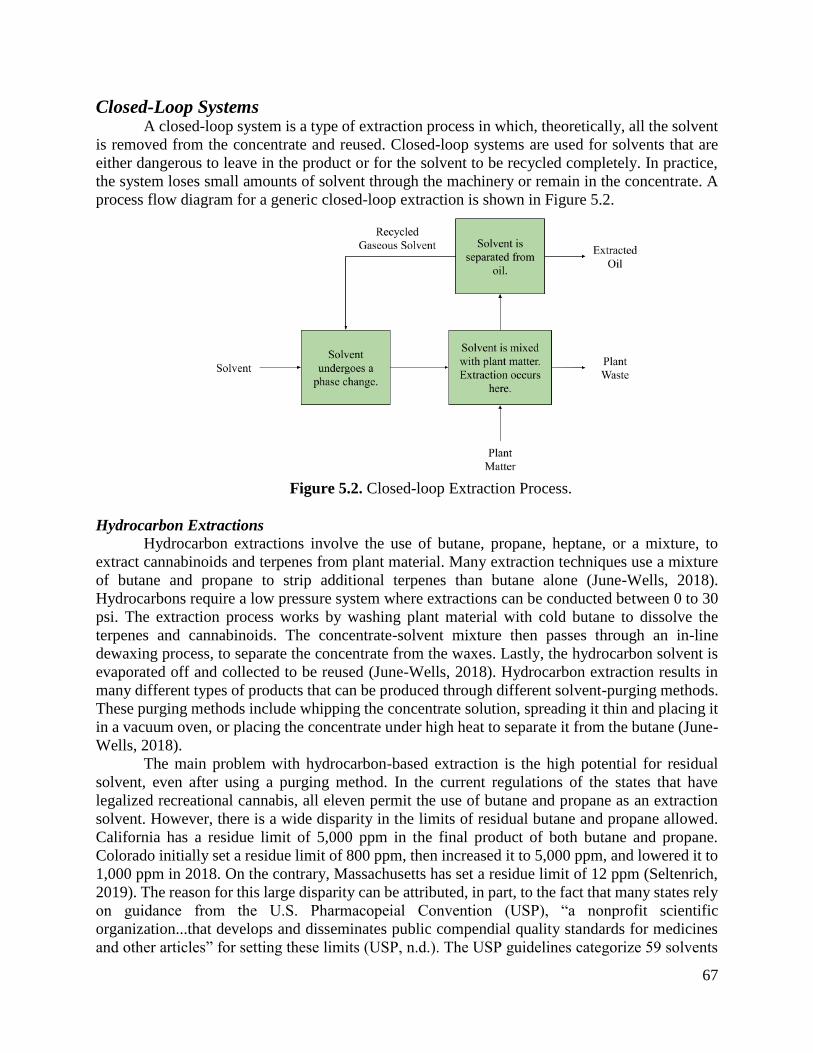
67
Closed-Loop Systems A closed-loop system is a type of extraction process in which, theoretically, all the solvent
is removed from the concentrate and reused. Closed-loop systems are used for solvents that are
either dangerous to leave in the product or for the solvent to be recycled completely. In practice,
the system loses small amounts of solvent through the machinery or remain in the concentrate. A
process flow diagram for a generic closed-loop extraction is shown in Figure 5.2.
Figure 5.2. Closed-loop Extraction Process.
Hydrocarbon Extractions
Hydrocarbon extractions involve the use of butane, propane, heptane, or a mixture, to
extract cannabinoids and terpenes from plant material. Many extraction techniques use a mixture
of butane and propane to strip additional terpenes than butane alone (June-Wells, 2018).
Hydrocarbons require a low pressure system where extractions can be conducted between 0 to 30
psi. The extraction process works by washing plant material with cold butane to dissolve the
terpenes and cannabinoids. The concentrate-solvent mixture then passes through an in-line
dewaxing process, to separate the concentrate from the waxes. Lastly, the hydrocarbon solvent is
evaporated off and collected to be reused (June-Wells, 2018). Hydrocarbon extraction results in
many different types of products that can be produced through different solvent-purging methods.
These purging methods include whipping the concentrate solution, spreading it thin and placing it
in a vacuum oven, or placing the concentrate under high heat to separate it from the butane (June-
Wells, 2018).
The main problem with hydrocarbon-based extraction is the high potential for residual
solvent, even after using a purging method. In the current regulations of the states that have
legalized recreational cannabis, all eleven permit the use of butane and propane as an extraction
solvent. However, there is a wide disparity in the limits of residual butane and propane allowed.
California has a residue limit of 5,000 ppm in the final product of both butane and propane.
Colorado initially set a residue limit of 800 ppm, then increased it to 5,000 ppm, and lowered it to
1,000 ppm in 2018. On the contrary, Massachusetts has set a residue limit of 12 ppm (Seltenrich,
2019). The reason for this large disparity can be attributed, in part, to the fact that many states rely
on guidance from the U.S. Pharmacopeial Convention (USP), “a nonprofit scientific
organization...that develops and disseminates public compendial quality standards for medicines
and other articles” for setting these limits (USP, n.d.). The USP guidelines categorize 59 solvents

68
that can be used to manufacture herbal medicines and other drug products into three different
classes: solvents to be avoided, solvents to be limited, and solvents with low toxic potential (USP,
2007). The USP suggests specific residual concentration limits for each of the 59 solvents that are
considered safe. The limit of 5,000 ppm, the California residue limit and previous Colorado limit,
is a standard limit that the USP has assigned for all 26 of its “less toxic” solvents, which notably
does not include butane or propane. Butane and propane are not commonly used to manufacture
herbal medicines and other drug products, therefore they are not included in the USP guidelines
(Seltenrich, 2019). There are numerous risks of butane inhalation, including convulsions,
hallucinations, cardiac damage, arrhythmias, organ failure, respiratory depression, vagal
inhibition, and anoxia. Solvent inhalation can also be associated with “chronic problems such as
cardiomyopathy, renal damage, liver damage, and a variety of psychiatric syndromes,” (Al-Zouabi
et al., 2018). Due to the health risks associated with butane, stricter regulations with scientific
backing need to be established.
These arbitrary regulations are of particular concern due to the growing problems
surrounding butane hash oil (BHO). BHO products are highly potent cannabis concentrates that
are produced using butane extraction. Due to the high concentration of THC that can be acquired
using this method, butane extraction “is perceived as the more efficient alternative for amateur
production” in the cannabis industry (Al-Zouabi et al., 2018). However, butane extraction can be
extremely dangerous if not performed correctly. This is especially a concern in regard to home
producers where butane extraction is often performed in garages, tool sheds, and vacant homes.
Butane can accumulate in confined spaces such as these and cause an explosion if ignited by a
spark or static electricity. Explosions and flash fires most often occur during the process of purging
the remaining butane from the final product. On the contrary, these problems rarely occur in the
commercial production of extracts. Commercial production utilizes closed-loop systems that
recycle the solvent (i.e. butane), preventing the butane from being released into an area where it
could be ignited (Al-Zouabi et al., 2018).
Alcohols Extraction
Extraction of cannabinoids through the use of alcohol is primarily performed using ethanol
or isopropanol. The most commonly used alcohol is ethanol. Ethanol extraction is a single-stream
process that may be conducted at hot or cold temperatures (June-Wells, 2018). Warm processes
tend to extract more plant pigments and waxes, whereas supercooled ethanol processes are more
time consuming and less efficient (June-Wells, 2018). In addition to the cannabinoid extraction
steps, additional dewaxing steps are required for both temperatures. Extraction by warm ethanol
also results in a green extract that has an unpleasant odor (Hazekamp and Romano, 2013). The
Food and Drug Administration (FDA) classifies both isopropanol and ethanol as Class 3 solvents
that should be limited to 5,000 ppm residual solvent.
The major problem with ethanol extraction is downstream handling (June-Wells, 2018).
Ethanol extraction processes require 0.6-1 gallon of ethanol per pound of plant material in order
to fully saturate the flowers (June-Wells, 2018). To fully extract the ethanol, rotary evaporators or
falling film evaporators are needed to remove the ethanol from the plant material (June-Wells,
2018). These systems are expensive to operate for small-scale growers.
Propylene glycol is a diol that is legal in most states. It is classified as “generally recognized
as safe” by the FDA when ingested orally (He et al., 2017). The extraction process functions
similar to that of other alcohols however, there is a concern for residual propylene glycol. When

69
heated, propylene glycol can transform into carbonyls and respiratory irritants like formaldehyde,
a known carcinogen (He et al., 2017).
Supercritical CO2 Extraction
Supercritical fluid extraction is a commonly used technique in large scale extraction of
essential oils and other compounds. The most commonly used supercritical solvent is carbon
dioxide (CO2). CO2 is inexpensive, generally recognized as safe, and has well-known
physicochemical properties (Rovetto & Aieta, 2017). Supercritical CO2 is also nontoxic,
nonflammable, and has excellent operational safety (Raber et al., 2015).
Supercritical CO2 is an effective solvent due to its density, diffusivity, and viscosity
properties. Supercritical CO2 can dissolve a large amount of the desired compound(s), penetrate
into small spaces of the plant material, and has very little flow resistance. Most notably,
supercritical CO2 can be used to target more specific compounds than hydrocarbons or ethanol by
manipulating its density and polarity. This is possible because the extractive properties of
supercritical CO2 are controlled by temperature and pressure. An advantage of supercritical CO2
is that each compound has a unique solubility profile related to the density of supercritical CO2.
Therefore if the critical density is known for the target compound, the compound can be
individually extracted, removed, and/or separated. The solubility profiles can also be used to
separate multiple components of supercritical CO2 extraction. By altering the temperature and
pressure downstream of the extraction site, certain compounds will “fall out” of the solution as the
density of the supercritical CO2 is decreased (June-Wells, 2018).
In an industrial supercritical CO2 process, the CO2 is recycled, with most units reusing up
to 95% of the initial CO2. Therefore, the only solvent waste involved in this method is the CO2
that leaks from the system or is contained in the extract (Attard et al., 2015). The most beneficial
aspect of this technique is that it produces a “solvent-free extract,” (Aladić et al., 2015). CO2
reaches a supercritical state at 31.1℃ and 7.39 MPa and will return to a gas state under ambient
conditions. This allows for any residual CO2 to be removed fairly simply, resulting in a solvent-
free product (Rovetto & Aieta, 2017).
Cold Water Extraction Cold water extraction, as the name implies, utilizes cold water to produce cannabis
concentrates. Cold-water extraction is performed using ice water to make the trichomes on the
cannabis plant brittle. The ice water and plant mixture are agitated to break the trichomes off of
the plant. The ice water, plant, and trichome mixture is then repeatedly sifted through increasingly
smaller mesh filters until the desired product is made (Raber et al., 2015). Due to the use of purely
water, this extraction technique produces a solvent-free product. It should be noted that Boulder
County, CO only allows cold water extraction at cultivation sites within its jurisdiction (Boulder,
CO Municipal Code § 6.16.8).
Food-based Extraction
Food-based extractions use vegetable and olive oils as well as animal fats to extract
cannabinoids for food products. The process is not closed-loop, since the resulting products are
cannabinoids mixed in a solvent (i.e. oil, butter). Solvents used for food processing are required
by law to be food-grade purity. Food-based extraction solvents are cost effective, nonflammable, and nontoxic. The energy
requirement is also relatively low, as the solvent only needs to be heated up to its boiling point.

70
After cooling and filtering, the product is ready for consumption. However, the extract produced
by this technique cannot be concentrated by evaporation, therefore customers will need to consume
a larger volume in order to get similar effects of more concentrated products (Romano &
Hazekamp, 2013).
Extraction Method Analysis In order to compare to the environmental impact of each extraction method, the total
energy, in kilowatt hours (kWh), required to produce one pound (lb) of extract was calculated.
Extract is defined as the product of the extraction process. The results are summarized in Table
5.3. Compared to the energy needed for the required phase changes, the energy used by the pumps
and other equipment was negligible. Since the extraction methods can vary greatly between
producers, there is currently no standard method for quantifying the amount of energy used in the
extraction process. If the model of machinery used is known, the energy requirements can be
directly calculated. To conduct a general analysis, a phase change analysis was conducted. This
involved calculating the energy needed to cool, condense, heat, and evaporate each extraction
solvent to its required temperatures. Since cold water extraction is based on different parameters
than the other extractions, the amount of energy required to transport and treat the amount of water
consumed in the process was also included. The total amount of energy required to perform all the
necessary temperature and phase changes was then converted to kWh. The full calculations and
list of assumptions for each method can be found in Appendix A.
Table 5.3. Total Energy of Extraction Methods
Extraction Method
Extraction Process
Energy
(𝒌𝑾𝒉
𝒍𝒃 𝒆𝒙𝒕𝒓𝒂𝒄𝒕)
Winterization
Energy
(𝒌𝑾𝒉
𝒍𝒃 𝒆𝒙𝒕𝒓𝒂𝒄𝒕)
Total Energy
Required
(𝒌𝑾𝒉
𝒍𝒃 𝒆𝒙𝒕𝒓𝒂𝒄𝒕)
Pure Butane 4.34 N/A 4.34
Cooled Ethanol 0.22 0.31 0.53
Supercritical CO2 14.60 0.31 14.91
Cold Water 0.57 N/A 0.57
Food-based* 0.49 N/A 0.49
*This extraction method was evaluated using vegetable and olive oil.
To better assess how this would affect the environment, kWh was converted to equivalent
CO2 emissions. The equivalent CO2 emissions of each process were calculated using the value
1.559 lb CO2/ kWh, as shown in Table 5.4 (EPA, n.d.).

71
Table 5.4. CO2 Emissions of Extraction Methods
Extraction Method Total Energy Required
(𝒌𝑾𝒉
𝒍𝒃 𝒆𝒙𝒕𝒓𝒂𝒄𝒕)
Equivalent CO2 Emissions
(𝒍𝒃 𝑪𝑶𝟐
𝒍𝒃 𝒆𝒙𝒕𝒓𝒂𝒄𝒕)
Pure Butane 4.34 6.77
Cooled Ethanol 0.53 0.83
Supercritical CO2 14.91 23.24
Cold Water 0.57 0.89
Food-based 0.49 0.77
Recommendations Supercritical CO2,
While many people claim that butane is the superior solvent because it results in a higher
concentrated extract, according to a study conducted by Hazekamp and Romano, “the more
concentrated an extract becomes, the more difficult it will be to remove the residual solvent,”
(Romano & Hazekamp, 2013). Applying more heat to evaporate the solvent will increase the
amounts of terpenes that are lost (Romano & Hazekamp, 2013). This creates a trade-off between
residual solvents and terpene content. Therefore, solvents that are not harmful to health should be
used. Supercritical CO2 extraction does not leave harmful solvent residuals in the concentrate,
making this process the most conducive to preserving human health.
When considering the environmental impact of supercritical CO2 extraction, the
commercial production of CO2 is arguably less of an environmental burden than that of butane.
Butane is extracted from Liquefied Petroleum Gas (LPG) at stripper plants. Carbon dioxide is
produced commercially as a byproduct of other reactions, such as in the production of ammonia
or at coal-fired power plants. It is harvested to be reused in other processes, rather than released
into the atmosphere. Additionally, CO2 is obtained through a variety of carbon sequestration
practices, which further improves the viability of the solvent.
Currently, several state governments are taking action to reduce energy consumption of
cannabis producers by including suggestions and requirements in their regulations. While Illinois
does not have permanent regulations yet, the state’s temporary rules require the permit holder to
notify the state, “if it has or will adopt a sustainable energy use and energy conservation policy,”
(Ill. Admin. Code tit. 101-0027 (2019)). Additionally, in Massachusetts, the regulations require
the producers “demonstrate consideration” of efficiency requirements and development of an
energy conservation plan (Mass. Gen. Laws. ch. 935, §500.000 (2019)). Both states have taken
preliminary action to reduce energy consumption, but the industry requires stricter guidelines.
However, in Boulder, CO, cannabis producers are required to use renewable energy sources
(Boulder, CO Municipal Code § 6.16.8). Since states are starting to require renewable energy plans
and efficiency requirements, CO2 extraction could be the most viable environmentally friendly
solvent, if the regulations continue to significantly improve.

72
Dimethyl Ether
Recently, dimethyl ether (DME) has been studied as an alternative extraction solvent. The
technique uses liquefied DME to target compounds and remove water from wet materials. DME
is a non-toxic and cost-efficient alternative (Li & Makino, 2014). It is also derived from
biomaterial and easy to transport (Subratti et al., 2019). Furthermore, the European Food Safety
Authority has determined that there are no health concerns with regard to the use of DME as an
extraction solvent in food processing (Li & Makino, 2014).
DME is the simplest ether, with a chemical formula that is identical to ethanol (CH3OCH3).
It is a gas at standard room temperature and pressure. The boiling point of DME is -24.8°C, which
is lower than the boiling point of butane (-0.5°C). This means the DME is easier to remove from
the final product than butane (Li & Makino, 2014). DME is also more polar than butane, which
generates extractions with higher concentrations of terpenes. Since DME requires a lower pressure,
DME extraction would require less energy than supercritical CO2 extraction. To perform a DME
extraction, a temperature of 40°C is desirable for solvent evaporation at a pressure of 0.51 MPa
(Li & Makino, 2014); supercritical CO2 requires a temperature of 31.1℃ and a pressure of 7.39
MPa.
DME solvent extraction needs to be studied more before it is implemented on the industrial
scale. One study by Subratti et al. (2019) explored the use of DME as a method for obtaining hemp
seed oil from hulled hemp seeds. The results were promising in regard to oil yield, purity, and
recyclability. In comparison to conventional organic solvents, DME had a higher yield and less
chlorophyll contamination. The use of DME resulted in 25% and 31% yields for unground and
ground seeds, respectively (Subratti et al., 2019). In another study by Rapinel et al. (2018), DME
had the best efficiency with the highest yields for orange peel and lavender extractions compared
to other common solvents. The hemp seed oil study also concluded that nearly 100% of the DME
could be reused after each extraction cycle if implemented on the industrial scale with suitable
equipment (Subratti et al., 2019). Further studies evaluating the feasibility of DME extraction for
cannabis extraction need to be performed. It has not yet been determined if DME is suitable to
extract CBD or THC.
Water Reuse
Most of the environmental footprint of a cold water extraction comes from the water use
and the energy required to transport and treat the water. It is the only extraction process that directly
consumes water. An industrial cold water extraction requires approximately 7.87 gallons of water
to process one pound of plant mass. Assuming a cold water extractor is fed one pound of plant per
hour, eight hours a day for one year, the cold water extraction would require approximately 22,980
gallons per year. That is equivalent to 63 years’ worth of clean drinking water for an average
person.
It is unclear if the water used in this process is reused or disposed of. From the research, it
appears that the water is often reused by at-home producers, but each time the same water is reused,
a smaller yield is produced. Therefore, it is assumed that the water would not be reused on the
industrial scale. One potential way to reuse the extraction water is to recycle the nutrients in the
water by pouring it directly onto the cannabis plant or creating a foliar plant spray. Cold water
extraction water, commonly referred to as hash water, is rich in active enzymes, nutrients, and
minerals that are beneficial for cannabis plant growth (High Times, 2015).
Another option is to purify the water and reuse it for cold water extraction. Activated
carbon is a widely used adsorbent for water and wastewater treatment. It is an effective treatment

73
for removing organic and inorganic pollutants (Bhatnagar et al., 2013). Small-scale carbon filters
could be implemented in the cold water extraction process to recycle the water. Using an activated
carbon filter, the cold water extraction process could be designed as a closed-loop system, where
the water is continuously evaporated, condensed, and purified. Activated charcoal has already been
shown to remove large portions of chlorophyll, cannabinoids, and terpenes from extracts
(Hazekamp, & Romano, 2013). Activated carbon filters should be evaluated further for potential
water reuse applications.
Additional Considerations
Research should be conducted on potential uses for the chlorophyll and waxes produced
during the extraction process. Many of these byproducts are produced and disposed of. If a use for
the excess chlorophyll and/or waxes can be found, there may be a more sustainable disposal
method than sending it to landfills. However, the extraction method used to produce the byproducts
must be considered. Depending on the application of the byproducts, different extraction methods
may be preferred. Extraction methods that result in a high residual solvent concentration may not
be applicable for certain post-processing techniques of the chlorophyll and/or waxes.
74
References
Aladić, K., Jarni, K., Barbir, T., Vidović, S., Vladić, J., Bilić, M., & Jokić, S. (2015).
Supercritical CO2 extraction of hemp (Cannabis sativa L.) seed oil. Industrial Crops &
Products, 76, 472–478.
Al-Zouabi, I., Stogner, J. M., Miller, B. L., & Lane, E. S. (2018). Butane hash oil and dabbing:
insights into use, amateur production techniques, and potential harm mitigation.
Substance Abuse and Rehabilitation, 9, 91–101.
AS 03.306. Retrieved from
https://www.commerce.alaska.gov/web/amco/MarijuanaRegulations.aspx
Attard, T. M., McElroy, C. R., & Hunt, A. J. (2015). Economic assessment of supercritical CO2
extraction of waxes as part of a maize stover biorefinery. International journal of
molecular sciences, 16(8), 17546-17564.
Bhatnagar, A., Hogland, W., Marques, M., & Sillanpää, M. (2013). An overview of the
modification methods of activated carbon for its water treatment applications. Chemical
Engineering Journal, 219, 499-511.
Boulder, CO Municipal Code § 6.16.8. Retrieved from
https://library.municode.com/co/boulder/codes/municipal_code?nodeId=TIT6HESASA_
CH16REMA
Cal. Code Regs. tit. 16, § 8307 (2018). Retrieved from
https://leginfo.legislature.ca.gov/faces/codes_displayexpandedbranch.xhtml?tocCode=BP
C&division=10.&title=&part=&chapter=&article
Daniulaityte, R., Nahhas, R., Wijeratne, S., Carlson, R., Lamy, F., Martins, S., Sheth, A. (2015).
‘Time for dabs’: Analyzing Twitter data on marijuana concentrates across the U.S. Drug
and Alcohol Dependence, 155, 307–311.
Danfoss. (July 2008). Transcritical Refrigeration Systems with Carbon Dioxide (CO2). [PDF
File]. Retrieved from
http://files.danfoss.com/TechnicalInfo/Rapid/01/Article/Transcritical
Article/PZ000F102_ARTICLE_Transcritical%20Refrigeration%20Systems%20with%20
Carbon%20Dioxide%20(CO2).pdf
DC Safe Cannabis Sales Act of 2019. Retrieved from https://mayor.dc.gov/marijuana
He, T., Oks, M., Esposito, M., Steinberg, H., & Makaryus, M. (2017). “Tree-in-bloom”: severe
acute lung injury induced by vaping cannabis oil. Annals of the American Thoracic
Society, 14(3), 468-470.

75
High Times. (March 2015). Grow Hack: Reuse Your Ice Water Extract Flower Dregs and Water
The High Times. Retrieved from https://hightimes.com/grow/grow-hack-reuse-your-ice-
water-extract-flower-dregs-and-water/
Ill. Admin. Code tit. 101-0027 (2019). Retrieved from
http://www.ilga.gov/legislation/publicacts/101/101-0027.htm
June-Wells, M. (July 2018). Your Guide to Ethanol Extraction. Cannabis Business Times.
Retrieved from https://www.cannabisbusinesstimes.com/article/your-guide-to-ethanol-
extraction/
June-Wells, M. (May 2018). Your Guide To Hydrocarbon Extraction. Cannabis Business Times
Retrieved from ttps://www.cannabisbusinesstimes.com/article/your-guide-to-
hydrocarbon-extraction/
June-Wells, M. (March 2018). Your Guide to Supercritical Extraction. Cannabis Business
Times. Retrieved from https://www.cannabisbusinesstimes.com/article/your-guide-to-
supercritical-extraction/
Li, P., & Makino, H. (2014). Liquefied dimethyl ether: An energy-saving, green extraction
solvent. In Alternative Solvents for Natural Products Extraction (pp. 91-106). Springer,
Berlin, Heidelberg.
Mass. Gen. Laws. ch. 935, § 500.000 (2019). Retrieved from https://mass-cannabis-control.com
/wp-content/uploads/2019/01/SEC-OFFICIAL_935cmr500.pdf
MCL 333.27951-333.27967 (2018). Retrieved from
https://www.michigan.gov/lara/0,4601,7-154-89334_79571_95189---,00.html
Me. Stat. tit. 28-B (2016). Retrieved from
https://legislature.maine.gov/lawlibrary/recreational_marijuana_in_maine/9419
NRS 453D.130 (2017). Retrieved from https://www.leg.state.nv.us/NRS/NRS-453D.html
ORS 475B (2014). Retrieved from
https://www.oregon.gov/olcc/marijuana/Pages/Recreational-Marijuana-Laws-and-
Rules.aspx#Oregon_Revised_Statutes_-_Cannabis_Regulation
Raber, J. C., Elzinga, S., & Kaplan, C. (2015). Understanding dabs: contamination concerns of
cannabis concentrates and cannabinoid transfer during the act of dabbing. The Journal of
Toxicological Sciences, 40(6), 797-803.
Rapinel, V., Santerre, C., Hanaei, F., Belay, J., Vallet, N., Rakotomanomana, N., ... & Chemat,
F. (2018). Potentialities of using liquefied gases as alternative solvents to substitute
hexane for the extraction of aromas from fresh and dry natural products. Comptes Rendus
Chimie, 21(6), 590-605.

76
RCW 69.50.325 (2014). Retrieved from
http://mrsc.org/Home/Explore-Topics/Legal/Regulation/Marijuana-Regulation-in-
Washington-State.aspx
Romano, L. L., & Hazekamp, A. (2013). Cannabis oil: chemical evaluation of an upcoming
cannabis-based medicine. Cannabinoids, 1(1), 1-11.
Seltenrich, N. (2019). Cannabis Contaminants: Regulating Solvents, Microbes, and Metals in
Legal Weed. Environmental Health Perspectives, 127(8).
Subratti, A., Lalgee, L., & Jalsa, N. (2019). Liquified dimethyl ether (DME): A green solvent
for the extraction of hemp (Cannabis sativa L.) seed oil. Sustainable Chemistry and
Pharmacy, 12, 100144.
The Valens Company (2019). The Science of Extraction. Retrieved from
https://www.valensgroworks.com/blog/extraction-science/the-science-of-extraction/
United States Environmental Protection Agency (EPA). (n.d.) Greenhouse Gases Equivalencies
Calculator. Retrieved from https://www.epa.gov/energy/greenhouse-gases-equivalencies-
calculator-calculations-and-references.
United States Pharmacopeial Convention (USP). (n.d.). FAQs USP and its Standards.
Retrieved from https://www.usp.org/frequently-asked-questions/usp-and-its-standards
United States Pharmacopeial Convention (USP). (2007). 467 Residual Solvents In United States
Pharmacopeial Convention (Ed.), Chemical Tests (pp. 1-10). Retrieved from
https://www.uspnf.com/sites/default/files/usp_pdf/EN/USPNF/generalChapter467Current
VT H.511 Act 86 (2019). Retrieved from
https://legislature.vermont.gov/Documents/2020/Docs/BILLS/S-0054/S-
0054%20As%20passed%20by%20the%20Senate%20Official.pdf

77
Appendix A: Extraction Calculations Butane Extraction
Assumptions15
1. 0.15 lb extract/lb of plant mass
2. The equipment must be able to keep 25 kilograms of butane at -40°F
3. “Typical” extractor input of 4,500 g
4. In-line dewaxing requires a minimum temperature of -30°C (243.15 K)
5. Butane starts at STP
Knowns16
1. Butane has boiling point of -0.5°C (272.65 K)
2. Cv of butane is 1.57𝑘𝐽
𝑘𝑔∙𝐾
3. Hcondensation of butane = Hvaporization of butane = 386𝑘𝐽
𝑘𝑔
Calculations 25 𝑏𝑢𝑡𝑎𝑛𝑒 𝑚𝑎𝑠𝑠
4.5 𝑝𝑙𝑎𝑛𝑡 𝑚𝑎𝑠𝑠×
1 𝑙𝑏 𝑝𝑙𝑎𝑛𝑡 𝑚𝑎𝑠𝑠
0.15 𝑙𝑏 𝑒𝑥𝑡𝑟𝑎𝑐𝑡=
25 𝑏𝑢𝑡𝑎𝑛𝑒 𝑚𝑎𝑠𝑠
0.675 𝑙𝑏 𝑒𝑥𝑡𝑟𝑎𝑐𝑡
Gaseous butane is cooled from 298 K to 272.65 K
𝑄 = 𝑚𝐶𝑣 △ 𝑇
𝑄 =25 𝑙𝑏 𝑏𝑢𝑡𝑎𝑛𝑒
0.675 𝑙𝑏 𝑒𝑥𝑡𝑟𝑎𝑐𝑡× 1.57
𝑘𝐽
𝑘𝑔 ∙ 𝐾× (272.65 𝐾 − 298 𝐾) ×
0.436 𝑘𝑔
1 𝑙𝑏
𝑄 = 642.68𝑘𝐽
𝑙𝑏 𝑒𝑥𝑡𝑟𝑎𝑐𝑡
Gaseous butane is condensed at 272.65 K
𝑄 = 𝑚 × 𝐻𝑐𝑜𝑛𝑑𝑒𝑛𝑠𝑎𝑡𝑖𝑜𝑛
𝑄 =25 𝑙𝑏 𝑏𝑢𝑡𝑎𝑛𝑒
0.675 𝑙𝑏 𝑒𝑥𝑡𝑟𝑎𝑐𝑡× 386
𝑘𝐽
𝑘𝑔×
0.436 𝑘𝑔
1 𝑙𝑏
Q = 6233.19𝑘𝐽
𝑙𝑏 𝑒𝑥𝑡𝑟𝑎𝑐𝑡
Liquid butane is cooled from 272.65 K to 223.15 K (includes in-line dewaxing)
𝑄 = 𝑚𝐶𝑣 △ 𝑇
15June-Wells, M. (May 2018). Your Guide To Hydrocarbon Extraction. Retrieved from
https://www.cannabisbusinesstimes.com/article/your-guide- to-hydrocarbon-extraction
16Engineering Toolbox (n.d.). Retrieved from https://www.engineeringtoolbox.com/

78
𝑄 =25 𝑙𝑏 𝑏𝑢𝑡𝑎𝑛𝑒
0.675 𝑙𝑏 𝑒𝑥𝑡𝑟𝑎𝑐𝑡× 1.57
𝑘𝐽
𝑘𝑔 ∙ 𝐾× (223.15 𝐾 − 272.65 𝐾) ×
0.436 𝑘𝑔
1 𝑙𝑏
𝑄 = 1254.95𝑘𝐽
𝑙𝑏 𝑒𝑥𝑡𝑟𝑎𝑐𝑡
Liquid butane is heated from 233.15 K to 272.65 K
𝑄 = 𝑚𝐶𝑣 △ 𝑇
𝑄 =25 𝑙𝑏 𝑏𝑢𝑡𝑎𝑛𝑒
0.675 𝑙𝑏 𝑒𝑥𝑡𝑟𝑎𝑐𝑡× 1.57
𝑘𝐽
𝑘𝑔 ∙ 𝐾× (272.65 𝐾 − 223.15 𝐾) ×
0.436 𝑘𝑔
1 𝑙𝑏
𝑄 = 1254.95𝑘𝐽
𝑙𝑏 𝑒𝑥𝑡𝑟𝑎𝑐𝑡
Liquid butane is evaporated at 272.65 K
𝑄 = 𝑚 × 𝐻𝑣𝑎𝑝𝑜𝑟𝑖𝑧𝑎𝑡𝑖𝑜𝑛
𝑄 =25 𝑙𝑏 𝑏𝑢𝑡𝑎𝑛𝑒
0.675 𝑙𝑏 𝑒𝑥𝑡𝑟𝑎𝑐𝑡× 386
𝑘𝐽
𝑘𝑔×
0.436 𝑘𝑔
1 𝑙𝑏= 6233.19
𝑘𝐽
𝑙𝑏 𝑒𝑥𝑡𝑟𝑎𝑐𝑡
Total energy required
𝑄𝑡𝑜𝑡𝑎𝑙 = 642.68 + 6233.19 + 1254.95 + 1254.95 + 6233.19 = 15618.96𝑘𝐽
𝑙𝑏 𝑒𝑥𝑡𝑟𝑎𝑐𝑡
𝐸𝑛𝑒𝑟𝑔𝑦 𝑟𝑒𝑞𝑢𝑖𝑟𝑒𝑑 = 15618.96𝑘𝐽
𝑙𝑏 𝑒𝑥𝑡𝑟𝑎𝑐𝑡×
1 𝑘𝑊ℎ
3600 𝑘𝐽= 4.34
𝑘𝑊ℎ
𝑙𝑏 𝑒𝑥𝑡𝑟𝑎𝑐𝑡
Butane extractions typically do not undergo winterization. Rather, in-line dewaxing is performed,
where the temperature of the mixture is brought to a minimum of -30°C (243.15 K), which is
accounted for in the calculations.
Ethanol Extraction
Assumptions17
1. 1 g THC/1 mL of ethanol
2. 0.6 gal ethanol/lb of plant mass
3. 1 g THC = 1 g of extract
4. Ethanol starts at STP
Knowns16
4. Ethanol has a boiling point of 78.39 ℃ (351.539 K)
5. Cv of ethanol is 2.18𝑘𝐽
𝑘𝑔∙𝐾
17June-Wells, M. (July 2018). Your Guide to Ethanol Extraction. Cannabis Business Times. Retrieved from
https://www.cannabisbusinesstimes.com/article/your-guide-to-ethanol-extraction/

79
6. Hcondensation of ethanol = Hvaporization of ethanol = 919𝒌𝑱
𝒌𝒈
Calculations: 1 𝑔 𝑒𝑥𝑡𝑟𝑎𝑐𝑡
1 𝑚𝐿 𝑒𝑡ℎ𝑎𝑛𝑜𝑙×
0.6 𝑔𝑎𝑙 𝑒𝑡ℎ𝑎𝑛𝑜𝑙
1 𝑙𝑏 𝑝𝑙𝑎𝑛𝑡 𝑚𝑎𝑠𝑠×
3785.412 𝑚𝐿
1 𝑔𝑎𝑙×
1 𝑙𝑏
453.592 𝑔
= 1 𝑙𝑏 𝑒𝑥𝑡𝑟𝑎𝑐𝑡
5.0007247041 𝑙𝑏 𝑝𝑙𝑎𝑛𝑡 𝑚𝑎𝑠𝑠= 0.1997
𝑙𝑏 𝑝𝑙𝑎𝑛𝑡 𝑚𝑎𝑠𝑠
𝑙𝑏 𝑒𝑥𝑡𝑟𝑎𝑐𝑡
0.6 𝑔𝑎𝑙 𝑒𝑡ℎ𝑎𝑛𝑜𝑙
1 𝑙𝑏 𝑝𝑙𝑎𝑛𝑡 𝑚𝑎𝑠𝑠×
6.59 𝑙𝑏 𝑒𝑡ℎ𝑎𝑛𝑜𝑙
1 𝑔𝑎𝑙 𝑒𝑡ℎ𝑎𝑛𝑜𝑙= 3.954
𝑙𝑏 𝑒𝑡ℎ𝑎𝑛𝑜𝑙
𝑙𝑏 𝑝𝑙𝑎𝑛𝑡 𝑚𝑎𝑠𝑠
3.954 𝑙𝑏 𝑒𝑡ℎ𝑎𝑛𝑜𝑙
1 𝑙𝑏 𝑝𝑙𝑎𝑛𝑡 𝑚𝑎𝑠𝑠 ×
0.1997 𝑙𝑏 𝑝𝑙𝑎𝑛𝑡 𝑚𝑎𝑠𝑠
𝑙𝑏 𝑒𝑥𝑡𝑟𝑎𝑐𝑡= 0.7896
𝑙𝑏 𝑒𝑡ℎ𝑎𝑛𝑜𝑙
𝑙𝑏 𝑒𝑥𝑡𝑟𝑎𝑐𝑡
Ethanol extraction can be performed at STP or under cooled conditions. STP ethanol extraction
does not require any energy due to the lack of temperature or phase change, therefore the only
energy required for STP ethanol extraction is the energy required to remove the residual ethanol.
Ethanol extractions are not typically performed at STP on an industrial scale, therefore this analysis
focuses on cooled ethanol extraction.
Liquid ethanol is cooled from 298 K to 253 K
𝑄 = 𝑚𝐶𝑣 △ 𝑇
𝑄 = 0.7896𝑙𝑏 𝑒𝑡ℎ𝑎𝑛𝑜𝑙
𝑙𝑏 𝑒𝑥𝑡𝑟𝑎𝑐𝑡× 2.18
𝑘𝐽
𝑘𝑔 ∙ 𝐾× (253 𝐾 − 298 𝐾) ×
0.436 𝑘𝑔
1 𝑙𝑏= 33.77
𝑘𝐽
𝑙𝑏 𝑒𝑥𝑡𝑟𝑎𝑐𝑡
Liquid ethanol is heated from 253 K to 351.539 K
𝑄 = 𝑚𝐶𝑣 △ 𝑇
𝑄 = 0.7896𝑙𝑏 𝑒𝑡ℎ𝑎𝑛𝑜𝑙
𝑙𝑏 𝑒𝑥𝑡𝑟𝑎𝑐𝑡
𝑙𝑏 𝑒𝑡ℎ𝑎𝑛𝑜𝑙
𝑙𝑏 𝑒𝑥𝑡𝑟𝑎𝑐𝑡× 2.18
𝑘𝐽
𝑘𝑔 ∙ 𝐾× (253 𝐾 − 351.539 𝐾) ×
0.436 𝑘𝑔
1 𝑙𝑏
𝑄 = 73.95𝑘𝐽
𝑙𝑏 𝑒𝑥𝑡𝑟𝑎𝑐𝑡
Liquid ethanol is evaporated at 351.539 K
𝑄 = 𝑚 × 𝐻𝑣𝑎𝑝𝑜𝑟𝑖𝑧𝑎𝑡𝑖𝑜𝑛
𝑄 = 0.7896𝑙𝑏 𝑒𝑡ℎ𝑎𝑛𝑜𝑙
𝑙𝑏 𝑒𝑥𝑡𝑟𝑎𝑐𝑡× 919
𝑘𝐽
𝑘𝑔×
0.436 𝑘𝑔
1 𝑙𝑏= 316.38
𝑘𝐽
𝑙𝑏 𝑒𝑥𝑡𝑟𝑎𝑐𝑡
Gaseous ethanol is condensed at 351.539 K
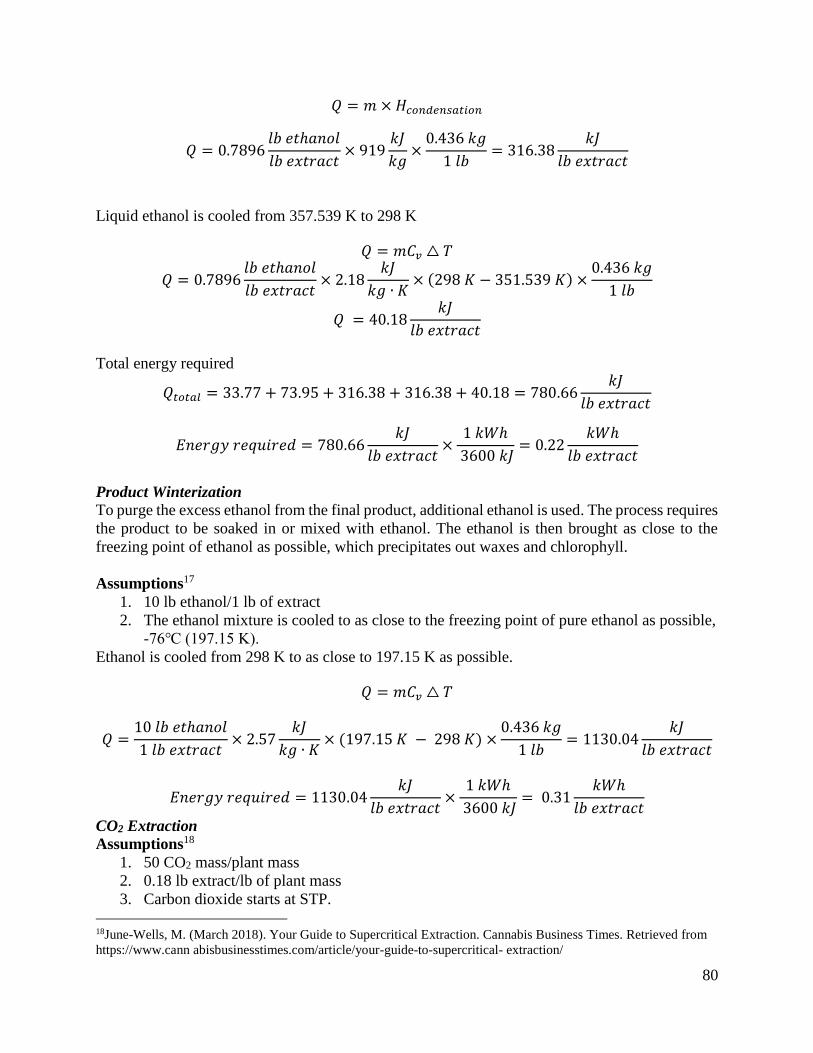
80
𝑄 = 𝑚 × 𝐻𝑐𝑜𝑛𝑑𝑒𝑛𝑠𝑎𝑡𝑖𝑜𝑛
𝑄 = 0.7896𝑙𝑏 𝑒𝑡ℎ𝑎𝑛𝑜𝑙
𝑙𝑏 𝑒𝑥𝑡𝑟𝑎𝑐𝑡× 919
𝑘𝐽
𝑘𝑔×
0.436 𝑘𝑔
1 𝑙𝑏= 316.38
𝑘𝐽
𝑙𝑏 𝑒𝑥𝑡𝑟𝑎𝑐𝑡
Liquid ethanol is cooled from 357.539 K to 298 K
𝑄 = 𝑚𝐶𝑣 △ 𝑇
𝑄 = 0.7896𝑙𝑏 𝑒𝑡ℎ𝑎𝑛𝑜𝑙
𝑙𝑏 𝑒𝑥𝑡𝑟𝑎𝑐𝑡× 2.18
𝑘𝐽
𝑘𝑔 ∙ 𝐾× (298 𝐾 − 351.539 𝐾) ×
0.436 𝑘𝑔
1 𝑙𝑏
𝑄 = 40.18𝑘𝐽
𝑙𝑏 𝑒𝑥𝑡𝑟𝑎𝑐𝑡
Total energy required
𝑄𝑡𝑜𝑡𝑎𝑙 = 33.77 + 73.95 + 316.38 + 316.38 + 40.18 = 780.66𝑘𝐽
𝑙𝑏 𝑒𝑥𝑡𝑟𝑎𝑐𝑡
𝐸𝑛𝑒𝑟𝑔𝑦 𝑟𝑒𝑞𝑢𝑖𝑟𝑒𝑑 = 780.66𝑘𝐽
𝑙𝑏 𝑒𝑥𝑡𝑟𝑎𝑐𝑡×
1 𝑘𝑊ℎ
3600 𝑘𝐽= 0.22
𝑘𝑊ℎ
𝑙𝑏 𝑒𝑥𝑡𝑟𝑎𝑐𝑡
Product Winterization
To purge the excess ethanol from the final product, additional ethanol is used. The process requires
the product to be soaked in or mixed with ethanol. The ethanol is then brought as close to the
freezing point of ethanol as possible, which precipitates out waxes and chlorophyll.
Assumptions17
1. 10 lb ethanol/1 lb of extract
2. The ethanol mixture is cooled to as close to the freezing point of pure ethanol as possible,
-76℃ (197.15 K).
Ethanol is cooled from 298 K to as close to 197.15 K as possible.
𝑄 = 𝑚𝐶𝑣 △ 𝑇
𝑄 =10 𝑙𝑏 𝑒𝑡ℎ𝑎𝑛𝑜𝑙
1 𝑙𝑏 𝑒𝑥𝑡𝑟𝑎𝑐𝑡× 2.57
𝑘𝐽
𝑘𝑔 ∙ 𝐾× (197.15 𝐾 − 298 𝐾) ×
0.436 𝑘𝑔
1 𝑙𝑏= 1130.04
𝑘𝐽
𝑙𝑏 𝑒𝑥𝑡𝑟𝑎𝑐𝑡
𝐸𝑛𝑒𝑟𝑔𝑦 𝑟𝑒𝑞𝑢𝑖𝑟𝑒𝑑 = 1130.04𝑘𝐽
𝑙𝑏 𝑒𝑥𝑡𝑟𝑎𝑐𝑡×
1 𝑘𝑊ℎ
3600 𝑘𝐽= 0.31
𝑘𝑊ℎ
𝑙𝑏 𝑒𝑥𝑡𝑟𝑎𝑐𝑡
CO2 Extraction
Assumptions18
1. 50 CO2 mass/plant mass
2. 0.18 lb extract/lb of plant mass
3. Carbon dioxide starts at STP.
18June-Wells, M. (March 2018). Your Guide to Supercritical Extraction. Cannabis Business Times. Retrieved from
https://www.cann abisbusinesstimes.com/article/your-guide-to-supercritical- extraction/
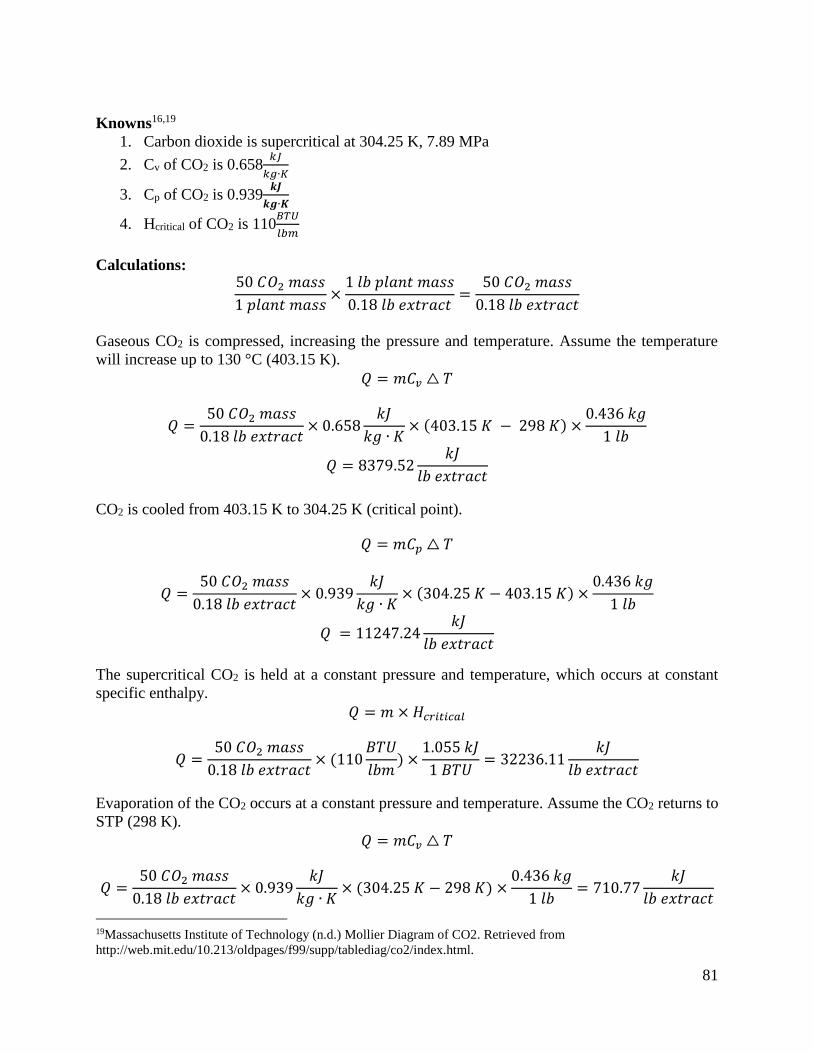
81
Knowns16,19
1. Carbon dioxide is supercritical at 304.25 K, 7.89 MPa
2. Cv of CO2 is 0.658𝑘𝐽
𝑘𝑔∙𝐾
3. Cp of CO2 is 0.939𝒌𝑱
𝒌𝒈∙𝑲
4. Hcritical of CO2 is 110𝐵𝑇𝑈
𝑙𝑏𝑚
Calculations: 50 𝐶𝑂2 𝑚𝑎𝑠𝑠
1 𝑝𝑙𝑎𝑛𝑡 𝑚𝑎𝑠𝑠×
1 𝑙𝑏 𝑝𝑙𝑎𝑛𝑡 𝑚𝑎𝑠𝑠
0.18 𝑙𝑏 𝑒𝑥𝑡𝑟𝑎𝑐𝑡=
50 𝐶𝑂2 𝑚𝑎𝑠𝑠
0.18 𝑙𝑏 𝑒𝑥𝑡𝑟𝑎𝑐𝑡
Gaseous CO2 is compressed, increasing the pressure and temperature. Assume the temperature
will increase up to 130 °C (403.15 K).
𝑄 = 𝑚𝐶𝑣 △ 𝑇
𝑄 =50 𝐶𝑂2 𝑚𝑎𝑠𝑠
0.18 𝑙𝑏 𝑒𝑥𝑡𝑟𝑎𝑐𝑡× 0.658
𝑘𝐽
𝑘𝑔 ∙ 𝐾× (403.15 𝐾 − 298 𝐾) ×
0.436 𝑘𝑔
1 𝑙𝑏
𝑄 = 8379.52𝑘𝐽
𝑙𝑏 𝑒𝑥𝑡𝑟𝑎𝑐𝑡
CO2 is cooled from 403.15 K to 304.25 K (critical point).
𝑄 = 𝑚𝐶𝑝 △ 𝑇
𝑄 =50 𝐶𝑂2 𝑚𝑎𝑠𝑠
0.18 𝑙𝑏 𝑒𝑥𝑡𝑟𝑎𝑐𝑡× 0.939
𝑘𝐽
𝑘𝑔 ∙ 𝐾× (304.25 𝐾 − 403.15 𝐾) ×
0.436 𝑘𝑔
1 𝑙𝑏
𝑄 = 11247.24𝑘𝐽
𝑙𝑏 𝑒𝑥𝑡𝑟𝑎𝑐𝑡
The supercritical CO2 is held at a constant pressure and temperature, which occurs at constant
specific enthalpy.
𝑄 = 𝑚 × 𝐻𝑐𝑟𝑖𝑡𝑖𝑐𝑎𝑙
𝑄 =50 𝐶𝑂2 𝑚𝑎𝑠𝑠
0.18 𝑙𝑏 𝑒𝑥𝑡𝑟𝑎𝑐𝑡× (110
𝐵𝑇𝑈
𝑙𝑏𝑚) ×
1.055 𝑘𝐽
1 𝐵𝑇𝑈= 32236.11
𝑘𝐽
𝑙𝑏 𝑒𝑥𝑡𝑟𝑎𝑐𝑡
Evaporation of the CO2 occurs at a constant pressure and temperature. Assume the CO2 returns to
STP (298 K).
𝑄 = 𝑚𝐶𝑣 △ 𝑇
𝑄 =50 𝐶𝑂2 𝑚𝑎𝑠𝑠
0.18 𝑙𝑏 𝑒𝑥𝑡𝑟𝑎𝑐𝑡× 0.939
𝑘𝐽
𝑘𝑔 ∙ 𝐾× (304.25 𝐾 − 298 𝐾) ×
0.436 𝑘𝑔
1 𝑙𝑏= 710.77
𝑘𝐽
𝑙𝑏 𝑒𝑥𝑡𝑟𝑎𝑐𝑡
19Massachusetts Institute of Technology (n.d.) Mollier Diagram of CO2. Retrieved from
http://web.mit.edu/10.213/oldpages/f99/supp/tablediag/co2/index.html.

82
Total energy required:
𝑄𝑡𝑜𝑡𝑎𝑙 = 8379.52 + 11247.24 + 32236.11 + 710.77 = 52573.64𝑘𝐽
𝑙𝑏 𝑒𝑥𝑡𝑟𝑎𝑐𝑡
𝐸𝑛𝑒𝑟𝑔𝑦 𝑟𝑒𝑞𝑢𝑖𝑟𝑒𝑑 = 52573.64𝑘𝐽
𝑙𝑏 𝑒𝑥𝑡𝑟𝑎𝑐𝑡×
1 𝑘𝑊ℎ
3600 𝑘𝐽= 14.60
𝑘𝑊ℎ
𝑙𝑏 𝑒𝑥𝑡𝑟𝑎𝑐𝑡
Product Winterization
To purge the excess CO2 from the final product, ethanol is used. The process requires the product
to be soaked in or mixed with ethanol. The ethanol is then brought as close to the freezing point
of ethanol as possible, which precipitates out waxes.
Assumptions4
3. 10 lb ethanol/1 lb of extract
4. The ethanol mixture is cooled to as close to the freezing point of pure ethanol as possible,
-76 ℃ (197.15 K).
Ethanol is cooled from 298 K to as close to 197.15 K as possible.
𝑄 = 𝑚𝐶𝑣 △ 𝑇
𝑄 =10 𝑙𝑏 𝑒𝑡ℎ𝑎𝑛𝑜𝑙
1 𝑙𝑏 𝑒𝑥𝑡𝑟𝑎𝑐𝑡× 2.57
𝑘𝐽
𝑘𝑔 ∙ 𝐾× (197.15 𝐾 − 298 𝐾) ×
0.436 𝑘𝑔
1 𝑙𝑏= 1130.04
𝑘𝐽
𝑙𝑏 𝑒𝑥𝑡𝑟𝑎𝑐𝑡
𝐸𝑛𝑒𝑟𝑔𝑦 𝑟𝑒𝑞𝑢𝑖𝑟𝑒𝑑 = 1130.04𝑘𝐽
𝑙𝑏 𝑒𝑥𝑡𝑟𝑎𝑐𝑡×
1 𝑘𝑊ℎ
3600 𝑘𝐽= 0.31
𝑘𝑊ℎ
𝑙𝑏 𝑒𝑥𝑡𝑟𝑎𝑐𝑡
Cold Water Extraction
Assumptions20,21
1. 1 lb of plant/0.15 lb of extract
2. 6-8 gallons of water per 1.5 lb of plant mass
3. 40 lbs of ice per 6-8 gallons of water
4. Each pound of ice produces about 0.12 gallons of water = 4.8 gal of water
5. Water begins at STP.
6. Ice begins at 0 °C (273.15 K) and standard pressure.
Knowns16,22
1. 3300-3600 kWh to treat and transport a million gallons of water
2. The temperature the an ice-water mixture is 14.8 °C (287.95 K)
20Fourside, S. (n.d.). Solventless Extraction Showdown- Bubble Hash vs. Dry-Ice Hash. Retrieved from
https://www.growweedeasy.com/bubble-hash-vs-dry-ice-hash 21Eberbach Corporation. (n.d.). E5703.IWE Ice Water Extractor. Retrieved from
https://www.eberbachlabtools.com/Lab-Apparatus/E5703-Ice-Water-Extractor.html 22Copeland, C. & Carter, N. (January 2017). Energy-Water Nexus: The Water Sector’s Energy Use. Retrieved from
https://fas.org/sgp/crs/misc/R43200.pdf

83
Calculations: 11.8 𝑔𝑎𝑙 𝑤𝑎𝑡𝑒𝑟
1.5 𝑙𝑏 𝑝𝑙𝑎𝑛𝑡 𝑚𝑎𝑠𝑠×
1 𝑙𝑏 𝑝𝑙𝑎𝑛𝑡 𝑚𝑎𝑠𝑠
0.15 𝑙𝑏 𝑒𝑥𝑡𝑟𝑎𝑐𝑡= 52.44
𝑔𝑎𝑙 𝑤𝑎𝑡𝑒𝑟
𝑙𝑏 𝑒𝑥𝑡𝑟𝑎𝑐𝑡
The ice-water mixture is cooled from 287.95 K to 273.15 K.
𝑄 = 𝑚𝐶𝑝 △ 𝑇
𝑄 = 52.44𝑔𝑎𝑙 𝑤𝑎𝑡𝑒𝑟
𝑙𝑏 𝑒𝑥𝑡𝑟𝑎𝑐𝑡× 4.19
𝑘𝐽
𝑘𝑔 ∙ 𝐾× (273.15 𝐾 − 287.95 𝐾) ×
0.436 𝑘𝑔
1 𝑙𝑏
= 1417.83𝑘𝐽
𝑙𝑏 𝑒𝑥𝑡𝑟𝑎𝑐𝑡
Energy required to cool the ice-water mixture.
1417.83𝑘𝐽
𝑙𝑏 𝑒𝑥𝑡𝑟𝑎𝑐𝑡×
1 𝑘𝑊ℎ
3600 𝑘𝐽= 0.39
𝑘𝑊ℎ
𝑙𝑏 𝑒𝑥𝑡𝑟𝑎𝑐𝑡
Energy required to transport and treat water needed for extraction process.
52.44𝑔𝑎𝑙 𝑤𝑎𝑡𝑒𝑟
𝑙𝑏 𝑒𝑥𝑡𝑟𝑎𝑐𝑡× 3450
𝑘𝑊ℎ
𝑚𝑖𝑙𝑙𝑖𝑜𝑛 𝑔𝑎𝑙 𝑜𝑓 𝑤𝑎𝑡𝑒𝑟×
1 𝑚𝑖𝑙𝑙𝑖𝑜𝑛 𝑔𝑎𝑙
106 𝑔𝑎𝑙= 0.18
𝑘𝑊ℎ
𝑙𝑏 𝑒𝑥𝑡𝑟𝑎𝑐𝑡
Total energy required.
𝐸𝑛𝑒𝑟𝑔𝑦 𝑟𝑒𝑞𝑢𝑖𝑟𝑒𝑑 = 0.39𝑘𝑊ℎ
𝑙𝑏 𝑒𝑥𝑡𝑟𝑎𝑐𝑡+ 0.18
𝑘𝑊ℎ
𝑙𝑏 𝑒𝑥𝑡𝑟𝑎𝑐𝑡= 0.57
𝑘𝑊ℎ
𝑙𝑏 𝑒𝑥𝑡𝑟𝑎𝑐𝑡
Food Extractions
Assumptions23
1. 0.48 lb/0.02 lb plant
Knowns16, 23
1. Cp of vegetable oil is 1.67𝑘𝐽
𝑘𝑔∙𝐾
2. Cp of olive oil is 1.97𝑘𝐽
𝑘𝑔∙𝐾
3. The average Cp is 1.82𝑘𝐽
𝑘𝑔∙𝐾
4. 1 cup of vegetable oil is 218 grams (0.48 lbs)
5. 1 cup of cannabis is 7 grams (0.02 lbs)
6. The temperature cannot exceed 118 °C (391.15 K). This is the temperature at which THC
burns.
23CannaConection. (February 2019). How to Make Cannabis Infused Olive Oil. Retrieved from
https://www.cannaconnection.com/blog/17441-how-make-cannabis-infused-olive-oil

84
Calculations: 0.48 𝑙𝑏 𝑜𝑖𝑙
0.02 𝑙𝑏 𝑝𝑙𝑎𝑛𝑡×
1𝑙𝑏 𝑒𝑥𝑡𝑟𝑎𝑐𝑡
1 𝑙𝑏 𝑜𝑖𝑙= 24
𝑙𝑏 𝑜𝑖𝑙
𝑙𝑏 𝑒𝑥𝑡𝑟𝑎𝑐𝑡
Energy required to heat the oil from STP to 391.15 K.
𝑄 = 𝑚𝐶𝑝 △ 𝑇
𝑄 = 24𝑙𝑏 𝑜𝑓 𝑜𝑖𝑙
𝑙𝑏 𝑒𝑥𝑡𝑟𝑎𝑐𝑡× 1.82
𝑘𝐽
𝑘𝑔 ∙ 𝐾× (391.15 𝐾 − 298 𝐾) ×
0.436 𝑘𝑔
1 𝑙𝑏= 1773.99
𝑘𝐽
𝑙𝑏 𝑒𝑥𝑡𝑟𝑎𝑐𝑡
Total energy required.
𝐸𝑛𝑒𝑟𝑔𝑦 𝑟𝑒𝑞𝑢𝑖𝑟𝑒𝑑 = 1773.99𝑘𝐽
𝑙𝑏 𝑒𝑥𝑡𝑟𝑎𝑐𝑡×
1 𝑘𝑊ℎ
3600 𝑘𝐽= 0.49
𝑘𝑊ℎ
𝑙𝑏 𝑒𝑥𝑡𝑟𝑎𝑐𝑡
Note: This is the amount of energy required to produce one pound of extract. In this scenario, one
pound of “extract” is equivalent to one pound of product. One pound of product is considered one
pound of infused oil.

85
Chapter 6: Air Emissions
Introduction The regulations for air emissions from the cannabis industry vary widely across the
country. Since some states exempt agricultural activities from air emission standards, the
cultivation portion of the industry is not regulated while the extraction process is. Cannabis plants
naturally emit odors and volatile organic compounds as they grow (Wang et al., 2019a; Wang et
al., 2019b). Volatile organic compounds are also emitted during solvent-based extraction processes
(Urso, 2019). Research shows that both the cultivation process and extraction process contribute
to decreased air quality. Air emissions from the cannabis industry can be categorized by odor,
volatile organic compounds, and carbon dioxide. A series of air pollution control technologies can
be used to mitigate the effects of the cannabis industry on air quality.
Odor Across the country, the cannabis industry is facing challenges due to odor complaints.
When recreational cannabis was legalized in California, odor was not a main concern for
lawmakers. However, as the amount of cannabis facilities has increased, so has the number of odor
complaints. For example, residents in Sonoma County are suing to ban cannabis operations from
their neighborhoods. Residents in Mendocino County established zones where cannabis
cultivation is banned (Fuller, 2018). In Yamhill County, OR, cannabis growers are being sued by
a vineyard that claims the “odors would damage wine grapes with ‘foul-smelling particles’” (The
Associated Press, 2017a). In Carbondale, CO, a cannabis business was summoned for a permit
revocation hearing after numerous odor complaints were filed over the course of a year
(Summerlin, 2018). As a response to odor complaints in Spokane County, WA, cannabis farms
have to register with an air pollution agency (The Associated Press, 2017b).
The characteristic odor associated with cannabis is attributed to the release of chemical
compounds into the air known as terpenes. Terpenes are fragrant oils secreted by plants, and some
insects, to ward off predators and attract pollinators (Marinho et al., 2014). Cannabis plants
produce over 150 different terpenes. Terpenes are a group of highly reactive volatile organic
compounds that contribute to the formation of ozone and particulate matter in the atmosphere
(Booth & Bohlmann, 2019). Terpenes are naturally emitted by the cannabis plants during
cultivation.
Despite attempts to regulate it, odors remain one of the top air pollution complaints to
regulators and government bodies (McGinley et al., 2000). A major problem for local governments
trying to legislate cannabis odors is that there is no objective standard for scents. Odor is a
subjective experience that varies from person to person, but regulating odor requires objective and
reproducible measurement techniques (SRF Consulting Group, 2004). Furthermore, there are no
federal regulations for odor. Odors are classified as non-criteria pollutants by the EPA. Therefore,
odor control regulations are set by state and local air pollution control agencies (Leonardos, 1974).
Odor regulations, or “odor laws,” vary from state to state. To establish odor laws, one or several
criteria are utilized. Common criteria that are used are: annoyance criteria, complaint criteria,
ambient odor detection threshold criteria, ambient odor intensity criteria, episode duration-
frequency criteria, source emission criteria, and best available control technology criteria
(McGinley et al., 2000).

86
Regulations for odor related to cannabis production vary on the state, regional, and local
level. In Santa Barbara County Air Pollution Control District, under Section 41705 of the
California Health and Safety Code, District Rule 30, the discharge of air contaminants, including
odors, does not apply to odors emitted from agricultural operations. Since cannabis cultivation is
considered an agricultural operation, it is exempt from odor regulations. However, the rule still
applies to all other cannabis operations that are not related to agricultural operations. This includes
cannabis oil extraction manufacturing operations, retail storefronts, and smoking lounges (APCD,
2019). In Colorado, cannabis cultivation is exempt from the state Air Pollution Emission Notice
and permitting requirements because it is an agricultural activity (DDPHE-CSWG, 2018). Some
states and municipalities are addressing these inconsistent or lacking regulations for odor related
to cannabis production. The City and County of Denver chose to update its odor ordinance in order
to require cannabis cultivation facilities to control their odor emissions (DDEH, n.d.).
Additionally, Denver has implemented fines if “five or more complaints from individual residents
representing separate households within a 12-hour period and the complaints are related to a single
odor source,” which range from $150 to $2000 (Bender, 2020). Many regulators are choosing to
impose hefty fines for companies that transmit perceptible odors to reduce the risk of odor
complaints. Other states, including Oregon, Washington, and Iowa, require odor control plans or
clean air permits as part of the licensing process to reduce odor emissions (Hammon, 2018).
As the number of cannabis facilities continues to increase, it is expected that the number
of odor complaints will increase as well. To avoid the controversy surrounding odor and cannabis
production, regulators need to establish consistent and clear guidelines. Facilities need to be aware
of the standards that must be followed. Clear and consistent regulations will provide a baseline for
cannabis facilities to follow and prevent heavy fines. Furthermore, a feasible odor control standard
may help mitigate community complaints and help ease tension between the industry and
surrounding communities.
Volatile Organic Compounds Volatile organic compounds (VOCs) are defined by the EPA as “any compound of carbon,
excluding carbon monoxide, carbon dioxide, carbonic acid, metallic carbides or carbonates and
ammonium carbonate, which participates in atmospheric photochemical reactions, except those
designated by EPA as having negligible photochemical reactivity” (EPA, 2017). They are more
generally recognized as “organic chemical compounds whose composition makes it possible for
them to evaporate under normal indoor atmospheric conditions of temperature and pressure” (EPA,
2017). VOCs react with other urban air constituents (nitrogen oxides NOx, hydroxyl radicals) to
create ozone (O3), particulate matter, and secondary VOCs (e.g., formaldehyde and acrolein) at
the tropospheric level and negatively impact air quality (Samburova et al., 2019). The speed of
these reactions is increased by UV radiation and therefore ozone concentrations tend to be higher
on hot days (EPA, 2019a). Tropospheric ozone can irritate the respiratory tract, reduce lung
function, and aggravate asthma (EPA, 2019b). At the stratospheric level, VOCs have the opposite
effect, where they can deplete the ozone layer and contribute to climate change (Aldrich, 2005).
VOCs from the cannabis industry are categorized by biogenic and anthropogenic VOCs.
Biogenic VOCs (BVOCs) are emitted by the cannabis plants, which include terpenes like β-
myrcene, D-limonene, and α-pinene (Samburova et al., 2019). Anthropogenic VOCs are emitted
from the use of hydrocarbon and alcohol solvents in extraction facilities. Cannabis cultivation and
extraction facilities are largely constructed in urbanized areas, where they are located close to
sources of nitrogen oxides (Samburova et al., 2019). This contributes to the creation of

87
tropospheric ozone. There have been several studies researching the potential impacts cannabis
facilities have on air quality (Samburova et al., 2019; Wang et al., 2019b; Mills, 2012; Wang et
al., 2019a). One study conducted in cannabis facilities in California and Nevada determined that
the VOCs emitted by cannabis plants could produce tropospheric ozone at a rate of approximately
2.6 grams per plant per day (Samburova et al., 2019).
Tropospheric ozone is regulated under the National Ambient Air Quality Standards
(NAAQS) under the Clean Air Act (CAA). It is classified as both a primary and secondary
standard, meaning that it protects both public health and welfare. NAAQS requires that the annual
fourth-highest daily maximum tropospheric ozone 8-hour concentration must not exceed 0.070
ppm when averaged over 3 years (40 CFR Part 50). The EPA set this limit to prevent the harmful
health effects associated with high concentrations of ozone.
The EPA directly regulates VOC emissions for some industries under 40 CFR 59, the
National Volatile Organic Compound Emission Standards for Consumer and Commercial
Products. However, these regulations target the largest contributors of VOC emissions: aerosol
coatings, architectural coatings, automobile refinish coatings, and consumer products. With the
exception of these industries, VOCs are not regulated on the federal level. States and local
governments have established VOC regulations in order to meet federal ozone requirements.
However, these regulations often omit agricultural contributors such as cannabis cultivation
facilities.
Regions or counties that fail to meet the federal standards are then classified as
nonattainment zones under the CAA (P.L. 91-604, Sec. 109). When a region is classified as a
nonattainment zone, the state and local governments are required to develop a plan that details
how the region will identify the sources of air pollution and how they will meet NAAQS (EPA,
2019a). In 2008 and 2015, the Denver Metro/North Front Range and Denver-Boulder-Greeley-Ft.
Collins-Loveland regions in Colorado both failed the 8-Hour Ozone concentrations. These regions
are designated as marginal and serious nonattainment zones, respectively (EPA, 2020).
Case Study: Colorado
Research suggests that the concentrated presence of cannabis facilities in Denver are
producing rates of BVOCs and VOCs that are high enough to affect the local air quality. As of
January 1, 2020, there are 685 recreational cannabis cultivation facilities and 288 recreational
cannabis product manufacturers in Colorado (Colorado Department of Revenue, 2020). In 2018,
41% of all cannabis cultivation facilities are located in Denver County, CO (Wang et al., 2019b).
The distribution of facilities can be seen in Figure 6.1.

88
Figure 6.1. Cannabis Cultivation Facilities in Colorado 2017 (Urso, 2019)24.
In Colorado, agricultural facilities are exempt from air emissions standards, which include
both indoor and outdoor cannabis cultivation facilities (CRS Title 25. Health § 25-7-109: 8a). The
regulations do not account for the fact that indoor cannabis cultivation facilities are considered
point-sources of air pollution. However, cannabis extraction facilities are regulated under 5 CCR
1001-9 Regulation 7 (Control of ozone via ozone precursors and control of hydrocarbons via oil
and gas emissions). The regulations vary based on a facility’s annual emissions levels and detail
how to minimize the amount of VOCs that escape from a facility. According to the Colorado
Department of Health and Environment, many of the cannabis extraction facilities in Colorado are
unaware of the standards they must follow and are in noncompliance (Urso, 2019). Under state
regulations, it is the responsibility of the business to calculate an estimation of their VOC
emissions from solvent extraction (Denver Department of Public Health, 2018).
Several studies have researched the extent the cannabis industry contributes to poor air
quality in Colorado. A study was conducted in Denver to estimate the extent of air quality impacts
from cannabis cultivation facilities by using an air quality model to predict regional ozone impacts.
They determined that the range of possible emissions in Colorado from terpenes was 66–657 t
yr− 1, half of which came from Denver County (Wang et al., 2019b). Model predictions suggest
that an increase in 1,000 metric tons of terpenes a year results in a 130 ppb increase in daytime
hourly ozone concentrations and a maximum daily 8-hour ozone average of 0.30 ppb (Wang et al.,
2019b). Another study in Denver found that there was large variability between the BVOC
emissions of different cannabis strains, with some emitting almost twice as much as others. (Wang
et al., 2019a).
24 In this figure, the green stars are cannabis cultivation facilities, the reddish brown outlined regions are the state’s
environmental justice priority areas, and the green shaded region is the Denver nonattainment zone.

89
The Denver models show that the levels of ozone in the atmosphere are correlated with the
emission rates from cannabis facilities (Wang et al., 2019b). However, the rate of emissions from
the facilities are too uncertain to fully understand the impacts of cannabis facilities on air quality.
Although several studies have researched the impacts of cultivation facilities on air quality, there
has been little documented research on the impacts from extraction activities. Since edibles are the
largest growing sector of the cannabis industry (New Frontier Data, 2019), more research needs to
be conducted to determine the impact of extraction facilities on VOC emissions. As the entire
cannabis industry continues to grow, so will the emission rates of VOCs. If the emissions rates
continue to increase without regulations, there may be significant ramifications on air quality
(Wang et al., 2019b). More research is required to determine the VOC emission rates from
cannabis cultivation facilities and extraction facilities, as well as the impacts on ozone levels and
public health.
Carbon Dioxide The amount of electricity used to power indoor cannabis cultivation facilities can be costly,
especially when compared to outdoor cultivation. There are many benefits to indoor cultivation,
including control over the environment, continuous harvest cycles, and increased security.
However, the greenhouse gas emissions from the large amount of electricity generation is a cause
for concern (Arnold, 2013).
Growing cannabis indoors requires lighting, ventilation, and cooling in order to replicate
ideal outdoor conditions. The specific amount of energy required to produce these conditions will
vary with different production practices (O’Hare et al., 2013). The overall carbon footprint will
also depend on the power source. For example, illicit growers that rely on generators produce more
than three times the CO2 than facilities powered by the grid (Ashworth & Vizuete, 2017).
As recreational cannabis production increases, particularly in states with colder climates,
an increase in greenhouse gas emissions can be expected. Currently, indoor-grown cannabis uses
approximately 2,000 kWh per pound of product produced (O’Hare et al., 2013). Research also
estimates that one kilogram of product is associated with 4,600 kg of CO2 emitted to the
atmosphere (Mills, 2012). The full impact of the cannabis industry on energy use and the
consequent CO2 emissions is discussed in depth in Chapter 7.
Indoor Air Quality The indoor air quality of cannabis facilities is not well documented. Because of its federal
status, little research has been done to assess what types of conditions workers may be exposed to
(Davidson et al., 2018). Workers may be exposed to a variety of air contaminants including:
organic dusts, bioaerosols, pollen, VOCs, and THC. Inhalation of such contaminants can lead to a
variety of respiratory diseases and occupational asthma (Davidson et al., 2018). Furthermore, it is
unknown what levels of THC workers are being exposed to. In studies, THC was below the limit
of detection in air samples suggesting that THC is not an inhalation concern (Davidson et al.,
2018). However, the impacts of long-term exposure to THC are unknown and there are no
exposure limits for aerosols or surfaces contaminated with THC (Davidson et al., 2018). Since
many terpenes emitted by cannabis plants are lipophilic and are therefore readily bioavailable,
there are concerns of occupational health implications (Davidson et al., 2018). There have been
documented terpene-related occupational illnesses in the hop and timber production industry.
These workers exhibited occupational asthma, lung function deficits, and skin symptoms, which
were suspected to be caused by irritation from terpenes (Hessel et al., 1995; Spiewak et al., 2001).

90
Butane is a growing concern in the cannabis industry; it is a highly ignitable VOC solvent
used to create cannabis extracts. It has a lifetime of 2.5 days and leads to the creation of ozone in
photochemical reactions with nitrogen oxides under atmospheric conditions (Samburova et al.,
2019). Exposure to high concentrations of butane can lead to nausea, respiratory tract and mucous
membrane irritation, as well as headaches and fatigue (OSHA, n.d.). Although hydrocarbon
extractions are required to be closed loop in most states, a percentage of butane has the potential
to escape the extraction system if a facility is not stringent enough. A study in California and
Nevada found high concentrations of butane in cannabis extraction facilities ranging from 1,080
to 43,000 ppm. These concentrations were 0.9 to 49 times higher than the concentrations of
BVOCs found in these facilities (Samburova et al., 2019). The researchers concluded that these
levels of butane were high enough to potentially contribute to the formation of a significant amount
of ozone and other harmful compounds (Samburova et al., 2019).
The health concerns associated with hemp production have been well documented (Zuskin
et al., 1990; Zuskin et al., 1994; Fishwick et al., 2001). Research shows that there are high levels
of airborne dust, contaminated with bacterial and fungal growth, at hemp production facilities that
causes a range of health problems (Fishwick et al., 2001). Long-term inhalation of dust at hemp
production facilities causes “hemp worker’s disease,” otherwise known as byssinosis. Byssinosis
can be avoided by preventing direct worker exposure to airborne dust by keeping proper industrial
hygiene. The occupational hazards associated with hemp demonstrate a need to further research
the occupational health hazards of recreational cannabis production. In recent years, states like
Washington and Colorado have taken steps to develop formal guidance on occupational hazards
and indoor air quality for the industry (Spokane County, 2015; Colorado Department of Public
Health and Environment, 2017).
Air Pollution Control Technology Carbon Filtration
The Denver Cannabis Environmental Best Management Practices Guide currently
recommends carbon filtration as “the best control technology for reducing VOC emissions” and
odors (2018). Activated carbon filters have been used for odor control and to remove VOCs for
many years across multiple applications (Metts & Batterman, 2006). Carbon filters work by
adsorption. The carbon surface of the filter attracts VOCs and other air contaminants (DDPHE-
CSWG, 2018). The contaminants adhere to the activated carbon and become trapped in the small
pores of the filter (Mazille & Spuhler, n.d.). Carbon filtration can remove 50-98% of VOCs,
depending on the filter system used, the environmental conditions, and the life of the filter
(DDPHE-CSWG, 2018; Metts & Batterman, 2006; Sidheswaran et al., 2012).
Carbon filters are simple to install, inexpensive, effective and reliable when properly
maintained and replaced. Depending on the air quality and size, the filter will need to be replaced
every 6-12 months or according to the manufacturer’s recommendations (DDPHE-CSWG, 2018).
Currently, can or tube carbon filters are the most commonly used type. A constant supply of carbon
cans or tubes are typically needed, especially if a facility has potent odors or high VOC levels
(Jordan, n.d.)
Carbon filters can be stand-alone units or can be incorporated into an HVAC system. To
be most effective, the filtration system must be properly sized based on contaminant volume and
airflow requirements. In some cases, this may require multiple filters. Carbon filters can also be
used in conjunction with other air pollution control technologies (DDPHE-CSWG, 2018).

91
Ozone Generators
Typically, ozone generators are used in industrial settings for sanitation purposes, but they
have also been used to control strong odors (DDPHE-CSWG, 2018). An ozone generator produces
ozone by disassociating oxygen molecules (O2) through the use of UV light or a strong electrical
charge. The dissociated oxygen atoms then reassociate as ozone (O3) (Bishop et al., 1984). The
ozone oxidizes evaporated terpene molecules to deodorize the air (Royal Queen Seeds, 2019).
However, ozone is harmful to human health and can damage cannabis plants. Therefore, ozone
generators are not recommended as an air pollution control technology (DDPHE-CSWG, 2018).
Odor Absorbing Neutralizers
Odor absorbing neutralizers use oils and liquids derived from plant compounds to eliminate
odors. The neutralizer is sprayed as a mist into the exhaust air (DDPHE-CSWG, 2018). Odor
neutralizers for cannabis need to be effective on the common compounds found in cannabis,
including cannabinoids, terpenes and sesquiterpenes groups (Ecosorb, 2017). The effectiveness of
a neutralizer can vary from 20-90% VOC reduction (DDPHE-CSWG, 2018).
Masking and Counteractive Agents
Masking agents, like odor absorbing neutralizers, are sprayed as a mist at the exhaust air.
The difference is that masking agents are chemically derived, whereas odor absorbing neutralizers
are naturally derived from plants. The use of masking agents may be subject to air quality
regulations, depending on the state. Masking agents control odor, but not VOCs. Therefore,
masking agents do not mitigate the impacts of VOCs on air quality. Masking and counteractive
agents are not recommended in urban areas as an air pollution control technology (DDPHE-
CSWG, 2018).
Fog Systems
Fog systems, also called high pressure misting systems, are an established technology that
has been used in agricultural environments to treat odor (Hammon, 2018). Fog systems work by
forcing water through a specialized nozzle to create microdroplets. These microdroplets are
released into the air, where they attract particles and sink them to the ground to be removed. Prior
to entering the nozzle, the water is mixed with chemicals or essential oils to create a neutralizing
solution to eliminate odors (Wintering, 2016). For cannabis applications, the water is mixed with
essential oils to prevent risks to the plants (Hammon, 2018).
The odor control process is the same for both indoor and outdoor facilities, but the set-up
and system requirements differ (Wintering, 2016). For an indoor facility, the air is pulled across
the plants and into an intake vent. When the air exits from exhaust vents, it is mixed with the fog.
The external side of the exhaust vent is equipped with a nozzle (Hammon, 2018). For outdoor
facilities, high-pressure fog lines are placed around the exterior of the facility. A perimeter defense
is formed that utilizes the same fog (Wintering, 2016).
Negative Ion Generators/ Electrostatic Precipitators
Negative ion generators, also known as electrostatic precipitators, use a metal filter to emit
a negative charge to attract positively charged particles in the air (DDPHE-CSWG, 2018).The
filters need to be cleaned with water once they become concentrated with particles. They are
typically powered by a single wall outlet and can run 24 hours a day. The energy consumption of

92
this technology is dependent on its size and length of use. Overall they require little maintenance
and require less energy than other technology (DDPHE-CSWG, 2018).
Industrial Scrubbers
Industrial scrubbers are typically used for landfills or wastewater treatment plants to reduce
odor and emissions from facilities. However, scrubbers are also used to remove VOCs and
particulate matter in gas streams exiting cannabis facilities. Wet scrubbers are the most common
and use absorption to remove contaminants in the vapor by converting them to their liquid or
condensate form or by trapping particulates in liquid droplets (EPA, 2002). Most wet scrubbers
have efficiencies of approximately 90%, depending on the type of contaminant absorbed (EPA,
2019c). The most common liquid used in wet scrubbers is water, however some wet scrubbers use
amines to absorb gases with low water solubility such as hydrocarbons (EPA, 2019c). They can
be used with electrostatic precipitators to remove particles from the waste stream. Some common
problems include: low gas flow rate, condensation of aerosols in the system, air leakage,
freezing/plugging of lines, and scaling (EPA, 2019c).
Outdoor Grow Facilities
Outdoor cultivation has the greatest potential to expose sensitive receptors to odor. The
predictability and degree to which the odors can travel is highly variable depending on climatic
and topographic conditions near a cultivation site (County of Santa Cruz, 2017). Location and
natural buffers can most easily be used to mitigate odors from outdoor cultivation facilities.
Cannabis farms located in rural areas may be surrounded by other agricultural farms who raise
animals or hay. Odors are a more acceptable part of living in these rural communities (Hammon,
2018). In urban areas, zoning laws may help with both odors and VOC concentrations. Natural
buffers can be planted to surround cannabis plants to disperse odors and obscure crop visibility.
This strategy has been used successfully by poultry and swine operations, but more research into
the viability for cannabis facilities needs to be researched (Hammon, 2018).
Future Research
While there are many options for air pollution control, there is a lack of research in the
application of these technologies in the cannabis industry. The efficacy and efficiency of each
technology should be analyzed in regard to VOC emissions and odor control specific to the
cannabis industry, such as the high levels of terpenes. In addition, the interactions between terpenes
and solvent vapors are unknown, as are the potential effects on the removal efficiency.
Fixed-bed Carbon Adsorption Design
In air pollution control, adsorption is utilized to remove VOCs from low to medium
concentration exhaust streams. During adsorption, a VOC molecule attaches to an absorbent and
is removed from the air stream. Carbon is a commonly used adsorbent for VOC removal.
Furthermore, the most commonly used types of adsorption equipment in air pollution control are
fixed-bed systems and canister types (Vatavuk et al., 1999).
Due to the high volume of emissions produced by cannabis facilities, a canister type system
would not be practical. Therefore, the design is focused on a fixed-bed system. Fixed-bed systems
can be used to control continuous VOC streams at varying concentrations, in flow rates ranging
from several hundred to several hundred thousand cubic feet per minute. In continuous operation,
a carbon bed is always available for adsorption, so the system can operate continuously without

93
shut-down. When the carbon in the active adsorption vessel reaches a certain VOC concentration,
it shuts-down so the carbon can be regenerated and the other vessel comes online. In a system with
2 beds, each bed is sized to handle the entire emission stream so that one is always adsorbing while
the other is regenerating/desorbing (Vatavuk et al., 1999). A typical fixed bed carbon adsorber is
shown in Figure 6.2.
Figure 6.2. A Typical Two-bed Continuously Operated Fixed Bed Carbon Adsorber System
(Vatavuk et al., 1999).
The terpene emission rate can vary depending on the strain of cannabis that is grown. For
example, Rockstar Kush has a terpene emission capacity of 4.9 μgC g-1 hr-1. The terpene emission
capacity of 8.7 μgC g-1 hr-1 is measured for the strain Critical Mass. It was the highest terpene
emission capacity measured in the study by Wang et al. (2019b). The terpene emission rate will
also vary based on the growth phase of the plant. For example, Critical Mass produced 1.4 μgC
dwg-1 hr-1 and 8.7 μgC g-1 hr-1 after 30 and 46 days of growth, respectively (Wang et al., 2019b).
The terpene emissions produced by different strains of cannabis contain different
concentrations of individual terpenes. The individual terpenes in the emissions will also vary
depending on how old the plant is. The concentration of individual terpenes for Critical Mass at
46 days of growth, when the highest terpene emission rate was measured, is shown in Figure 6.3.

94
Figure 6.3. Percent Composition of Critical Mass Terpene Emissions (Wang et al., 2019b).
Terpene Volumetric Flow Rate
Wang et al. (2019a) calculated an average of 905 plants per facility in Denver County, CO. Based
on this average, the adsorber was designed for a 1,000 plant facility. Assuming 1 sq.ft per plant
(Caulkins et al., 2013), the design is for a 1,000 sq.ft facility.
The mass flow rate of total terpene emissions for a 1,000 sq.ft facility was calculated using a
terpene emission capacity of 8.7 μgC g-1 hr-1 (Wang et al., 2019b). This emission capacity was
measured by Wang et al. (2019b) based on the dry weight of the plant. It was converted to terpene
emission capacity per plant using the value of 750 dwg plant-1 (Wang et al., 2019b). This yielded
a terpene emission rate of 0.006525 g plant-1 hr-1.
The terpene emission rate of 0.006525 g plant-1 hr-1 for a 1,000 plant facility was calculated to be
6.525 g/hr. Using the percent composition of Critical Mass seen in Figure 1, the individual mass
flows of the terpenes were calculated. An example calculation for the individual mass flow of
eucalyptol (32% of the terpene composition) is shown below.
6.525 𝑔
ℎ𝑟 ∗ 0.32 = 2.088
𝑔 𝑒𝑢𝑐𝑎𝑙𝑦𝑝𝑡𝑜𝑙
ℎ𝑟
The individual mass flow rates were calculated for each of the terpene constituents, except for the
1% labelled “others.” These mass flow rates were summed to determine a total molar flow rate of
0.0449 moles hr-1. These calculations can be found in Appendix A. The total molar flow rate was
then used to calculate the volumetric flow rate of the terpenes as shown below:

95
𝑄𝑡𝑒𝑟𝑝𝑒𝑛𝑒𝑠 =𝑛𝑅𝑇
𝑃
𝑄𝑡𝑒𝑟𝑝𝑒𝑛𝑒𝑠 =(0.0449𝑚𝑜𝑙/ℎ𝑟)(0.0000821 𝑎𝑡𝑚 − 𝑚3/𝑚𝑜𝑙 − 𝐾)(298𝐾)
1 𝑎𝑡𝑚
𝑄𝑡𝑒𝑟𝑝𝑒𝑛𝑒𝑠 = 0.00110𝑚3
ℎ𝑟
The volumetric flow rate of the facility was determined assuming a 10-foot ceiling height and 15
air changes per hour (UMASS Amherst, 2018; Walker & Duncan, 1973; Jordan, n.d.). The
calculation is shown below:
𝑄𝑟𝑜𝑜𝑚 = 1000 𝑓𝑡2 ∗ 10 𝑓𝑡2 ∗ 15𝑎𝑖𝑟 𝑐ℎ𝑎𝑛𝑔𝑒𝑠
ℎ𝑜𝑢𝑟= 150,000
𝑓𝑡3
ℎ𝑜𝑢𝑟
𝑄𝑟𝑜𝑜𝑚 = 4,247 𝑚3
ℎ𝑜𝑢𝑟= 2,559
𝑓𝑡3
𝑚𝑖𝑛
Vessel Dimensions
To determine the vessel dimensions, typical values for superficial velocity (Vb), bulk density of
carbon (𝛲𝑏,𝑐𝑎𝑟𝑏𝑜𝑛), and the maximum bed depth to diameter ratio (H/D) were used. Typical values
for these parameters are summarized in Table 6.1.
Table 6.1. Typical Values for Design (Vatavuk et al., 1999).
Parameter Value
Vb 60 𝑓𝑡
𝑚𝑖𝑛
H/D 𝜋
12
𝛲𝑏,𝑐𝑎𝑟𝑏𝑜𝑛 30 𝑙𝑏𝑠
𝑓𝑡3
To calculate the diameter of the vessel, the following equation was used:
𝐷 = √4 ∗ 𝑄𝑟𝑜𝑜𝑚
𝑉𝑏 ∗ 𝜋
𝐷 = √4 ∗ 2559
𝑓𝑡3
𝑚𝑖𝑛
60𝑓𝑡
𝑚𝑖𝑛∗ 𝜋

96
𝐷 = 7.4 𝑓𝑡
The diameter was rounded to 7.5 ft. Next, the bed depth was calculated using the H/D ratio as
shown below:
𝐵𝑒𝑑 𝐷𝑒𝑝𝑡ℎ =𝐻
𝐷∗ 𝐷
𝐵𝑒𝑑 𝐷𝑒𝑝𝑡ℎ =𝜋
12∗ 7.5 𝑓𝑡
𝐵𝑒𝑑 𝐷𝑒𝑝𝑡ℎ = 2.0 𝑓𝑡
The length of the vessel was then calculated, using the assumption that the bed depth is one-third
of the length (Vatavuk et al., 1999).
𝐿 = 2.0 𝑓𝑡 ∗ 3
𝐿 = 6.0 𝑓𝑡
The quantity of carbon per vessel (Mc, vessel) was then calculated using the following equation:
𝑀𝑐,𝑣𝑒𝑠𝑠𝑒𝑙 =𝜋 ∗ 𝐿 ∗ 𝐷2
4∗ 𝛲𝑏,𝑐𝑎𝑟𝑏𝑜𝑛
𝑀𝑐,𝑣𝑒𝑠𝑠𝑒𝑙 =𝜋 ∗ 6 𝑓𝑡 ∗ (7.4 𝑓𝑡)2
4∗ 30
𝑙𝑏
𝑓𝑡3
𝑀𝑐,𝑣𝑒𝑠𝑠𝑒𝑙 = 2650.72𝑙𝑏𝑠 𝑐𝑎𝑟𝑏𝑜𝑛
𝑣𝑒𝑠𝑠𝑒𝑙
It was determined that one active absorbing bed would be sufficient to treat the amount of terpenes
in the exhaust emissions. Since the design is for a continuous, regenerative fixed-bed carbon
adsorber, a desorbing bed is also required. Therefore, the total number of vessels is 2 and the total
amount of carbon needed for 2 vessels was calculated as shown below:
𝑀𝑐,𝑡𝑜𝑡𝑎𝑙 =𝑀𝑐
𝑣𝑒𝑠𝑠𝑒𝑙∗ 𝑛𝑢𝑚𝑏𝑒𝑟 𝑜𝑓 𝑣𝑒𝑠𝑠𝑒𝑙𝑠
𝑀𝑐,𝑡𝑜𝑡𝑎𝑙 = 2650.72𝑙𝑏𝑠 𝑐𝑎𝑟𝑏𝑜𝑛
𝑣𝑒𝑠𝑠𝑒𝑙∗ 2 𝑣𝑒𝑠𝑠𝑒𝑙𝑠
𝑀𝑐,𝑡𝑜𝑡𝑎𝑙 = 5301.44 𝑙𝑏𝑠 𝑐𝑎𝑟𝑏𝑜𝑛

97
Carbon Replacement
To determine the replacement frequency of the carbon, the equilibrium mass loading (𝑤e ) was
first calculated using the equation shown below. In the equation, G is the carbon loading at
equilibrium (cm3 liquid adsorbate per 100 g carbon) and Vm is the weighted fraction of the liquid
molar volume (cm3 mol-1) calculated in Appendix B.
𝑤𝑒 =0.01𝐺
𝑉𝑚∗ 𝑀𝑊
𝑤𝑒 =0.01(31.81
𝑐𝑚3
100 𝑔 𝐶)
162.0𝑐𝑚3
𝑚𝑜𝑙𝑒
∗ 140.6𝑔
𝑚𝑜𝑙𝑒
𝑤𝑒 = 0.28𝑔 𝑡𝑒𝑟𝑝𝑒𝑛𝑒𝑠
𝑔 𝑐𝑎𝑟𝑏𝑜𝑛
Using the equilibrium mass loading of 0.28, the working capacity (𝑤c) was calculated assuming
50% efficiency (Vatavuk et al., 1999):
𝑤𝑐 = 𝑤𝑒 ∗ 0.5
𝑤𝑐 = 0.28 ∗ 0.5
𝑤𝑐 = 0.138𝑔 𝑡𝑒𝑟𝑝𝑒𝑛𝑒𝑠
𝑔 𝑐𝑎𝑟𝑏𝑜𝑛
The working capacity was used to calculate the carbon usage rate, as shown below.
𝐶𝑎𝑟𝑏𝑜𝑛 𝑈𝑠𝑎𝑔𝑒 𝑅𝑎𝑡𝑒 =𝑄𝑡𝑒𝑟𝑝𝑒𝑛𝑒𝑠
𝑊𝑜𝑟𝑘𝑖𝑛𝑔 𝐶𝑎𝑝𝑎𝑐𝑖𝑡𝑦
𝐶𝑎𝑟𝑏𝑜𝑛 𝑈𝑠𝑎𝑔𝑒 𝑅𝑎𝑡𝑒 =2.056 𝑙𝑏𝑠 𝑡𝑒𝑟𝑝𝑒𝑛𝑒𝑠/ℎ𝑟
0.138 𝑙𝑏𝑠 𝑐𝑎𝑟𝑏𝑜𝑛/𝑙𝑏𝑠 𝑡𝑒𝑟𝑝𝑒𝑛𝑒𝑠
𝐶𝑎𝑟𝑏𝑜𝑛 𝑈𝑠𝑎𝑔𝑒 𝑅𝑎𝑡𝑒 = 14.9𝑙𝑏𝑠
ℎ𝑟
The carbon usage rate was then used to calculate the amount of time before the carbon would have
to be regenerated, based on the following equation:
𝑇𝑖𝑚𝑒 =𝑀𝑐,𝑣𝑒𝑠𝑠𝑒𝑙
𝐶𝑎𝑟𝑏𝑜𝑛 𝑈𝑠𝑎𝑔𝑒 𝑅𝑎𝑡𝑒

98
𝑇𝑖𝑚𝑒 =2650.72 𝑙𝑏𝑠
14.90 𝑙𝑏𝑠ℎ𝑟
𝑇𝑖𝑚𝑒 = 7.41 𝑑𝑎𝑦𝑠
Cost Analysis
Carbon Cost
The cost of carbon (Cc) to fill both the adsorbing vessel and desorbing vessel was calculated based
on the following equation (Vatavuk et al., 1999):
𝐶𝑐 = 1.00𝑀𝑐,𝑡𝑜𝑡𝑎𝑙
𝐶𝑐 = $5301.44 Vessel Cost
In order to calculate the cost per vessel based on the quantity of steel used, the surface area of each
vessel was calculated as shown below.
𝑆. 𝐴. = 𝜋 ∗ 𝐷 ∗ (𝐿 +𝐷
2)
𝑆. 𝐴. = 𝜋 ∗ 7.5 𝑓𝑡 ∗ (6.0 𝑓𝑡 +7.5 𝑓𝑡
2)
𝑆. 𝐴. = 229.7 𝑓𝑡2
The cost per vessel (Cv) was then calculated based on the following equation (Vatavuk et al., 1999):
𝐶𝑣 = 271 ∗ 𝑆. 𝐴.0.778
𝐶𝑣 = 271 ∗ 229.70.778
𝐶𝑣 = $18,620.66 Total Equipment Cost
The total equipment cost depends on the ratio (Rc) of the total adsorber equipment cost to the cost
of the vessels and carbon, calculated below (Vatavuk et al., 1999).
𝑅𝑐 = 5.82 ∗ 𝑄−0.133
𝑅𝑐 = 5.82 ∗ 2559−0.133
𝑅𝑐 = 2.050
The total equipment cost (Ca), including fans, pumps, condensers, piping, and other
instrumentation can be approximated using the following equation (Vatavuk et al., 1999):
𝐶𝑎 = 𝑅𝑐 ∗ [𝐶𝑐 + 𝐶𝑣 ∗ (𝑁𝐴 + 𝑁𝐷)]

99
𝐶𝑎 = 2.050 ∗ [$2580.50 + $18,620.66 ∗ (1 + 1)]
𝐶𝑎 = $87,192.98
This calculated cost is based on 1999 currency value, and was converted to 2019 currency value
using the cost indices below.
2019 𝐶𝑜𝑠𝑡 = 1999 𝐶𝑜𝑠𝑡 ∗2019 𝐶𝑜𝑠𝑡 𝐼𝑛𝑑𝑒𝑥
1999 𝐶𝑜𝑠𝑡 𝐼𝑛𝑑𝑒𝑥
2019 𝐶𝑜𝑠𝑡 = $81,760.23 ∗542
391
2019 𝐶𝑜𝑠𝑡 = $120,865.97
This cost estimation does not include the cost of installation or direct annual costs, such as cooling
water, electricity, carbon replacement, or any other maintenance and operating costs.
Discussion
The vessel dimensions and amount of carbon required would increase if the cannabis
cultivation facility had an attached or incorporated extraction facility. The addition of
hydrocarbons such as butane or propane would increase the amount of VOC in the exhaust
emissions. This would alter not only the total volumetric flow rate entering the filter, but the
equilibrium mass loading and working capacity as well.
The cost associated with a filter for a 1,000 plant facility is upwards of $120,000.
According to the EPA’s Top Down Best Available Control Technology: Guidance Document
(1990), the cost effectiveness of an air pollution control technology should be evaluated. The
expectation is that a company can afford to spend about $15,000 per ton of VOC removed by the
control technology. If a company were to spend more than $15,000 per ton of VOC, it is considered
too expensive; less than $15,000 per ton of VOC is considered financially feasible (EPA, 1990).
A 1,000 sq.ft facility that emits 0.063 ton per year (6.525 g hr-1) would cost about $945 per year.
Therefore, a $120,000 carbon adsorber is not financially feasible by this standard. Furthermore,
agricultural activities are exempt from most air emissions regulations in many regions, so there is
no pressure to install any kind of air pollution control technology.
Some best management practices encourage the installation of an activated carbon filter to
reduce VOC and odor emissions (DDPH, 2018), but as the design calculations demonstrated, an
effective carbon filter is too expensive for most facilities to install. Research needs to be conducted
to determine a more cost-effective way to control emissions for both small and large facilities.
Future Air Pollution Control Research
Biofilters treat exhaust through both physical and biological means. When VOCs and other
contaminants pass through the filter, they are adsorbed to the media and broken down by
microorganisms. Biofilters are effective in treating odorous VOCs (i.e. ammonia and hydrogen
sulfide) at wastewater treatment plants and livestock facilities (Liu, 2017; Iranpour et al., 2005).
Biofilters require media that provides enough nutrients for microbial growth to occur and
maintains a high porosity for easy air flow. Typical biofilter media includes a mixture of materials

100
to create the ideal environment. A mixture of wood chips and compost, in a ratio of 70 to 30 by
weight, has been proven to be an effective biofilter media in agriculture (Liu, 2017). The compost
contains sufficient nutrients and microorganisms and has a high moisture holding capacity, while
the wood chips improve porosity. Other media materials may include peat, loam soil, and straw
(Liu, 2017).
There is a potential opportunity to design a biofilter that uses cannabis plant waste as the
media. One of the options for cannabis waste disposal allowed by some state regulations is
composting. If the waste was composted onsite, a percentage of the compost could be mixed with
wood chips or straw to create a biofilter media. Research would be required to determine the
feasibility, cost, and effectiveness of this idea. If this idea was practicable, facilities could reduce
their waste disposal costs, as well as their VOC and odor emissions.
Recommendations Regulation Enforcement
Odor is a leading concern for communities surrounding cannabis cultivation and extraction
facilities. Communities across the United States are demanding better odor regulations and
enforcement. This leads to expensive lawsuits, blocked permits, and disgruntled communities.
Many cities like Denver and Las Vegas are adopting more proactive policies in monitoring odor
from facilities. The field olfactometer called “The Nasal Ranger” is used to monitor odor and to
ensure regulations are being met, enforced, and documented (Bender, 2020). However, odor
produced by cannabis production is difficult to control and requires significant planning.
Planning Ahead
According to experienced growers and industry experts, planning ahead is the best way to
implement odor control (Hammon, 2018). Many odor control plans tend to be reactive; the
problem is only addressed when a facility is out of compliance. Since odor control is an additional
cost, without any direct revenue, cannabis cultivators do not take action until they have to (Sandy,
2019). Rather, cannabis cultivators should contact an odor mitigation company before they
discover that there is an odor problem and be proactive when it comes to odor control (Sandy,
2019). Early in the facility planning process, cultivators should be aware of air pollution
regulations. Many state and local regulations require that an odor control plan be established prior
to issuing a permit (Sandy, 2019). Odor mitigation planning can be a stand-alone plan or coupled
with HVAC preparation. Specialized engineering firms will consider environmental factors such
as humidity, temperature, and biosecurity needs to mitigate odors. By planning ahead, odor
mitigation can be incorporated into the same plan as the HVAC system, which can save time and
costs (Hammon, 2018).

101
References
Air Pollution Control District Santa Barbara County (APCD). (2019). APCD ADVISORY
Air Quality and Cannabis Operations. [PDF File]. Retrieved from
https://www.ourair.org/wp-content/uploads/APCD-Cannabis-Advisory-v2.pdf
Aldrich, R. L. (2005). Environmental laws and regulations related to odor and waste gas
contaminants. Biotechnology for odor and air pollution control (pp. 17-28). Springer,
Berlin, Heidelberg.
Arnold, J. M. (2013). Energy consumption and environmental impacts associated with cannabis
cultivation. (Doctoral dissertation, Humboldt State University).
Ashworth, K., & Vizuete, W. (2017). High Time to Assess the Environmental Impacts of
Cannabis Cultivation. Environmental Science Technology, 51(5), 2531-2533.
Bender, M. (2020). How a City Decides to Buy This Ridiculous $2,000 Weed-Smelling Device.
Retrieved from https://www.vice.com/en_us/article/y3mnak/how-a-city- decides-to-buy-
this-ridiculous-dollar2000-weed-smelling-device
Bishop, J., Horvata, M., Bilitzky, L., & Huttner, J. (1984). A Comprehensive Guide to
Deodorization Using Ozone. [PDF File]. Retrieved from
https://ozoneexperts.com/content/Ozone_Book.pdf
Booth, J. K., & Bohlmann, J. (2019). Terpenes in Cannabis sativa–From plant genome to
humans. Plant Science, 284, 67-72.
Caulkins, J., Cohen, M., & Zamarra, L. (2013). Estimating Adequate Licensed Square Footage
for Production. [PDF File]. Retrieved from https://lcb.wa.gov/publications/Marijuana/
BOTEC%20reports/5a_Cannabis_Yields-Final.pdf
Colorado Department of Revenue. (2020). MED Licensed Facilities. Retrieved from
https://www.colorado.gov/pacific/enforcement/med-licensed-facilities
Colorado Department of Public Health and Environment. (2017). Guide to Worker Safety and
Health in the Marijuana Industry Marijuana Occupational Health and Safety Work
Group. Retrieved from https://www.colorado.gov/pacific/cdphe/marijuana- occupational-
safety-and-health
Davidson, M., Reed, S., Oosthuizen, J., O'Donnell, G., Gaur, P., Cross, M., & Dennis, G. (2018).
Occupational health and safety in cannabis production: an Australian perspective.
International Journal of Occupational and Environmental Health, 24(3-4), 75–85.

102
Denver Department of Environmental Health (DDEH). (n.d.). Rules Governing Nuisance Odors
Draft. [PDF File]. Retrieved from https://www.denvergov.org/content/dam
/denvergov/Portals/771/documents/EQ/Odor/Rules%20Governing%20Nuisance%20Odor
s%20-%20draft.pdf
Denver Department of Public Health. (2018). Cannabis Environmental Best Management
Practices Draft Section for Review: Air Quality. Retrieved from
https://www.denvergov.org/content/dam/denvergov/Portals/771/documents/EQ/MJ%20S
ustainability/DRAFT%20Air%20Quality%20Section.pdf
Denver Department of Public Health & Environment Cannabis Sustainability Working Group
(DDPHE-CSWG). (2018). Cannabis Environmental Best Management Practices Guide.
[PDF File]. Retrieved from https://www.denvergov.org/content/dam/denvergov/Portals
/771/documents/EQ/MJ%20Sustainability/Cannabis_BestManagementPracticesGuide_FI
NAL.pdf
Ecosorb. (2017). Ecosorb® CNB 100 Technical Data Sheet. [PDF File]. Retrieved from
https://ecosorbindustrial.com/wp-content/uploads/2018/12/TechData_CNB100.pdf
Fishwick, D., Allan, L. J., Wright, A., & Curran, A. D. (2001). Assessment of exposure to
organic dust in a hemp processing plant. Annals of occupational hygiene, 45(7), 577-583.
Fuller, T. (2018). “Dead Skunk’ Stench From Marijuana Farms Outrages Californians.
Retrieved from https://www.nytimes.com/2018/12/19/us/california-marijuana-stink.html
Hammon, C. (2018). Odor Control: Does Your Cannabis Business Stink?. Retrieved
from https://www.cannabisbusinesstimes.com/article/does-your-business-stink/
Hessel, P. A., Herbert, F. A., Melenka, L. S., Yoshida, K., Michaelchuk, D., & Nakaza, M.
(1995). Lung health in sawmill workers exposed to pine and spruce. Chest, 108(3), 642-
646.
Iranpour, R., Cox, H. H., Deshusses, M. A., & Schroeder, E. D. (2005). Literature review of air
pollution control biofilters and biotrickling filters for odor and volatile organic compound
removal. Environmental Progress, 24(3), 254-267.
Jordan, K. (n.d.). Cannabis facilities: air filtration, UV-C air disinfection and odor removal.
National Air Filtration Association. Retrieved from https://www.nafahq.org/cannabis-
facilities-air-filtration-uv-c-air-disinfection-and-odor-removal/
Liu, J.(2017). Design and Management of Biofilters for Odor Reduction of Livestock Facilities.
K-State Research and Extension. https://bookstore.ksre.ksu.edu/pubs/MF3387.pdf
Leonardos, G. (1974). A critical review of regulations for the control of odors. Journal of the
Air Pollution Control Association, 24(5), 456-468.

103
Marinho, C. R., Souza, C. D., Barros, T. C., & Teixeira, S. D. P. (2014). Scent glands in legume
flowers. Plant Biology, 16(1), 215-226.
Mazille, F., & Spuhler, D. (n.d.). Adsorption (Activated Carbon). Retrieved from
https://sswm.info/sswm-university-course/module-6-disaster-situations-planning-and-
preparedness/further-resources-0/adsorption-(activated-carbon)
McGinley, C. M., Mahin, T. D., & Pope, R. J. (2000, April). Elements of successful odor/odour
laws. In WEF Odor/VOC 2000 Specialty Conference.
Metts, T. A., & Batterman, S. A. (2006). Effect of VOC loading on the ozone removal efficiency
of activated carbon filters. Chemosphere, 62(1), 34-44.
Mills, E. (2012). The Carbon Footprint of Indoor Cannabis Production. Energy Policy, 46,
58-67.
New Frontier Data. (2019). Global Cannabis Report: 2019 Industry Outlook. Retrieved from
https://newfrontierdata.com/product/global-cannabis-2019/
O’Hare, M., Sanchez, D. L., & Alstone, P. (2013). Environmental risks and opportunities in
cannabis cultivation. BOTEC Analysis Corp.
Occupational Safety and Health Administration (OSHA). Indoor Air Quality Investigation,
Section III: Chapter 2. Retrieved from
https://www.osha.gov/dts/osta/otm/otm_iii/otm_iii_2 .html#2
Royal Queen Seeds. (2019). Ozone Generators and Cannabis: Everything You Need to Know.
Retrieved from https://www.royalqueenseeds.com/blog-ozone-generators-and-cannabis-
everything-you-need-to-know-n1158
Samburova, V., McDaniel, M., Campbell, D., Wolf, M., Stockwell, W. R., & Khlystov, A.
(2019). Dominant volatile organic compounds (VOCs) measured at four Cannabis
growing facilities: Pilot study results. Journal of the Air & Waste Management
Association, 69(11), 1267-1276.
Sandy, E. (2019). 7 Tips to Neutralize Cannabis Odor Now. Retrieved from
https://www.cannabisbusinesstimes.com/article/neutralize-cannabis-odor-now/
SFR Consulting Group. (2004). A Review of National and International Odor Policy, Odor
Measurement Technology, and Public Administration. [PDF File]. Retrieved from
https://www.pca.state.mn.us/sites/default/files/p-gen2-02.pdf
Sidheswaran, M. A., Destaillats, H., Sullivan, D. P., Cohn, S., & Fisk, W. J. (2012). Energy
efficient indoor VOC air cleaning with activated carbon fiber (ACF) filters. Building and
Environment, 47, 357-367.

104
Spiewak, R., Gora, A., & Dutkiewicz, J. (2001). Work-related skin symptoms and type I allergy
among eastern-Polish farmers growing hops and other crops. Annals of Agricultural and
Environmental Medicine, 8(1), 51-56.
Spokane County. (January 12, 2015). Regulatory Guidance for Licensed I-502 Operations in
Spokane County. Retrieved from https://fortress.wa.gov/ga/apps/sbcc/File.ashx?cid=4655
Summerlin, R. (2018). A Colorado weed business may lose its permit over odor issues.
Retrieved from https://www.thecannabist.co/2017/10/10/carbondale-laughing-dog-
permit-revocation/89707/
The Associated Press. (2017). Oregon marijuana growers face lawsuit from vineyard owner
over crop’s smell. Retrieved from https://www.thecannabist.co/2017/11/24/oregon-
marijuana-smell-vineyard-lawsuit/93192/
The Associated Press. (2017). Spokane County cannabis farmers will have to register at air
pollution office. Retrieved from https://www.thecannabist.co/2017/11/02/spokane-
washington-marijuana-farms-odor/91540/
United States Environmental Protection Agency. (1990). Top Down Best Available Control
Technology Guidance Document. [PDF File]. Retrieved from
https://nepis.epa.gov/Exe/ZyPDF.cgi/9101IKCC.PDF?Dockey=9101IKCC.PDF
United States Environmental Protection Agency. (2002). Particulate Matter Controls: Chapter 2
Wet Scrubbers for Particulate Matter. [PDF File]. Retrieved from
https://www3.epa.gov/ttncatc1/cica/files/cs6ch2.pdf
United States Environmental Protection Agency. (2017). Technical Overview of Volatile
Organic Compounds. Retrieved from https://www.epa.gov/indoor-air-quality-
iaq/technical-overview-volatile-organic-compounds#EPA%20Regulatory%20Definition
United States Environmental Protection Agency. (2019a). US EPA Nonattainment Areas and
Designations. Retrieved from https://catalog.data.gov/dataset/us-epa-non attainment-
areas -and-designations
United States Environmental Protection Agency. (2019b). Health Effects of Ozone Pollution.
Retrieved from https://www.epa.gov/ground-level-ozone-pollution/ health-effects-ozone-
pollution
United States Environmental Protection Agency. (2019c). Monitoring by Control Technique -
Wet Scrubber For Gaseous Control. Retrieved from https://www.epa.gov/air-emissions-
monitoring-knowledge-base/monitoring-control-technique-wet-scrubber-gaseous-control

105
United States Environmental Protection Agency. (2020). Current Nonattainment Counties for All
Criteria Pollutants. Retrieved from https://www3.epa.gov/airquality/greenbook/ ancl.html
University of Massachusetts Amherst. (2018). Ventilation for Greenhouses. The Center for
Agriculture, Food and the Environment. Retrieved from https://ag.umass.edu/greenhouse-
floriculture/fact-sheets/ventilation-for-greenhouses
Urso, K. (2019). Air Quality Impacts of the Cannabis Industry. Colorado Department of Public
Health and Environment. [PDF File]. Retrieved from
http://northamericancannabissummit.org/wp-content/uploads/2019/03/D4-
113_URSOslides.pdf
Vatavuk, W., Klotz, W., & Stallings, R. (1999). Carbon Adsorbers. In EPA air pollution control
cost manual. Air Quality Strategies and Standards Division of the Office of Air Quality
Planning and Standards, US Environmental Protection Agency, Research Triangle Park,
NC, 27711.
Walker, J. N., & Duncan, G. A. (1973). Estimating greenhouse ventilation requirements. AEN.
Wang, C. T., Wiedinmyer, C., Ashworth, K., Harley, P. C., Ortega, J., Rasool, Q. Z., & Vizuete,
W. (2019a). Potential regional air quality impacts of cannabis cultivation facilities in
Denver, Colorado. Atmospheric Chemistry and Physics, 19, 13973–13987.
Wang, C. T., Wiedinmyer, C., Ashworth, K., Harley, P. C., Ortega, J., & Vizuete, W. (2019b).
Leaf enclosure measurements for determining volatile organic compound emission
capacity from Cannabis spp. Atmospheric Environment, 199, 80-87.
Wintering, G. (2016). High Pressure Misting Systems Provide Effective Odor Control.
Retrieved from https://fogco.com/high-pressure-misting-systems-provide-effective- odor-
control/
Zuskin, E., Kanceljak, B., Pokrajac, D., Schachter, E. N., & Witek, T. J. (1990). Respiratory
symptoms and lung function in hemp workers. Occupational and Environmental
Medicine, 47(9), 627-632.
Zuskin, E., Mustajbegovic, J., & Schachter, E. N. (1994). Follow‐up study of respiratory
function in Hemp workers. American journal of industrial medicine, 26(1), 103-115.

106
Appendix A: Total Molar Flow Rate
Terpene Percent Mass Flow
Rate
Mass Flow
Rate Molar Mass n
% g C/hr g C/hr g/mol mol/hr
Eucalyptol 0.32 6.525 2.088 154.25 0.0135
B-Myrcene 0.18 6.525 1.1745 136.23 0.0086
gamma-Terpinene 0.14 6.525 0.9135 136.23 0.0067
Sabinene 0.11 6.525 0.71775 136.23 0.0053
d-Limonene 0.04 6.525 0.261 136.23 0.0019
Terpinolene 0.04 6.525 0.261 136.23 0.0019
p-Cymene 0.04 6.525 0.261 134.22 0.0019
Thujene 0.03 6.525 0.19575 136.23 0.0014
alpha-Pinene 0.03 6.525 0.19575 136.23 0.0014
Caryophyllene 0.02 6.525 0.1305 204.36 0.0006
alpha-Terpinene 0.02 6.525 0.1305 136.23 0.0010
B-pinene 0.01 6.525 0.06525 136.23 0.0005
Totals 6.3945 0.0449

107
Appendix B: We Calculations
The carbon loading at equilibrium, G, is calculated from a regression equation in which all the
terms are expressed in metric units. The equation for G is the Calogon fifth-order polynomial:
𝑙𝑜𝑔10(𝐺) = 𝐴0 + 𝐴1𝛶 + 𝐴2𝛶2 + 𝐴3𝛶3 + 𝐴4𝛶4 + 𝐴5𝛶5
Where the values for AX are summarized in Table A.1 below and Υ is calculated from several
equations which follow.
Table A.1. Regression Equation Variables
Parameter Value
A0 1.71
A1 −1.46 × 10⁻²
A2 −1.65 × 10⁻³
A3 −4.11 × 10⁻⁴
A4 3.14 × 10⁻⁵
A5 −6.75 × 10⁻⁷
The first step in calculating Υ is to calculate 𝜒. The equation for 𝜒 is shown below:
𝜒 = (𝑇
𝑉𝑚) ∗ 𝑙𝑜𝑔10(
𝑃𝑠
𝑃𝑖)
where T is the absolute pressure (K), Vm is the liquid molar volume of terpenes (cm3 g-mole-1), Ps
is the fraction-weighted vapor pressure of terpenes at temperature T (kPa), and Pi is the fraction-
weighted partial pressure of terpenes (kPa).
The liquid molar volume of terpenes was calculated as shown below. The fraction-weighted Vm
calculation is summarized in Table A.2.
𝑉𝑚 = 𝛴𝑀𝑊
𝜌
𝑉𝑚 = 162.0𝑐𝑚3
𝑚𝑜𝑙𝑒

108
Table A.2. Fraction-weighted Vm
Terpene Percent Density Molar Mass Liquid Molar
Volume
% g/cm3 g/mol cm3/mol
Eucalyptol 0.32 0.9267 154.25 53.264
B-Myrcene 0.18 0.794 136.23 30.883
gamma-Terpinene 0.14 0.8458 136.23 22.549
Sabinene 0.11 0.844 136.23 17.755
d-Limonene 0.04 0.8383 136.23 6.500
Terpinolene 0.04 0.8632 136.23 6.313
p-Cymene 0.04 0.857 134.22 6.265
Thujene 0.03 0.935 136.23 4.371
alpha-Pinene 0.03 0.8544 136.23 4.783
Caryophyllene 0.02 0.9075 204.36 4.504
alpha-Terpinene 0.02 0.837 136.23 3.255
B-pinene 0.01 0.8673 136.23 1.571
Total 162.014
The partial pressure of terpenes was calculated as described. The volumetric flow rate of the
terpene emissions and the volumetric flow rate of the facility were used to determine the fraction
of terpenes in the exhaust emissions. The calculation is shown below:
𝐹𝑟𝑎𝑐𝑡𝑖𝑜𝑛 𝑇𝑒𝑟𝑝𝑒𝑛𝑒𝑠 =𝑄𝑡𝑒𝑟𝑝𝑒𝑛𝑒𝑠
𝑄𝑟𝑜𝑜𝑚=
0.0011
4247
𝐹𝑟𝑎𝑐𝑡𝑖𝑜𝑛 𝑇𝑒𝑟𝑝𝑒𝑛𝑒𝑠 = 2.58 × 10⁻⁷
The fraction of terpenes in the exhaust emission was used to calculate the partial pressure of the
terpenes in the exhaust emissions. A standard pressure of 101.325 kPa (1 atm) was assumed. The
calculation for the partial pressure is shown below:
𝑃𝑡𝑒𝑟𝑝𝑒𝑛𝑒𝑠 = 101.325 𝑘𝑃𝑎 ∗ 2.58 × 10−7
𝑃𝑡𝑒𝑟𝑝𝑒𝑛𝑒𝑠 = 2.62 × 10⁻⁵ 𝑘𝑃𝑎

109
𝜒 was calculated as shown below:
𝜒 = (298 𝐾
162.0𝑐𝑚3
𝑚𝑜𝑙𝑒
) ∗ 𝑙𝑜𝑔10(0.255 𝑘𝑃𝑎
2.62 × 10⁻⁵ 𝑘𝑃𝑎)
𝜒 = 7.336
The next step to calculate Υ is to calculate the relative polarizability (Γ):
𝛤 =𝛳𝑖
𝛳𝑜
Where ϴi is the polarizability component for the terpene flow per unit volume and ϴo is the
polarizability component for n-heptane per unit volume. To calculate the polarizability component
for the terpene flow, the appropriate refractive index of the terpene flow was used. A fraction-
weighted polarizability component for the terpene flow (ϴi) and the polarizability component for
n-heptane were calculated using the equation shown below, where n is the refractive index:
𝛳 =𝑛2−1
𝑛2+1
The calculations for the ϴi are summarized in Table A.3 below. An example calculation for the
polarizability component for n-heptane is given:
𝛳𝑜 =1.38552 − 1
1.38552 + 1
𝛳𝑜 = 0.235
Table A.3. Fraction-weighted Polarizability
Terpene Percent n Refractive
Index Polarizability
% i/unit volume
Eucalyptol 0.32 1.4586 0.273
B-Myrcene 0.18 1.4709 0.279
gamma-Terpinene 0.14 1.474 0.281
Sabinene 0.11 1.468 0.278
d-Limonene 0.04 1.473 0.281
Terpinolene 0.04 1.4883 0.288

110
p-Cymene 0.04 1.4909 0.290
Thujene 0.03 1.45 0.269
alpha-Pinene 0.03 1.4632 0.276
Caryophyllene 0.02 1.495 0.292
alpha-Terpinene 0.02 1.478 0.283
B-pinene 0.01 1.478 0.283
Total 0.281
The relative polarizability (Γ) of the terpene flow was calculated using ϴi and ϴo as shown below:
𝛤 =𝛳𝑖
𝛳𝑜=
0.281
0.235
𝛤 = 1.198
Once 𝜒 and Γ were determined, the value of Υ was calculated as shown below:
𝛶 = 𝜒/𝛤 =7.336
1.198
𝛶 = 6.125
The value of Υ was substituted into the Calgon fifth-order polynomial for G. The value of G was
calculated as 31.81 cm3 per 100 g carbon.
111
Chapter 7: Energy
Introduction The growth of the cannabis industry and its corresponding energy demands were
unanticipated by utilities, public utility commissions, and government officials (Bezdek et al.,
2017). The rapid legalization of the industry has resulted in a tendency to rush into the market,
which has not been conducive to energy-efficient practices (Kolwey, 2017). In 2015, Bloomberg
researchers estimated that cannabis cultivation facilities made up almost 50% of the new power
demand in Colorado (Remillard & Collins, 2017). The industry is extremely energy-intensive, and
is placing strains on local utilities and power grids (Bezdek et al., 2017).
This chapter focuses strictly on the energy requirements associated with indoor cultivation
facilities. An indoor cultivation facility refers to buildings that do not supply natural light for
growth (Small, 2018). The majority of commercial plants are grown outdoors since the production
costs can be significantly less expensive than indoor cultivation. However, the demand for
products outside of the outdoor growing season, as well as the other advantages associated with
indoor cultivation, can make it economically feasible despite the high energy costs (Small, 2018).
Indoor cannabis cultivation uses significant energy primarily due to lighting,
dehumidification, and HVAC (CCC, 2020). More specifically, indoor cultivation energy uses
include high-intensity lighting, dehumidification to remove water vapor and avoid mold formation,
space heating or cooling during non-illuminated periods and drying, pre-heating of irrigation
water, and ventilation and air-conditioning to remove waste heat (Mills, 2012). Furthermore,
significant energy inefficiencies occur in air cleaning, noise and odor control, and diesel generators
(Mills, 2012).
Areas of Energy Use A widely-cited study from 2012 estimated that national cannabis production requires
approximately 20 TW per hour per year. This is 8-times as much energy per square foot as a typical
U.S. commercial building, 4-times as much as a hospital, and 18-times that of an average U.S.
home (Mills, 2012). The areas of energy use in cannabis cultivation can be broken down as shown
in Figure 7.1.

112
Figure 7.1. Carbon footprint of indoor Cannabis production (Mills, 2012).25
For the purposes of this research, vehicles will not be discussed, since it is associated with
the transportation and distribution of small quantities of product (Mills, 2012). Such use of vehicles
does not apply directly to indoor cultivation or processing of cannabis and is not a unique
consideration for the industry. However, the energy use associated with vehicles would have to be
considered for outdoor cultivation because the use of farming equipment is an integral component.
This discussion will include the energy consumption of extractions, which is not included in Mills’
analysis. Since extractions is the largest growing sector of the cannabis industry (New Frontier
Data, 2019), it is a growing concern that must be addressed.
Dehumidification and Ventilation
Heating, ventilation, and air conditioning (HVAC) systems are the primary source of
energy consumption in the cannabis industry. The main purpose of HVAC systems is to control
the humidity and temperature of the facility. The growing environment is controlled through
HVAC systems by cooling the air to remove water vapor and then reheating the air to desire room
temperature (Remillard & Collins, 2017). The air needs to be cooled to offset the heat generated
by the intense lighting (CCC, 2020) and proper ventilation is required to remove waste air,
including excess heat (Mills, 2012) and plant emissions (i.e.terpenes, O2). Dehumidification is
necessary to remove water vapor from the air to prevent mold and mildew (CCC, 2020; Mills,
2012). Heating and cooling are also necessary during non-illuminated periods and drying (Mills,
2012).
The energy requirement for HVAC systems and dehumidifiers can vary depending on the
facility. The type of HVAC system used for a particular facility depends on factors such as the
local climate and building size. Proper maintenance and operation of the HVAC system, as well
as building insulation, air changes per hour, and ventilation filters, can impact the efficiency of the
system (Arnold, 2013). According to Mills (2012), HVAC and dehumidification account for 50%
25Data can be found in Appendix A.
113
(2,288 kg) of the CO2 emissions produced per kilogram of product. The energy intensity is equal
to 3,436 kW per hour per kilogram of product (Mills, 2012).
A common industry practice is to choose the lowest-cost option for HVAC systems
(Remillard & Collins, 2017). For cultivation facilities, HVAC systems are often retrofitted or not
installed by licensed professionals (Arnold, 2013). For small or medium-sized facilities, the
standard practice appears to be to install one or several rooftop HVAC units and portable
dehumidifiers in the flower rooms. The rooftop HVAC units are designed and operated to
minimize the use of outdoor air, in order to prevent contamination and maintain CO2 levels
(Kolwey, 2017). However, rooftop HVAC units are typically not designed to handle the significant
cooling required to remove excess moisture from the plants’ transpiration (Kolwey, 2017). When
the HVAC systems are not designed for the unique conditions of a cannabis facility, it can be
difficult to control the grow environment. This can lead to frustration with the installed system,
which results in a “Band-Aid” fix where more and more standalone equipment is installed until
the desired conditions are met, ultimately increasing the energy use (Remillard & Collins, 2017).
Lighting
Lighting is the second largest energy consumer in the cannabis industry. Indoor cultivation
facilities require high-intensity lighting to achieve optimal plant growth and flower production
(Kolwey, 2017). The lights used in cannabis production are very powerful and have significantly
higher energy use and light intensity compared to typical screw-in light bulbs (CCC, 2020). The
lighting levels of cultivation facilities are 500-times greater than the recommended lighting level
for reading (Mills, 2020).
Energy estimates for lighting depend on the lighting schedule required for the various
stages of plant growth. Therefore different amounts of electricity are used during the growing
phase (Arnold, 2013). The lighting requirement for cannabis plants changes during the
seedling/clone, vegetation, and flowering stages are summarized in Table 7.1. During the
seedling/clone stage, low-intensity fluorescent lighting is preferred in order to reduce the chance
of damaging the seedlings (Remillard & Collins, 2017). For vegetative growth, 600 W or 1,000 W
metal halide (MH) high-intensity discharge (HID) fixtures or high-intensity T5 fluorescent lighting
fixtures are used for each 4-ft by 4-ft area of plants. These lighting fixtures are preferred because
plants thrive under red- and blue-spectra light in the vegetative stage (Remillard & Collins, 2017;
Kolwey, 2017). During the flowering stage, 1,000 W high pressure sodium (HPS) fixtures are
preferred for their concentration of yellow- and red-spectra light (Remillard & Collins, 2017;
Kolwey, 2017). It should be noted that HPS fixtures can be used for all stages of the growing
cycle (Remillard & Collins, 2017).

114
Table 7.1. Industry Standard Practices for Lighting26
Stage of Life Type of Light Hours per Day
of Lighting
Seedling/Clone T5HO Fluorescents 18-24
Vegetative MH HID Fixtures 18-24
Flowering HPS Fixtures 12
Cultivation facilities can contain 50,000 to 100,000 W of installed lighting power (Mills,
2012). According to Mills, lighting accounts for 33% (1,520 kg) of the CO2 emissions produced
per kilogram of product. The energy intensity is equal to 2,283 kW per hour per kilogram of
product (Mills, 2012).
Carbon Dioxide Injection
In the cultivation stage of cannabis production, indoor carbon dioxide levels are raised to
enhance plant growth (Bortek, 2017; Mills, 2012). Carbon dioxide levels are often increased to
800-1,000 ppm, or about 4-times the natural concentration, to increase yields by shortening the
growth cycle (Bortek, 2017; Mills, 2012). Increasing the carbon dioxide to these levels can
increase yields by 10-25% (Bortek, 2017). By decreasing the growth cycle, this practice could
reduce final energy intensity (Mills, 2012). However, this practice adds heat to the grow room
which may be utilized in the winter, but must be compensated for through air conditioning in the
summer (Mills, 2012). It is common for cannabis facilities to obtain carbon dioxide through
burning natural gases like propane or by purchasing it outright from a supplier (Bortek, 2017;
Mills, 2012; Overcash et al., 2007). The Denver Cannabis Environmental Best Management
Practices recommends that burning natural gases to obtain carbon dioxide should not be used due
to the high levels of waste heat produced, as well as the potential to create dangerous indoor
environments when improperly vented (DDPHE, 2018). Instead, they recommend that facilities
should purchase bottled carbon dioxide from an outside manufacturer (DDPHE, 2018). It is
estimated that carbon dioxide injection produces an energy intensity of 93 kW/h/kg yield and
emissions of 82 kgCO2 emissions/kg yield; accounting for 1-2% of a facility’s carbon footprint
(Mills, 2012).
Drying Process
The drying stage in the cultivation process requires proper ventilation, humidity, and
temperature control. Temperatures in the drying room range from 65-75°F to preserve the terpenes
in the plants and a relative humidity of approximately 50% to prevent mold from forming (Mills,
2012; Morrow, 2020). The drying room uses both a humidifier and a dehumidifier, as well as
oscillating fans to closely monitor the conditions of the room. It is estimated that this stage of the
production process produces an energy intensity of 90 kW/h/kg yield and emissions of 60 kgCO2
emissions/kg yield; accounting for 1% of a facility’s carbon footprint (Mills, 2012).
26Arnold, 2013; Remillard & Collins, 2017; Kolwey, 2017

115
Water Handling
Water handling refers to the way water is stored and drawn. Water must be handled in a
safe manner in order to prevent contamination (van Wijk & Christoffers, 2005). In the cannabis
industry, cultivators rely on large storage tanks to hold water for multiple days’ worth of normal
operation. To ensure water quality, the tanks are disinfected on a regular basis and the water is
delivered through clean, water delivery systems (Badertscher & Badertscher, 2018).
The energy requirements of water handling include the application and heating of irrigation
water (Mills, 2012). Cannabis water-systems, described in Chapter 3, deliver a consistent rate of
water to the plants. The energy required to run the water-system depends on the quantity of water
that must be delivered at any given time, how long the system must run, and what type of system
is used. For example, a system that delivers water to one grow room at a time requires less pump
capacity, and therefore less energy, than a system that delivers water to multiple grow rooms at
once (Badertscher & Badertscher, 2018). In addition to delivery, the water is often heated to
enhance nutrient solubility and the oxygen content of the water. If dry fertilizers are used, nutrient
mixing can be improved by using warm water. The warm temperature of the water will help the
fertilizer dissolve (Badertscher & Badertscher, 2018). During delivery, water temperatures are kept
between 72°F and 75°F. At 72°F, water retains more oxygen, which can aid in plant growth
(Badertscher & Badertscher, 2018).
According to Mills, water handling accounts for 2% (115 kg) of the CO2 emissions
produced per kilogram of product. The energy intensity is equal to 117 kW per hour per kilogram
of product (Mills, 2012).
Natural Gas Generators
Other contributors to a facility’s energy consumption are generators that rely on the
combustion of natural gas. While common in illegal grow facilities to avoid suspicion from energy
companies, legal facilities may wish to use them in addition to obtaining power from the grid.
Complete off-grid production increases the estimated 4,600 kg of carbon dioxide emissions by
50% to 6,600 kg (Mills, 2012).
Extractions
The energy consumption of the extraction process is dependent on the extraction method
used as well as the specific model of machinery used. Extraction techniques vary in energy
consumption, with some techniques requiring much more energy, such as supercritical CO2, than
others. Since there is no formal method to estimate the energy consumption of the extraction
process, an estimation of the energy requirements based on the phase changes in each process was
calculated in Chapter 5. The results are summarized below in Table 7.2.

116
Table 7.2. Total Energy & Equivalent CO2 Emissions of Extraction Methods
Extraction Method Total Energy Required
(𝒌𝑾𝒉
𝒍𝒃 𝒆𝒙𝒕𝒓𝒂𝒄𝒕)
Equivalent CO2 Emissions
(𝒍𝒃 𝑪𝑶𝟐
𝒍𝒃 𝒆𝒙𝒕𝒓𝒂𝒄𝒕)
Pure Butane 4.34 6.77
Cooled Ethanol 0.53 0.83
Supercritical CO2 14.91 23.24
Cold Water 0.57 0.89
Food-based* 0.49 0.77
*This extraction method was evaluated using vegetable and olive oil.
Industry Analysis Projection of Carbon Dioxide Emissions
To estimate the carbon dioxide emissions as the industry grows, projected industry sales
were obtained from the U.S. Cannabis Report: 2019 Industry Outlook (New Frontier Data, 2019).
The data used for the analysis included estimated adult-use only sales and full legal sales, which
included medical sales, for the years 2017 to 2025. According to the report, the U.S. legal cannabis
industry is expected to grow to $29.7 billion by 2025. The market projections are based solely on
the state markets that have passed medical and adult-use legalization initiatives as of July 2019,
and do not include assumptions for any additional states that may pass legalization measures before
2025 (NFC, 2019).
As the industry continues to grow, so will the amount of CO2 emissions released. The future
CO2 emissions of the cannabis industry were estimated from the projected sales growth, the
average cost of cannabis products, and the amount of CO2 released per kg of product. The average
cost per kg of final product was calculated based on a report that surveyed 13 U.S. cities for the
average price of cannabis in each city (ABCD Agency, 2018). These values were averaged to
obtain a value of $10,313.08 per kg of cannabis (Appendix B). The estimated kg of product sold
per year was calculated from the projected sales growth and the average cost of cannabis products
(Appendix C). An example calculation for the kg of product for adult-use only sales in 2025 is
shown below:
𝑘𝑔 𝑜𝑓 𝑃𝑟𝑜𝑑𝑢𝑐𝑡 =𝐸𝑠𝑡𝑖𝑚𝑎𝑡𝑒𝑑 𝑆𝑎𝑙𝑒𝑠
𝐴𝑣𝑒𝑟𝑎𝑔𝑒 𝐶𝑜𝑠𝑡
𝑘𝑔 𝑜𝑓 𝑃𝑟𝑜𝑑𝑢𝑐𝑡 =$16,600,000,000
$10,313.08 𝑝𝑒𝑟 𝑘𝑔
𝑘𝑔 𝑜𝑓 𝑃𝑟𝑜𝑑𝑢𝑐𝑡 = 1,609,607 𝑘𝑔
The equivalent CO2 emissions for the quantity of cannabis sold each year was determined
using the value of 4,600 kg of CO2 per kg of final product (Mills, 2012). The estimated amount of

117
CO2 emissions per year was calculated from the kg of product sold per year and the emissions per
kg of product (Appendix C). An example calculation for the CO2 emissions for adult-use only
sales in 2025 is shown below:
𝑘𝑔 𝑜𝑓 𝐶𝑂2 = 𝑘𝑔 𝑜𝑓 𝑃𝑟𝑜𝑑𝑢𝑐𝑡 ∗ 4600𝑘𝑔 𝐶𝑂2
𝑘𝑔 𝑝𝑟𝑜𝑑𝑢𝑐𝑡
𝑘𝑔 𝑜𝑓 𝐶𝑂2 = 1,609,607 𝑘𝑔 ∗ 4600𝑘𝑔 𝐶𝑂2
𝑘𝑔 𝑝𝑟𝑜𝑑𝑢𝑐𝑡
𝑘𝑔 𝑜𝑓 𝐶𝑂2 = 7,404,191,840 𝑘𝑔
The projected CO2 emissions for adult-use only and all legal cannabis are shown below in Figure
7.2.
Figure 7.2. Projected CO2 Emissions
Projection of Energy Costs
It is estimated that the total energy costs for indoor cannabis facilities varies between 20-
50% of total operating costs (Remillard & Collins, 2017). Energy also accounts for nearly 50% of
the wholesale price of cannabis, depending on the grower, strain, state, and operating costs. As
competition increases, the price of cannabis will fall and margins will decrease, resulting in an
increase in the share of energy in total production costs (Bezdek et al., 2017). As the price of
cannabis decreases the need for lower operational costs will increase, which can be predominantly
achieved through energy efficiency (Remillard & Collins, 2017).
Mills (2012) estimated that the national-average energy costs to produce one kg of final
product was $2,500 per kg. The future energy costs per year was estimated from the kg of product
sold per year and the national-average energy costs (Appendix D). An example calculation for the
energy costs for adult-use only sales in 2025 is shown below:

118
𝐸𝑛𝑒𝑟𝑔𝑦 𝐶𝑜𝑠𝑡 = 𝑘𝑔 𝑜𝑓 𝑃𝑟𝑜𝑑𝑢𝑐𝑡 ∗ $2500𝑈𝑆𝐷
𝑘𝑔 𝑝𝑟𝑜𝑑𝑢𝑐𝑡
𝐸𝑛𝑒𝑟𝑔𝑦 𝐶𝑜𝑠𝑡 = 1,609,607 𝑘𝑔 ∗ $2500𝑈𝑆𝐷
𝑘𝑔 𝑝𝑟𝑜𝑑𝑢𝑐𝑡
𝐸𝑛𝑒𝑟𝑔𝑦 𝐶𝑜𝑠𝑡 = $4.02 𝐵𝑖𝑙𝑙𝑖𝑜𝑛
The projected energy costs for adult-use only and all legal cannabis are shown below in Figure
7.3.
Figure 7.3. Projected Energy Costs
Discussion
These calculations were based on a number of assumptions; the first was that the average
price of cannabis would remain at $10,313.08 per kg. The price of cannabis has varied over the
years, with most states experiencing a decline in the price due to the issuing of more licenses and
an increase in supply. When Colorado first legalized recreational cannabis in 2014, the prices
peaked 6 months after legalization and has continued to decrease since then. Washington and
Oregon experienced similar trends; the prices in both states continue to fall (New Frontier Data,
2019; Willis 2018). Prices for cannabis may continue to fall as more states legalize the product
and compete with the illicit market (New Frontier Data, 2019).
The second assumption is that the cost of energy has remained the same since 2012. The
national-average energy costs to produce one kg of final product was estimated to be $2,500 per
kg by Mills. This value is based on the cost of energy in 2012. The May 2012 energy cost for the
industrial sector was approximately 6.6 cents/kwh and the cost in January 2020 was approximately
6.3 cents/kwh (United States Energy Information Administration, 2020). While the cost of energy
does vary, it was decided that this was not a significant enough difference to recalculate Mills’
value.

119
The other assumptions used in the calculations are in regard to the values presented by
Mills. The model utilized by Mills calculated the total energy consumption per production module,
which is defined as a 4 x 4 x 8ft. Based on the model, each production module produces 0.5 kg of
product, per production cycle. The energy cost for one module is approximately $5500 or $2500
per kg of final product (Mills, 2012). Using this model, Mills also calculated a value of 4600 kg
CO2 per kg of final product. These values do not include the energy inputs required for the soil,
fertilizer, building materials, refinement, or retailing (Mills, 2012). Furthermore, the values
presented in the study are based on the common practices of the cannabis industry of 2012, which
do not include common techniques used today. These practices include “energy-intensive”
practices such as hydroponics, large-scale water purification, and air, noise and odor control (Mills,
2012). Additionally, Mills does not include the energy usage of extractions, which is the largest
growing sector of the cannabis industry (New Frontier Data, 2019).
Despite the missing energy parameters, the energy cost of $2500 per kg of final product
and the carbon emissions of 4600 kg CO2 per kg of final product were not adjusted for ease of
analysis. As Mills (2012) mentions, processes exist that will use less or more energy per-unit-yield
and strategies for lowering energy inputs may result in lower yields, which would not necessarily
reduce the energy cost and carbon emissions per unit weight. It was assumed that the practices
would be variable enough for Mills’ value to still be a valid approximation.
In Mills’ (2012) evaluation, transportation accounts for 546 kg (12%) of the CO2 emissions
produced per kilogram of product. The transportation portion accounts for vehicle use associated
with production and distribution. According to Mills (2012), this accounts “both for workers and
for large numbers of small-quantities transported and then redistributed over long distances before
final sale.” Mills (2012) states that the “assumptions about vehicle energy use are likely
conservative, given the longer-range transportation associated with interstate distribution.” While
the long-term transportation is important to consider, Mills’ transportation assumptions may be
misguided. As of 2020, interstate distribution of cannabis products is restricted by federal law and
there is no national market (New Frontier Data, 2019).
To understand the full environmental impacts of cannabis production as the industry grows,
the effects of the national market would have to be considered. A national market could lead to
reduced competition, which may or may not encourage more sustainable practices, as a larger
company with higher profit margins could afford to invest in energy efficient technology and other
sustainable practices. However, a national market would mean that interstate distribution would
occur, which may significantly increase the CO2 emissions.
Despite the fact that the Mills study is from 2012, the values are still widely referenced by
best management practices and other researchers. As more cannabis companies are established,
more data will be available. A current, comprehensive evaluation of the cannabis could be
performed to update Mills’ 2012 evaluation. A comprehensive evaluation would have to include
the “energy-intensive” practices that Mills chose to omit, as well as the increased energy demand
of investing in more sustainable practices.
Recommendations Planning Ahead
Overall, the nature of the cannabis market has not been conducive to energy-efficient
practices (Kolwey, 2017). When recreational cannabis is legalized in a new state, eager
entrepreneurs tend to rush into the market. Most new operations, particularly small- and medium-
sized growers, start their businesses by leasing an empty warehouse and set up simple, low-cost

120
equipment. When new entrepreneurs hastily enter the industry, they miss the opportunity to
carefully plan an energy efficient operation (Kolwey, 2017).
By implementing lighting and HVAC best practices, a medium-size or larger indoor grow
operation can achieve up to 30-35% energy savings compared to a standard indoor cultivation
facility (Kolwey, 2017). However, energy-efficiency does not always result in sufficient energy
use reductions. A 90,000 sq.ft indoor warehouse facility installed a $2,000,000 rooftop solar array,
LED lights, and the most efficient HVAC and insulation products, but still pays over $1,000,000
per month for the electric bill (Bezdek et al., 2017). This discrepancy may be attributed to the
energy-intensive practices that are standard across most cultivation facilities. Cannabis facilities
need to find a way to balance energy-intensive practices with less-intensive methods, as well as
the use of energy-efficient technology through proper planning in order to reduce their footprint.
Alternative Lighting
Light-Emitting Diode (LED) lamps are an energy efficient lighting alternative for indoor
cultivation facilities. One case study, referenced by the Denver Cannabis Environmental Best
Management Practices Guide (2018), replaced 72 1,000 W single-ended HPS lights with a mix of
6 bar and 10 bar BML LED lights in a vegetative grow room. By replacing the HPS lights with
LEDs, there was an immediate energy savings of 36,360 W, which equated to $1,400 in electric
cost savings. The study found that using LEDs decrease the vegetative growing period by 1-2
weeks. The study also reported a decreased demand on the HVAC equipment, due to a lower heat
load (DDPHE, 2018). According to Kolwey (2017), LED lighting has been successfully installed
in vegetative and flowering rooms. LED fixtures have saved up to 50% of the lighting energy in
vegetative rooms and double-ended HPS lights have saved 20-25% of the lighting energy
compared to the standard practice. Facilities have also successfully implemented LED and
LED/HPS hybrid fixtures in flower rooms for up to 30-40% energy savings (Kolwey, 2017).
However, the industry has been slow to adopt LED lighting due to the initial costs of
installing LEDs and concerns about their effectiveness in terms of product yield and quality. LED
grow lighting is still developing, and research regarding the effectiveness of LEDs compared to
HID lighting are not are not widely available (Remillard & Collins, 2017). Furthermore, direct
comparisons between HID, HPS, and LED lighting are challenging to establish. Even under the
exact same growing conditions and plant genetics, a 10-20% difference in yield can be expected
(Caulkins et al., 2013). Therefore, meaningful comparisons when assessing the difference in
lighting techniques are difficult to establish. It is difficult to determine if the differences in yield
are due to the lighting or are inherent to the growth of the plant (Remillard & Collins, 2017).
Ventilation and Dehumidification Alternatives
The Denver Cannabis Environmental Best Management Practices Guide (2018) details
alternative ventilation and dehumidification systems that may be more energy efficient than
traditional systems. Alternative cooling methodologies to standard HVAC systems include
evaporative cooling, mini splits, variable refrigerant flow, chilled water systems, and water-cooled
condensers with cooling towers and geothermal systems. Alternative dehumidification
methodologies in standalone dehumidifiers, reheat systems, desiccant dehumidifiers, and
economizers (DDPHE, 2018).
Smaller indoor cultivation facilities have installed split ductless air conditioning units in
place of standard rooftop units to save energy on cooling and split ductless air conditioning units
in place of standard rooftop units. Medium- and large-sized facilities have saved up to 40% of

121
energy costs compared to standard practices by implementing chilled water systems for both
cooling and dehumidification (Kolwey, 2017).
Combined Heat and Power Systems
For facilities that generate power on-site, Combined Heat & Power (CHP) systems may be
economically, environmentally and operationally advantageous. CHP systems, also known as
cogeneration systems, use a natural gas generator to produce electricity. When installed and run
properly, CHP systems can reduce a facility’s CO2 emissions by 25-45% (DDPHE, 2018). In the
cannabis industry, CHP systems are being used to generate electricity to operate the grow lights
(Kuack, n.d.).
CHP systems repurpose waste products to offset a facility’s HVAC and CO2 needs
(DDPHE, 2018). The system purifies the exhaust gases from the burning of natural gas or biogas
and produces CO2. The CO2 can then be used to supplement the atmospheric CO2 injections in the
cultivation facility. The waste heat generated by the CHP system can be used to produce chilled
water or air to cool the facility (DDPHE, 2018; Kuack, n.d.).
While CHP systems are an attractive alternative for on-site energy production, they are
complex install and run. Significant technical expertise is required for the design, build, and
maintenance of these systems. Facilities interested in CHP systems should consult qualified
personnel to ensure a successful system (DDPHE, 2018).
Greenhouses
Greenhouse grow operations can save 60-75% of the energy needed per pound of flower
compared to indoor grow facilities (Kolwey, 2017). The most efficient greenhouses required less
energy than indoor cultivation facilities due to the use of natural sunlight instead of artificial lights
(Small, 2018). As discussed previously, plants require 18-24 hours of light per day during the
vegetative stage and 12 hours of light per day during the flowering stage when grown inside.
Greenhouses can provide a majority of the light during the day; only up to six hours of
supplemental artificial lighting is needed per day for the vegetative stage and the flowering stage
may not need any supplemental lighting (Kolwey, 2017). In addition, greenhouses can be designed
to increase air circulation, saving up to 75% of the energy needed for typical HVAC and
dehumidification systems (Kolwey, 2017).
The simplest form of greenhouses are temporary, tent-like structures referred to as
“tunnels.” Low tunnels are 1.2 m high, semi-circular covers that must be moved to access the plant.
High tunnels, also known as hoop houses, are high enough to allow a person to walk inside. Larger,
simple greenhouses are often by covering a frame with plastic. These “low-tech” greenhouses are
cheap to build and operate, but are temporary and serve mainly to extend the growing season in
early spring and/or late fall by providing warmth (Small, 2018). Advanced greenhouses that allow
for environmental controls, such as temperature, humidity, air movement, and light intensity and
duration, are often built in cool and cold climates. Hybrid greenhouses are buildings with solid
side walls and a translucent ceiling that can provide natural sunlight while also protecting the plants
from public view (Small, 2018).
Since greenhouses require much less energy than indoor cultivation facilities, they could
be a viable alternative to combat high energy costs. However, the decision to establish a
greenhouse versus an indoor cultivation facility involves many factors. The energy needs of a
greenhouse depend largely on the climate in which they are located. They are effective in mild
climates, such as Colorado, but can be challenging to operate in hot climates such as Arizona or

122
southern Nevada (Kolwey, 2017). Many indoor cultivation facilities are established in old
warehouses or industrial spaces. Therefore, cities already have the infrastructure required to
support indoor cultivation facilities, whereas there may not be enough space for greenhouses
(Kolwey, 2017). Warehouses are also more versatile spaces that can be used for another business
if the cannabis business fails. Investors may be hesitant to fund greenhouse grows because they
cannot be repurposed as easily as warehouses (Kolwey, 2017). Furthermore, obtaining a permit
for a cannabis greenhouse can be challenging compared to obtaining a permit for an indoor facility.
The permitting and inspection process for greenhouses tends to be less established than the
processes for warehouse spaces. Therefore, city officials and regulators are not as knowledgeable
or comfortable with greenhouse grows. In some states, permits are not available for greenhouse
grows at all (Kolwey, 2017).
Regulatory Controls
To compensate for the intensive energy requirements of the industry, many states are using
regulations to pressure the industry to adopt more energy-efficient practices. States like
Massachusetts and Illinois are requiring cannabis establishments (i.e. cultivators, processors,
dispensaries) to adopt specific energy-saving measures as part of the application process. In
Massachusetts, in order to obtain a license, potential energy reduction opportunities and a plan for
implementation must be outlined (935 CMR 500.000). The plan must include strategies to reduce
the facility’s energy demand such as, lighting schedules, active load management, energy storage,
and renewable energy generation. If renewable energy generation is not feasible, the state requires
an explanation as to why. In addition to the plan, Massachusetts provides incentives to using
renewable energy sources through certifications. The facility owner may obtain an “Energy and
Environmental Leader” certification if they have met or exceeded energy and environmental
impact goals, complied with best management practices, and offset 100% of their energy
consumption with renewable energy credits. By having this certification, their products may be
labelled “made with 100% renewable energy.”
Illinois has adopted similar regulations for facilities. In order to produce cannabis in
Illinois, facilities must not use lighting that exceeds 36 watts per square foot of canopy, with a
photosynthetic photon efficacy (ppe) of no less than 2.2 micromoles per joule. Additionally, the
lighting must be certified by DesignLights Consortium on their Horticultural Specification
Qualified Products List, to ensure energy efficiency. In regard to HVAC systems, for facilities
with less than 6,000 sq.ft of canopy space, HVAC systems must be high efficiency ductless, split
HVAC units. For canopies greater than 6,000 sq.ft all HVAC must be variable refrigerant flow
HVAC units or better (Ill. Admin. Code tit. 101-0027 (2019)).
Other states are requiring cannabis facilities to purchase renewable energy certificates.
Renewable energy certificates (RECs) represent one megawatt hour of energy generated from a
renewable source, such as wind, solar, hydro, or certain types of renewable biomass (The
International REC Standard, n.d.). Essentially, when facilities purchase certificates, they pay a
renewable energy generator to produce energy from a renewable source to offset the amount of
energy the facility consumed from a non-renewable source. For example, in California, regulations
require facilities to purchase RECs from the American Carbon Registry, Climate Action Reserve,
or Verified Carbon Standard if their “greenhouse gas emissions intensity is greater than the local
utility provider’s greenhouse gas emission intensity” (Cal. Code Regs. tit. 16, § 8307, 2018).
Another example of this can be seen in the regulations for Boulder, CO, where 100% of a cannabis
cultivation facility’s energy use must be offset with RECs (Boulder, CO Municipal Code § 6.16.8).

123
While there is still insufficient economic pressure for facilities to adopt more energy-efficient
technology and renewable energy sources, regulations can be used in tandem with proper planning
to reduce the impacts of the industry as a whole.

124
References
ABCD Agency. (2018). 2018 Cannabis Price Index. Retrieved from http://weedindex.io/
Arnold, J. M. (2013). Energy consumption and environmental impacts associated with cannabis
cultivation. (Doctoral dissertation, Humboldt State University).
Badertscher K. & Badertscher K. (2018). 8 Steps to Better Water Delivery. Cannabis Business
Times. Retrieved from https://www.cannabisbusinesstimes.com/article/8-steps-to-better-
water-delivery/
Bartok, J.W. (2017). CO2 Enrichment for Cannabis. Cannabis Business Times. Retrieved from
https://www.cannabisbusinesstimes.com/article/co2-enrichment- for-cannabis/.
Bezdek, R., Harshfield, M., Tegart, S., & Vyas, U. (2017). Surprising Energy Requirements of
the Cannabis Industry. Public Utilities Fortnightly.
Boulder, CO Municipal Code § 6.16.8. Retrieved from https://library.municode.com/co/boulder/
codes/municipal_code?nodeId=TIT6HESASA_CH16REMA
Cal. Code Regs. tit. 16, § 8307 (2018). [PDF File]. Retrieved from
https://static.cdfa.ca.gov/MCCP/document/CDFA%20Final%20Regulation%20Text_011
62019_Clean.pdf
Caulkins, J., Cohen, M., & Zamarra, L. (2013). Estimating Adequate Licensed Square Footage
for Production. [PDF File]. Retrieved from https://lcb.wa.gov/publications/Marijuana/
BOTEC%20reports/5a_Cannabis_Yields-Final.pdf
Denver Department of Public Health & Environment (DDPHE). (October 2018). “Cannabis
Environmental Best Management Practices Guide.” [PDF File]. Retrieved from
https://www.denvergov.org/content/dam/denvergov/Portals/771/documents/EQ/MJ%20S
ustainability/Cannabis_BestManagementPracticesGuide_FINAL.pdf
Ill. Admin. Code tit. 101-0027 (2019). Retrieved from
http://www.ilga.gov/legislation/publicacts/101/101-0027.htm
Kolwey, N. (2017). A Budding Opportunity: Energy efficiency best practices for cannabis grow
operations. Southwest Energy Efficiency Project. Retrieved from
https://www.swenergy.org/data/sites/1/media/documents/publications/documents/A%20B
udding%20Opportunity%20%20Energy%20efficiency%20best%20practices%20for%20c
annabis%20grow%20operations.pdf
Kuack, D. (n.d.). Controlled-Environment Growers Power Their Operations with Cogeneration
Systems. Retrieved from https://glase.org/interviews/controlled-environment- growers-
power-their-operations-with-cogeneration-systems/

125
Mass. Gen. Laws. ch. 935, § 500.000 (2019). Retrieved from
https://www.mass.gov/regulations/935-CMR-50000-adult-use-of-marijuana
Mills, E. (2012). The Carbon Footprint of Indoor Cannabis Production. Energy Policy, 46,
58-67.
Morrow, K. (2020). Master the Art of Drying and Curing Cannabis. Cannabis Business Times.
Retrieved from https://www.cannabisbusinesstimes.com/article/ master-the-art-of-drying-
curing-cannabis/
New Frontier Data. (2019). Global Cannabis Report: 2019 Industry Outlook. Retrieved from
https://newfrontierdata.com/product/global-cannabis-2019/
Overcash, M., Li, Y., Griffing, E., and Rice, G. (2007). A life cycle inventory of carbon dioxide
as a solvent and additive for industry and in products. Journal of Chemical Technology
and Biotechnology, 82(11): 1023-1038.
Remillard, J., & Collins, N. (2017). Trends and Observations of Energy Use in the Cannabis
Industry. ACEEE Summer Study on Energy Efficiency in Industry. Retrieved from
https://www.aceee.org/files/proceedings/2017/data/polopoly_fs/1.3687880.1501159058!/
fileserver/file/790266/filename/0036_0053_000046.pdf
Small, E. (2018). Marijuana–unsustainable, unecological and unnecessary cultivation in energy-
hog greenhouses. Biodiversity, 19(3-4), 255-271.
The International REC Standard. (n.d.) How The I-REC Standard Works. Retrieved from
https://www.irecstandard.org/how-the-i-rec-standard-works
United States Energy Information Administration. (2020). Average Price of Electricity to
Ultimate Customers by End-Use Sector. Electric Power Monthly. Retrieved from
https://www.eia.gov/electricity/monthly/epm_table_grapher. php?t=epmt_5_6_a
van Wijk, C. & Christoffers, T. (2005). Household water treatment, storage and handling.
Retrieved from https://www.lboro.ac.uk/research/wedc/well/water-supply/ws-factsheets
/household-water-treatment,-storage-and-handling/
Willis, S. (2018). Marijuana Prices After Legal Growers Enter the Market. Grizzle.
Retrieved from https://grizzle.com/marijuana-prices-legal-growers-market/

126
Appendix A: Carbon footprint of indoor Cannabis production, by end use
Data obtained from Mills, 2012
Category
Emissions Factor
(𝒌𝒈 𝑪𝑶𝟐 𝒆𝒎𝒊𝒔𝒔𝒊𝒐𝒏𝒔
𝒌𝒈 𝒚𝒊𝒆𝒍𝒅)
Lighting 1520
Ventilation & Dehumidification 1231
Air Conditioning 855
Space Heating 202
CO2 Injection 82
Water Handling 115
Drying 60
Vehicles 546
Total 4611
Note: The calculations are based on U.S.-average carbon burdens of 0.666 kg/kW/h. “CO2 injected
to increase foliage” represents combustion fuel to make on-site CO2. Assumes 15% of electricity
is produced in off-grid generators (Mills, 2012).

127
Appendix B: Price of Cannabis
Data obtained from ABCD Agency, 2018
Cost of 1 kg of Cannabis Cost Cost
City $/gram $/kg
Washington D.C. $18.08 $18,080.00
Chicago $11.46 $11,460.00
Philadelphia $11.30 $11,300.00
Boston $11.01 $11,010.00
New York $10.76 $10,760.00
Dallas $10.03 $10,030.00
Houston $10.03 $10,030.00
Phoenix $9.35 $9,350.00
Miami $9.27 $9,270.00
San Francisco $9.27 $9,270.00
Los Angeles $8.14 $8,140.00
Denver $7.79 $7,790.00
Seattle $7.58 $7,580.00
Avg ($/ kg of final product) $10,313.08

128
Appendix C: Projected CO2 Emissions
Year
Adult Use Only Legal Use, including Medical
Estimated
Sales1
Estimated
Amount of
Product2
CO2
Emissions3
Estimated
Sales1
Estimated
Amount of
Product2
CO2
Emissions3
$USD Billion kg cannabis kg CO2 $USD Billion kg cannabis kg CO2
2017 3.3 319982.10 1471917655 7.9 766017.75 3523681659
2018 5.9 572089.21 2631610353 10.3 998732.01 4594167226
2019e 7.6 736928.47 3389870963 13.6 1318714.10 6066084881
2020e 9.3 901767.73 4148131573 17 1648392.63 7582606101
2021e 11.1 1076303.42 4950995748 20.2 1958678.30 9009920191
2022e 12.8 1241142.69 5709256359 23.2 2249571.12 10348027150
2023e 14 1357499.81 6244499142 25.5 2472588.95 11373909152
2024e 14.8 1435071.23 6601327665 27.2 2637428.21 12132169762
2025e 16.6 1609606.92 7404191840 29.7 2879838.89 13247258895
1Estimated sales from New Frontier Data, 2019 2Estimated amount of product calculated based on average cost of cannabis from ABCD Agency,
2018. See Appendix B for average cost calculations. 3Based 4600 kg CO2 emissions per kg of final product from Mills, 2012

129
Appendix D: Projected Energy Costs
Year
Adult Use Only Legal Use, including Medical
Estimated
Sales1
Estimated
Amount of
Product2
Energy Cost3 Estimated
Sales1
Estimated
Amount of
Product2
Energy Cost3
$USD Billion kg cannabis $USD Billion $USD Billion kg cannabis $USD Billion
2017 3.3 319982.10 0.80 7.9 766017.75 1.92
2018 5.9 572089.21 1.43 10.3 998732.01 2.50
2019e 7.6 736928.47 1.84 13.6 1318714.10 3.30
2020e 9.3 901767.73 2.25 17 1648392.63 4.12
2021e 11.1 1076303.42 2.69 20.2 1958678.30 4.90
2022e 12.8 1241142.69 3.10 23.2 2249571.12 5.62
2023e 14 1357499.81 3.39 25.5 2472588.95 6.18
2024e 14.8 1435071.23 3.59 27.2 2637428.21 6.59
2025e 16.6 1609606.92 4.02 29.7 2879838.89 7.20
1Estimated sales from New Frontier Data, 2019 2Estimated amount of product calculated based on average cost of cannabis from ABCD Agency,
2018. See Appendix B for average cost calculations. 3Based $2500 USD per kg of final product from Mills, 2012

130
Chapter 8: Solid and Hazardous Waste
Introduction As the sale of cannabis products continues to grow, so does the production of cannabis
waste. The two main waste streams from cannabis are the plant material and the packaging waste.
Some estimates place the amount of cannabis (and hemp) waste at about 1 million tons in North
America in 2019 (Peterson, 2019).
Multiple wastes are produced by cannabis facilities, as shown in Figure 8.1. These are
highly regulated, either under state cannabis regulations or as hazardous wastes under the EPA.
For most wastes produced by the cannabis industry, their fate is in landfills (Thompson, 2019).
Figure 8.1. Types of Waste.
Types of Waste Plant Material
Cannabis biomass waste, which includes leaves, flowers, and stems, is a regulated material.
Cannabis biomass is heavily regulated in order to prevent it from being diverted outside of the
operation (Badertscher & Badertscher, 2018). A common requirement in legal states is a form of
biomass tracking system under which cultivators are required to keep an audit trail of all of the
cannabis biomass. The biomass is tracked from the moment it is removed from the flower room
until it is disposed of (Badertscher & Badertscher, 2018).
Prior to disposal, many waste regulations require that the biomass be rendered
unrecognizable and unusable. Often, this involves grinding the biomass and mixing it with other
materials, such as growing media, soil, mulch, or food waste (Badertscher & Badertscher, 2018;
CCC, 2020). When the biomass is mixed with other materials, it becomes a commercial trash rather
than a regulated waste and can be sent to a landfill. If the biomass is not immediately disposed of,
it must be securely stored (Badertscher & Badertscher, 2018).
Disposing of cannabis biomass is not always as simple as sending it to a landfill. For
example, under the waste ban regulations in Massachusetts, the biomass “is banned from disposal
in the trash if a business generates one ton or more per week for disposal” (CCC, 2020). If a facility
produces more than one ton of “commercial organic matter” per week for disposal, the must be
disposed of by other methods. Other disposal methods for biomass include composting or
anaerobic digestion (CCC, 2020). In Massachusetts, the biomass needs to be stored in a secure and

131
locked container and location prior to collection. The regulations require that “at least two
Marijuana Establishment agents must witness and document how the marijuana waste is handled”
(CCC, 2020). The facility must also develop and maintain a record of the biomass for at least three
years (CCC, 2020).
Growing Media
More media waste is usually produced than biomass waste. Growing media is often used
once and disposed of (Badertscher & Badertscher, 2018). Depending on the material, the media
can be reused, composted, or must be disposed of. Growing media can be made of organic
materials, such as peat or coco, and inorganic materials, such as foam (Badertscher & Badertscher,
2018).
Organic materials have more potential for reuse than inorganic materials. Media reuse
requires root material removal, grading, blending, amending, sanitizing and recharging. After
processing organic media, including peat, coco, and other organic nutrient soil mixtures can be
reused daily as long as it delivers a consistent performance level (Badertscher & Badertscher,
2018). Composting could be used to reduce the amount of media waste, but some organic materials
do not break down readily. If the media does not compost readily, and there is not enough cannabis
biomass to media ratio, supplemental biomass may need to be acquired (Badertscher &
Badertscher, 2018).
Inorganic media typically produce less waste than organic media. Block media, which
include rockwool and foam blocks are popular inorganic media. Block growing is similar to
container growing, but removes the need for containers. Overall, the volume of waste is lower
when using block media due to the lack of containers. However, block media can be difficult to
reuse due to the root structures grown into the blocks. Block media cannot be incorporated into
compost or field soil because it does not break down (Badertscher & Badertscher, 2018). Other
types of inorganic media include fired clay balls, perlite, gravel, crushed lava rock and similar
materials. These loose, inorganic media are typically used in ebb-and-flow systems. Roots can
easily be removed from the media and the media can be treated with heat or chemicals to kill
pathogens. The reuse potential of these loose, inorganic media is indefinite, meaning media waste
could be eliminated entirely (Badertscher & Badertscher, 2018). Another option to eliminate media
waste is to grow medialess. Media-less growing is an advanced technique, discussed in Chapter 3.
Fertilizers
Depending on the growing technique, cannabis cultivators may use fertilizer solutions to
support plant growth. The solutions are often recycled, but eventually must be replaced and
disposed of. To dispose of fertilizer solutions, concentration or dilution may be used.
Concentration involves evaporating the excess liquid off to produce a low volume of solid residual
salts. Dilution, as the name implies, involved diluting the fertilizer solution with another liquid,
typically water (Badertscher & Badertscher, 2018).
Fertilizers are regulated on a state and local level. Local regulations may or may not allow
for fertilizer solutions to be dumped into a municipal sewer. Local regulations may also allow
sufficiently diluted fertilizer solutions to be released back into watersheds (Badertscher &
Badertscher, 2018). Due to the variety of fertilizer disposal methods in each state and locality, it
is important to verify local laws to ensure proper disposal.

132
Hazardous Waste
Cannabis facilities, particularly extraction facilities, generate hazardous wastes. The
hazardous wastes include: mercury-containing lighting and ballasts, pesticides, solvents, used oil,
other chemicals used in facility operation and maintenance, cannabis soaked in a flammable
solvent for purposes of producing concentrates, electronics (e-waste) and batteries (CCC, 2020;
DDPHE, 2018). Most of the hazardous wastes generated by cannabis facilities are considered
universal wastes (DDPHE, 2018), and are regulated by the EPA under the Resource Conservation
and Recovery Act (RCRA). RCRA is the public law that creates the framework for the proper
management of hazardous and non-hazardous solid waste (EPA, 2020). Federal, as well as state
regulations, include provisions for governing how much hazardous material is stored and for how
long, labeling, manifest, transportation, management, and disposal. If a cannabis facility generates
hazardous waste, they must obtain an EPA ID. A facility’s status as a hazardous waste generator
determines how much waste they may accumulate onsite at one time and how frequently they must
remove the waste to be recycled or disposed of (CCC, 2020).
A particular challenge with hazardous waste is how to manage spent solvent contaminated
with cannabis residue. Under federal law, spent solvents that are contaminated with cannabis
residue cannot cross state lines. This can be problematic if a state does not have a local disposal
site (Thompson et al., 2019). Another concern with hazardous waste is for environmental health
officials who need to identify which wastes are hazardous and which are not when a cannabis
facility shuts down. When a cannabis facility goes out of business or gets shut down due to
regulatory violations, unidentified wastes may be left behind. Until the waste is properly identified,
it must be considered hazardous waste (Keenan & Duazo, n.d.). This can make the cleanup process
more timely and expensive.
Methods of Disposal There are several options for the disposal of cannabis waste including, landfilling,
composting, in-vessel digestion, and incineration. The two most common methods are landfilling
and composting (Thompson, 2019).
Compost
Cannabis waste may be composted after it is ground up and mixed with other organic
material. This organic material includes, “paper waste, cardboard waste, food waste, grease or
other compostable oil waste, bokashi or other compost activators and soil” (DPHE, n.d.). Many
states across the country are looking to reduce the amount of organic material entering landfills
and are requiring cannabis waste to be composted, such as Massachusetts and California
(Thompson, 2019). Composting is more sustainable than the other common alternative, landfilling,
because the waste is reused in another form. There are several challenges in composting cannabis
biomass, including space requirements, cannabis waste regulations, and obtaining other organic
material. Composting requires a certain amount of land area to set up an appropriately-sized
compost pile, which may be problematic for indoor facilities. There is the option to send the
organic waste to a composting facility; however, to avoid concerns about the legal status of
cannabis, many composting facilities do not accept cannabis waste (Thompson, 2019). If a facility
does not have ample space on their property to compost onsite, this leaves them with limited
options. Facilities need to dispose of the waste as quickly as possible, so they are forced to combine
the organics with other facility trash and landfill the mixture, even though it is not the most cost-
effective or sustainable option (Thompson, 2019). Obtaining proper organic material may also be

133
an issue for indoor facilities that use hydroponics or other soilless media (Thompson et al., 2019).
These facilities then have to purchase materials specifically for the purpose of composting.
Landfills
Despite the fact that most of the waste produced by the industry (biomass and growing
media) can be composted, many facilities opt for landfilling. Using landfills is one of the most
inefficient forms of waste disposal for cannabis since it produces more waste than was originally
generated. Cannabis must be, at maximum, 50% of the waste when it is disposed of, so when
biomass waste is mixed with other materials (cat litter, sawdust, shredded paper), double the
amount of organic material is ending up in a landfill. The quantities of this material may be on the
order of several tons per week per facility. When in a landfill, organic matter undergoes anaerobic
decomposition and produces the powerful greenhouse gas, methane. To address this issue, some
states, like Massachusetts, do not allow more than one ton of commercial organic waste per week
to be disposed of in municipal landfills. This quantity includes both cannabis plant material and
the mixing material, so only a half-ton of cannabis biomass could be landfilled per week (CCC,
2020).
Additionally, many states do not have exact guidelines for what is considered “unusable
and unrecognizable,” with definitions for proper mixing materials as vague as “garbage” (OLCC,
n.d.). This leaves the decision on what is appropriate to the generator. Generators have used bleach,
ammonia, paint, smashed vape pens, and other chemicals to render biomass waste unusable
(Thompson et al., 2019). This type of waste cannot be composted or put in a digester, so it must
be disposed of in a landfill. An example of this can be seen in Figure 8.2.
Figure 8.2. Properly disposed cannabis waste (Peterson, 2019), improperly disposed (Thompson
et al., 2019).
In-vessel Digestion
Anaerobic and aerobic digesters are a promising waste disposal technology for the cannabis
industry. Anaerobic digestion occurs when microorganisms break down organic matter in the
absence of oxygen to produce methane, carbon dioxide, and digestate, a wet mixture that is rich in
nutrients (EPA, 2019). Digestate can then be used as a fertilizer for plants and the gases can be
captured and used for another purpose. Technology that utilizes aerobic decomposition looks to
reduce the production of methane. Aerobic decomposition takes place in the presence of oxygen
to produce carbon dioxide and digestate. Aerobic decomposition has a higher energy demand than
anaerobic decomposition and also produces more solids (Eklund, 2009). New technology has been

134
developed by Micron Technology that takes advantage of aerobic decomposition while generating
potable water. Micron Technology developed The Cannavore™ specifically to address the
growing problem of excessive amounts of organic waste generated by the cannabis industry. The
bioprocess utilized in the digester does not generate methane and reduces greenhouse gases
overall, by eliminating those generated by hauling the material and landfilling (Micron
Technology, n.d.). The use of anaerobic or aerobic digesters are associated with large up-front
costs which may not be practical for a company that does not produce a large amount of waste.
Incineration
The incineration of biomass waste produces ash, heat, and flue gas. This flue gas can
include carbon dioxide, nitrogen oxides, particulate matter, volatile organic compounds, and any
other byproducts of the combustion of biomass material (Chen et al., 2017). Waste incinerators
may be installed onsite at cannabis cultivation facilities (OLCC, n.d). The ashes produced may be
used as a source of additional nutrients for plants, like composting, it is an opportunity to recover
essential plant nutrients (source). Research has shown that the application of incinerator ash to
plants increases soil available phosphorus (P) as well as improve P uptake in plants, which can
increase crop yields (Zhang et al., 2001). Air pollution control technology would have to be
implemented if an incinerator is used to mitigate the pollutants that may be present in the flue gas.
These pollutants are highly dependent on the content of the waste, depending on the pesticides and
other chemicals used on the plants. The production of toxic byproducts (ex. dioxin at low
temperatures and high chlorine concentration) during incineration can be mitigated through proper
incineration temperatures (850–950°C) and air emissions control (Zhang et al., 2001). In addition
to onsite incineration, waste may be shipped offsite to be incinerated as municipal trash.
Recommendations Regulations
The regulations surrounding the management of waste generated by the cannabis industry
can be ambiguous. As stated previously, states like Oregon allow cannabis biomass waste to be
rendered unusable by mixing with “soil, sand, other garbage” (OLCC, n.d.). These disposal
guidelines are not specific enough and have the potential to create significant health, safety, and
contamination issues for haulers, generators, and processors (Commendatore, 2019).
In addition to vague wording, regulations can be a hurdle to sustainable practices in the
industry. The rule in most states that requires the 50/50 mix of cannabis waste with non-cannabis
waste can more than double the amount of waste ending up in a landfill (Peterson, 2019). While
there are valid reasons for adopting this type of regulation, it further increases the industry’s
footprint. Regulations have since been altered in Colorado to allow cannabis waste to be mixed
with other compostable waste in the hauling vehicle to mitigate this issue (Peterson, 2019).
Additionally, prior to the passing of Senate Bill 18-187 in 2019, a third party could not pick up
unadulterated cannabis waste in Colorado (Peterson, 2019). This severely limited the options for
reuse in other industries as well as composting offsite, since cannabis has to be unadulterated in
order to compost or further process it.
New technologies for cannabis waste disposal have also required changes to regulations
(i.e. Kind ReDesigned Bokashi fermentation waste disposal, Alpine Waste and Recycling’s
compactor, and Sesh Technologies Manufacturing rosin press) (McGregor, 2017). However,
getting regulations passed that support more sustainable practices is not a straightforward process
and can be challenging engaging with a non-scientific audience (McGregor, 2017).

135
Reducing, Reusing, and Recycling
The standard approach to a product life cycle is often referred to as cradle-to-grave, with
resources flowing in one end and waste flowing out the other, from production to disposal. Most
industries are a collection of linear flows described as “take-make-waste” (Robertson, 2017). Like
most industries, the cannabis industry follows the cradle-to grave concept, with most waste ending
up in landfills (Thompson, 2019).
Industrial ecology studies materials and energy flows through an industrial system, shifting
them from a linear model to a closed-loop model (Robertson, 2017). A different approach to the
cradle-to-grave concept is a cradle-to-cradle system. Cradle-to-cradle systems are a circular-
economy concept that is modeled on nature. The idea is to use the waste from one process as
materials for another industrial process, where output from one industry is input for another and
materials are reused (Robertson, 2017). This idea can be applied to the cannabis industry in several
facets of the process including: solvents, packaging, and biomass waste.
Solvents
Even with the use of closed-loop extraction systems, discussed in Chapter 4, solvents still
need to be disposed of. After multiple runs with the same batch of solvent, the solvent must be
replaced with new solvent. Ignitable and other hazardous solvents, such as butane, are hazardous
and must be handled carefully according to regulations. Organic solvents, such as ethanol, have
the potential to be repurposed.
The two main ways alternatives to land disposal for organic liquid wastes are reuse,
including use as a fuel substitute, and incineration (Blaney, 1986). Prior to reuse or incineration,
the waste must undergo some form of pretreatment. Major solid components need to be removed,
then the organics need to be separated from the waste (Blaney, 1986). In this case, any waxes,
chlorophyll, or other plant compounds would need to be removed. It is emphasized that reuse
solvents should not contain solid material, organics, or other reaction products that may affect the
reuse purpose (König, 2018).
Incineration is simply to destroy the waste and dispose of it as ash (Blaney, 1986). Instead
of incineration, organic solvents can easily be reused for their original purpose or energy recovery.
The solvent can be collected and recycled by distillation. Numerous solvents that are used regularly
at high volumes, such as ethanol, can be recycled by distillation. The solvent can be purified via
column distillation and reused by the facility (König, 2018). However, the purified solvent will
still need to meet quality requirements established by the regulations. The other approach for
solvent reuse is thermal treatment and energy recovery. Thermal reutilization allows spent solvents
to be used as cost-effective input materials for energy production (König, 2018). The reuse product
should contain minimal amounts of water and should only consist of hydrocarbons and oxygen
containing solvents. They should not contain compounds with halogen, sulfur, and nitrogen
molecules (König, 2018).
The potential reuse of solvents from the cannabis industry is a large grey area. Research
needs to be conducted to determine if spent solvents can be purified to the necessary requirements
for extraction or energy recovery. It is also unclear from the current regulations if this would be
possible.

136
Packaging
Packaging cannabis products for sale to consumers represents a significant downstream
waste source. Cannabis products are sold in a variety of different packaging. Common types of
packaging include: vials, mylar bags, concentrate containers, pre-roll tubes, and exit bags
(DDPHE, 2018). While packaging is not an avoidable waste, there are ways to reduce the impact
of packaging on the industry’s sustainability efforts. Packaging that is lightweight requires less
fuel to ship, reducing the associated emissions. Packaging can be made from recycled content and
is recyclable and/or compostable, such as recycled PET plastics, recycled high-density
polyethylene (HDPE) or cardboard. Child-resistant packaging can be used to eliminate the need
for an additional exit package. If exit packaging is necessary, a reusable exit bag can be used and
facilities can encourage customers to return them to the store (DDPHE, 2018).
A closed-loop system for product packaging can be established by investing in a packaging
return program at the point of sale. This would allow customers who do not have access to
recycling services to recycle their packages. It also prevents small plastic containers and pieces
from ending up in a landfill if they are not properly sorted during the recycling process. There is
also potential to establish a takeback program with the packaging supplier or manufacturers that
may be able to reuse the packaging or reform it into new packaging (DDPHE, 2018).
In order to manage the packaging waste from cannabis sales, the companies TerraCycle
and Tweed launched a cannabis packing recycling program throughout Canada (Commendatore,
2019). The Tweed x TerraCycle Cannabis Packaging Recycling Program collects all cannabis
containers from all licensed producers including tins, plastic bags, tubes and bottles with child-
proof caps. All of the packaging products collected by this joint venture are typically difficult to
recycle. Since its debut, the program has collected over 165,000 containers, which would otherwise
would have ended up in landfills. The program is free to join and is active in more than 106 legal
cannabis retail locations across Canada. To make the recycle program accessible to as many
consumers as possible, participants can use drop-off points located at participating retail stores or
register online for free pickup and recycling of discarded containers (Waste360 Staff, 2019).
Repurposing Plant Waste
Bioremediation
There is already significant research on how to repurpose waste hemp fibers. One study by
Vukčević et al. (2015) investigated the production of activated carbon sorbents from waste hemp
fibers for pesticide removal. The study found that activated hemp fibers could successfully be used
as a sorbent in water purification. The activated hemp fibers were highly efficient in removing
pesticides, and mimicked the adsorption capacities of other activated carbon materials (Vukčević
et al., 2015). Another study by Pejic et al. (2009) investigated the use of waste hemp fibers as raw
materials for producing biosorbents and biocarbon sorbents for heavy metal ion removal from
wastewater. The study found that hemp fibers were able to sorb lead, cadmium, and zinc ions from
different ion solutions. During one trial, the hemp fibers sorbed approximately more than 80% of
the metal ions within 5 minutes (Pejic et al., 2009). Hemp fibers have also been used to extract
nickel from sewage sludge and selenium from soil (Leonard, 2018).
According to the current body of research, industrial hemp plants and waste hemp fibers
have potential to be applied in various forms of bioremediation due to its ability to remove a
multitude of toxic substances from soils and water. However, a similar body of literature does not
exist for all forms of cannabis waste. If cannabis waste from recreational cannabis facilities has

137
similar properties to waste hemp fibers, it may be capable of removing toxic metals from soils and
waters as well.
Energy Production
Cannabis biomass and extracted plant material wastes could potentially be used for energy
production. The use of hemp to produce biofuel is currently being explored. One study by Prade
et al. (2011) found that hemp is a suitable energy crop in the cold climate regions of Northern
Europe. The study concluded that hemp has a high energy yield for both solid fuel and biogas
production. The results show that hemp has a similar or superior energy yield compared to other
common energy crops grown in Northern Europe (Prade et al., 2011). Another study by Kreuger
(2012) investigated the energy efficiencies and economic performance of methane and ethanol
production from hemp. The study concluded that despite high energy efficiencies, no biogas
production process is currently not economically viable. For the co-production of biogas, heat, and
power from hemp to be economically viable, the total cost would have to be reduced by one third
(Kreuger, 2011). As noted in the study, the cost of the feedstock accounted for more than half of
the total process cost (Kreuger, 2011). If waste cannabis biomass can produce similar biogas yields
as hemp, it could be a low-cost feedstock source. The extraction plant material waste could provide
another source for biogas production. In the beer industry, brewery mash, a by-product of beer
brewing, is commonly processed to produce biogas (Konrád et al., 2014). Extraction plant material
that is soaked in nonhazardous solvents may have the required properties to process it like beer
mash. In theory, a mixture of biomass and extracted plant material waste could be used in a similar
manner to beer mash to produce a clean fuel source.
Another option for energy production from cannabis waste is to create fuel pellets. The
pelletization process includes milling, drying, and mechanically densifying the biomass to enhance
its heating value and burning characteristics (Pirragalia et al., 2013). For pellets to be an effective
fuel source, the biomass must have low moisture content, low ash and particulate emissions
content, as well as ease of transportation and storage (Pirragalia et al., 2010). A low moisture
content (MC) is needed for solid fuel sources in order to decrease microbial degradation during
storage (30%) and “achieve sufficient cohesion of e.g. pellets after compression of biomass (10%
< MC < 20%)” (Prade et al., 2011). Studies have been conducted to determine the feasibility of
using hemp pellets as an energy source and have promising results (Han et al., 2009; Prade et al.,
2011).
The study by Prade et al. (2011) explored the moisture content (MC) and energy yield of
hemp in Northern Europe. Prade et al. determined that the MC of hemp decreased from an original
value of 81% to 29% during harvesting periods. They determined the MC decreases with later
harvesting dates, which increases the energy yield. However, the research also showed that
biomass is lost at later harvesting periods, which counteracted the energy yield gained from
decreased MC (Prade et al., 2011). Prade et al. concluded that hemp has a high energy yield for
both solid fuel that is comparable to other energy crops in Northern Europe (Prade et al., 2011).
A study conducted by Han et al. (2009) explored the potential of creating hemp pellets for
energy production. They found that the woody core of the hemp plant had a similar lignin content
of 19.4% to that of hardwood (20-25%). Additionally, Han et al. determined the core had low ash
content of 0.5%, which resulted in low ash formation during pellet burning. Han et al. also
measured a heating value of 18.4 MJ/kg for hemp pellets, which is comparable to that of hardwood
pellets. This research suggests that hemp may be suitable for pelletization and as an energy source,
which warrants research into the feasibility of using cannabis waste as a pellet energy source.

138
Future Research
It is unclear why cannabis waste reuse potential has not been researched in depth. It may
be due to the tight regulations regarding cannabis waste disposal. As the industry continues to
grow, more cannabis waste will be produced. It is important to look for opportunities to reuse this
waste and prevent it from entering landfills. Future research could be conducted to investigate the
use of cannabis waste to produce energy, to create compostable packaging, or other sustainable
uses.
Outside of academic research, cannabis waste is a potentially marketable commodity.
There are opportunities to find new end uses for cannabis waste, such as animal bedding or particle
boards (Peterson, 2019). There is an opportunity for entrepreneurs and investors to invent and
discover new back-end products that can be made from cannabis waste.

139
References
Badertscher, K., & Badertscher, K. (2018). Should You Rethink Your Waste Management
Practices?. Cannabis Business Times. Retrieved from
https://www.cannabisbusinesstimes.com/article/should-you-rethink-your-waste-
management-practices/
Blaney, B. L. (1986). Treatment Technologies for Hazardous Wastes: Part II Alternative
Techniques for Managing Solvent Wastes. Journal of the Air Pollution Control
Association, 36(3), 275-285.
Chen, J., Li, C., Ristovski, Z., Milic, A., Gu, Y., Islam, M. S., ... & Guo, H. (2017). A review of
biomass burning: Emissions and impacts on air quality, health and climate in China.
Science of the Total Environment, 579, 1000-1034.
Colorado Department of Public Health and Environment (DPHE). (n.d.). Compliance Bulletin
Solid and Hazardous Waste Marijuana and Marijuana-Related Waste Disposal. [PDF
File]. Retrieved from
https://www.colorado.gov/pacific/sites/default/files/HM_HW_Compliance-Bulletin-
Marijuana-Marijuana-Related-Waste-Disposal.pdf
Commendatore, C. (2019). The Complicated World of Cannabis Waste Generation (Part One).
Waste360. Retrieved from https://www.waste360.com/legislation-
regulation/complicated-world-cannabis-waste-generation-part-one
Denver Department of Public Health & Environment (DDPHE). (2018). Cannabis
Environmental Best Management Practices Guide. [PDF File]. Retrieved from
https://www.denvergov.org/content/dam/denvergov/Portals/771/documents/EQ/MJ%20S
ustainability/Cannabis_BestManagementPracticesGuide_FINAL.pdf
Eklund, M. (2009). Aerobic Vs. Anaerobic Digestion. Water Online. Retrieved from
https://www.wateronline.com/doc/aerobic-vs-anaerobic-digestion-0002
Han, G., Lee, S., & Shin, S. (2009). Densified Pellet Fuel Using Woody Core of Industrial Hemp
(Cannabis sativa L.) as an Agricultural waste. Korean Journal of Plant Resources, 22(4):
293-298.
Keenan, D., & Duazo, M. (n.d.). Cannabis Grow Facilities: Identification and Handling of
Hazardous Wastes, a problem for Environmental Health. [PDF File]. Retrieved from
http://hazcat.com/wp-content/uploads/2017/04/Final-ACS-paper.pdf
König, B. (Ed.). (2018). Solvent Wastes in the Laboratory – Disposal and/or Recycling,
[PDF File]. Retrieved from https://www.oc-
praktikum.de/nop/en/articles/pdf/SolventRecyclingDisposal_en.pdf

140
Konrád, Z., Los, J., Fryč, J., & Kudělka, J. (2014). Analysis of using brewery mash for energy.
Research in Agricultural Engineering, 60(1), 10-16.
Kreuger, E. (2012). The potential of industrial hemp (Cannabis sativa L.) for biogas production.
Lund University.
Leonard, A. (2018). Can Hemp Clean Up the Earth?. Rolling Stone. Retrieved from
https://www.rollingstone.com/politics/politics-features/can-hemp-clean-up-the-earth-
629589/
McGregor, S. (2017). Cannabis Waste Diversion: What’s Next?. Cannabis Business Times.
Retrieved from https://www.cannabisbusinesstimes.com/article/cannabis-waste-
diversion-whats-next/
Micron Technology. (n.d.). The Cannavore System. Retrieved from
https://micronwaste.com/technology/cannavore/
Oregon Liquor Control Commission (OLCC). (n.d.). Marijuana Waste Management. [PDF File].
Retrieved from https://www.oregon.gov/olcc/marijuana/Documents/Fact_Sheets/
MarijuanaWasteManagement_FactSheet.pdf
Pejic, B., Vukcevic, M., Kostic, M., & Skundric, P. (2009). Biosorption of heavy metal ions
from aqueous solutions by short hemp fibers: effect of chemical composition. Journal of
Hazardous Materials, 164(1), 146-153.
Peterson, E. (2019). Industry Report: The State of Hemp and Cannabis Waste. CompanyWeek.
Retrieved from https://companyweek.com/company-profile/industry-report-the-state- of-
hemp-and-cannabis-waste
Pirragalia, A., Gonzalez, R., & Saloni, D. (2010). Techno-Economical Analysis of Wood Pellets
Production for U.S. Manufacturers. BioResources, 5(4).
Pirragalia, A., Gonzalez, R., Saloni, D., & Denig, J. (2013). Technical and economic assessment
for the production of torrefied ligno-cellulosic biomass pellets in the US. Energy
Conversion and Management, 66: 153-164.
Prade, T., Svensson, S., Andersson, A., & Mattsson, J. E. (2011). Biomass and energy yield of
industrial hemp grown for biogas and solid fuel, Biomass and Bioenergy, 35(7): 3040-
3049.
Robertson, M. (2017). Sustainability principles and practice. Taylor & Francis.
Thompson, R. (2019). How the waste industry can keep up with an ever-growing cannabis
Stream. Waste Dive. Retrieved from https://www.wastedive.com/news/how-the-waste-
industry-can-keep-up-with-an-ever-growing-cannabis-stream/552508/

141
Thompson, R., Lee, J., & Backus, E. (2019). Cannabis Waste: A New Frontier. In WasteExpo
2019, Las Vegas, Nevada. Retrieved from https://www.waste360.com/business/cannabis-
waste-new-frontier-wasteexpo-2019
United States Environmental Protection Agency (EPA). (2018). Basic Information about
Anaerobic Digestion (AD). Retrieved from https://www.epa.gov/anaerobic-
digestion/basic-information-about-anaerobic-digestion-ad
United States Environmental Protection Agency. (2020). Resource Conservation and Recovery
Act (RCRA) Laws and Regulations. Retrieved from https://www.epa.gov/rcra
Vukčević, M. M., Kalijadis, A. M., Vasiljević, T. M., Babić, B. M., Laušević, Z. V., & Laušević,
M. D. (2015). Production of activated carbon derived from waste hemp (Cannabis sativa)
fibers and its performance in pesticide adsorption. Microporous and Mesoporous
Materials, 214, 156-165.
Waste360 Staff. (2019). Tweed, TerraCycle Take Cannabis Packaging Recycling Across
Canada. Retrieved from https://www.waste360.com/recycling/tweed-terracycle-take-
cannabis-packaging-recycling-across-canada
Zhang, F., Yamasaki, S., & Nanzyo, M. (2001). Application of waste ashes to agricultural land
— effect of incineration temperature on chemical characteristics. Science of The Total
Environment, 264(3): 205-214.

142
Chapter 9: Future Research
Ecosystem Degradation
In California, the largest producer of cannabis in the United States, cannabis cultivation is
mainly concentrated in remote forested watersheds, on private, public, and Native American tribal
lands, and is largely grown outdoors (Carah et al., 2015). Cannabis cultivation practices do not
follow the same practices as other forms of agriculture. More established agriculture on the north
coast of California relies on captured and stored water from heavy winter stream flows for later
summer use. On the contrary, cannabis cultivators typically irrigate their summer and fall crops
with surface water diversions directly from streams and springs. These diversions are localized in
smaller, more sensitive watersheds, which are often biodiversity hotspots. (Carah et al., 2015).
Surface water diversions for cannabis cultivation can significantly reduce or eliminate low stream
flows during California’s dry summer season, especially during drought years. High volumes of
surface water diversions can threaten the survival of the rare and endangered salmonids,
amphibians, and other animals located in these watersheds (Carah et al., 2015). Furthermore, these
watersheds can be polluted by pesticides, fertilizers, and petroleum fuels used by cannabis
cultivators (Carah et al., 2015).
Outdoor and greenhouse cannabis cultivation are often located in remote watersheds with
high conservation value and biodiversity in California. Rare and endangered species such as coho
salmon (Oncorhynchus kisutch), steelhead trout (Oncorhynchus mykiss), northern spotted owl
(Strix occidentalis caurina), and Pacific fisher (Pekania pennanti) can be negatively impacted by
cannabis cultivation (Butsic et al., 2018). Land terracing, road construction, and deforestation
remove native vegetation and increase erosion. Erosion increases fine-sediment deposits into
streams, which can damage spawning and rearing habitat for fish. Furthermore, the heavy use of
pesticides and fertilizers can poison ecosystems and make their way into terrestrial food chains,
posing significant risks to mammalian and avian predators (Carah et al., 2015). Wildlife poisoning
occurs through direct poisoning or bioaccumulation in the food chain if cultivators use harmful
pesticides, such as rodenticides (Butsic et al., 2018).
Land Use
Humboldt, Trinity, and Mendocino Counties, located in Northern California, are known as
the “Emerald Triangle.” The Emerald Triangle is arguably the birthplace of modern cannabis
production in the United States, and Humboldt County may be the top cannabis-producing region
in the world (Bustic & Brenner, 2016). The Emerald Triangle and Humboldt County are often the
center of studies on the environmental impacts of the cannabis industry, specifically in regard to
land use and degradation. In a study by Bustic & Brenner (2016), 4428 grow sites in 60 watersheds
located in Humboldt County were digitized to assess the environmental impact. Bustic & Brenner
(2016) found that grows were clustered, suggesting disproportionate impacts in ecologically
important locales. Over 68% of grows were located more than 500 meters from a developed road,
highlighting the risk of landscape fragmentation. Twenty-three percent of grows were located on
greater than 30% slopes, indicating a potential for erosion, sedimentation, and landslides. The
study concluded that abundant grow sites clustered in steep locations far from developed roads,
potential for significant water consumption, and close proximity to habitat for threatened species,
all point toward high risk of negative ecological consequences (Bustic & Brenner, 2016).

143
The current footprint of outdoor cannabis farms has relatively minor landscape impacts
(Wang et al., 2017). It is not the amount of land or water resources consumed by the cannabis
industry that is of concern. Rather, it is the spatial distribution of cannabis cultivation facilities that
determines that scale of environmental harm (Bustic & Brenner, 2016). The per-unit-area impacts
could cause extensive habitat modification when scaled up to meet increasing demand (Wang et
al., 2017). The overall size of most outdoor cannabis farms is small (less than 0.5 ha), but a large
number of grows concentrated in one area can have a large impact on forest habitat. Outdoor
cannabis farms are typically isolated in forest interiors, placed away from roads. This results in
losses of core forest area and greater increases in forest edge and shape complexity. Outdoor
cultivation tends to cause perforation of forest patches, which reduces the forest core area by
creating “holes” in the forest. More edge area generated, which leads to irregularity in patch shape
(Wang et al., 2017).
In California, outdoor cannabis farms are limited to 1 acre (0.4 ha) per parcel. The size
restriction is intended to prohibit industrial-scale outdoor farms from developing. While there are
good intentions behind the regulation, it is encouraging the continued spread of small farms. The
more small farms that are established, the more the landscape will be fragmented (Wang et al.,
2017). More research on land-use in the cannabis industry should be conducted, especially in
regions outside of the Emerald Triangle, to help predict future cannabis expansion and moderate
its impacts (Bustic & Brenner, 2016). More research will provide invaluable information for
planners when handling difficult land use questions regarding allowable locations, buffering from
sensitive uses, and distribution of facilities (Németh & Ross, 2014).
While most of the focus for land use degradation is focused on outdoor cannabis farms, it
should be noted that many greenhouses are surrounded by large forest clearings created during
construction with exposed soils subject to erosion (Bustic & Brenner, 2016).
Life Cycle Assessment Life cycle assessment (LCA) is a method for measuring a product’s impact on the
environment throughout its entire life cycle, from cradle to grave (Robertson, 2017). Specifically,
LCA is a holistic view of environmental interactions that covers a range of activities, from the
extraction of raw materials and the production of the final product to delivery, use, and final
disposal or recycling the product (Curran, 2008; Robertson, 2017). LCA quantifies energy flows,
material flows, and environmental impacts of the entire lift of a product, and typically involves an
ever-expanding scope. LCA is intended for comparison and is not an absolute evaluation. It is
intended to help decision makers compare the major environmental impacts of their alternative
choices (Robertson, 2017).
Performing a full LCA can be complex, challenging, and time-consuming (Robertson,
2017), but could provide invaluable information about the environmental impacts of the cannabis
industry. An abbreviated LCA, while not comprehensive, could also provide a deeper
understanding of the relative impacts of the industry. LCA performed by an expert could provide
an improved basis for making informed decisions on how to regulate and mitigate the
environmental impacts of the cannabis industry.
Industry Practices There is currently no comprehensive documentation of common industry practices. Best
management practices (BMPs) are provided by regulatory bodies and shared among industry
professionals. However, BMPs do not encompass every industry practice. While conducting this

144
study, some industry practices were only revealed by word of mouth; no formal reporting or
documentation existed on these practices. For example, when speaking with consultant engineers,
it was discovered that some facilities sanitized their washrooms with caustic chemicals. This
practice may cause spikes in pH in the facility’s wastewater. This practice is not documented in
any best management practices or regulations that were found. It can be assumed that there are a
multitude of industry practices that were missed in this research. Without conversations with
industry professionals, it is difficult to identify every aspect of the industry. In order to fully assess
and understand the environmental impacts of the industry, every part of the process must be
known. Additionally, field based measurements of water use, chemical use, cropping systems,
yields, and other direct measurements are all needed to inform effective environmental analyses
and regulations (Bustic & Brenner, 2016).
Influence of Illegal Grows Even with the legalization of recreational cannabis, the illicit cannabis market will likely
remain intact. For example, illicit cannabis cultivation still exists in Colorado and California,
despite the legalization of recreational use (Carah et al., 2015). The impact of illicit grows on the
environment is often more detrimental, since they do not adhere to any regulations. These
environmental impacts include, “loss and fragmentation of sensitive habitats via illegal land
clearing and logging; grading and burying of streams; delivery of sediment, nutrients, petroleum
products, and pesticides into streams; toxic pesticide use; surface water diversions for irrigation
resulting in reduced flows and completely dewatered streams” (Bauer et al., 2015).
In 2011 the U.S. Forest Service reported illicit grow sites in 67 national forests in 20 states
(Thompson et al., 2017). In 2018, an estimated 14,000 illicit grow sites on public and private lands
were located in Humboldt County, California (Helmer, 2019). There have been several studies
documenting the effects of illicit grow sites in California (Helmer, 2019). Many of these studies
have focused on toxic pesticide use at illegal grow sites, which can make their way up food chains,
killing mammalian and avian species. For example, a study conducted in 2012 found that 80% of
deceased Pacific fishers recovered in northern California and the southern Sierra Nevada were
exposed to anticoagulant rodenticides from illicit grow sites (Carah et al., 2015). The use of
carbofuran, a federally banned pesticide, has also been documented at illicit grow sites. Prior to
2014, the presence of carbofuran at illegal grow sites in California was sporadically discovered.
However a 34% increase of carbofuran at 32 cannabis cultivation sites was documented in 2015
(Thompson et al., 2017).
The use of toxic pesticides also poses a risk to recreational users of public lands. Illicit
grow sites often leave pesticides, like carbofuran, in soda and Gatorade bottles. Contact with a
single drop has the capacity to kill an adult human. These bottles may remain on the ground for
years at unremediated grow sites and be punctured by animals or humans long after the site has
been abandoned (Thompson et al., 2017). The heavy use of pesticides, as well as fertilizers and
petroleum fuels, at illicit grow sites can also contaminate watersheds (Carah et al., 2015).
Illicit cannabis cultivation and its associated environmental impacts are not expected to
decrease as more states legalize recreational cannabis. As seen in Colorado, the illicit market is
still a problem, despite the legalization of recreational cannabis in 2014 (Carah et al., 2015).
Legalization most likely will lead to an increased consumption of cannabis, which will increase
the demand for the product. Depending on the regulations of the market and level of enforcements,
the black market may continue to fill a portion of the demand. Until cannabis is federally legal,
shipping the product across state lines will remain illegal, which will keep the black market

145
relevant. Addressing illegal production of cannabis will require specifically addressing and
remediating its impacts (Carah et al., 2015).

146
References
Bauer, S., Olson, J., Cockrill, A., Van Hattem, M., Miller, L., Tauzer, M., & Leppig, G. (2015).
Impacts of surface water diversions for marijuana cultivation on aquatic habitat in four
northwestern California watersheds. PloS one, 10(3).
Butsic, V., & Brenner, J. C. (2016). Cannabis (Cannabis sativa or C. indica) agriculture and the
environment: a systematic, spatially-explicit survey and potential impacts. Environmental
Research Letters, 11(4), 044023.
Butsic, V., Carah, J. K., Baumann, M., Stephens, C., & Brenner, J. C. (2018). The emergence of
cannabis agriculture frontiers as environmental threats. Environmental Research Letters,
13(12), 124017.
Carah, J. K., Howard, J. K., Thompson, S. E., Short Gianotti, A. G., Bauer, S. D., Carlson, S. M.,
... & Knight, C. A. (2015). High time for conservation: adding the environment to the
debate on marijuana liberalization. BioScience, 65(8), 822-829.
Curran, M. A. (2008). Life-Cycle Assessment. Encyclopedia of Ecology, (pp. 2168-2174).
Helmer, J. (2019). The Environmental Downside of Cannabis Cultivation. JSTOR Daily.
Retrieved from https://daily.jstor.org/the-environmental-downside-of-cannabis-
cultivation/
Németh, J., & Ross, E. (2014). Planning for marijuana: The cannabis conundrum. Journal of the
American Planning Association, 80(1), 6-20.
Robertson, M. (2017). Sustainability principles and practice. Taylor & Francis.
Thompson, C. M., Gabriel, M. W., & Purcell, K. L. (2017). An ever-changing ecological
battlefield: marijuana cultivation and toxicant use in western forests. The Wildlife
Professional. 11(3), 42-46.
Wang, I. J., Brenner, J. C., & Butsic, V. (2017). Cannabis, an emerging agricultural crop, leads
to deforestation and fragmentation. Frontiers in Ecology and the Environment, 15(9),
495-501.

147
Chapter 10: Conclusions
The current body of research on recreational cannabis is limited to a handful of peer-
reviewed studies, blog posts, and independent researchers publishing articles online. These peer-
reviewed studies are quickly becoming outdated since the industry is evolving at a rapid pace. The
research undertaken with this project has resulted in an in-depth, comprehensive document on the
environmental impacts of cannabis cultivation and processing.
Many of the current studies include impacts from illegal cannabis cultivation, which is a
separate issue in itself. Many studies are also a combination analysis of medical and recreational
cannabis regulations and processing. Medical and recreational cannabis do not fall under the same
regulations. The regulations for medical cannabis are often much stricter than the regulations for
recreational cannabis, affording medical consumers better protections than nonmedical consumers.
Regardless, neither set of regulations address the full scope of environmental impacts.
As we have demonstrated throughout this document, there are opportunities to implement
more sustainable practices throughout various aspects of cannabis production. However, the
tradeoffs between adopting sustainable practices versus increased energy consumption and cost
must be evaluated. Incentives as well as regulatory and enforcement efforts can be established to
mitigate this tradeoff. Incentive programs, such as certification and ecolabeling, have been widely
used to help reduce the environmental impacts of other agricultural crops and could play a similar
role in the cannabis industry (Carah et al., 2015). Improved regulatory and enforcement efforts
will help cultivators and producers comply with environmental laws and protect environmental
resources. Additionally, technical assistance and outreach programs could help encourage the
adoption of best management practices and voluntary compliance (Carah et al., 2015).
As the legal cannabis industry continues to grow, so will the environmental issues that are
associated with it. More fundamental and applied research to identify these issues before the
industry scales and the environmental damage become too widespread to mitigate. The
environmental degradation caused by the cannabis industry requires a direct policy response. The
current regulatory framework is inadequate to afford any real environmental protections. The
opportunity to reduce, regulate, and mitigate environmental degradation will be missed if
policymakers continue to ignore the environmental impacts of the industry.

148
References
Carah, J. K., Howard, J. K., Thompson, S. E., Short Gianotti, A. G., Bauer, S. D., Carlson, S. M.,
... & Knight, C. A. (2015). High time for conservation: adding the environment to the
debate on marijuana liberalization. BioScience, 65(8), 822-829.