an examination of the relationship between elementary
TRANSCRIPT

University of South FloridaScholar Commons
Graduate Theses and Dissertations Graduate School
January 2012
An examination of the relationship betweenElementary Education Teacher Candidates'authentic assessments and performance on theProfessional Education Subtests on the FloridaTeacher Certification Exam (FTCE)Thomas Raymond Lang IiUniversity of South Florida, [email protected]
Follow this and additional works at: http://scholarcommons.usf.edu/etd
Part of the American Studies Commons, and the Educational Assessment, Evaluation, andResearch Commons
This Ed. Specalist is brought to you for free and open access by the Graduate School at Scholar Commons. It has been accepted for inclusion inGraduate Theses and Dissertations by an authorized administrator of Scholar Commons. For more information, please [email protected].
Scholar Commons CitationLang Ii, Thomas Raymond, "An examination of the relationship between Elementary Education Teacher Candidates' authenticassessments and performance on the Professional Education Subtests on the Florida Teacher Certification Exam (FTCE)" (2012).Graduate Theses and Dissertations.http://scholarcommons.usf.edu/etd/4119

An examination of the relationship between Elementary Education Teacher Candidates’
authentic assessments and performance on the Professional Education Subtests on the
Florida Teacher Certification Exam (FTCE)
By
Thomas R. Lang II
The Thesis submitted in partial fulfillment of the requirements for the degree of
Educational Specialist Department of Measurement and Research
College of Education University of South Florida
Major Professor John Ferron Ph.D. Committee Member Kris Hogarty Ph.D.
Committee Member Jeffery Kromrey Ph.D.
Date of Approval April 12, 2011
Authentic Assessment, ePortfolio Initiative, Teacher Preparation, Validation
Copyright © 2012 Thomas R. Lang II

Table of Contents
List of Tables ..................................................................................................................... iii List of Figures .................................................................................................................... iv Abstract ................................................................................................................................v Chapter 1: Introduction ........................................................................................................1 Background ..............................................................................................................1 Problem Statement ...................................................................................................2 Research Question ...................................................................................................3 Significance of the Study .........................................................................................3 Limitations of the Study...........................................................................................3 Definition of Terms..................................................................................................4 Chapter 2: Literature Review ...............................................................................................9 Performance-Based Assessment (PBA) ...................................................................9 Validity of Assessment ............................................................................................9 ePortfolio and PBA ................................................................................................10 Assessment – A system Approach .........................................................................11 Chapter 3: Method .............................................................................................................13 Research Design.....................................................................................................13 Sample....................................................................................................................13 Power .....................................................................................................................14 Secondary Data Sources ........................................................................................15 Chalk and Wire ePortfolio Initiative ..........................................................15
Critical Tasks developed for the College of Education .............................16 Professional Education subtests on the Florida Teacher Certification Examination (FTCE) ............................................................16 Development, Validity and Reliability of the Instrument ......................................20 Variables ................................................................................................................23 Data Collection Procedures ....................................................................................24 Statistical Analysis .................................................................................................24 Chapter 4: Results ..............................................................................................................26 Descriptive statistics ..............................................................................................26 Correlation Analysis ..............................................................................................29
Multiple Regression Analysis ................................................................................31 Statistical Assumptions ..........................................................................................32 Multiple Regression Results ..................................................................................36 Chapter 5: Conclusions ......................................................................................................40 Discussion ..............................................................................................................41 Conclusions ............................................................................................................43 Recommendations for Future Research .................................................................45 References ..........................................................................................................................47 Appendices .........................................................................................................................54 Appendix A: Linkages between the Critical Tasks in Chalk and Wire and
the 12 Accomplished Practices for the Elementary Education Undergraduate Program .............................................................................55
Appendix B: Correlations and p-values between the percentage of items correct on the Professional Education subtests on the Florida Teacher Certification Exam and the 12 Accomplished Practices and Gender, Ethnicity, and GPA................................................................57 Appendix C: Correlations and p-values between average scores for the 12 Accomplished Practices from the Chalk and Wire authentic assessments and Gender, Ethnicity, and GPA ...........................................59

List of Tables Table 1: Frequency Distribution of the Participants by Race & Gender ...........................14 Table 2: The 12 Accomplished Practices Assessed and the Percent of Items on the professional Education subtests on the Florida teacher Certification Exam for the 2009/10 School Year ................................................................................17 Table 3: Means and standard deviations of percentage of items correct from the Professional Education subtests on the Florida Teacher Certification Exam ......27 Table 4: Means and standard deviations of mean scores from the Chalk and Wire ePortfolio assignments .........................................................................................28 Table 5: Correlations and p-values between average scores for the 12 Accomplished Practices from the Chalk and Wire authentic assessments and the percentage of items correct on the Professional Education subtests on the Florida Teacher Certification Exam ..........................................................30 Table 6: Summary of Regression Analysis examining the Relationship between Independent Variables with Scores on Professional Education subtest on the Florida Teacher Certification Exam ...............................................................38
List of Figures Figure 1: An example of a sentence completion item........................................................19 Figure 2: An example of a direct question item .................................................................19 Figure 3: An example of a scenario question item ............................................................19 Figure 4: An example of a command type item .................................................................20 Figure 5: Florida Teacher Certification Examination (FTCE) Test Development And Initial Validation Study Overview ..............................................................22

Abstract
According to Wilkerson and Lang (2003, p.1) with approximately “90% of schools,
colleges, and departments of education using portfolios of one form or another as decision-
making tools for standards-based decisions regarding certification or licensure (as well as
NCATE accreditation), it is appropriate to explore the legal and psychometric aspects of this
assessment device.”
This study was conducted to examine how well the authentic assessments created in the
Chalk and Wire ePortfolio initiative, which was created to provide authentic assessments of the
Accomplished Practices, relate to the measures in the Professional Knowledge subtests on Florida
Teacher Certification Examination.
The sample was comprised of 294 graduating student teachers from a single department
in the College of Education for the 2009/2010 school year at a large southern university. Multiple
regression analyses were employed to examine the relationship between authentic assessments
(i.e. critical tasks) in Chalk and Wire and performance on the subtests of the Professional
Knowledge Test on the Florida Teacher Certification exam while controlling for gender, ethnicity
and overall GPA.
Only two of the independent variables were statistically significant from the 12 models
examined. The scores from the Professional Knowledge subtests on Florida Teacher Certification
Examination for Diversity (AP5) and Technology (AP12) were statistically different for gender,
with females scoring higher than males on both.
The results provided little evidence of concurrent validity between the authentic
assessments of the Chalk and Wire ePortfolio initiative and the Professional Knowledge subtests
on Florida Teacher Certification Examination.

1
CHAPTER 1
INTRODUCTION
Background
According to Wilkerson and Lang (2003, p.1) with approximately “90% of
schools colleges, and departments of education are using portfolios of one form or
another as decision-making tools for standards-based decisions regarding certification or
licensure (as well as NCATE accreditation), it is appropriate to explore the legal and
psychometric aspects of this assessment device.” Furthermore, the literature according to
Herman and Winters (1994) and Carney (2004) is lacking in systematic studies
documenting the use of portfolios for assessment purposes.
The Florida Department of Education (2011b) Florida statute 1012.56 requires
that educators must pass the FTCE as one of the requirements for their first 5-year
teaching certificate. The Teacher Quality Act was adopted in 1999 by the Florida
legislator, requiring the Florida Department of Education (FDOE) to review all statues
and rules related to teacher education followed by recommendations for improvement. In
2000 the legislature adopted EDUCATE 2000, an initiative that implemented many
recommendations for improvement with respect to the teacher certification process. As a
result “the examinations used for demonstration of mastery of general knowledge,
professional education competence, and subject area knowledge shall be aligned with
student content standards approved by the state board” (p. 1).

2
The No Child Left Behind Act of 2001 was a reauthorization of the Elementary
and Secondary Education Act first enacted in 1965 and was signed into law by President
Bush on Jan. 8, 2002. The impact of this legislation was the introduction of annual
testing of students in grades 3-8, with states required to bring all students up to the
"proficient" level on state tests by the 2013-14 school year. Teacher qualifications
required all public school teachers to be "highly qualified" in each subject he or she
taught (Education Week, 2004).
All this legislation resulted in an increase in high-stakes decisions with respect to
education and teacher training. As a result it became more important that the decisions
being made, as in teacher certification, be based on information that is valid.
Problem Statement
While ePortfolios are rapidly being embraced by the education community
(Carney, 2004; Ritzhaupt, Sing, Seyferth, & Dedrick, 2008) others are noting a lack of
valid assessments of portfolios and ePortfolios. For example, Herman and Winters
(1994) noted that in “89 entries on portfolio assessment topics found in the literature over
the past 10 years, only seven articles either reported technical data or employed accepted
research methods” (p.48). Carney (2004) asks the question “Has the research situation
improved since 1994?” The author cites Lyons (1998) and Zeichner and Wray (2001)
who voice similar concerns about the lack of systematic studies documenting their use for
assessment or developmental purposes.

3
Research Question
What is the relationship between authentic assessments (i.e. critical tasks) in Chalk and
Wire and performance on the Professional Education subtests on the Florida Teacher
Certification Exam while controlling for gender, ethnicity and overall GPA.
Significance of the Study
This study provides initial evidence of how well the authentic assessments created
in the Chalk and Wire ePortfolio initiative, created to provide authentic assessments
related to the Florida Educator Accomplished Practices (APs), relate to the performance
on the Professional Knowledge subtests on the Florida Teacher Certification
Examination. The Accomplished Practices were developed in 1989 and define what
teachers and educators are expected to know and exhibit. The results provide initial
evidence of the relationship between a set of authentic assessments and performance on
the exam required for the certification for all teachers in Florida.
Limitations of the Study
This sample is from a single department in a College of Education, and therefore
the results cannot be generalized to other departments in the college or to other colleges
or universities. A homogenous purposeful sample was selected. According to Gall, Gall
and Borg (1997) a homogenous sample is selected when one wants to study a particular
group in depth. It was decided to study students from a single initial teacher preparation
program to limit the potential effects of extraneous variables, such as common
curriculum and professional goals. The data used in this study were collected by the

4
College of Education and the Florida Department of Education prior to this study. As
such, this is considered a Secondary Data Analysis and the study is limited by the data
and data collection methods employed by these two entities. Another limitation is the
potential restricted range in the variable GPA and scores from the Chalk and Wire
authentic assessments in the ePortfolio system. Students typically must have a GPA of at
least 3.0 to graduate and scores in the Chalk and Wire ePortfolio system must also be a
three or greater to pass a course in which a critical task is a course requirement.
Definition of Terms
“The Florida Educator Accomplished Practices (APs) are Florida's core standards for
successful educators. They also provide guidance to educators and educator preparation
programs on what educators and pre-service teachers are expected to know and be able to
do. ” These standards were originally developed in 1998. (Florida Department of
Education (n.d.)).
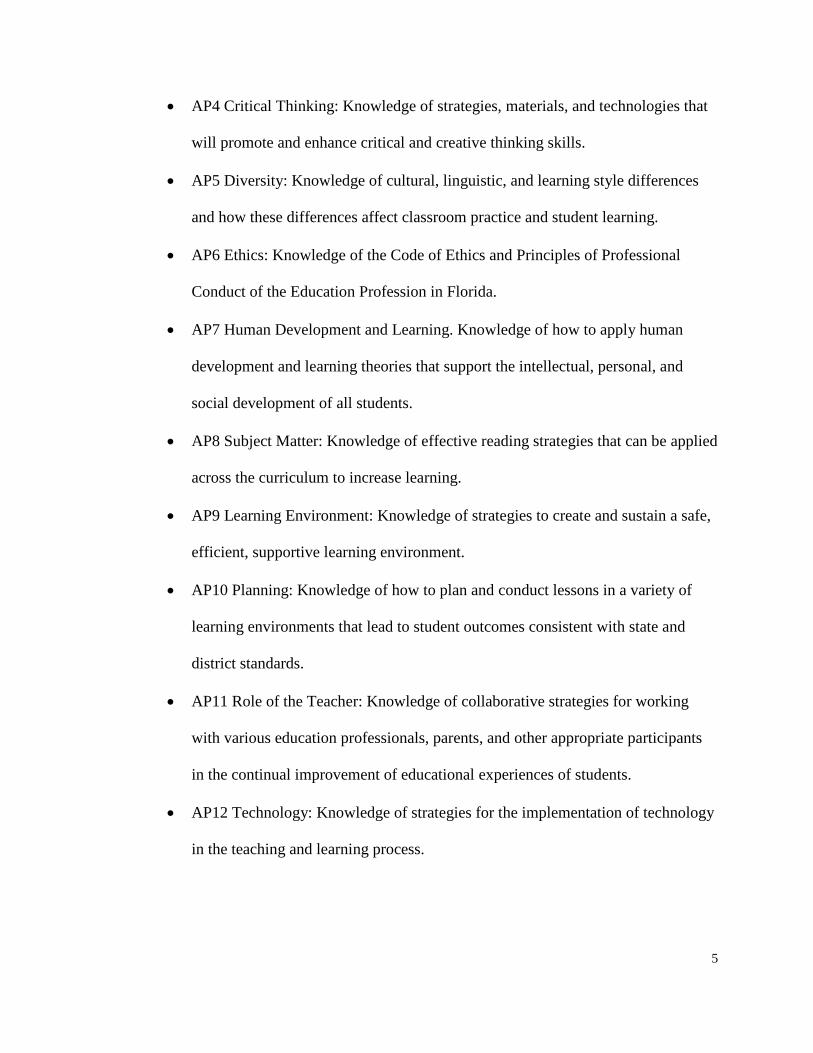
The 12 Florida Educator Accomplished Practices (APs) are comprised of the
following:
• AP1 Assessment: Knowledge of various types of assessment strategies that can be
used to determine student levels and needs.
• AP2 Communications: Knowledge of effective communication with students,
parents, faculty, other professionals, and the public, including those whose home
language is not English.
• AP3 Continuous Improvement: Knowledge of strategies for continuous
improvement in professional practices for self and school.
5
• AP4 Critical Thinking: Knowledge of strategies, materials, and technologies that
will promote and enhance critical and creative thinking skills.
• AP5 Diversity: Knowledge of cultural, linguistic, and learning style differences
and how these differences affect classroom practice and student learning.
• AP6 Ethics: Knowledge of the Code of Ethics and Principles of Professional
Conduct of the Education Profession in Florida.
• AP7 Human Development and Learning. Knowledge of how to apply human
development and learning theories that support the intellectual, personal, and
social development of all students.
• AP8 Subject Matter: Knowledge of effective reading strategies that can be applied
across the curriculum to increase learning.
• AP9 Learning Environment: Knowledge of strategies to create and sustain a safe,
efficient, supportive learning environment.
• AP10 Planning: Knowledge of how to plan and conduct lessons in a variety of
learning environments that lead to student outcomes consistent with state and
district standards.
• AP11 Role of the Teacher: Knowledge of collaborative strategies for working
with various education professionals, parents, and other appropriate participants
in the continual improvement of educational experiences of students.
• AP12 Technology: Knowledge of strategies for the implementation of technology
in the teaching and learning process.

6
Criterion-related validity – is comprised of:
concurrent validity (i.e., the extent to which scores on an instrument are related to
scores on another, already established instrument administered approximately
simultaneously or to a measurement score of some other criterion that is available
at the same point in time as the scores on an instrument of interest) and predictive
validity (i.e., the extent to which scores on the instrument are related to scores on
another, already-established instrument administered in the future to a measure of
some other criterion that is available at a future point in time as the scores on the
instrument of interest. (Onwuegbuzie, Witcher, Collins, Filer, Wiedmaier, &
Moore, 1997, p.116).
Competency-based performance assessment – “a collection of authentic and diverse
evidence, drawn from a larger archive representing what a person or organization has
learned over time on which the person or organization has reflected, and designed for
presentation to one or more audiences for a particular rhetorical purpose.” (The National
Learning Infrastructure Initiative as cited in Barrett & Carney, 2005, p. 1).
Construct Validity – “indicate that test scores are to be interpreted as indicating the test
taker’s standing on the psychology construct measured by the test.” (American
Educational Research Association, American Psychological Association, & National
Council on Measurement in Education, 1999, p. 174).

7
Content validity- using an examinee’s test score to infer about a larger domain of items
from which the test items were initially selected. (Crocker & Algina, 1986)
ePortfolio –
E-portfolios are a valuable learning and assessment tool. An e-portfolio is a
digitized collection of artifacts including demonstrations, resources, and
accomplishments that represent an individual, group, or institution. This
collection can be comprised of text-based, graphic, or multimedia elements
archived on a Web site or on other electronic media such as a CD-ROM or DVD.
An e-portfolio is more than a simple collection - it can also serve as an
administrative tool to manage and organize work created with different
applications and to control who can see the work. E-portfolios encourage personal
reflection and often involve the exchange of ideas and feedback. (Lorenzo &
Ittelson, 2005, p.1)
Validation – “The process through which the validity of the proposed interpretation of
test scores is investigated” (American Educational Research Association, American
Psychological Association, & National Council on Measurement in Education, 1999, p.
184).
Validity – “The degree to which accumulated evidence and theory support specific
interpretations of test scores entailed by proposed uses of a test.” (American Educational

8
Research Association, American Psychological Association, & National Council on
Measurement in Education, 1999, p. 184).

9
CHAPTER 2
LITERATURE REVIEW
This chapter provides a description of performance assessment, validity of
assessment, ePortfolios and systems approach to assessment as they relate to the study.
Performance-Based Assessment
Lane (2010) defines performance-based assessment as “Performance assessments
can measure students’ cognitive thinking and reasoning skills and their ability to apply
knowledge to solve realistic, meaningful problems. They are designed to more closely
reflect the performance of interest, allow students to construct or perform an original
response, and use predetermined criteria to evaluate student work
According to (Cummings, Cleborne, & Richmond, 2008) the purpose of
performance assessment is twofold: The first is to provide a comprehensive picture of
students’ learning across their respective programs of study; and secondly to evaluate a
programs’ effectiveness.
Validity of Assessment
Lissitz and Samuelsen (2007) note that the concept that would become criterion-
related validity was created around 1915 and it was not until the early 1930’s that a
definition of validity appeared in the psychological literature. According to Cronbach and

10
Meehl (1955) and Lennon (1955) practitioners were in disagreement with the notions of
validity for at least a decade prior to their articles. Beginning in the 50’s the American
Psychological Association (APA) Committee on Psychological Test began its exploration
into validity, in an attempt to identify what qualities, of a test, should be investigated
before it is published. According to the Standards for Educational and Psychological
Testing (1999) these findings were originally published in 1954 by the American
Psychological Association (APA) and have seen multiple revisions along with the
inclusion of members from the American Educational Research Association (AERA) and
National Council on Measurement in Education (NCME) to the committee.
Lennon (1955) suggested that ideas about validity had come a long way from the
classic definition of validity as “the extent to which a test measures whatever it purports
to measure” (p. 294). As a result of the original committee’s exploration, validity was
divided into four types: predictive validity, concurrent validity, content validity, and
construct validity. Both predictive validity and concurrent validity could also be thought
of as criterion-validity (Cronbach & Meehl, 1955; Lennon, 1955; Messick, 1989). Today
the Standards for Educational and Psychological Testing (1999) define validity as “The
degree to which accumulated evidence and theory support specific interpretation of test
scores entailed by proposed uses of a test” ( p. 184).
ePortfolios and PBA
Carney (2004) notes that the portfolio is an important method to assess and
develop pre-service teachers’ knowledge. At the same time advances in technology are
changing the format of the portfolio. Where they used to be a collection of paper

11
documents, today they are more likely to be found on-line in a digital format. Wilkerson
and Lang (2003) report that “about 90% of schools, colleges, and departments of
education are currently using portfolios of one form or another as decision-making tools
for standards-based decisions regarding certification or licensure (as well as NCATE
accreditation)” (p. 1).
Wilkerson and Lang (2003) suggest that “portfolio assessments, like all high-
stakes tests, must stand the test of validity, reliability, fairness, and absence of bias.” (p.
3) Cummings et al., (2008) suggest that “performance assessment is related to the need
for post-secondary institutions to demonstrate accountability to the public as well as to
state, regional and national agencies.” (p.600)
Assessment – A systems Approach
Redfield, Roeber, and Stiggins (2008) state that while there are many different
ways to build a balanced assessment system to guide educational improvement they all
should be guided by four principles:
1. Purpose(s). The purpose(s) of assessment need to be clear and clearly
articulated for, and at, each level of the system.
2. Assessment Adequacy. The purpose(s) of assessment need to be clear
and clearly articulated for, and at, each level of the system. The types of
assessments included in the system should be appropriate and valid for
meeting the specified purposes of each system component and the system
as a whole.

12
3. Communication of Results. For balanced systems to serve productively,
results must be communicated to the users in a timely and understandable
way.
4. Supports. Adequate supports need to be provided so that the purposes
of the system can be met. (Redfield, Roeber, and Stiggins, 2008, p.1-2)
How well an assessment is judged appropriate for a particular use, is based upon
its placement within the assessment purpose, assessment target and assessment process.
Furthermore, a balanced assessment system is based upon the placement of each
component in relation to the needs of all the users. They also note that “balance” does not
confer equality in the number or weight of any given assessment within the broader
assessment system (Redfield, Roeber, and Stiggins, 2008)

13
CHAPTER 3
METHOD
This chapter describes the design and methods used in the study. They include the
design of the study, a description of the sample, power estimates, and data sources. The
validity of both measures are discussed and sample items are provided for the
Professional Education subtests on the Florida Teacher Certification Exam (FTCE) along
with a description of the variables used and the data collection procedures. The chapter
ends with a description of the data analyses used in the study.
Research Design
This is a correlational study employing a secondary data analysis, as the data
have been collected prior to the beginning of this study. The data were collected either by
the College of Education or the Department of Education. The independent variables
were GPA, ethnicity and scores for graded assignment(s) from Chalk and Wire ePortfolio
initiative. The dependent or criterion variable was the proportion of items correct on the
Professional Education subtests on the Florida Teacher Certification Exam (FTCE) for
each of the Accomplished Practices.
Sample
The participants in this study were the 298 seniors from the Elementary Education
program that took the FCTE exam during the 2009-2010 school year. The Elementary

14
Education cohort was selected because they had the largest number of students and the
most current data available. Table 1 has the distribution of participants by race and
gender. A cursory examination shows that the participants are predominantly female and
Caucasian.
Table 1
Frequency Distribution of the Participants by Race & Gender
Caucasian African-
American Asian American Indian Hispanic Not
Provided Total
Female 216 18 6 1 32 3 277
Male 14 2 1 0 4 0 21
Total 230 20 7 1 36 3 298
Power
An a priori power analysis was conducted to determine the sample size needed
for adequate statistical power. According to Cohen (1992) for statistical power of .80,
with an alpha of .01 and four independent variables, a sample size of 118 would be
needed. The sample size in this study (N=294) was therefore adequate for all inferential
tests. According to Cohen (1992) statistical power is the probability of rejecting the null
hypotheses when it is false, and is determined based upon the sample size, the size of the
effect one wishes to detect, the predetermined alpha level and in multiple regression the
number of independent variables.
15
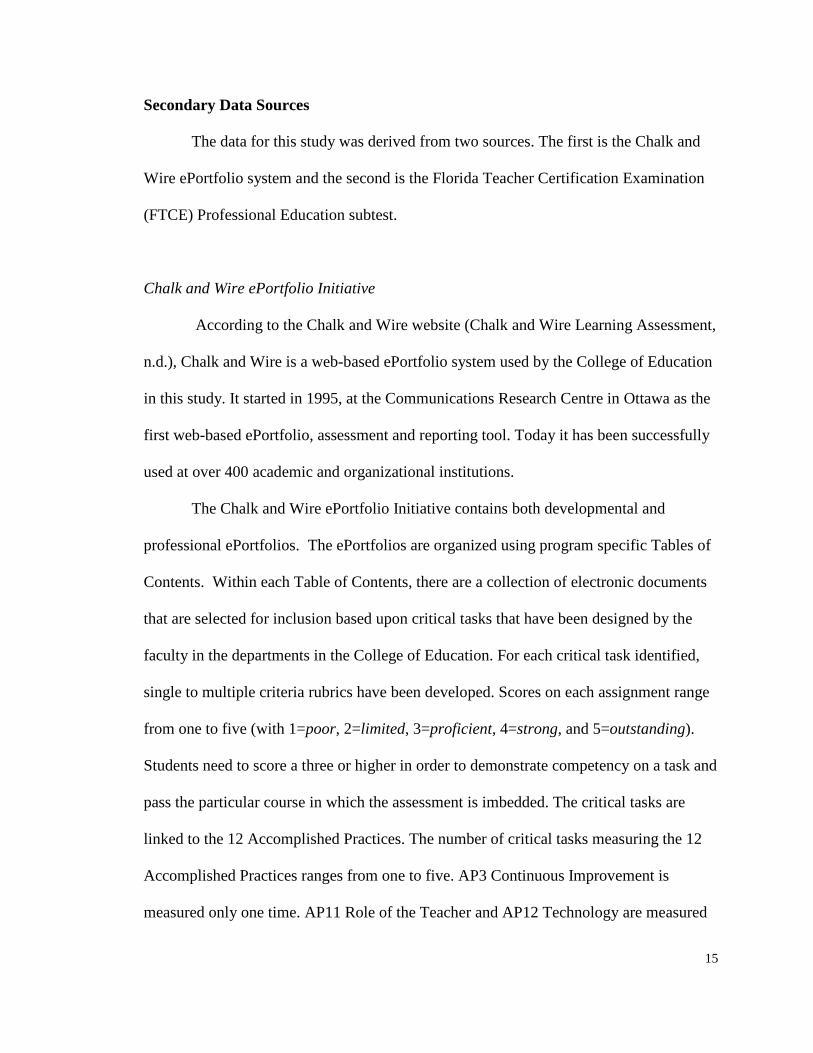
Secondary Data Sources
The data for this study was derived from two sources. The first is the Chalk and
Wire ePortfolio system and the second is the Florida Teacher Certification Examination
(FTCE) Professional Education subtest.
Chalk and Wire ePortfolio Initiative
According to the Chalk and Wire website (Chalk and Wire Learning Assessment,
n.d.), Chalk and Wire is a web-based ePortfolio system used by the College of Education
in this study. It started in 1995, at the Communications Research Centre in Ottawa as the
first web-based ePortfolio, assessment and reporting tool. Today it has been successfully
used at over 400 academic and organizational institutions.
The Chalk and Wire ePortfolio Initiative contains both developmental and
professional ePortfolios. The ePortfolios are organized using program specific Tables of
Contents. Within each Table of Contents, there are a collection of electronic documents
that are selected for inclusion based upon critical tasks that have been designed by the
faculty in the departments in the College of Education. For each critical task identified,
single to multiple criteria rubrics have been developed. Scores on each assignment range
from one to five (with 1=poor, 2=limited, 3=proficient, 4=strong, and 5=outstanding).
Students need to score a three or higher in order to demonstrate competency on a task and
pass the particular course in which the assessment is imbedded. The critical tasks are
linked to the 12 Accomplished Practices. The number of critical tasks measuring the 12
Accomplished Practices ranges from one to five. AP3 Continuous Improvement is
measured only one time. AP11 Role of the Teacher and AP12 Technology are measured

16
two times and AP1 Communications, AP4 Critical Thinking, AP5 Diversity, Subject
Matter, Learning Environment, and Planning are measured three times each. AP1
Assessment, AP6 Ethics and AP7 Human Development and Learning are measured four
times. Please see Appendix A for the linkages between the critical tasks and the 12
Accomplished Practices for Elementary Education program undergraduates.
Critical Tasks developed for the College of Education
The following is based upon information provided by the Director of Assessment.
In 2004, the Assessment and Continuous Improvement Committee began to work on
improving the unit-wide assessment system originally started in 2001. The committee’s
focus was on implementing an e-portfolio system to provide for the authentic assessment
of students’ work. In 2005 this committee’s membership was revised to include more
faculty, students and school personnel as the focus was shifted to focus on the needs and
practices at the program level from the original unit level. Also in 2005, faculty from the
College of Arts and Sciences (CAS) were also tapped to provide input on how the CAS
could help in the assessment of students with respect to specific content areas. Most of
the rubrics created for measuring the Accomplished Practices were produced by faculty
who were, at the time, involved in teaching/development of the respective courses. This
provides some evidence of content validity.
Professional Education subtests on the Florida Teacher Certification Examination (FTCE)
Table 2 shows the 12 Accomplished Practices and the percentage of items that
each of the Accomplished Practices contributes to the total percentage of items on the

17
Table 2 The 12 Accomplished Practices Assessed and the Percent of Items on the Professional Education subtests on the Florida Teacher Certification Exam for the 2009/10 School Year Percent of total test
items
Competency Area
9% 1 Knowledge of various types of assessment strategies that can be used to determine student levels and needs (Assessment)
9% 2 Knowledge of effective communication with students, parents, faculty, other professionals, and the public, including those whose home language is not English (Communications)
5% 3 Knowledge of strategies for continuous improvement in professional practices for self and school (Continuous Improvement)
9% 4 Knowledge of strategies, materials, and technologies that will promote and enhance critical and creative thinking skills (Critical Thinking)
7% 5 Knowledge of cultural, linguistic, and learning style differences and how these differences affect classroom practice and student learning (Diversity)
5% 6 Knowledge of the Code of Ethics and Principles of Professional Conduct of the Education Profession in Florida (Ethics)
9% 7 Knowledge of how to apply human development and learning theories that support the intellectual, personal, and social development of all students (Human Development and Learning)
5% 8 Knowledge of effective reading strategies that can be applied across the curriculum to increase learning (Subject Matter)
9% 9 Knowledge of strategies to create and sustain a safe, efficient, supportive learning environment (Learning Environment)
9% 10 Knowledge of how to plan and conduct lessons in a variety of learning environments that lead to student outcomes consistent with state and district standards (Planning)
7% 11 Knowledge of collaborative strategies for working with various education professionals, parents, and other appropriate participants in the continual improvement of educational experiences of students (Role of the Teacher)
5% 12 Knowledge of strategies for the implementation of technology in the teaching and learning process (Technology)
88% NOTE: There are two additional competencies (Foundations of Education and ESOL) that make up the remaining 12% of the items. These are not part of the Accomplished Practices and are not assessed in Chalk and Wire so they were not included in the study.

18
Professional Education subtest. There are two additional competencies assessed on the
Professional Knowledge subtests on the Florida Teacher Certification Exam: 13)
Knowledge of the history and its philosophical and sociological foundations (Foundations
of Education) and 14) Knowledge of specific approaches, methods, and strategies
appropriate for students with limited English proficiency (ESOL). These two
competencies are not part of the Accomplished Practices and are not assessed in Chalk
and Wire so they were not included in the study.
According to the Florida Teacher Certification Examination Test Preparation
Guide for Professional Education (October, 2006) there are approximately 120 items on
the exam. The items are multiple choice, and include sentence completion, direct
question, scenario and command types of questions. For sentence completion items the
respondent is to select the option that best completes the sentence. The sample items
below are from the Florida Teacher Certification Examination Test preparation guide for
professional education. (5th Edition), P. 13 – 16). An example of a sentence completion
item is seen in Figure 1. For direct questions, the respondent is to select the option that
best answers the question. An example of a direct question is seen in Figure 2. The
scenario includes a situation or problem. The respondent is to answer a question, or make
a diagnosis or recommendation based upon the scenario. An example of a scenario
question can be seen in Figure 3. With the command items the respondent is to select the
best response option. An example of a command type item can be seen in Figure 4.

19
Sharon, a 3rd-grade student, received the following scores on a formal reading assessment: identifying main idea – raw score of 18/25 recalling details – 70th percentile making inferences – 30% correct determining author's purpose – grade equivalent of 4.5 A teacher who interprets these data can accurately conclude that Sharon A. struggled to identify the main idea in reading passages, but scored higher than 70% of students
who took the same test in making inferences. B. scored higher than 70% of students who took the same test in recalling details, and above
grade level in determining author's purpose. C. struggled to recall details in reading passages, but worked above the 4th-grade level in
determining author's purpose. D. scored higher than 70% of students who took the same test in recalling details and above the
4th-grade level in determining author's purpose.
Figure 1 An example of a sentence completion item
Which of the following is the most appropriate assessment for measuring student mastery of content in a high school algebra class at midyear? A. diagnostic test B. standardized achievement test C. teacher-made test D. daily quizzes Figure 2 An example of a direct question item
A teacher asks, "How was the Grand Canyon formed, Patty?" Patty answers, "There is a river at the bottom." The teacher then says, "Patty, tell us how the river affected the formation of the Grand Canyon." What technique is the teacher using in her last statement? A. framing B. paraphrasing C. probing D. redirecting Figure 3 An example of a scenario question item

20
Identify the classroom practice that best encourages a positive learning climate for all students. A. The teacher identifies class leaders and rewards them with special incentives. B. The teacher discourages the use of negative statements in the classroom. C. The teacher includes all students in class discussions, showing equal respect and
sensitivity to each student. D. The teacher encourages students to compete with each other to see who can do the
best work in the class. Figure 4 An example of a command type item
According to the Maximum Percentages of Correct Questions Needed to Achieve
a Minimum Passing Score (March, 2011) reports students need to answer 73% of the
items correctly in order to successfully pass this subtest. The percent of items measuring
each of the 12 Accomplished Practices ranges from five to nine percent. AP 3 Continuous
Improvement, AP6 Ethics, AP8 Subject Matter, and AP12 Technology each contain five
percent of the total number of items. AP5 Diversity and AP11 Role of the Teacher are
each comprised of seven percent of the total test items. AP1 Assessment, AP2
Communications, and AP4 Critical Thinking, and AP7 Human Development and
Learning, AP9 Learning Environment, and AP10 Planning each contain nine percent of
the items.
Development, Validity and Reliability of the Instrument
Test development information was obtained from the Florida Teacher
Certification Examination (FTCE) Florida Leadership Examination (FELE) Program

21
Procedures & Technical Information report. The test development process included
multiple stages. It began with the creation of committees to review existing
competencies, skills and test blueprints and to modify the existing competencies to reflect
current job-related practices, accepted teaching theory, Florida Statues, and the most
current Florida State Standards. Items are developed based upon the latest item
specifications, if the item is new it is pilot tested by potential examinees and then
reviewed by the committee formed for that task. New test forms are constructed based on
the test blueprint and other measurement criteria and these new forms are reviewed by a
committee of Florida educators according to specified review criteria. Please see Figure
5 for an illustration of the process modified from the Florida Department of Education
(2009) Program Report (p. 15).
The following information on validity and reliability was obtained from the
Florida Teacher Certification Examination (FTCE) Florida Leadership Examination
(FELE) Program Procedures & Technical Information report. The primary validity focus
for the FTCE is content validity. The content domain is developed by the Florida
Department of Education (FDOE) in combination with Florida subject matter experts.
Additional content validity is provided through involvement “with teachers, district
supervisors, teacher educators, and other education personal throughout the test
development process” (p. 2).

22
Figure 5 Florida Teacher Certification Examination (FTCE) Test Development and Initial Validation Study Overview
Reliability evidence is obtained using the Kuder-Richardson index (KR20). KR-
20 values are calculated for each administration of the test. Item bias is determined using
two different methods of differential item functioning (DIF). The first involves the
Competencies and Skills, Item Specifications, Test Blueprints
Item Development
Pilot Testing
Item Validation
Test Construction / Form Validation
State Board Approves New Competencies and Skills
New Test Form is ready
This Study - Evidence of Validity -
(Correlates)

23
“Mantel-Haenzel chi-square statistic (measuring uniform DIF only) is calculated” (p. 7).
“The second DIF statistic (published by Swaminathan and Rodgers in 1990) examines the
results of an independent test for nonuniform DIF (a logistic regression analysis with
model including an interaction term.” (p. 7).
Variables
There are four variables of primary interest in this study: gender, GPA, ethnicity,
mean scores for graded assignment(s) from Chalk and Wire assignments, and percentage
of items correct on the FTCE Professional Education subtests. These scores come from
the students’ best attempt on the FTCE. GPA is an interval variable that is the students’
GPA. GPA is comprised of all courses taken including courses transferred in from other
institutions. Race, for this analysis is a dichotomous nominal level variable that is coded
Caucasian (1) or non-Caucasian (0). Gender is also a dichotomous nominal level variable
that is coded female (0) or male (1). The scores for the FTCE Professional Education
subtest were the percentage of items correct and ranged from 0 to 1.0, with 1.0
representing 100 percent. The Chalk and Wire assignments were scored using a rubric
and values ranged from 1 to 5 (with 1=poor, 2=limited, 3=proficient, 4=strong, and
5=outstanding). Levels related to 1-5 will be treated as an interval level variable. Note:
There should be at least two scores for each of the Accomplished Practices. If multiple
scores, exists, for a given Accomplished Practice then these scores will be averaged to
create a single score. See Appendix A for the Table of Contents that illustrates the
positioning of each Accomplished Practice within each critical task within each course.
These authentic assessments are closely articulated to each of the Florida Accomplished

24
Practices. For example, with respect to AP #1, Assessment, the following critical tasks
are represented: RED4511/6514 Literacy Case Study, EDF4430 Assessment Project,
EDE4940 Impact on Student Learning Project, and ESOL 1 Lesson Plan Modification.
Data Collection Procedures
In the fall of 2011, a request was made to the College of Education’s Director of
Assessment for access to data for seniors who had taken the FTCE and related data that
were collected by the college. This included demographic information, gender, GPA,
ethnicity and authentic assessments from the Chalk and Wire ePortfolio system. It was
decided that the Elementary Education program would be used as it had the largest
number of respondents for the most current academic year (2009-2010 school year). The
Director of Assessment’s staff compiled the data and all indentifying information was
removed prior to the data being released to the researcher. The data were analyzed using
SAS statistical software version 9.2. IRB approval for this study was obtained prior to the
data being received and analyzed by the researcher
Statistical Analysis
A series of multiple regression analyses were used to answer the research
question: What is the relationship between authentic assessments (i.e., critical tasks) in
Chalk and Wire and performance on the Professional Education subtests on the Florida
Teacher Certification Exam while controlling for gender, ethnicity and overall GPA.
Multiple regression was the appropriate analysis to investigate the relationship between a
continuous dependent variable and multiple independent variables (Glass & Hopkins,

25
1996), assuming no consequential violations of the underlying statistical assumptions (the
assumptions will be discussed when the results of the analyses are presented.) The
independent variables are all entered into the analysis and multiple regression can help
determine whether the relationship between the group of independent variables and the
dependent variable is statistically significant. There are 12 Accomplished Practices
therefore there were 12 regression equations. The model of the equations, for each
Professional Knowledge is: Y’ = a + b1X1 + b2X2 + b3X3 + b4X4. Where Y’ equals the
predicted proportion of items correct, for the Professional Knowledge subtests on the
Florida Teacher Certification Exam (FTCE) for each of the Accomplished Practices.
X1= GPA. X2= Ethnicity. X3= Gender X4 = averaged scores for Graded Assignment(s) from Chalk and Wire (i.e., Lesson Plans, Case Studies).
26
CHAPTER 4
RESULTS
In this chapter the variables are described, followed by the correlational study
results, an overview of Multiple Regression Analysis, addressing how the assumptions
for the Multiple Regression analyses were met, and the results of the analysis.
The purpose of this study was to predict students’ scores on the Florida Teacher
Certification Exam Professional Education subtest from four predictors. The results are
presented include mean scores from Chalk and Wire authentic assessments for the 12
Accomplished Practices, gender, GPA, and ethnicity. The study was originally designed
as a predictive validity study. However, upon inspection of the data approximately 85%
of students submitted their final Chalk and Wire authentic assignments after taking the
FTCE. As a result this study is looking at the concurrent validity of the relationship
between the FTCE and the independent variables.
Descriptive Statistics
There were a total of 297 students in the sample for the 2009/2010 school year.
Two were dropped because they failed to report their ethnicity. A third was removed
because the university labeled their ethnicity as “Foreign Exchange Student”. This
results in a total of 294 students in the sample. Table 3 provides descriptive information

27
for the percentage of items correct from the Florida Teacher Certification Exam
Professional Education subtest for the 12 accomplished practices. The average percentage
of items correct ranged from a low of 67% for Continuous Improvement (AP3) to a high
of 87% for Learning Environment (AP9). Minimum percentage correct ranged from a
low of 17% for Continuous Improvement (AP3), Subject Matter (AP8), and Technology
(AP12). All 12 APs had a high percentage correct of one or 100%.
Table 3
Means and standard deviations of percentage of items correct from the Professional
Education subtests on the Florida Teacher Certification Exam
Variable n Mean SD Skewness Kurtosis Min Max
Assessment (AP1) 294 0.77 0.14 -0.56 0.54 0.20 1.00
Communications (AP2) 294 0.79 0.13 -0.40 -0.12 0.36 1.00
Continuous Improvement (AP3) 294 0.67 0.20 -0.25 -0.50 0.17 1.00
Critical Thinking (AP4) 294 0.80 0.13 -0.78 0.57 0.36 1.00
Diversity (AP5) 294 0.82 0.14 -0.60 0.19 0.38 1.00
Ethics (AP6) 294 0.83 0.15 -0.69 0.03 0.33 1.00
Human Development and Learning (AP7) 294 0.76 0.13 -0.29 -0.26 0.36 1.00
Subject Matter (AP8) 294 0.75 0.19 -0.62 -0.12 0.17 1.00
Learning Environment (AP9) 294 0.87 0.11 -0.93 1.33 0.36 1.00
Planning (AP10) 294 0.79 0.11 -0.33 -0.11 0.45 1.00
Role of the Teacher (AP11) 294 0.73 0.15 -0.11 -0.28 0.29 1.00
Technology (AP12) 294 0.78 0.19 -0.69 -0.01 0.17 1.00

28
Table 4 provides descriptive information for the average scores for the 12
Accomplished Practices. The means ranged from a low of 4.46 for Subject Matter (AP8)
to a high of 4.64 Communications (AP2) and Ethics (AP6). Minimum average scores
ranged from a low of 2.00 for Continuous Improvement (AP3). All 12 APs had maximum
average scores of 5.00.
Table 4
Means and standard deviations of mean scores from the Chalk and Wire ePortfolio
assignments
Variable n Mean SD Skewness Kurtosis Min Max
Assessment (AP1) 294 4.50 0.45 -1.11 1.11 2.97 5.00
Communications (AP2) 293 4.63 0.47 -1.45 1.99 3.00 5.00
Continuous Improvement (AP3) 285 4.49 0.59 -1.21 1.22 2.00 5.00
Critical Thinking (AP4) 293 4.59 0.41 -1.08 1.34 3.00 5.00
Diversity (AP5) 292 4.51 0.41 -1.07 1.66 3.00 5.00
Ethics (AP6) 270 4.63 0.40 -1.02 0.43 3.33 5.00
Human Development and Learning (AP7) 294 4.57 0.36 -1.59 4.07 2.67 5.00
Subject Matter (AP8) 294 4.46 0.53 -0.75 -0.24 3.00 5.00
Learning Environment (AP9) 294 4.55 0.42 -1.08 1.45 3.00 5.00
Planning (AP10) 293 4.54 0.41 -1.05 1.39 3.00 5.00
Role of the Teacher (AP11) 294 4.48 0.46 -0.97 1.01 2.50 5.00
Technology (AP12) 294 4.54 0.44 -1.28 1.81 2.60 5.00

29
Correlation Analysis
The Pearson product-moment correlation coefficient was used to examine
relationships for the continuous variables whereas the point-biserial correlation
coefficient was employed for the dichotomous level variables. Gender is dichotomous
and ethnicity was artificially dichotomized into Caucasian and non- Caucasian. As values
approach 1 the strength of the relationship increases and values closer to 0 represent no
relationship. With a positive value of 1.0 both variables are increasing in value and
negative values suggest that as one variable is increasing the other is decreasing. Cohen
defines a correlation of .1 as small, of .3 as medium, and .5 as large.
A total of 216 correlations were conducted. It was decided by the researcher to
limit the overall alpha of these correlations to .05. So for a correlation to be determinate
to be statistically significant it had to have a p-value less than 0.0002. That was obtained
by dividing 0.05 by 216.
Table 5 has the correlations and p-value evidenced between average scores for the
12 Accomplished Practices on the Chalk and Wire authentic assessments and the
percentage of items correct on the Florida Teacher Certification Exam (FTCE)
Professional Education subtests. There were no statistically significant correlations found
in this set of correlations and analyses. Correlations ranged from a 0.00052 for the
correlation between FTCE Technology (AP12) Chalk and Wire assessment Learning
Environment (AP9) to -0.14 for the correlation between Subject Matter (AP8) for both
the FTCE and the Chalk and Wire authentic assessments and 0.14 for the correlation
between FTCE Critical Thinking (AP4) and Chalk and Wire assessment Communication
(AP2).

30
Table 5
Correlations and p-values between average scores for the 12 Accomplished Practices from the Chalk and Wire authentic assessments and the percentage of items correct on the Professional Education subtests on the Florida Teacher Certification Exam Chalk and Wire AP1 AP2 AP3 AP4 AP5 AP6 AP7 AP8 AP9 AP10 AP11 AP12
Flor
ida
Teac
her C
ertif
icat
ion
Exam
(FTC
E) P
rofe
ssio
nal E
duca
tion
subt
est
Assessment (AP1)
0.08 -0.07 0.00 0.08 0.11 -0.05 0.11 0.05 0.03 0.05 0.14 0.06 0.17 0.26 0.98 0.17 0.06 0.42 0.06 0.40 0.65 0.35 0.02 0.29
Communications (AP2)
0.08 0.06 0.01 0.09 0.07 0.04 0.10 0.00 0.00 -0.07 0.08 0.00 0.15 0.30 0.92 0.14 0.21 0.53 0.09 1.00 0.99 0.26 0.16 0.97
Continuous Improvement (AP3)
0.00 -0.04 -0.03 -0.03 -0.01 0.02 -0.01 0.04 0.01 0.04 -0.04 -0.02
0.96 0.50 0.58 0.56 0.87 0.76 0.93 0.54 0.85 0.54 0.47 0.69 Critical Thinking (AP4)
0.08 0.14 0.04 0.02 0.04 0.04 0.11 0.01 0.07 0.02 0.04 0.06 0.16 0.02 0.54 0.71 0.54 0.50 0.07 0.91 0.24 0.78 0.49 0.29
Diversity (AP5) 0.02 -0.02 -0.01 -0.07 -0.06 -0.07 0.05 0.02 0.10 0.03 0.01 0.01 0.68 0.73 0.88 0.23 0.29 0.22 0.36 0.80 0.09 0.62 0.85 0.80
Ethics (AP6) 0.01 0.03 0.04 0.08 0.00 -0.03 0.04 0.11 0.06 0.08 -0.01 0.05 0.83 0.57 0.47 0.15 0.95 0.58 0.50 0.06 0.32 0.17 0.83 0.42
Human Development and Learning (AP7)
0.07 0.11 0.01 0.00 0.03 0.04 0.04 0.06 0.10 0.02 0.03 0.02
0.23 0.05 0.87 0.96 0.64 0.52 0.49 0.33 0.09 0.80 0.64 0.75
Subject Matter (AP8)
0.02 0.02 -0.04 -0.01 -0.03 0.02 -0.02 -0.14 -0.01 -0.09 -0.04 -0.03 0.74 0.73 0.51 0.91 0.66 0.81 0.74 0.02 0.89 0.14 0.50 0.65
Learning Environment (AP9)
0.03 0.07 0.10 0.00 0.03 0.03 0.06 0.01 -0.05 0.00 0.00 0.00
0.63 0.26 0.08 0.94 0.66 0.58 0.29 0.88 0.35 0.94 0.98 0.95
Planning (AP10) -0.07 0.13 -0.12 -0.04 0.03 -0.05 0.08 -0.08 0.08 0.03 -0.13 -0.01 0.25 0.03 0.04 0.52 0.66 0.37 0.17 0.20 0.19 0.58 0.02 0.92
Role of the Teacher (AP11)
0.06 -0.01 0.05 0.06 0.01 0.10 0.06 0.03 -0.01 0.00 0.08 0.04 0.28 0.84 0.36 0.29 0.86 0.12 0.35 0.64 0.88 0.94 0.18 0.54
Technology (AP12)
-0.01 0.00 0.00 -0.04 -0.09 -0.09 -0.03 -0.08 0.00 0.03 -0.06 -0.06 0.88 0.99 0.97 0.45 0.14 0.13 0.61 0.15 0.99 0.65 0.32 0.34
Note: n=294
Appendix B provides the correlations and p-values evidenced between the
percentage of items correct on the Florida Teacher Certification Exam (FTCE)
Professional Education subtest for the 12 accomplished practices and gender, ethnicity,
and GPA. Again no statistically significant correlations were found. Correlations ranged

31
from 0.001 for Subject Matter (AP8) and GPA to 0.102 for the correlation between
Communication (AP2) and GPA.
Appendix C provides the correlations, p-values and sample sizes between average
scores for the 12 Accomplished Practices from the Chalk and Wire authentic assessments
and gender, ethnicity, and GPA. Correlations ranged from 0.009 for Human Development
and Learning (AP7) and Gender to 0.417 for the correlation between Learning
Environment and GPA. All the correlations were statistically significant between the 12
APs and GPA at the .002 level except for Ethics (AP6). The correlations ranged in size
from 0.220 for Critical Thinking (AP4) and GPA to 0.417 for the correlation between
Learning Environment and GPA. These additional analyses, while unnecessary for the
main purpose of the study, were deemed important to examine potential bias in the
assessments.
The small non-significant correlations between the two sets of measures for the 12
APs suggested that there was little likelihood of finding statistically significant outcomes
in the regression models. It was decided to conduct the multiple regression analyses to
provide additional evidence of the lack of statistically significant relationships between
the average scores for the 12 Accomplished Practices from the Chalk and Wire authentic
assessments and the percent of items correct on the Florida Teacher Certification Exam
(FTCE) Professional Education subtest.
Multiple Regression Analysis
Multiple regression analysis was developed to predict an outcome variable from
two or more predictor variables. As this study was exploratory in nature, with little

32
attention to high stake decisions being made based upon the results of this study, it was
deemed appropriate to employ a nominal alpha level of .05 for each of the 12 regression
analyses, and then modify the nominal alpha based on the number of inferential tests
within each regression, accordingly. This resulted in each null hypothesis being tested at
the nominal alpha level of .01. For each regression equation the hypotheses included the
test of significance for R2 and the hypotheses tested for each independent variable, in
particular, the statistical significance of the independent variables: performance on the
authentic assessments related to each of the Accomplished Practices, gender, race, and
GPA.
The 12 regression equations were initially conducted and the data was outputted
to a new dataset. Studentized residuals with an absolute value of two or greater were
removed and the regression equations were rerun with the residual outliers removed. The
results of the two analyses were compared and overall there were not many substantive
differences in the results. However, two of the independent variables were statically
significant in the second run of the data. In the first analysis none of the independent
variables were statistically significant. The statistical assumptions and results of the
analyses are based upon the data with the Studentized residual outliers removed.
Statistical Assumptions
The results of statistical models are based, in part, on how well the assumptions
for the statistical models were met. The following underlying statistical assumptions were
tested to see if any of the assumptions were violated:

33
1. Independence of observations. A given observation is independent of the other
observations it the dataset. An observation is not impacted by or related to any other
observations, (Hatcher & Stepanski, 1999, p. 446). The data are clustered to some extent
because these students come from a single institution and are within one department.
2. Normal distribution of errors. The errors or residuals should be normally
distributed with a mean of zero (Hatcher & Stepanski, 1999, p.446). Values of skewness
and kurtosis were examined to determine if the residuals distribution for each model
violated the assumption of a normal distribution. Absolute values of one were used as the
criteria to evaluate this assumption. For skewness absolute values ranged from 0.045 for
Human Development and Learning (AP7) to 0.034 for Critical Thinking (AP4). Absolute
values of kurtosis ranged from 0.462 for Assessment AP1 to 0.876 for Technology
(AP12). Based upon these values the assumption of normal distribution of errors has been
met.
3. Linearity. The association between the criterion variable and each of the
predictor variables should be linier (Hatcher & Stepanski, 1999, p.446). Plots were
created of the observed versus the predicted values. These indicated that points were
randomly distributed providing evidence that this assumption had been met. This was
done only for the continuous independent variables GPA and scores from the assignments
in Chalk and Wire.
4. Homogeneity of variance (homoscedasticity). According to Osborne and
Waters (2002, p.4) the error variance should be the same across all levels of the
independent variable. Furthermore, the residuals should be randomly distributed around

34
zero. Plots of the residual versus the predicted values for each model were created. A
visual inspection of the plots indicated that the assumption of homogeneity was met.
5. Multicollinearity. According to O’Brian (2007, p.674) The Variance Inflation
Factors (VIF) indicates how much the estimated variance of the ith regression coefficient
is increased above what it would be if R2 equaled zero. This R2 is the R2 for the ith
regressor when it is regressed on the other regressors. He further points out that rules of
thumb values range from four to ten before one should be concerned. Values of VIF in
this study, for the four independent variables, ranged from 1.012 for gender in Diversity
(AP5) to 1.224 for the Chalk and Wire score in Learning Environment (AP9). These
values suggest that multicollinearity was not exhibited in these data.
6. Model Specification. Pedhazur (1997, p35) “Broadly, specification errors refer
to any errors committed in specifying the model to be tested”. More specifically it
addresses whether the independent variables are appropriate for the theoretical model
being studied. Another way to look at it is, are the independent variables the most
appropriate ones for the regression model. Also a part of Model Specification is
additivity, which addresses the concern that the interactions between regressors are
correctly specified. The independent variables examined in the series of regression
analyzes were not deemed to be statistically significant, suggesting that there are other
independent variables that need to be considered in future studies.
7. Measurement Error. Pedhazur (1997) suggests that errors in the dependent
variable(s) result in increased errors in the error of the estimate weakening the tests of
significance. While measurement errors in the independent variable result in the
underestimation of the regression coefficient. Crocker and Algina (1986) argue that most

35
measurement scores contain error as they are typically based upon a limited number of
items and are collected at only one point in time. The independent variables examined in
the series of regression analyzes were not deemed to be statistically significant,
suggesting that there are other independent variables that need to be considered in future
studies. The scores from the Chalk and Wire authentic assessments were limited in
variability. GPA is complex in that individual assignments influence course grades and
course grades in turn influence GPA. Both the Chalk and Wire authentic assessments and
GPA would be expected to contain some level of measurement error.
With respect to the set of dependent variables, the percentage of items correct,
according to the Florida Department of Education (2011b, p.6) manual, the following
analyses are conducted on each administration of the FTCE: “average p-value, average
point biserial, KR20 test reliability, standard error of measurement, and the Brennan-
Kane index.”
The Florida Department of Education (2011b, p. 6) manual, also reports
“Individual analyses include: item response distribution by response alternative (number
and proportion); p-value (the percentage of examinees selecting the keyed correct
response); item-to-test point biserial correlations; and item discrimination index (the
difference in proportion correct between the upper and lower 27% of examinees).”
Reliability is reported to be evaluated by the Kuder-Richardson index of item
homogeneity (KR20). Which is a procedure used to provide evidence of an overall tests
reliability.
The Florida Department of Education manual (2011b, p. 7) provides the following
evidence of their attempt to remove Item Bias;

36
Efforts to avoid bias begin with the manner in which the assessment materials are
created and reviewed. The FTCE development process includes the review criterion of
“freedom from bias” for the competencies and skills, test blueprint, item specifications,
items, test forms, and test information guide.
First, the Mantel-Haenszel chi-square statistic (measuring uniform DIF only) is
calculated. The statistic is distributed approximately as chi-square with one degree of
freedom (df). The chi-square with continuity correction and the probability of obtaining
the chi-square by chance is supplied. “Alpha” is the common odds ratio, an estimate of
the effect size. Values less than 0.05 are statistically significantly different from zero. The
lower and upper limits of the 95% confidence interval around alpha are provided. The
odds ratio is converted to log odds to place it on a scale that is symmetric around zero
(Delta). The resultant value is mapped to an A/B/C flagging scheme (published by
Longford, Holland, and Thayer in 1993).
The second DIF statistic (published by Swaminathan and Rogers in 1990)
examines the results of an independent test for nonuniform DIF (a logistic regression
analysis with model including an interaction term). In addition, the items NOT flagged
for uniform DIF (the A-level items) are reported first if they were flagged for non-
uniform DIF, followed by the remaining items (those with no flags).
Multiple Regression Results
Table 6 provides the Summary of the 12 multiple regression analyses used to
examine the relationship between the authentic assessments (i.e., critical tasks) in Chalk
and Wire for the 12 Accomplished Practices and performance on the Professional

37
Education subtest scores on the Florida Teacher Certification Exam (FTCE). The amount
of variance accounted for (R2) by the four independent variables ranged from 0.0046 for
equation three (Continuous Improvement AP3) to 0.0595 for equation five (Diversity
AP5).
Results of these analyses showed that for Diversity (AP5), the four predictors
explained 6.0% of the variance (R2=.0595, F(4,276)=4.36, p<.01). However, only one of
the predictors, gender, was statistically significant (β =-0.161, p<.01). For females the
percentage of items correct was .08 higher that the males (.83 versus .75, respectively and
are based on means of each group. Similarly results emerged for Technology (AP12),
where the four predictors explained 3.5% of the variance (R2=.0350, F(4,273)=2.47,
p<.01). Again, the only statistically significant predictor was gender (β =-0.170, p<.01).
For females, the percentage of items correct was .09 higher that the males (.81 versus .72,
respectively) respectively and are based on means of each group.

38
Table 6
Summary of Regression Analysis examining the Relationship between Independent Variables with Scores on Professional Education subtests on the Florida Teacher Certification Exam
Criterion ID Variables n β t p R2 p 1. Assessment C & Wire Critical
Task 0.084 1.310 0.191
Gender 0.060 1.000 0.319 GPA -0.039 -0.610 0.542 Ethnicity -0.016 -0.270 0.788 284 0.0102 0.5800 2. Communication C & Wire Critical
Task 0.017 0.280 0.780
Gender 0.095 1.580 0.114 GPA 0.121 1.960 0.052 Ethnicity -0.006 -0.090 0.925 284 0.0231 0.1619 3. Continuous
Improvement C & Wire Critical
Task -0.035 -0.560 0.575
Gender -0.047 -0.760 0.445 GPA 0.020 0.310 0.755 Ethnicity 0.029 0.470 0.637 278 0.0046 0.8672 4. Critical
Thinking C & Wire Critical
Task 0.058 0.940 0.349
Gender -0.103 -1.700 0.090 GPA 0.068 1.100 0.274 Ethnicity -0.036 -0.600 0.552 278 0.0210 0.2128 5. Diversity C & Wire Critical
Task -0.140 -2.250 0.025
Gender -0.161 -2.750 0.006* GPA 0.155 2.500 0.013 Ethnicity 0.025 0.420 0.678 281 0.0595 0.0020 6. Ethics C & Wire Critical
Task 0.073 7.450 0.256
Gender 0.063 1.140 0.318 GPA -0.071 1.000 0.271 Ethnicity -0.058 -1.100 0.357 256 0.084 1.310 0.191 0.0162 0.3916 * p< .01;

39
Table 6 -Continued
Summary of Regression Analysis examining the Relationship between Independent Variables with Scores on Professional Education subtests on the Florida Teacher Certification Exam
Criterion ID Variables n β t p R2 p 7. Human
Development and Learning
C & Wire Critical Task 0.062 0.940 0.348
Gender -0.047 -0.780 0.437 GPA 0.006 0.090 0.926 Ethnicity -0.038 -0.620 0.534
286 0.0066 0.7599
8. Subject Matter C & Wire Critical Task -0.143 -2.170 0.031
Gender 0.040 0.650 0.515 GPA 0.101 1.570 0.118 Ethnicity -0.039 -0.650 0.519 279 0.0251 0.1368 9. Learning
Environment C & Wire
Critical Task -0.058 -0.870 0.386
Gender -0.029 -0.490 0.628 GPA 0.092 1.390 0.165 Ethnicity 0.051 0.840 0.400 280 0.0110 0.5482 10. Planning C & Wire
Critical Task 0.052 0.770 0.440
Gender 0.051 0.830 0.405 GPA -0.020 -0.310 0.758 Ethnicity -0.021 -0.350 0.729 277 0.0046 0.8700 11. Role of the
Teacher C & Wire
Critical Task 0.082 1.300 0.194
Gender 0.020 0.340 0.734 GPA 0.068 1.070 0.284 Ethnicity 0.079 1.330 0.185 285 0.0230 0.1619 12. Technology C & Wire
Critical Task -0.055 -0.850 0.398
Gender -0.170 -2.840 0.005* GPA 0.062 0.940 0.348 Ethnicity -0.047 -0.780 0.437 278 0.0350 0.0448 * p< .01;

40
CHAPTER 5
CONCLUSION
This study explored the relationship between Elementary Education Teacher
Candidates’ authentic assessments and performance on the Professional Education
subtests on the Florida Teacher Certification Exam (FTCE). In this chapter, the results
are reiterated, followed by a discussion, conclusion, and recommendations for future
research.
The correlational analyses found evidence that both the candidates’ authentic
assessments and performance on the Professional Education subtests on the Florida
Teacher Certification Exam (FTCE) were free of bias with respect to gender and
ethnicity. There was a statistically significant relationship between scores on the
authentic assessments from Chalk and Wire and students GPA. However, no statistically
significant relationship was found between the two methods of measuring the 12
Accomplished Practices.
The multiple regression analyses provided additional evidence of the lack of a
relationship between the authentic assessments and performance on the Professional
Education subtests on the Florida Teacher Certification Exam (FTCE). Gender was found
to have a significant relationship with two of the Accomplished Practices with females
scoring higher on the Professional Education subtests on the Florida Teacher
Certification Exam (FTCE) than males for Diversity (AP5) and Technology (AP12). It is
41
hypothesized that the lack of variability in the score from the authentic assessments in
Chalk and Wire for the 12 Accomplished Practices was the primary reason for the lack of
statistically significant relationships.
Discussion
The correlations revealed little in the way of a relationship between Elementary
Education Teacher Candidates’ authentic assessments and performance on the
Professional Education subtests on the Florida Teacher Certification Exam (FTCE). It
was surprising to find such a lack of relationships between the average scores for the 12
Accomplished Practices from the Chalk and Wire authentic assessments and the
proportion of items correct on the Professional Education subtests on the Florida Teacher
Certification Exam (FTCE). Further, one would have thought that a relationship would
exist between some of the Accomplished Practices as they are not mutually exclusive.
The Florida Teacher Certification Exam (FTCE) manual presented evidence of
content validity as skills identified by the Florida Department of Education along with
Florida subject matter experts and stated that the content validity is “reinforced through
the involvement of Florida educators, including teachers, district supervisors, teacher
educators, and other education personnel throughout the test development” Florida
Department of Education (2011b, p.2). The Florida Teacher Certification Exam (FTCE)
manual further states that no attempt was made to examine a relationship between the
Florida Teacher Certification Exam and independent, concurrent, or future criteria
inference from test scores and should not be used to make statements about future
performance in the field. An additional caveat was “Construct and criterion-related
42
validation approaches are not appropriate to the validity issues related to the development
and use of the Florida Teacher Certification Exam” (p.2).
Reliability was reported to be evaluated by the: Kuder-Richardson index of item
homogeneity (KR20). The KR20 is a procedure that is used to provide evidence of an
overall tests’ reliability. Several statistics for evaluating differential item function are also
presented.
The Florida Department of Education (2011b, p. 6) manual, also reports
“Individual analyses include: item response distribution by response alternative (number
and proportion); p-value (the percentage of examinees selecting the keyed correct
response); item-to-test point biserial correlations; and item discrimination index (the
difference in proportion correct between the upper and lower 27% of examinees).”
While the Professional Education subtests on the Florida Teacher Certification
Exam (FTCE) manuals provided a list of approaches that are use to validate their
instrument it would have been advantageous to have had actual results (e.g., numerical
values) to provide additional evidence with respect to the test and item analysis of the
Florida Teacher Certification Exam (FTCE).
Similarly, with the authentic assessments from Chalk and Wire the inferences that
can be made about the validity and reliability of the respective measures are limited.
Whether the fact that the Florida Teacher Certification Exam is multiple choice and the
authentic assessments are applied, played a role is unknown. It is also possible that the
content on the authentic assessments is not closely aligned with the content on the Florida
Teacher Certification Exam (FTCE). However, it is thought that the limited amount of

43
variability in the scores for the authentic assessments was the major contributing factor
with respect to the lack of statistical significance evidenced in this study.
Conclusions
While this study did find evidence to support the lack of bias in both sets of
measures with respect to gender and ethnicity it found little support for the relationship
between authentic assessments (i.e. critical tasks) in Chalk and Wire and performance on
the Professional Education subtests on the Florida Teacher Certification Exam while
controlling for gender, ethnicity and overall GPA.
The state of Florida has advanced the 12 Accomplished Practices to provide
universities with guidelines as to what is believed to make an effective teacher.
According to Florida Department of Education (2011a), the Accomplished Practices were
originally developed in 1998 and in December of 2010 the State Board of Education
agreed to revise the Accomplished Practices. This study employed authentic assessments
that were developed to be articulated with the original Accomplished Practices advanced
in 1998.
In January of 2010 the Commissioner’s Teacher Task Force implemented a
review of the Accomplished Practices with the intended goal to streamline and modernize
the Accomplished Practices and the first draft was released to the public in March of
2010. The development of the Accomplished Practices included working sessions at
professional conferences, organized meetings with teachers, and a web page that allowed
for comments. In June of 2010, The Accomplished Practices Advisory Work group was
created and assigned the task of preparing a final draft of the new Accomplished

44
Practices. The group was comprised of expert educators with a variety of backgrounds
and disciplines. Several drafts of the new Accomplished Practices were released for
public review and scrutiny and on December 17, 2010 the state board adopted the 2010
Accomplished Practices.
The 2010 Accomplished Practices are fewer in number. Six (6) Accomplished
Practices are organized around important instructional processes and professional
expectations. Moving forward, Colleges of Education are encouraging their faculty to
develop authentic assessments with which to measure teacher candidate performance
with respect to this new set of standards. Further, it is important to promote awareness of
the essential elements of these standards. The ultimate goal is to foster an understanding
of the expectations for the quality of instruction and the support of our students statewide
(Florida Department of Education, 2011a).
Centers of higher education are increasingly called upon to implement alternative
assessment strategies that provide measures of both student and program effectiveness
(Cummings, Maddux & Richmond, 2008). It is important that the link between authentic
assessments and important student learning outcomes continue to be examined. The
adoption of this new set of Accomplished Practices, with a more clinical focus, will
require a comprehensive examination of our current curriculum and our existing
authentic assessments in Chalk and Wire. Undoubtedly, this will require the refinement
and revision of our current assessment system and the development of additional
assessment strategies.

45
Recommendation for Future Research
What authentic assessments are more indicative of future student success? Once
the new critical tasks have been developed, it will be critically important to revisit the
validity question and take another look at the relationship between our authentic
assessments and other important educational outcomes. It may also be worthwhile to
conduct a more in-depth analysis of the alignment of the content within a new set of
authentic assessment and the content on our certification exams and other elements
indicative of student achievement.
There is also a need to examine how instructors are assessing student work in
Chalk and Wire. Assessments should reflect the students’ initial score and subsequent
scores after remediation. Further, scores of five should be reserved for truly exemplary
work. In some cases, remediation was occurring, outside of the assessment system, and
only the highest score obtained was recorded. (Director of Assessment, personal
communication, April 5, 2012).
The integrity of the assessment system is vital if high stakes decisions are being
made based on the interpretation of the data being collected in the Chalk and Wire
ePortfolio initiative. Scores from the critical tasks in Chalk and Wire are used to
determine if a given student has demonstrated competency with respect to a set of
standards, a critical component of accreditation decisions. Scores on critical assignments
are also used to determine if a teacher candidate passes or fails a particular course.
We live in an era of increased accountability and we are consistently called upon
to make data-based decisions. It is imperative that these decisions be based on upon data

46
collected employing authentic assessments with the necessary integrity to support these
inferences.

47
References
American Educational Research Association, American Psychological Association, &
National Council on Measurement in Education. (1999). Standards for
educational and psychological testing. Washington, DC: American Educational
Research Association.
Barrett, H., & Carney. J. (2005). Conflicting paradigms and competing purposes in
electronic portfolio development. Retrieved March 28, 2011, from
http://electronicportfolios.org/portfolios/LEAJournal-BarrettCarney.pdf
Carney, J. (2004). Setting an agenda for electronic portfolio research: A framework for
evaluating portfolio literature. Paper presented at the annual meeting of the
American Educational Research Association, San Diego, CA. Retrieved
December 3, 2011, from
http://it.wce.wwu.edu/carney/Presentations/AERA04/AERAresearchlit.pdf
Chalk and Wire Learning Assessment (n.d.)., Chalk & Wire, Company, About. Retrieved
December 5, 2011 from http://chalkandwire.com/index.php/company

48
Cohen, J. (1992). A power primer. Psychological Bulletin, 112, 155-159. Retrieved April
3rd, 2012 from
http://internal.psychology.illinois.edu/~broberts/Cohen,%201992.pdf
Crocker, L. & Algina, J. (1986). Introduction to Classical and Modem Test Theory. New
York: Holt, Rinehart and Winston.
Cronbach, L. J., & Meehl, P. E. (1955). Construct validity in psychological tests.
Psychological Bulletin, 52, 281-302. Retrieved December 6, 2011, from
http://web.ebscohost.com/ehost/pdfviewer/pdfviewer?sid=bbd041fd-6b80-4ffb-
a13c-584d776a9b24%40sessionmgr15&vid=1&hid=14
Cummings R., Cleborne, D., & Richmond, M & A. (2008). Curriculum‐embedded
performance assessment in higher education: maximum efficiency and minimum
disruption, Assessment & Evaluation in Higher Education, 33:6, 599-605
Retrieved on April 7, 2012 from
http://www.tandfonline.com/doi/citedby/10.1080/02602930701773067#tabModule
Education Week (August 4, 2004). No Child Left Behind. Retrieved December 5, 2011
from: http://www.edweek.org/ew/issues/no-child-left-behind/

49
Florida Department of Education (October 2006). Florida Teacher Certification
Examination Test preparation guide for professional education. (5th Edition). Retrieved
December 2, 2011 from
http://www.collier.k12.fl.us/hr/certification/studyguides/Professional%20Education.pdf
Florida Department of Education (2009). Florida Teacher Certification Examination
(FTCE) Florida Leadership Examination (FELE) program report. Retrieved
December 2, 2011 from http://www.fldoe.org/asp/pdf/09perfbook.pdf
Florida Department of Education (2011a). Adoption of Changes to Rule 6A-5.065,
Florida Educator Accomplished Practices, and Revisions to Teacher Evaluation
Systems and Preparation Programs. DPS: 2010-230. Retrieved April 9, 2012
from http://info.fldoe.org/docushare/dsweb/Get/Document-5968/dps-2010-
230.pdf
Florida Department of Education (2011b). Florida Teacher Certification Examination
(FTCE) Florida Leadership Examination (FELE) program procedures &
technical information. Provided by the Florida Department of Education, Bureau
of Postsecondary Assessment, via email contact. Received November 17, 2011.

50
Florida Department of Education (Updated March 2011). FTCE/FELE maximum
percentages of correct questions needed to achieve a minimum passing score.
Retrieved December 2, 2011 from
http://www.fldoe.org/asp/ftce/pdf/percentpass.pdf
Florida Department of Education ( n.d.). Florida Educator Accomplished Practices
(FEAPs). Retrieved March 22, 2012 from http://www.fldoe.org/profdev/FEAPs/
Gall, M. D., Gall, J. P., & Borg, W. R. (2007) Educational research: An introduction.
Boston: Pearson Education.
Glass, G. V., & Hopkins, K. D. (1996). Statistical methods in education and psychology.
Boston: Allyn and Bacon.
Hatcher, L., & Stepanski, E. (1999). A Step-by-Step Approach to Using SAS
System for Univariate and Multivariate Statistics. Cary, NC: SAS Institute,
Herman, J., & Winters, L. (1994). Portfolio research: a slim collection. Educational
Leadership, 52, 48-55. Retrieved from OmniFile Full Text Mega database on
12/3/2011

51
Lane, S. (2010). Performance assessment: The state of the art. (SCOPE Student
Performance Assessment Series). Stanford, CA: Stanford University, Stanford
Center for Opportunity Policy in Education. Retrieved on April 7, 2012 from
http://edpolicy.stanford.edu/sites/default/files/publications/performance-
assessment-state-art_1.pdf
Lennon, R. T. (1955). Assumptions underlying the use of content validity. Educational
and Psychological Measurement, 16 (3), 294-304.
Lissitz, R. W., & Samuelsen, K. (2007). A Suggested Change in Terminology and
Emphasis regarding Validity and Education. Educational Researcher , 36, (8), pp.
437-448
Lorenzo, G., & Ittelson, J. (2005), An Overview of E-Portfolios, EDUCAUSE Learning
Initiative, ID: ELI3001. Retrieved December 6, 2011 from
http://net.educause.edu/ir/library/pdf/ELI3001.pdf
Messick, S. (1989). Validity. In R. L. Linn (Ed.), Educational measurement, 3rd ed., (pp.
13-103). New York, NY: Macmillan.
O’brien, R. M. (2007). A Caution Regarding Rules of Thumb for Variance Inflation
Factors. Quality Quantity, 41(5), 673-690. Retrieved April 2, 2012 from
http://web.unbc.ca/~michael/courses/stats/lectures/VIF%20article.pdf

52
Onwuegbuzie, A. J., Witcher, A. E., Collins, K. M. T., Filer, J. D., Wiedmaier, C. D., &
Moore, C. W. (2007). Students’ perceptions of characteristics of effective college
teachers: A validity study of a teaching evaluation form using a mixed-methods
analysis. American Educational Research Journal, 44, 113- 160.
Osborne, J. & Waters, E. (2002). Four assumptions of multiple regression that
researchers should always test. Practical Assessment, Research & Evaluation,
8(2). Retrieved April 2, 2012 from http://PAREonline.net/getvn.asp?v=8&n=2
Pedhazur, E. J. (1997). Multiple regression in behavioral research (3nd ed.). New York:
Holt, Rinehart, & Winston.
Redfield, D., Roeber, E., & Stiggins, R. (2008). Building balanced assessment systems to
guide educational improvement. Paper presented at the National Conference on
Student Assessment, Orlando, FL. Retrieved on April 7, 2012 from
http://www.quantiles.com/pdf/Balanced.pdf
Ritzhaupt, A.D., Singh, O., Seyferth, T., & Dedrick, R.F. (2008). Development of the
electronic portfolio student perspective instrument: An eportfolio integration
initiative. Journal of Computing in Higher Education, 19(2).

53
Wilkerson, J. & Lang, W. (2003). Portfolios, the Pied Piper of teacher certification
assessment: legal and psychometric issues. Education Policy Analysis Archives,
11(45): 1–31. Retrieved December 3, 2011 from http://epaa.asu.edu/epaa/v11n45/

54
Appendices

55
Appendix A
Linkages between the Critical Tasks in Chalk and Wire and the 12 Accomplished Practices for the Elementary Education Undergraduate Program

56
Appendix A (Continued)
Linkages between the Critical Tasks in Chalk and Wire and the 12 Accomplished Practices for the Elementary Education Undergraduate Program

57
Appendix B
Correlations and p-values between the percentage of items correct on the Professional Education subtests on the Florida Teacher Certification Exam and the 12 Accomplished Practices and Gender, Ethnicity, and GPA
Gender Ethnicity GPA
Assessment (AP1) 0.079 -0.002 0.015
0.178 0.973 0.801
Communications (AP2) 0.066 -0.006 0.102
0.261 0.915 0.080
Continuous Improvement (AP3) -0.032 0.021 0.015
0.589 0.719 0.797
Critical Thinking (AP4) -0.047 -0.011 0.055
0.427 0.846 0.347
Diversity (AP5) -0.105 -0.017 0.091
0.073 0.769 0.120
Ethics (AP6) 0.031 -0.084 -0.030
0.598 0.150 0.604
Human Development and Learning (AP7) -0.050 0.004 0.029
0.393 0.945 0.616
Subject Matter (AP8) 0.062 -0.023 0.001
0.293 0.699 0.982
Learning Environment (AP9) 0.010 0.013 0.024
0.861 0.831 0.683
Planning (AP10) 0.010 -0.020 -0.015
0.868 0.732 0.801
Role of the Teacher (AP11) 0.027 0.053 0.067
0.643 0.361 0.252
Technology (AP12) -0.092 -0.025 -0.008
0.115 0.671 0.894
Note: n=294; Gender coded 0=female, 1=male; Ethnicity coded 0=non-Caucasian, 1= Caucasian.

58
Appendix C
Correlations and p-values between average scores for the 12 Accomplished Practices from the Chalk and Wire authentic assessments and Gender, Ethnicity, and GPA
Gender Ethnicity GPA
Assessment (AP1) -0.019 0.096 0.359
0.748 0.102 <.0001
294 294 294
Communications (AP2) -0.127 -0.021 0.277
0.030 0.720 <.0001
293 293 293
Continuous Improvement (AP3) 0.028 0.122 0.274
0.635 0.040 <.0001
285 285 285
Critical Thinking (AP4) 0.039 0.032 0.220
0.507 0.583 0.000
293 293 293
Diversity (AP5) 0.021 0.147 0.313
0.725 0.012 <.0001
292 292 292
Ethics (AP6) -0.027 0.087 0.184
0.663 0.152 0.002
270 270 270
Human Development and Learning (AP7) 0.009 0.167 0.407
0.875 0.004 <.0001
294 294 294
Subject Matter (AP8) -0.193 0.088 0.371
0.001 0.133 <.0001
294 294 294
Note: Gender coded 0=female, 1=male; Ethnicity coded 0=non-Caucasian, 1= Caucasian.

59
Appendix C (Continued)
Correlations and p values between average scores for the 12 Accomplished Practices from the Chalk and Wire authentic assessments and Gender, Ethnicity, and GPA
Gender Race GPA
Learning Environment (AP9) -0.148 0.115 0.417
0.011 0.048 <.0001
294 294 294
Planning (AP10) -0.171 0.081 0.395
0.003 0.165 <.0001
293 293 293
Role of the Teacher (AP11) 0.029 0.069 0.342
0.619 0.236 <.0001
294 294 294
Technology (AP12) -0.059 0.094 0.395
0.317 0.107 <.0001
294 294 294
Note: Gender coded 0=female, 1=male; Ethnicity coded 0=non-Caucasian, 1= Caucasian.