examination of the relationship between school
TRANSCRIPT

!!!!!
!EXAMINATION OF THE RELATIONSHIP BETWEEN SCHOOL ORGANIZATIONAL CLIMATE AND ELEMENTARY SCHOOL
STUDENTS’ SOCIO-EMOTIONAL OUTCOMES
By
McHale Newport-Berra
A dissertation submitted to Johns Hopkins University in conformity with the requirements for the degree of Doctor of Philosophy
Baltimore, Maryland
November, 2013
© 2013 McHale Newport-Berra All Rights Reserved

ii
Abstract
Background: Behavior problems and poor social skills in elementary school are
associated with academic and social difficulties in childhood, and later consequences
such as educational failure, psychiatric problems, and criminality. Previous research has
examined the relationship between student-perceived school climate and socio-emotional
outcomes. Given the influence of work environment on employee behavior, more
research is needed that examines the relationship between the staff-perceived school
environment and students’ outcomes.
Methods: Data came from third and fifth grade waves of the Early Childhood
Longitudinal Study-Kindergarten Class (ECLS-K). Using factor analysis, school
organizational climate scales were identified comprised of items from teacher and
administrator surveys. For Aim 2, 9,173 students were nested in 1,523 schools to
examine relationships between climate dimensions and students’ socio-emotional
outcomes in fifth grade, net third grade behaviors and other individual, family, teacher
and school variables. Moderation by students’ socio-economic status and previous
behavior problems was examined with interaction terms. Aim 3 examined teachers’ job
satisfaction as a mediator of the relationship between school organizational climate and
socio-emotional outcomes.
Results: Factor analysis yielded five administrator-reported factors: General Facilities,
Extracurricular Facilities, Safety, Stability, and Community Support & School Order, and
four teacher-reported factors: Teacher Interaction, Staff Collegiality, Leadership and

iii
Student Conduct. Higher levels of school-wide positive Student Conduct were associated
with lower levels of externalizing behaviors and higher levels of social skills in fifth
grade students. Better Community Support & School Order was associated with greater
social skills. Some associations were stronger for students from low-income families and
with more third grade behavior problems. Staff Collegiality, Leadership and Student
Conduct were significantly associated with teacher job satisfaction, which had a small,
but significant, association with most socio-emotional outcomes.
Conclusion: ECLS-K administrator and teacher surveys produced school organizational
climate scales with acceptable psychometric properties that can be used in future
research. The link between school-wide student conduct and students’ socio-emotional
outcomes reinforces the importance of school-level efforts to promote positive behavior
and prevent bullying, particularly for low-income children. Other dimensions of school
organizational climate, including Leadership and Staff Collegiality, may be indirectly
related to students’ socio-emotional outcomes through teacher behaviors.
Advisor: Anne W. Riley, Ph.D.

iv
Committee of Final Thesis Readers Committee Members Dr. Elizabeth Colantuoni, Assistant Scientist Department of Biostatistics, Johns Hopkins Bloomberg School of Public Health Dr. Tamar Mendelson, Associate Professor Department of Mental Health, Johns Hopkins Bloomberg School of Public Health Dr. Cynthia Minkovitz, Professor Department of Population, Family & Reproductive Health, Johns Hopkins Bloomberg School of Public Health Dr. Anne W. Riley (Advisor), Professor Department of Population, Family & Reproductive Health, Johns Hopkins Bloomberg School of Public Health
Alternate Committee Members Janice Bowie, Associate Professor Department of Health, Behavior and Society, Johns Hopkins Bloomberg School of Public Health Kristin Mmari, Assistant Professor Department of Population, Family & Reproductive Health, Johns Hopkins Bloomberg School of Public Health
v
Acknowledgements
I would like to express my gratitude for all of the individuals who provided
support and guidance during my doctoral studies and dissertation research.
I would like to thank my committee members. First and foremost, thank you to
my advisor, Dr. Anne Riley, for her steady and thoughtful guidance, mentorship, and
support. She has helped me to nurture and explore my interests and passions, while also
pushing me to examine these issues with rigor. Thank you also to Dr. Elizabeth
Colantuoni for her statistical guidance; her knowledgeable and ready help made it
possible for me to conduct these analyses. I would also like to thank Dr. Cynthia
Minkovitz for her assistance and support, particularly her willingness to help, her
practical and policy-oriented perspective, and her careful reading of, and feedback about,
my dissertation. I also thank Dr. Tamar Mendelson, who provided valuable insight that
helped me think about implications of, and next steps for, my research.
I would also like to thank several other faculty and staff. Thank you to Dr. Bob
Blum, both for the learning opportunities he provided me and his accessibility and
dedication to students in general. I also thank Dr. Catherine Bradshaw, who helped me to
think about the role of schools and provided assistance in multiple ways. I would also like
to thank Mark Emerson for his help managing and accessing the data. Finally, I would
like to extend a big thank you to Lauren Ferretti, for so graciously and ably helping me
accomplish the many logistical tasks necessary to complete this degree.
I would also like to thank my fellow students for their emotional and academic
support they have provided over the past four years. In addition to my doctoral cohort, I

vi
would like to extend a special thank you to other students in my department who
provided advice and assurance that made it much easier to navigate this process.
Most of all, I want to thank my family for their unwavering support and
encouragement. Thank you to my parents, who have always had confidence in me and
been such enthusiastic cheerleaders. Thank you to my brothers for supporting me and
taking an interest in my work—and for making me laugh! Thank you to my daughter,
Kaya, who inspires me every day with her joy and curiosity. Finally, I am deeply grateful
to my amazing husband, Samidh, who provided crucial reassurance during the
challenging moments of this process, and so enthusiastically joined me in celebrating the
successes. Thank you for believing in me, for embracing my goals and for all you have
done to help me accomplish them.
I am grateful for the financial support I received that helped me to complete my
doctoral studies and conduct this research, including the Donald A. Cornely Maternal and
Child Health Scholarship and the Alice and John Chenoweth-Pate Scholarship.
Additionally, this research was supported by a grant from the American Educational
Research Association (AERA), which receives funds from its “AERA Grants Program”
from the National Science Foundation under Grant #DRL-0941014. Opinions reflect
those of the author and do not necessarily reflect those of the granting agencies.
vii
Table of Contents
Dissertation Abstract ........................................................................................................ ii Committee of Final Thesis Readers ............................................................................... iv Acknowledgements ...........................................................................................................v List of Tables ................................................................................................................... ix List of Figures .................................................................................................................. xi Chapter 1: Background and Significance ........................................................................1
Introduction ......................................................................................................................2 Dissertation Overview ......................................................................................................4 Study Aims and Hypotheses ............................................................................................5 Background ......................................................................................................................6 Theory and Conceptual Framework ...............................................................................22 References ......................................................................................................................27
Chapter 2: Research Design and Methods ....................................................................40
Study Design ..................................................................................................................41 Study Sample ..................................................................................................................41 Data Collection ..............................................................................................................44 Measures and Variables .................................................................................................50 Analytic Methods ...........................................................................................................60 References ......................................................................................................................71
Chapter 3: Identification of School Organizational Climate Constructs in the ECLS-K Using Factor Analysis ......................................................................................74
Abstract ..........................................................................................................................75 Introduction ....................................................................................................................77 Methods ..........................................................................................................................81 Results ...........................................................................................................................87 Discussion ......................................................................................................................93 References ......................................................................................................................98
Chapter 4: School Organizational Climate and Students’ Socio-emotional Outcome in Elementary School .....................................................................................................107
Abstract ........................................................................................................................108 Introduction ..................................................................................................................110 Methods ........................................................................................................................118 Results .........................................................................................................................127 Discussion ....................................................................................................................132 References ....................................................................................................................138

viii
Chapter 5: Understanding the Link Between the School Work Environment and Students’ Socio-Emotional Development: the Role of Teacher Job Satisfaction ....158
Abstract ........................................................................................................................159 Introduction ..................................................................................................................160 Methods ........................................................................................................................165 Results .........................................................................................................................175 Discussion ....................................................................................................................178 References ....................................................................................................................185
Chapter 6: Conclusion ..................................................................................................196
Summary of Results .....................................................................................................197 Implications for Policy and Practice ............................................................................200 Implications for Research .............................................................................................202 Strengths and Limitations ............................................................................................203 Conclusion ....................................................................................................................207 References ....................................................................................................................209
Appendices ......................................................................................................................211
Appendix 1 ...................................................................................................................211 Appendix 2 ...................................................................................................................213
Curriculum Vitae ..........................................................................................................215

ix
List of Tables Table 2.1 Comparison of Full Fifth Grade Sample and Analytic Sample .................43 Table 2.2 Child-level completion rates for children with scorable reading, math or science assessment or children not assessed due to disabilities, by survey instruments .................................................................................................46 Table 2.3 Split-half reliabilities for teacher Social Rating Scale scores ....................48 Table 2.4 Self-Description Questionnaire scale reliabilities ......................................50 Table 2.5 Description of Study Variables ..................................................................51 Table 3.1 Factor loadings from exploratory factor analysis (ESEM) with five factors (administrator survey) .............................................................................101 Table 3.2 Fit statistics for models tested in confirmatory factor analysis (administrator survey) .............................................................................101 Table 3.3 Standardized item loadings for confirmatory factor analysis (administrator survey) .............................................................................102 Table 3.4 Correlations among school organizational climate factors (administrator survey) .............................................................................103 Table 3.5 Scale reliabilities (administrator survey) ................................................103 Table 3.6 Factor loadings from exploratory factor analysis (ESEM) with four factors (teacher survey) .......................................................................................104 Table 3.7 Fit statistics for models tested in confirmatory factor analysis (teacher survey) .......................................................................................104 Table 3.8 Standardized item loadings for confirmatory factor analysis (teacher survey) .......................................................................................105 Table 3.9 Correlations among school organizational climate factors (teacher survey)....................................................................................…106 Table 3.10 Scale reliabilities (teacher survey) ..........................................................106

x
Table 3.11 Intercorrelation coefficients (ICCs) for school organizational climate scales from teacher survey .......................................................................106 Table 4.1 Correlation Matrix for Socio-emotional Outcomes .................................147 Table 4.2 Correlation Matrix for School Organizational Climate factors ...............148 Table 4.3 Bivariate Models for School Organizational Climate factors ..................149 Table 4.4 Multilevel Models for Externalizing Behaviors ......................................150 Table 4.5 Multilevel Models for Internalizing Behaviors ........................................152 Table 4.6 Multilevel Models for Social Skills .........................................................154 Table 4.7 Model Variance Components ..................................................................156 Table 5.1 Multilevel Models of Teacher Job Satisfaction from School Organizational Climate ............................................................................191 Table 5.2 Multilevel Models for Socio-emotional Outcomes from Teacher Job Satisfaction ..........................................................................193 Table 5.3 Multilevel Models of Socio-emotional Outcomes from School Organizational Climate Dimensions, with and without teacher job satisfaction ..............................................................................................195
xi
List of Figures Figure 1.1 Conceptual Framework ..............................................................................26

1
Chapter One
Background and Significance

2
Introduction Behavior problems and poor social skills in elementary school can lead to
academic and social difficulties in the early years, and later consequences such as
educational failure, unemployment, psychiatric problems, and criminality (Moffitt, 2006;
Roeser, 2001; Kessler et al., 2005; Schaeffer, 2003). Intervening early is crucial because
social behaviors become more difficult to change as children get older (Caspi et al., 1987;
Loeber, 1990,;Kazdin, 1997). Schools have the potential to exert powerful positive
influences on children’s socio-emotional development. Researchers and policy makers’
recognition of the relationship between socio-emotional and academic outcomes has led
to effective school-based interventions (Kataoka et al.; 2009; Hoagwood et al., 2007), but
many interventions are classroom-based, dependent on teachers’ implementation and
often narrowly focused (NRC & IOM, 2009; Walker et al., 1995). In addition to
structured interventions, there is a need to build on schools’ existing resources and foster
organizational contexts that promote positive psychological development and learning.
A growing body of school-based research seeks to understand and address
system-level factors that can positively shape children’s social and behavioral
competence in a sustainable manner. It is particularly important to identify protective
factors for students at increased risk of poor socio-emotional development, including
those from poor families and those with previous behavior problems. School
characteristics such as the aggregate level of family poverty have been identified as risk
factors for poor socio-emotional outcomes, but compositional factors such as these are
not modifiable (Battistich et al., 1995; Hoglund et al., 2004).

3
This study examined the effects of the school environment, specifically the
organizational climate, on students’ socio-emotional outcomes in fifth grade, a critical
period when students are beginning the transition to adolescence. School organizational
climate differs from student-perceived school climate, and instead refers to staff
perceptions of their work environment. Research in organizational psychology has
demonstrated the importance of one’s work environment on performance and behavior
(Moffitt, 2006). There is evidence that dimensions of the school organizational climate,
particularly leadership and safety, have an impact on academic achievement, primarily
due to the mediating effect of teacher behaviors (Roeser, 2001; Kessler et al., 2005).
However, there is a lack of research examining how the school organizational climate
affects students’ socio-emotional development. As with academic achievement, school
organizational climate is likely to have an impact on students’ socio-emotional outcomes
by affecting how teachers relate to their students.
With an increasing interest in interventions that aim to make school-level changes
to promote students’ development, as well as school and district level surveys that assess
staff perceptions of the school environment, it is important to identify elements of the
school organizational climate that matter most for students’ socio-emotional
development. Additionally, although previous studies have found that schools explain a
relatively small proportion of the variance in students’ outcomes, it may be that for
students who are already at increased risk for mental health problems due to low
socioeconomic status or existing externalizing behavior problems, the school
organizational climate is especially important. Findings from this study highlight the
most important aspects of the school organizational climate for students’ socio-emotional
4
development, helping to inform policies and funding priorities at the school, district, state
and national level.
! The purpose of this study was to first identify dimensions of the school
organizational climate (SOC) using questions in the ECLS-K teacher and administrator
questionnaires, and then to examine the relationship between these dimensions and
students’ socio-emotional outcomes in fifth grade. In order to better understand the
complexities of this relationship, moderation by students’ socioeconomic status and prior
behavior was examined, along with mediation by teacher job satisfaction.
Dissertation Overview
This dissertation includes three separate analytic studies with an overarching
focus on understanding how school organizational climate, a school-level characteristic,
affects individual students’ socio-emotional development in late elementary school.
Chapter One consists of a description of the study aims and hypotheses, background, and
theoretical framework. Chapter Two outlines the research design and methods of the
study, including the sample, measures and analytic methods. Chapters 3 through 5
consist of three manuscripts addressing the study aims. Chapter Three addresses Aim 1:
Identification of School Organizational Climate Constructs in the ECLS-K Using Factor
Analysis. Chapter Four addresses Aim 2: School Organizational Climate and Students’
Socio-emotional Outcomes in Elementary School. Chapter Five addresses Aim 3:
Understanding the Link Between the School Work Environment and Students’ Socio-
Emotional Development: the Role of Teacher Job Satisfaction. Chapter Six provides an

5
overall summary of the three papers, as well as strengths and limitations of the study and
implications for research and practice.
Study Aims and Hypotheses Aim 1: To create a multi-dimensional measure of school organizational climate for elementary schools using third and fifth grade data from the Early Childhood Longitudinal Study, Kindergarten Class of 1998-9 (ECLS-K). Hypothesis 1: The administrator and teacher questionnaires completed by staff in schools involved in the ECLS-K can be used to create a multi-dimensional measure of elementary school organizational climate that has acceptable structural validity and internal consistency. Aim 2: To examine the relationship between dimensions of the school organizational climate and students’ socio-emotional outcomes in fifth grade, and determine if this relationship is moderated by student socio-economic status or behaviors in third grade Hypothesis 2.a: A more positive school organizational climate as perceived by staff is associated with lower levels of externalizing and internalizing behaviors and higher levels of social skills in students. Hypothesis 2.b: Some dimensions of school organizational climate, such as leadership and safety, are more strongly related with students’ externalizing and internalizing behaviors and social skills in fifth grade than other dimensions of school organizational climate. Hypothesis 2.c: For students in families with lower socioeconomic status, there is a stronger relationship between dimensions of the school organizational climate and socio-emotional outcomes in fifth grade than for students in families with higher socioeconomic status. Hypothesis 2.d: For students who report more externalizing behaviors in third grade, there is a stronger relationship between dimensions of the school organizational climate and socio-emotional outcomes in fifth grade. Aim 3: To examine the relationship between school organizational climate and teacher job satisfaction, and determine if teacher job satisfaction mediates the relationship between dimensions of school organizational climate and students’ socio-emotional development.

6
Hypothesis 3.a: Teachers in schools with more positive school organizational climate report higher levels of job satisfaction. Hypothesis 3.b: Higher levels of teacher job satisfaction are associated with lower levels of externalizing and internalizing behaviors and more social skills in students. Hypothesis 3.c: Teacher job satisfaction mediates the relationship between some dimensions of school organizational climate and fifth grade students’ socio-emotional outcomes. Background Socio-emotional outcomes in middle childhood
Middle childhood, the period between early childhood and adolescence, is an
important time in children’s development. It is the period during which children
transition into formal schooling and contexts other than the family, such as school and
peers, become increasingly influential. Development during this time can both alter
detrimental trajectories initiated in early childhood and establish successful trajectories
moving forward into adolescence (Schaffer, 2002).
During this period, children’s cognitive, academic and socio-emotional skills
develop substantially. There are several key elements of socio-emotional development in
middle childhood, including a child’s sense of their own competence, interpersonal
relationships and self-control. Increases in children’s cognitive abilities at this age mean
they are more able to reflect on their capabilities and weaknesses. Changes in self-
concept lead children to begin making social comparisons in that they judge their abilities
and behavior in relation to those of others. Through successful experiences in a range of
settings children can gain a positive sense of self, which is an important component of
children’s social well-being at this age (Eccles, 1999; Guera & Bradshaw, 2008). In

7
addition to a sense of competence, social skills in middle childhood involve positive
interactions with peers and others. During this developmental period, children begin to
spend less time with their parents and more time with peers and other adults. They
become sensitive to what matters to other people and must learn to manage conflicts and
negotiate differences in what is expected by adults and social goals of the peer group
(Eccles, 1999). Through positive interactions with peers and adults, children gain a sense
of connectedness and belonging (Guera & Bradshaw, 1999). Finally, developmental and
neurological changes at this age contribute to increases in self-control, which is
necessary for goal-oriented behavior. This positive social development variables
included in this study include students’ perceptions of their own social competence,
particularly peer relations, as well as teachers’ perceptions of students’ self control and
interpersonal interactions with peers and adults.
Indicators of children’s socio-emotional development include both positive social
skills as well as negative behavior problems. Positive social skills are a crucial
component of children’s ability to successfully interact with and adapt to the demands of
their environments, especially in school. As described above, positive social functioning
in middle childhood includes a sense of competence and self-esteem, as well as the
ability to interact in positive ways with peers and non-parental adults, such as showing
sensitivity to others’ feelings, resolving conflicts, and maintaining friendships (Masten &
Coatsworth, 1995; NRC & IOM, 2009). These social skills promote the achievement of
developmentally appropriate tasks and adaptation to new tasks in different social contexts
(NRC & IOM, 2009; Kellam et al., 1975).
8
Children’s behavioral problems commonly fall into two categories: externalizing
behaviors and internalizing behaviors (Achenbach, 1991; Gumpel, 2010). Externalizing
behaviors are characterized by overactive, impulsive, and aggressive behaviors.
Internalizing behaviors include depressive, anxiety-related symptoms and social
withdrawal (Reynolds, 2010). It is estimated that each year, 20% of American children
and adolescents experience a mental disorder that at least mildly impairs their everyday
functioning, and 5-9% are diagnosed with an emotional disturbance that interferes with
their educational attainment (US DHHS, 1999). Although there are specific disorders and
diagnoses associated with both externalizing and internalizing behaviors, even children
without an identified disorder have an increased risk of mental health problems and
difficulties adjusting (Bukowski and Adams, 2005).
Negative behaviors and positive social skills are interrelated. Social skills can be
protective, with stronger social skills associated with fewer externalizing and
internalizing behaviors (Henricsson and Rydell, 2006). Likewise, externalizing and
internalizing behaviors can inhibit the development of positive social skills. For example,
children with internalizing behaviors such as sadness and anxiety may avoid social
interactions and thus decrease their opportunities for developing interpersonal skills
(Rubin et al., 2003). Children with externalizing behaviors may also be more likely to
draw out negative feedback from others, which can both exacerbate internalizing
symptoms and hamper the development of interpersonal skills (Rudolph et al., 2000). On
the other hand, children who have developed social skills may be better able to manage
their emotional responses and control aggression (Elias & Haynes, 2008).
9
Significance of socio-emotional outcomes in middle childhood
Socio-emotional outcomes in middle childhood can affect a child’s behavioral
development and academic success (Roeser, 2001). Although much of the research
examining predictors of socio-emotional development focuses on early childhood and
early elementary years, late elementary school is a particularly important time to promote
children’s socio-emotional development because of the upcoming transition to middle
school (Farmer, Hall, Petrin, Hamm, & Dadisman, 2010; Juvonen, 2007; Pellegrini,
2002). Socio-emotional competencies enable children to enter middle school better
prepared to navigate the new peer context, which can then influence later school
adjustment (Wentzel, 2005, 2009). As noted above, several characteristics of middle
childhood and late elementary school in particular make this a particularly important time
for socio-emotional development. First, during this developmental period, a growing
number of contexts become important, including peer groups and interactions with non-
parental adults through youth groups, schools, and other activities. Additionally,
increasing cognitive abilities enable self-evaluation and comparison to others. Increasing
academic demands can also affect self-concept and self-esteem. Intervening in middle
childhood is crucial because these internalizing and externalizing behaviors become more
difficult to change as children get older and can become resistant to intervention
(Campbell et al, 2002; Hawkins et al., 2001, Hawkins et al., 2005; Stiles 2000; Walker,
Colvin, & Ramsey, 1995).
Children with externalizing behavior problems are more likely to be less engaged
in school, to do less well academically, and to develop conduct problems (Barriga et al.,

10
2002). Internalizing behaviors in childhood are associated with academic
underachievement and poor problem-solving skills (Kovacs & Devlin, 1998). Poor social
skills and externalizing and internalizing behaviors in childhood can compound over time
and have effects into adulthood, such as increased risk of educational failure,
unemployment, psychiatric problems and criminality (Broidy et al, 2003; Fergusson &
Horwood, 1998; Burt et al., 2008; Nock &and Kazdin, 2002; Roza et al., 2003; Caspi et
al., 1987; Loeber, 1990). Positive social skills children develop in middle childhood are
linked with success in school and other contexts, and there is continuity of positive social
skills from middle childhood into adolescence and adulthood (Ladd & Burgess 1999;
Collins & van Dulman, 2006).
Children with poor social skills and externalizing and internalizing behaviors are
at risk for academic problems for several reasons. Mental health problems are associated
with absenteeism, higher rates of suspension and expulsion, lower grades and test scores,
and high school dropout (Hinshaw et al., 1992; Needham et al., 2004; Reid et al., 2004;
Gutman et al., 2003). Children with negative behaviors may also have difficulty getting
along with peers and teachers and following school rules (Gunter et al., 1993; Gunter et
al.,1994). For example, a student who has difficulty managing anger may be more likely
to be suspended or expelled, and this school absence can have an effect on academic
achievement (Birnbaum et al., 2003).
Factors that influence socio-emotional outcomes in middle childhood
Because socio-emotional skills in middle childhood have important implications
for success in school and other aspects of life, it is important to understand how contexts
in middle childhood affect socio-emotional development. Identification of early risk and

11
protective factors for psychopathology can inform the development of more effective
interventions (Farrington, 2005; Holmes, Slaughter, & Kashani, 2001). Both risk and
protective factors across different contexts and periods of the lifespan influence
children’s mental health. These include individual, family, neighborhood and school
determinants.
At the individual level, genetics, biology, temperament and individual
psychological processes can lead to different levels of social functioning (NRC & IOM,
2009). Although less so in middle childhood than in adolescence, sex is associated with
socio-emotional development. Girls are more likely to exhibit positive social skills, and
boys are more likely to have externalizing behaviors (Birch & Ladd, 1997; Bracken &
Crain, 1994). Also at the individual level, lower level language skills are associated with
internalizing and externalizing behaviors in elementary school (Hamre & Pianta, 2001;
Jimerson et al., 2000). Children’s own characteristics and predispositions can also affect
how other people, such as parents, teachers and peers, relate to them, which can in turn
affect children’s development (Bronfrenbrenner & Ceci, 1994).
Family functioning, including attachment, parenting practices, and parental
mental health, can have independent effects on mental health and interact with
individual-level factors (NRC & IOM, 2009). Lower levels of parental support,
stimulation and involvement, as well as higher levels of maternal depression are
associated with higher levels of externalizing and internalizing behaviors in children
(Ashman et al., 2008; Gross et al., 2008; McCartney et al., 2004; Domina, 2005). Family
dysfunction, particularly child maltreatment, is one of the strongest risk factors for poor
mental health (NRC & IOM, 2009). Parental education is positively associated with social

12
skills and negatively associated with emotional and behavioral problems (Duncan et al.,
1994; Hoglund & Leadbeater, 2004). While family influences are important throughout
childhood, other contexts such as school have an increasing influence in middle
childhood.
Neighborhood factors, such as recreational facilities, quality child care, schools
and health care services, and positive social norms and values, promote positive child
mental health (NRC & IOM, 2009). Conversely, violence, bullying and a lack of positive
resources can lead to poor social outcomes (Sieger et al., 2004). Poverty, which operates
at both the family and neighborhood/school level through a variety of pathways, has a
strong negative effect on children’s mental health. (Nagin &Tremblay, 2001; Keiley et
al., 2003). Many studies have found that exposure to high aggregate levels of poverty (at
both the neighborhood and school levels) are associated with negative effects on
children’s development (Attar et al., 1994; Battistich et al., 1995; Duncan et al., 1994;
Hoglund & Leadbetter, 2004).
Role of schools in children’s socio-emotional development
While there are many factors and contexts that contribute to socio-emotional
development in middle childhood, the role of schools is of particular interest because of
the amount of time children spend in schools, as well the role of schools in socialization.
Schools can be a normative context in which children have the opportunity to receive
supports to help prevent the development of behavior problems (Baker et al, 2008;
Bronfenbrenner,1979), such as through relationships with competent and caring adults
and mastery experiences to build self-efficacy (Masten, 2003). School provides an
optimal environment for children to accomplish developmental tasks such as academic

13
achievement, rule compliance and development of peer relations (NRC & IOM, 2009).
Achievement of these tasks can be affected by school characteristics such as teacher
behavior, organizational health, school connectedness, and family-school relations (NRC
& IOM, 2009). Intervention studies have demonstrated the interconnectedness of
educational and socio-emotional outcomes. For example, a program focused on school
bonding and achievement led to a reduction in risky behavior (Hawkins et al., 1999).
Although schools’ primary focus is on educational outcomes, there has been growing
acknowledgement of the role of schools in promoting positive development of other
youth outcomes, including socio-emotional health (Masten, 2003; Atkins et al., 2010).
Measuring the school organizational climate
Defining the school organizational climate
There is a history of research examining the organizational climate in work
settings. Forehand and Gilmer (1964) described organizational climate as “those
characteristics that distinguish the organization from other organizations and that
influence the behavior of people in the organization.” Reichers and Schneider (1990)
defined organizational climate as “shared perceptions of organizational policies, practices
and procedures, both formal and informal.”
The concept of organizational climate has also been applied to the specific context
of schools. It is important to point out that much research has examined the effect of
“school climate.” Although school climate has been defined in many ways, and has
sometimes included organizational climate, this study specifically examined the effects of
school organizational climate, based on data collected from school staff about their
school work environment. Hoy et al. (1991) defined school organizational climate as
14
“teachers’ perceptions of their work environment; it is influenced by formal and informal
relationships, personalities of participants and leadership in the organization.” (p. 8).
Halpin and Croft (1963) were among the first to study organizational climate in
schools. They developed the Organizational Climate Description Questionnaire (OCDQ)
for elementary schools, which identified important aspects of teacher-teacher and
teacher-principal interactions to measure the “openness of schools.” Items selected for
inclusion in the OCDQ were those that had reasonable consensus among school staff
(Hoy et al., 1991). Parsons (1967) developed a framework for assessing the
organizational well-being of schools based on three levels: technical, managerial, and
institutional.
Sweetland and Hoy drew from these two conceptualizations of the school
organizational environment to develop the Organizational Health Inventory (OHI), one of
the most frequently used instruments for assessing school organizational climate. The
OHI- Elementary School Version (Hoy & Tarter, 1997) includes 37 items that measure
five dimensions: institutional integrity; principal leadership; availability of educational
materials; staff affiliation; and academic emphasis (i.e., student and staff focus on
academics). Another commonly used instrument is the School-Level Environment
Questionnaire (SLEQ), which consists of constructs such as affiliation, innovation,
participatory decision making, resource adequacy and student support (Johnson &
Stevens, 2006). Previous studies have varied greatly in constructs used to define school
organizational climate. Taylor and Tashakkori (1995) identified five dimensions of the
school organizational climate in which some, but not all, overlap with those identified by
Hoy and colleagues: principal leadership, student discipline, faculty collegiality, lack of

15
obstacles to teaching, and faculty communication. Tobin et al. (2006) drew upon
literature in organizational psychology to identify areas associated with effective
employee and organizational performance. They used items selected or adapted from
existing employee surveys to measure the following dimensions of the school
organizational climate: school facilities, academic materials, discipline and safety, staff
collegiality, administrator support of staff, staff coordination, professional development
and job satisfaction. The specific dimensions of school organizational climate examined
in this study were constructed in Aim 1 from items available in the ECLS-K that formed
distinct scales with acceptable measurement properties.
School organizational climate and school composition
It is important to distinguish between school composition and school
organizational climate. School composition is based on characteristics of individuals
aggregated at the school-level. For example, school-level disadvantage is often based on
the percentage of minority and low-income students, or school-level achievement can be
measured by the proportion of students achieving at or above grade-level on standardized
tests. School disadvantage, typically measured by the proportion of children eligible for
free and reduced school meals, has been linked with higher levels of internalizing and
externalizing behaviors in children (Kellam et al., 1998; Battistich et al., 1995; Hoglund
& Leadbetter, 2004). It has been suggested that by concentrating vulnerable children
there is a paucity of competent peers and positive peer interactions (Attar et al., 1994;
Duncan et al., 1994). School composition is less modifiable than school processes and
organization, and therefore was not the focus of this study. However, because previous

16
research has shown a relationship between school composition and students’ socio-
emotional development, it was important to adjust for school composition variables.
Unit of analysis
In addition to varying measurements of the school climate based on reporter, there
is also an issue about whether or not these school characteristics are a property of schools
or only individual-level perceptions. In the school-level theory, each participant is seen as
a separate rater of the same entity, and school characteristics are best measured as the
mean of raters’ responses within the school. The unit is the school and psychometric
analyses should be done at the school level (van Horn, 2003; Sirotnik, 1980). The
individual-level theory suggests that climate is a psychological property of individuals
within the school (Miller and Fredericks, 1990).
Several studies have compared the reliability and validity of individual-level and
school-level conceptualizations of school organizational climate and found more support
for the school-level definition (van Horn, 2003; James et al., 1988; Griffith, 2006). For
example, van Horn (2003) explored teachers’ responses on the elementary school version
of the School Climate Survey and found that the average school climate within each
school predicted a statistically significant amount of between-school variation in
children’s academic achievement and cognitive functioning, but differences between
individual raters within the school were not significantly related to child outcomes. There
was moderate inter-rater reliability among teachers. The school-level concept of school
organizational climate indicates that it is a property of the school experienced by all
participants, but there will be error in ratings due to lack of knowledge, limited
experience, and biases. As previous studies have done, this study examined school

17
organizational climate as a school-level characteristic based on the aggregate value of all
respondents in a school (Johnson, 1996; Ryan et al., 1996).
School organizational climate and socio-emotional outcomes
First, it is important to note that although schools play an increasing role in
children’s development beginning in elementary school, individual and family factors
continue to play a significant role. Past studies have found that schools typically account
for approximately 10% of the variance in students’ outcomes (Wilcox & Clayton, 2001;
Sellstrom & Bremberg, 2006). Although this proportion of variance is relatively small,
identifying important school predictors is still valuable because they tend to be more
malleable than family and individual variables (Rowan et al., 1983). For example,
Bradshaw et al. (2008) found that a school-wide intervention, Positive Behavioral
Interventions and Supports (PBIS), was associated with improvements in school
organizational health. Even if the effects of the school environment on children’s social,
emotional and academic outcomes are modest, they have the potential to exert positive
impacts over a number of years and on entire populations of youth.
Previous research has primarily examined the relationship between student-
reported school climate and socio-emotional outcomes, and shown an association
between students’ perceptions of the school environment and students’ psychological and
behavioral outcomes. Most of this research has been done in middle schools and high
schools, ages at which students are more able to provide reports on their school
environment. Dimensions of the (student-perceived) school environment that have been
shown to be associated with adolescent students’ socio-emotional development include:
teacher support, peer support, student autonomy, and clarity and consistency in school

18
rules (Brand et al., 2003; Kuperminc et al. 1997; Roeser et al. 1998; Way and Robinson
2003; Way et al. 2007). Although much of this research has been cross-sectional, there
have also been longitudinal studies, such as Roeser et al.’s (1998) findings that students’
perceptions of their school environment in seventh grade predicted change over time in
emotional functioning from seventh to eighth grade, after accounting for demographic
characteristics.
Few studies have examined the relationship between the school organizational
climate and students’ socio-emotional outcomes, particularly in elementary school.
Previous studies have found teacher well-being, satisfaction and commitment to be
associated with student drop-out, attendance and disciplinary problems (Brand, 2008;
Denny, 2011; Leblanc et al, 2008; Ostroff, 1992). However, not all of these studies have
used multilevel modeling to account for clustering of students within schools or
sufficiently accounted for other risk factors. School organizational climate may also
mediate the effect of school-level interventions on students’ behaviors, such as was found
by Bradshaw and colleagues (2008). !
Previous research on the school organizational climate has primarily focused on the
effects on students’ academic achievement. For example, school safety, strong principal
leadership, and adequate school resources have all been shown to be associated with
higher levels of student achievement (Borman & Overman, 2004). High academic
standards and a supportive work atmosphere for teachers are also associated with better
achievement, largely due to teachers doing more to promote student learning (Borman &
Overman, 2004). There is some evidence that organizational climate is associated with
student absenteeism and school suspensions (Bevans et al., 2007; Gottfredson etal.,

19
2005). Teacher behaviors, particularly teachers’ interactions with students and the
teacher-student relationship, are also a likely mediator of the relationship between school
organizational climate and students’ socio-emotional outcomes. There is ample evidence
that high-quality teacher-student relationships in elementary school, characterized by
high levels of warmth and closeness and low levels of conflict, are associated with lower
levels of externalizing and internalizing behaviors, and better social skills (Pianta &
Nimetz, 1991; Birch & Ladd, 1998; Henricsson & Rydell, 2004; Maldonado-Carreno &
Votruba-Drzal, 2011). Support for teachers, both from the administration and other
teachers, can increase their ability and commitment to address students’ emotional and
behavioral needs (Cheney et al., 2002)
Interaction between school and individual factors
There is some evidence that students’ poverty level and behaviors moderate
school-level and teacher-level effects on students’ socio-emotional outcomes. In a meta-
analysis of school-based interventions to prevent aggressive behaviors, Wilson and
Lipsey (2007) found that individual students’ socioeconomic status moderated the effect
of universal school programs on students’ outcomes, with the largest effects for children
with low socioeconomic status. For selected/indicated programs, the largest effects were
for children who already exhibited problem behaviors. In cross-sectional research,
Kuperminc et al. (1997, 2001) found a positive school climate to be particularly
beneficial for boys from low-income families. Several longitudinal studies have found
that the beneficial effects of support from school staff and warm and supportive
relationships with teachers are greater among poor youth (Dubois et al., 1992; Dubois et
al., 1994).
20
Teacher job satisfaction and students’ socio-emotional development
Job satisfaction is frequently studied within the field of organizational
psychology. A commonly used definition of job satisfaction comes from Locke (1976),
who defined job satisfaction as “a pleasurable or positive emotional state resulting from
the appraisal of one’s job.” Teachers’ job satisfaction has been identified as an important
outcome because of its links to teacher attrition and retention, motivation, well-being, and
commitment to teaching (Wriqi, 2008; Zembylas & Papanastasiou, 2004).
A variety of sources can influence teacher job satisfaction (Dinham and Scott,
2001) including intrinsic teacher qualities, factors external to the school such as external
evaluation of schools and the status of teachers, and school-based factors, which were the
focus of this study. There is some evidence from previous research that school
organizational climate is associated with teacher job satisfaction. A study of public
schools using data from the national Schools and Staffing Survey found that positive
student behavior and administrative support had significantly positive, small effects on
teacher job satisfaction. Staff collegiality had significantly positive, moderate, and large
effects on teacher job satisfaction (Shen et al., 2012). In a study of high school teachers
using data from the National Educational Longitudinal Study (NELS), principal
leadership, student discipline, and faculty collegiality were all significantly associated
with teacher satisfaction (Taylor and Tashakorri, 1995). Skaalvik et al. (2011) found that
job satisfaction was positively related to supervisory support, relations with colleagues,
and relations with parents and negatively related to discipline problems in a sample of
Norwegian elementary and middle schools. Other research has demonstrated links
between job satisfaction and support from administrators, cooperation with colleagues,

21
support from parents, and student misbehavior and violence (Leithwood & McAdie,
2007; Perie & Baker, 1997, Thornton, 2004). Despite these findings, there is some
inconsistency, including a study of Chinese teachers in which collegial relations were
only weakly related to job satisfaction (Wriqi, 2008).
Previous research in organizational psychology has demonstrated a positive
relationship between job satisfaction and job performance (Judge, Bono, Thoresen, &
Patton, 2001). Most studies examining the link between job satisfaction and job
performance in schools have examined the relationship between teacher job satisfaction
and academic outcomes. There is some evidence that they are connected, although the
effect has generally been small (Johnson et al., 2012). Although previous research has not
examined the link between teacher job satisfaction and socio-emotional outcomes, there
is some evidence that teachers with higher stress levels use more harsh discipline and
spend less time engaging students in a positive manner (Bibou-Nakou, Stogiannidou, &
Kiosseoglou, 1999). A few studies have explored the effects of other teacher
psychosocial factors, such as self-efficacy, burnout and well-being, on socio-emotional
outcomes. For example, Denny et al. (2011) found that in secondary schools where
teachers reported higher levels of well-being, fewer students reported significant levels of
depressive symptoms. Another study found that child care providers who reported higher
levels of depression were less sensitive and more withdrawn than providers who reported
lower levels of depression (Hamre and Pianta, 2004).
Although much of the research examining the link between teacher-student
relationships and students’ outcomes has involved early elementary school students,
Maldonado-Carreno and Votruba-Drzal (2011) found evidence that the quality of the

22
teacher-student relationship was positively associated with lower levels of externalizing
and internalizing behaviors through fifth grade. They also found that the importance of
teacher-child relationship quality did not decline between kindergarten and fifth grade.
Links between school, teacher, and student factors
Although there have been no previous studies examining the relationship between
school organizational climate, teacher job satisfaction and socio-emotional outcomes in
particular, studies examining other measures of organizational climate, employee
satisfaction and student outcomes have found varying types of relationships. For
example, some studies have found no significant direct effect between principal
leadership and student outcomes, but did find an indirect effect on students’ outcomes
through school staff’s job satisfaction (Griffith, 2004; Hallinger et al., 1996; Blasé et al.;
1986; Bossert et al.,1982). Given teachers’ direct interactions with students and the
importance of the teacher-student relationship, particularly in elementary school, it is not
surprising to find this indirect effect even in the absence of a direct effect of leadership.
Similarly, Goddard et al. (2007) concluded that the relationship between teacher
collaboration and student achievement is likely indirect.
Theory and Conceptual Framework
There are several theories and models that provide structure for understanding the
relationship between school organizational climate and students’ socio-emotional
development. Socio-ecological theory places the school in a multi-level framework of
contexts that affect children’s development. Organizational psychology research and
Social Cognitive Theory illuminate the relationship between organizational conditions

23
and organizational effectiveness. Finally, models of risk and resilience demonstrate the
importance of protective factors, such as positive school environments, for the outcomes
of children already at-risk.
The socio-ecological theory suggests that socio-emotional outcomes are affected
by interacting multi-level social contexts, including individual-level factors,
microsystem-level factors (such as family and peers), exo-system level factors (such as
community poverty) and macro system-level factors (e.g. cultural norms and federal
policies). Schools are one of these contexts that influence children’s socio-emotional
health, especially in middle childhood when children tend to spend more time in school
(Bronfenbrenner, 1979). School factors can have significant effects on children’s
emerging perceptions of themselves. Positive school contexts can provide support, and
foster feelings of autonomy and relatedness (Herman et al., 2009). Negative school
contexts characterized by criticism, neglect or rejection can contribute to negative self-
perceptions of competence and relatedness, which can lead to depressive symptoms
(Herman et al., 2009). As demonstrated in the conceptual framework, although schools
can have a significant effect on children’s development, it is important to control for
factors at other levels, such as individual and family, that may also affect children’s
socio-emotional outcomes.
As noted above, organizational psychology research has shown the importance of
working environment on staff satisfaction, interactions, and organizational achievement
(Judge et al., 2001; Tobin et al., 2006; Kopelman et al., 1990). Organizational conditions
such as compensation structure for employees, the level of administrative support, and
employee input and influence into organizational policies has been linked with employee

24
motivation, commitment and turnover (Ingersoll, 2001). School organizational climate
likely has an impact on students’ socio-emotional outcomes by affecting how teachers
relate to students. Social Cognitive Theory has been used to elucidate the relationship
between organizational characteristics and staff behavior and performance. This theory
emphasizes the reciprocal relationship between the reinforcing and punitive aspects of the
organizational environment on employee behaviors, their self-evaluations and the level of
their self-efficacy, all of which influence their everyday behaviors and interactions
(Bandura, 1988). There is evidence that better school organizational climate is associated
with higher levels of teachers’ self-efficacy for managing the challenging aspects of
teaching and managing students and lower levels of staff turnover (Ingersoll, 2001; Tobin
et al., 2006). Thus, self-efficacy and turnover could act as mediators of the relationship
between organizational climate and students’ outcomes.
Compensatory and protective models of risk and resilience indicate that a
combination of environmental risk and protective factors predict outcomes for children
(Fergus and Zimmerman, 2005). In the compensatory model, a protective factor
counteracts or operates in an opposite direction of a risk factor. In the protective model,
assets or resources moderate or reduce the effects of a risk on a negative outcome. These
models suggest that positive school organizational climate may be a protective factor for
children at increased risk of poor socio-emotional outcomes (2005). For example, a
school environment that provides ample opportunity for observing the rewards of actively
using educational resources and careful attention to producing high quality school
assignments may be especially important for poor students who have fewer resources
available in other settings like the home (Luckner, 2011; NICHHD, 2004; NICHHD,

25
2006). Similarly, students with prior behavior problems are more likely to benefit from a
positive school organizational climate in which there are clear expectations and rewards
for pro-social, self-regulated behaviors (Rubin et al., 2006).
Conceptual Framework
The conceptual framework below reflects the multiple contexts that influence
children’s social-emotional development, and highlights the hypothesized relationships
that will be examined in this study, with the bold boxes and bold arrows representing the
primary relationships of interest. Aim 1 will use factor analysis to identify key factors of
the school context, the variables in the box on the far left. The school organizational
climate factors that were identified in Aim 1are listed here. They are the independent
variables for Aim 2. Students’ socio-emotional outcomes, the bold box on the right, are
the outcomes of interest. The primary goal of Aim 2 was to examine the bold horizontal
arrow: the relationship between dimensions of the school organizational climate and
students’ socio-emotional outcomes. The secondary goal was to examine the bold vertical
arrow, whether or not the main relationship is moderated by student-level risk as defined
by SES and previous behavior problems. Aim 3 examined the relationships between
school organizational climate, teacher job satisfaction and students’ socio-emotional
outcomes. Finally, the three additional boxes (school composition, teacher qualifications
and family characteristics) are factors that are also related to children’s socio-emotional
outcomes and were controlled for in the analyses.

26
Figure 1.1 Conceptual Framework

27
References Achenbach, T. M., McConaughy, S. H., & Howell, C. T. (1987). Child/ adolescent
behavioral and emotional problems: Implications of cross- informant correlations for situational specificity. Psychological Bulletin, 101, 213–232.
Achenbach, T. M. (1991). Manual for the child behavior checklist/4–18. Burlington, VT:
University of Vermont Department of Psychiatry. Ashman, S. B., Dawson, G., & Panagiotides, H. (2008). Trajectories of maternal
depression over 7 years: Relations with child psychophysiology and behavior and role of contextual risks. Development and Psychopathology, 20(01), 55–77.
Atkins, M.S., Hoagwood, K.E., Kutash, K., Seidman, E. (2010). Toward the Integration
of Education and Mental Health in Schools. Administration and Policy of Mental Health, 37, 40-47.
Attar, B., Guerra, N., & Tolan, P. (1994). Neighborhood disadvantage, stressful life
events, and adjustment in urban elementary-school children. Journal of Clinical Child Psychology, 23, 391–400.
Baker, J.A., Grant, S., & Morlock, L. (2008). The Teacher-Student Relationship As a
Developmental Context for Children With Internalizing or Externalizing Behavior Problems., School Psychology Quarterly, 23(1), 3-15.
Bandura, A. (1988). Organisational Applications of Social Cognitive Theory. Australian
Journal of Management, 13(2), 275-302. Battistich, V., Solomon, D., Kim, D., Watson, M., & Schaps, E. (1995). Schools as
communities, poverty levels of student populations, and students’ attitudes, motives and performance: A multilevel analysis. American Education Research Journal, 32, 627–658.
Bevans, K., Bradshaw, C., Miech, R., Leaf, P. (2007). Staff- and School-Level Predictors
of School Organizational Health: A Multilevel Analysis. Journal of School Health. 77, 294- 302.
Bibou-Nakou, I., Stogiannidou, A., & Kiosseoglou, G. (1999). The relation between
teacher burnout and teachers’ attributions and practices regarding school behaviour problems. School Psychology International, 20, 209–217.
Birch, S. H., & Ladd, G. W. (1997). The teacher-child relationship and children’s early
school adjustment. Journal of School Psychology, 35(1), 61–79.

28
Birnbaum, A.S., Lytle L.A., Hannan, P.J., Murray, D.M., Perry, C.L., & Forester, J.L.
(2003). School functioning and violent behavior among young adolescents: A contextual analysis. Health Education Research, 18, 389–404.
Blase, J.J., Derick, C. and Strathe, M. (1986). Leadership behavior of school principals in
relation to teacher stress, satisfaction, and performance. Journal of Humanistic Counseling, Education, and Development, 24, 159-71.
Borman, G. D., & Overman, L. T. (2004). Academic resilience in mathematics among
poor and minority students. The Elementary School Journal, 104, 177–195. Bossert, S., Dwyer, D., Rowan, B. and Lee, G. (1982). The instructional management
role of the principal. Educational Administration Quarterly, 18, 34-64. Bracken, B. A., & Craine, R. M. (1994). Children’s and adolescents’ interpersonal
relations: Do age, race, and gender define normalcy? Journal of Psychoeducational Assessment, 12, 14–32.
Brand, S., Felner, R., Shim, M., Seitsinger, A., Dumas, T. (2003). Middle School
Improvement and Reform; Development and Validation of a School Level Assessment of Climate, Cultural Pluralism, and School Safety. Journal of Educational Psychology, 95(3), 570-588.
Brand, S., Felner, R.D., Seitsinger, A., Burns, A., Bolton, N. (2008). A large scale study
of the assessment of the social environment of middle and secondary schools: The validity and utility of teachers’ ratings of school climate, cultural pluralism, and safety problems for understanding school effects and school improvement. Journal of School Psychology, 46: 507-535.
Broidy, L. M., Nagin, D. S., Tremblay, R. E., Brame, B., Dodge, K., Fergusson, D., et al.
(2003). Developmental trajectories of childhood disruptive behaviors and adolescent delinquency: A six site, across national study. Developmental Psychology, 39, 222–245.
Bronfenbrenner, U. (1979). The ecology of human development : Experiments by nature
and design. Cambridge, Mass.: Harvard University Press. Bronfenbrenner, U. & Ceci, S. J. (1994). Nature-nurture reconceptualized in
developmental perspective: A biological model. Psychological Review, 101, 568-586.
Bukowski, W. M., & Adams, R. (2005). Peer relationships and psychopathology:
Markers, moderators, mediators, mechanisms, and meanings. Journal of Clinical Child and Adolescent Psychology, 34, 3–10.

29
Burt, K. B., Obradovic, J., Long, J. D., & Masten, A. S. (2008). The interplay of social
competence and psychopathology over 20 years: Testing transactional and cascade models. Child Development,79, 359–374.
Campbell, F.A., Ramey, C.T., Pungello, E., Sparling, J., Miller-Johnson, S. (2002). Early
Childhood Education: Young Adult Outcomes from the Abecedarian Project. Applied Developmental Science, 6, 42-57.
Caspi, A., Elder, G. H., & Bem, D. J. (1987). Moving against the world: Life-course
patterns of explosive children. Development Psychology, 23, 308– 313. Cheney, D., Osher, T., & Caesar, M. (2002). Providing ongoing skill development and
support for educators and parents of students with emotional and behavioral disabilities. Journal of Child and Family Service, 11:79–89.
De Los Reyes, A. & Kazdin, A.E. Informant Discrepancies in the Assessment of
Childhood Psychopathology: A Critical Review, Theoretical Framework, and Recommendations for Further Study. Psychological Bulletin, 131, 483-509.
Denny, S.J., Robinson, E.M., Utter, J., Fleming, T.M., Grant, S., Milfont, T.L., Crengle,
S., Ameratunga, S.N., Clark, T. (2011). Do Schools Influence Student Risk-taking Behaviors and Emotional Health Symptoms? Journal of Adolescent Health, 48: 259-267.
Dinham, S., & Scott, C. (1998). A three domain model of teacher and school executive
career satisfaction. Journal of Educational Administration, 36, 362-378. Domina, T. (2005). Leveling the home advantage: Assessing the effectiveness of parental
involvement in elementary school. Sociology of Education, 78(3), 233–249. DuBois DL, Felner RD, Brand S, Adan AM, Evans EG. (1992). A prospective study of
life stress, social support, and adaptation in early adolescence. Child Development, 63,542–557.
DuBois DL, Felner RD, Meares H, Krier M. (1994). Prospective investigation of the
effects of socioeconomic disadvantage, life stress, & social support on early adolescent adjustment. Journal of Abnormal Psychology, 103, 511–522.
Dulin, J.M. (2001). Teacher ratings of early elementary students’ social–emotional
behavior. Dissertation Abstracts Inter- national, 61, 3469. Duncan, G., Brooks-Gunn, J., & Klebanov, P. (1994). Economic deprivation and early
childhood development. Child Development, 65, 296–318.
30
Eccles, J.S. (1999). The Development of Children Ages 6 to 14. The Future of Children, 9, 30-44.
Elias, M.J. & Haynes, N.M. (2008). Social Competence, Social Support, and Academic
Achievement in Minority, Low-Income, Urban Elementary School Children. School Psychology Quarterly, 23(4), 474-495.
Farmer, T. W., Hall, C. M., Petrin, R., Hamm, J. V., & Dadisman, K. (2010). Evaluating
the impact of a multicomponent intervention model on teachers' awareness of social networks at the beginning of middle school in rural communities. School Psychology Quarterly, 25, 94−106.
Farrington, D. P., & West, D. J. (1993). Criminal, penal and life histories of chronic
offenders: Risk and protective factors and early identification. Criminal Behaviour and Mental Health, 3, 492-523.
Fergusson, D.M. & Horwood, L. J. (1998). Early conduct problems and later
opportunities. Journal of Child Psychology and Psychiatry, 39, 1097-1108. Fergus, S. & Zimmerman, M.A. (2005).Adolescent Resilience: A Framework for
Understanding Healthy Development in the Face of Risk. Annual Review of Public Health, 26, 399-419.
Forehand, G. A., Gilmer, B. V. H. (1964), “Environmental variation in studies of
organizational behaviour”, Psychological Bulletin, Vol. 62, No. 6, pp. 361-382. Goddard, Y.L., Goddard, R.D., Tschannen-Moran, M. A. (2007). Theoretical and
Empirical Investigation of Teacher Collaboration for School Improvement and Student Achievement in Public Elementary Schools. Teachers College Record, 109 (4), 877-896.
Gottfredson, G. D., Gottfredson, D. C., Payne, A. A., & Gottfredson, N. C. (2005).
School climate predictors of school disorder: Results from a national study of delinquency prevention in schools. Journal of Research in Crime and Delinquency. 42, 412–444.
Griffith, J. (2006). A Compositional Analysis of the Organizational Climate-Performance
Relation: Public Schools as Organizations. Journal of Applied Social Psychology, 36 (8), 1848-1880.
Griffith, J. (2004). Relation of principal transformational leadership to school staff job
satisfaction, staff turnover and school performance. Journal of Educational Administration, 42, 333-356.

31
Grills, A. E., & Ollendick, T. H. (2002). Issues in parent–child agreement: The case of structured diagnostic interviews. Clinical Child and Family Psychology Review, 5, 57–83.
Gross, H., Shaw, D., & Moilanen, K. (2008). Reciprocal associations between boys’
externalizing problems and mothers’ depressive symptoms. Journal of Abnormal Child Psychology, 36(5), 693–709.
Guerra, N. G., & Bradshaw, C. P. (2008). Linking the prevention of problem behaviors
and positive youth development: Core competencies for positive youth development and risk prevention. In N. G. Guerra & C. P. Bradshaw (Eds.), Core competencies to prevent problem behaviors and promote positive youth development. New Directions for Child and Adolescent Development, 122, 1–17.
Gumpel, T.P. & Sutherland, K.S. (2010). The relation between emotional and behavioral disorders and school-based violence. Aggression and Violent Behavior. 15, 349-356. Gunter, P. L., Denny, R. K., Jack, S. L., & Shores, R. E. (1993). Aversive stimuli in
academic interactions between students with serious emotional disturbance and their teachers. Behavioral Disorders, 18(4), 265−274.
Gunter, P. L., Denny, R. K., Shores, R. E., & Reed, T. M. (1994). Teacher escape,
avoidance, and counter control behaviors: Potential responses to disruptive and aggressive behaviors of students with severe behavior disorders. Journal of Child and Family Studies, 3(2), 211−223
Gutman, L. M., Sameroff, A. J., & Cole, R. (2003). Academic growth curve trajectories
from 1stgrade to 12th grade: Effects of multiple social risks and preschool child factors. Developmental Psychology, 39, 777-790.
Hallinger, P., Bickman, L. and Davis, K. (1996). School context, principal leadership,
and student reading achievement. The Elementary School Journal, 96, 527-49. Halpin, A. W., & Croft, D. B. (1963). The organizational climate of schools. Chicago:
Midwest Administration Center of the University of Chicago. Hamre, B. K., & Pianta, R. C. (2001). Early teacher-child relationships and the trajectory
of children’s school outcomes through eighth grade. Child Development, 72(2), 625–638.
Hamre, B.K. & Pianta, R.C. (2004). Self-reported depression in nonfamilial caregivers:
prevalence and associations with caregiver behavior in child-care settings. Early Childhood Research Quarterly, 19, 297-318.

32
Hawkins, J.D., Catalano, R.F., Kosterman, R., Abbott, R., Hill, K.G. (1999). Preventing Adolescent Health-Risk Behaviors by Strengthening Protection During Childhood. Archives of Pediatric and Adolescent Medicine, 153, 226-234.
Hawkins, J.D., Guo, J., Hill, K.G., Battin-Parson, S., Abbott, R.D. (2001). Long-term
Effects of the Seattle Social Development Intervention on School Bonding Trajectories. Applied Developmental Science, 5, 225-36.
Hawkins, J.D., Kosterman, R., Catalano, R.F., Hill, K.G., Abbott, R.D. (2005).
Promoting Positive Adult Functioning through Social Development Intervention in Childhood. Archives of Pediatrics and Adolescent Medicine, 159, 5-31.
Henricsson, L. & Rydell, A.M. (2006). Children with behavior problems: the influence of
social competence and social relations on problem stability, school achievement and peer acceptance across the first six years of schools. Infant and Child Development, 15(4), 347-366.
Herman, K.C., Reinke, W.M., Parkin, J., Traylor, K.B., Agarwal, G. (2009). Childhood
Depression: Rethinking the Role of the School. Psychology in the Schools,46, 5, 433-446.
Hinshaw SP. (1992) Academic underachievement, attention deficits, and aggression:
comorbidity and implications for intervention. Journal of Consulting and Clinical Psychology, 60:893–903,
Hoagwood KE, Serene Olin S, Kerker BD, Kratochwill TR, Crowe M, Saka N. (2007).
Empirically based school interventions targeted at academic and mental health functioning. Journal of Emotional and Behavioral Disorders, 15, 66–92.
Hoglund, W.L. & Leadbeater, B.J. (2004). The Effects of Family, School and Classroom
Ecologies on Changes in Children’s Social Competence and Emotional and Behavioral Problems in First Grade. Developmental Psychology, 40(4), 533-544.
Holmes, S. E., Slaughter, J. R., & Kashani, J. (2001). Risk factors in childhood that lead
to the development of conduct disorder and antisocial personality disorder. Child Psychiatry and Human Development, 31, 183-193
Hoy, W.K., Tarter, C.J., Kottkamp, R.B. (1991). Open Schools/Healthy Schools:
Measuring Organizational Climate. Beverly Hills, CA: Sage Publications. Hoy WK, Tarter CJ. (1997). The Road to Open and Healthy Schools: A Handbook for
Change, Elementary Edition. Thousand Oaks, CA: Corwin Press. Ingersoll, R.M. (2001). Teacher Turnover, Teacher Shortages and the Organization of
Schools. Center for the Study of Teaching and Policy.

33
James, L. R., Joyce, W. F., & Slocum, J. W. (1988). Organizations do not cognize.
Academy of Management Review, 19(1), 129-132. Jimerson, S., Egeland, B., Sroufe, L. A., & Carlson, E. (2000). A prospective,
longitudinal study of high school dropouts: Examining multiple predictors across development. Journal of School Psychology, 28(6), 525–549.
Johnson, J. W. (1996). Linking employee perceptions of service climate to customer
satisfaction. Personnel Psychology, 49(4), 831-851. Judge, T. A., Thorensen, C. J., Bono, J. E., & Patton, G. K. (2001). The job satisfaction-
job performance relationship: A qualitative and quantitative review. Psychological Bulletin, 127(3), 376-407.
Juvonen, J. (2007). Reforming middle schools: Focus on continuity, social connected-
ness, and engagement. Educational Psychologist, 42, 197−208. Kellam, S.G., Branch, J.D., Agrawal, K.C., and Ensminger, M.E. (1975). Mental Health
andGoing to School: The Woodlawn Program of Assessment, Early Intervention, and Evaluation. Chicago, IL: University of Chicago Press. (Cited in Preventing Mental, Emotional, and Behavioral Disorders Among Young People: Progress and Possibilities, 2009.
Kellam, S. G., Ling, X., Merisca, R., Brown, C. H., & Ialongo, N. (1998). The effect of
the level of aggression in the first grade classroom on the course and malleability of aggressive behavior into middle school. Development and Psychopathology, 10, 165–185.
Kataoka, S.H., Rowan, B., & Hoagwood, K.E. (2009). Bridging the Divide: In Search of
Common Ground in Mental Health and Education Research and Policy. Psychiatric Services, 60: 1510-1515.
Kazdin, A. E. (1997). Conduct disorder across the life-span. In S. Luthar, J. A. Burack,D.
Cicchetti, & J. R. Weisz (Eds.), Developmental psychopathology: Perspectives on adjustment, risk, and disorder (pp. 248–272). New York: Cambridge University Press.
Keiley, M. K., Lofthouse, N., Bates, J. E., Dodge, K. A., & Pettit, G. S. (2003).
Differential risks of covarying and pure components in mother and teacher reports of externalizing and internalizing behavior across ages 5 to 14. Journal of Abnormal Child Psychology, 31(3), 267–283.

34
Kessler, R., Berglund, P., Demler, O., Jin, R., & Walters, E. E. (2005). Lifetime prevalence and age-of-onset distributions of DSM-IV disorders in the national comorbidity survey replication. Archive of General Psychiatry, 62, 593-602.
Kokkinos, C.M., Panayiotou, G., Dvazoglou, A.M. (2005). Correlates of Teacher
Appraisals of Student Behaviors. Psychology in the Schools, 42(1), 79-89. Kopelman, R. E., Brief, A. P., & Guzzo, R. A. (1990). The role of climate and culture in
productivity. In B. Schneider (Ed.), Organizational climate and culture (pp. 282-318). San Francisco: Jossey-Bass.
Kuperminc, G., Leadbeater, B. J., Emmons, C., & Blatt, S. J. (1997). Perceived school
climate and problem behaviors in middle school students: The protective function of a positive educational environment. Journal of Applied Developmental Science.,1, 76–88.
Kuperminc, G.P., Leadbeater, B.J., & Blatt, S.J. (2001). School social climate and
individual differences in vulnerability to psychopathology among middle school students. Journal of School Psychology, 39(2), 141-159.
LeBlanc, L., Swisher, R., Vitaro, F., Tremblay, R.E. (2008). High School Social Climate
and Antisocial Behavior: A 10 Year Longitudinal and Multilevel Study. Journal of Research on Adolescence, 18(3), 395-419.
Leithwood, K., & McAdie, P. (2007). Teaching working conditions that matter.
Education Canada, 47(2), 42–45. Locke, E.A. (1976), “The nature and causes of job satisfaction”, in Dunnette, M.D. (Ed.),
Handbook of Industrial and Organizational Psychology, Rand McNally, Chicago, IL, pp. 1297-343.
Loeber, R. (1990). Developmental and risk factors of juvenile antisocial behavior and
delinquency. Clinical Psychology Review, 10, 1–42. Luckner, A.E. and Pianta, R.C. (2011).Teacher-student interactions in fifth grade
classrooms: Relations with children’s peer behavior. Journal of Applied Developmental Psychology. 32: 257-266.
Maldonado-Carreno, C. and Votruba-Drzal, E. (2011). Teacher-Child Relationships and
the Development of Academic and Behavioral Skills During Elementary School: A Within- and Between-Child Analysis. Child Development, 82(2): 601-616.
Masten, A.S., and Coatsworth, J.D. (1995). Competence, resilience, and
psychopathology. In D. Cicchetti and D.J. Cohen (Eds.), Developmental Psychopathology: Risk, Disorder, and Adaptation (vol. 2, pp. 715-752). New

35
York: Wiley. (Cited in Preventing Mental, Emotional, and Behavioral Disorders Among Young People: Progress and Possibilities, 2009).
Masten, A.S. (2003). Commentary: Developmental Psychopathology as a Unifying
Context for Mental Health and Education Models, Research, and Practice in Schools. School Psychology Review, 32(2), 169-173.
Mesman, J., & Koot, H. M. (2001). Early preschool predictors of preadolescent
internalizing and externalizing DSM-IV diagnoses. Journal of the American Academy of Child and Adolescent Psychiatry, 40(9), 1029–1036.
McCartney, K., Owen, M. T., Booth, C. L., Clarke-Stewart, A., & Vandell, D. L. (2004).
Testing a maternal attachment model of behavior problems in early childhood. Journal of Child Psychology and Psychiatry, 45(4), 765–778.
Miller, S. I., & Fredericks, J. (1990). The false ontology of school climate effects.
Educational Theory, 40(3), 333-342. Moffitt, T. E. (2006) Life-course-persistent versus adolescent-limited antisocial behavior.
In D. Cicchetti & D. Cohen (Eds.), Developmental psychopathology (2nd ed., Vol. 1, pp. 570-598). Hoboken, NJ: John Wiley & Sons.
Nagin, D. S., & Tremblay, R. E. (2001). Analyzing developmental trajectories of distinct
but related behaviors: A group-based method. Psychological Methods, 6(1), 18–34.
National Research Council and Institute of Medicine. (2009). Preventing Mental,
Emotional, and Behavioral Disorders Among Young People: Progress and Possibilities. Committee on the Prevention of Mental Disorders and Substance Abuse Among Children, Youth, and Young Adults: Research Advances and Promising Interventions. Mary Ellen O’Connell, Thomas Boat, and Kenneth E. Warner, Editors. Board on Children, Youth, and Families, Division of Behavioral and Social Sciences and Education. Washington, DC: The National Academies Press.
National Institute of Child Health and Human Development, Early Child Care Research
Network. (2004). Trajectories of physical aggression from toddlerhood to middle childhood. Monographs of the Society for Research in Child Development, 69(4):1−146.
National Institute of Child Health and Human Development, Early Child Care Research
Network (2006). The relations of classroom contexts in the early elementary years to children's classroom and social behavior. In A. Huston & M.N. Ripke (Eds.), Developmental contexts in middle childhood (pp. 217−236). New York, NY: Cambridge University Press.
36
Needham B, Crosnoe R, Muller C. (2004) Academic failure in secondary school: the
interrelated role of health problems and educational context. Social Problems, 51:569–586,
Nicholson, J. M., McFarland, M. L., & Oldenburg, B. (1999). Detection of child mental
health problems in the school setting. The Australian Educational and Developmental Psychologist, 16(1), 66–77.
Nock, M. K., & Kazdin, A. E. (2002). Examination of affective, cognitive, and
behavioral factors and suicide-related outcomes in children and young adolescents. Journal of Clinical Child & Adolescent Psychology, 31(1), 48.
Pellegrini, A. D. (2002). Bullying, victimization, and sexual harassment during the
transition to middle school. Educational Psychologist, 37, 151−163. Perie, M., & Baker, D. P. (1997). Job satisfaction among America’s teachers: Effects of
workplace conditions, background characteristics, and teacher compensation (NCES 97-471). Washington, DC: U.S. Government Printing Office.
Pianta, R. C., & Nimetz, S. L. (1991). Relationships between children and teachers:
Associations with classroom and home behavior. Journal of Applied Developmental Psychology,12(3): 379–393.
Reichers, A. E., & Schneider, B. (1990). Climate and culture: An evolution of constructs.
In B. Schneider (Ed.), Organizational climate and culture (pp. 5-39). San Francisco: Jossey-Bass.
Reynolds, M.R., Sander, J.B. & Irvin, M.J. (2010). Latent Curve Modeling of
Internalizing Behaviors and Interpersonal Skills Through Elementary School. School Psychology Quarterly. 25(4), 189-201.
Reid R, Gonzalez J, Nordness P, et al. (2004) A meta-analysis of the academic status of
students with emotional/behavioral disturbance. Journal of Special Education, 38:130–143.
Richters, J. E. (1992). Depressed mothers as informants about their children: A critical
review of the evidence for distortion. Psychological Bulletin, 112, 485–499. Roeser, R. W., & Eccles, J. S. (1998). Adolescents’ perceptions of middle school:
Relation to longitudinal changes in academic and psychological adjustment. Journal of Research on Adolescence. 8:123–158.
Roeser, R. W. (2001). To cultivate the positive…introduction to the special issue on
schooling and mental health issues. Journal of School Psychology, 39, 99-110.

37
Rowan, B., Bossert, S. T., & Dwyer, D. C. (1983). Research on effective schools: A
cautionary note. Educational Researcher, April, 24–31. Roza, S. J., Hofstra, M. B., van der Ende, J., & Verhulst, F. C. (2003). Stable prediction
of mood and anxiety disorders based on behavioral and emotional problems in childhood: A 14-year follow-up during childhood, adolescence, and young adulthood. American Journal of Psychiatry, 160(12), 2116–2121.
Rubin, K., Burgess, K., Kennedy, A., & Stewart, S. (2003). Social withdrawal and
inhibition in childhood. In E. J. Mash & R. A. Barkley (Eds.), Child Psychopathology (2nd ed., pp. 372–406). New York, NY: Guilford Press.
Rudolph, K. D., Hammen, C., Burge, D., Lindberg, N., Herzberg, D., & Daley, S. D.
(2000). Toward an interpersonal life-stress model of depression: The developmental context of stress generation. Development and Psychopathology, 12, 215–234.
Ryan, A. M., Schmit, M. J., & Johnson, R. (1996). Attitudes and effectiveness:
Examining relations at an organizational level. Personnel Psychology,49, 853-882.
Schaeffer, C., Petras, H., Ialongo, N., Poduska, J., & Kellam, S. (2003). Modeling growth
in boys’ aggressive behavior across elementary school: Links to later criminal involvement, conduct disorder, and antisocial personality disorder. Developmental Psychology, 3, 1020-1035.
Sellstrom, E. & Bremberg, S. Is there a “school effect” on pupil outcomes? A review of
multilevel studies. Journal of Epidemiology and Community Health, 60, 149-155. Shen, J., Leslie, J.M., Spybrook, J.K., Ma, X. (2012). Are Principal Background and
School Process Related to Teacher Job Satisfaction? A Multilevel Study Using Schools and Staff Survey 2003-04. American Educational Research Journal, 49(20), 200-230.
Sieger, K., Rojas-Vilches, A., McKinney, C., & Renk, K. (2004). The effects and
treatment of community violence in children and adolescents: What should be done? Trauma, Violence and Abuse, 5, 243–259.
Sirotnik, K. A. (1980). Psychometric implications of the unit-of-analysis problem.
Journal of Educational Measurement,17, 245-282. Skaalvik, E.M. & Skaalvik, S. (2011). Teacher job satisfaction and motivation to leave
the teaching profession: Relations with school context, feeling of belonging, and emotional exhaustion. Teaching and Teacher Education, 27, 1029-1038.
38
Stile, J. (2000). Neural Plasticity and Cognitive Development. Developmental
Neuropsychology, 18, 237-72. Taylor, D.L. & Tashakkori, (1995). A. Decision participation and school climate as
Predictors of job satisfaction and teachers sense of efficacy. Journal of Experimental Education, 63(3), 217–230.
Thornton, H. J. (2004). What can we learn about retaining teachers from PDS teachers’
voices? Middle School Journal,35(4), 5–12. Tobin, T.J., Muller, R.O. & Turner, L.M. (2006). Organizational learning and climate as
predictors of self-efficacy. Social Psychology of Education, 9, 301-319. United States Department of Health and Human Services. (1999). Mental Health: A
Report of the Surgeon General—Executive Summary. Rockville, MD: U.S. Department of Health and Human Services, Substance Abuse and Mental Health Services Administration, Center for Mental Health Services, National Institutes of Health, National Institute of Mental Health. Retrieved August 15, 2011, from http://www.surgeongeneral.gov/library/mentalhealth/summary.htm
van Horn, M.L. (2003). Assessing the Unit of Measurement for School Climate through
Psychometric and Outcome Analyses of the School Climate Survey. Educational and Psychological Measurement, 63(6), 1002-1019.
Walker, H. M., Colvin, G., & Ramsey, E. (1995). Antisocial behavior in school:
Strategies and best practices. Pacific Grove, CA: Brooks/Cole. Way, N. & Robinson, M. G. (2003). Effects of perceived family, friends, and school
experiences on change in self-esteem among urban, low-SES adolescents. Journal of Adolescent Research,18, 324–346.
Way, N., Reddy, R., Rhodes, J. (2007). Students’ Perceptions of School Climate During
the Middle School Years: Associations with Trajectories of Psychological and Behavioral Adjustment. American Journal of Community Psychology.40, 194-213.
Wentzel, K. R. (2005). Peer relationships, motivation, and academic performance at
school. In A. Elliot & C. Dweck (Eds.), Handbook of competence and motivation (pp. 279−296). New York, NY: Guilford Press.
Wentzel, K. R. (2009). Peers and academic functioning at school. In K. H. Rubin, W. M.
Bukowski, & B. Laursen (Eds.), Handbook of peer interactions, relationships, and groups (pp. 531−547). New York, NY: Guilford Press.
39
Wilcox, P., & Clayton, R. R. (2001). A multilevel analysis of school-based weapon possession. Justice Quarterly, 18, 509–541.
Wilson, S. J., & Lipsey, M. W. (2007). School-based interventions for aggressive and
disruptive behavior: Update of a meta-analysis. American Journal of Preventive Medicine, 33(Suppl. 2 S), 130−143.
Wriqi, C. (2008). The structure of secondary school teacher job satisfaction and its
relationship with attrition and work enthusiasm. Chinese Education and Society, 40(5), 17-31.
Zembylas, M., & Papanastasiou, E. (2004). Job satisfaction among school teachers in
Cyprus. Journal of Educational Administration, 42, 357-374 !
40
Chapter Two
Research Design and Methods

41
Study Design
For this study, data from two waves of a prospective cohort study were used to
examine the relationship between school-level organizational climate and individual
students’ socio-emotional outcomes. In Aim 1 (Chapter 3), school-level measures of
school organizational climate were identified. Then the relationship between the
identified climate measures and students’ socio-emotional outcomes in fifth grade was
examined, controlling for third grade socio-emotional functioning (Aim 2, Chapter 4).
Also in Aim 2, this main relationship was further investigated by examining the potential
moderating effects of students’ socio-economic status and prior problem behaviors. For
Aim 3, mediation by teacher job satisfaction was examined. The present chapter
describes the methods used in the three analytic papers in this dissertation, including the
sample, data collection methods, measures, and analytic methods.
Study Sample
ECLS-K overview and study design
Data for this study is from the Early Childhood Longitudinal Study-Kindergarten
Class (ECLS-K), which is maintained by the National Center for Education Statistics
(NCES). The ECLS-K selected a nationally representative sample of kindergarten
students in the fall of 1998 and followed those students through eighth grade
(Tourangeau et al., 2009). Children in the study represent diverse socioeconomic and
racial/ethnic backgrounds and were selected from public and private, and both half- and
full-day, kindergarten classes. Additional children were selected in the fall of 1999 to

42
make the sample representative of all first graders. In first grade, only a subsample of
students who had transferred from their kindergarten school was followed. This was also
true in third grade, but the subsampling rate was slightly higher. In the fifth grade, the
following groups of children were not included: those who had become ineligible due to
death or moving out of the country, those who had been subsampled out in previous
rounds because they had moved, children whose parents refused to participate, children
eligible for third-grade data collection for whom there were neither first-grade or third-
grade data. Children were followed through eighth grade, with data collection occurring
in the fall and spring of kindergarten, the fall and spring of first grade, and the spring
only of third grade, fifth grade and eighth grade. Data were collected from parents,
teachers, principals, students, student record abstracts and direct assessments of children.
The sample was selected using a multistage probability sample design, beginning
with 100 primary sampling units (counties or groups of counties), then 1,280 schools, and
finally 22,666 students. The probability of school selection was proportional to a
weighted measure of size based on the number of kindergarteners enrolled. Public and
private schools were distinct sampling strata. Schools were sorted within each stratum to
achieve sample representation across other characteristics. The initial sample of
kindergarten students included approximately 953 public schools and 460 private
schools. Within each school, there were two sampling strata: one for Asian and Pacific
Islanders (API) and the other for all other students. Asian and Pacific Islanders were the
only subgroup that was oversampled. Students were selected using equal probability
systematic sampling within each stratum, with a higher rate for API students. The target
number of children per school was 24.

43
Sample selection for this study
This study used data collected during the third and fifth grade waves of the ECLS-
K. The sample was restricted to children in ECLS-K who attended the same school for
third and fifth grade. This criterion is necessary so that the school context, the predictor
of interest, remained constant for both points of data collection. The sample included
students who attended both public and private schools. Table 2.1 provides a comparison
of the study sample and all fifth graders in the ECLS-K.
Table 2.1 Comparison of Full Fifth Grade Sample and Analytic Sample
All 5th Graders (N=11,820)
Analytic Sample (N=9,173)
Female 49.4% 49.7% Race
White 57.0% 58.5% Black 11.4% 10.6% Hispanic 19.0% 18.2% Asian 6.9% 7.0% Other 6.7% 5.7% SES
First Quintile 16.4% 15.3% Second Quintile 18.4% 17.9% Third Quintile 19.0% 19.2% Fourth Quintile 22.2% 22.3% Fifth Quintile 24.0% 25.3% Teacher-Reported Behaviors
Externalizing Behaviors (SD) 1.64 (0.58) 1.64 (0.58) Internalizing Behaviors (SD) 1.63 (0.54) 1.63 (0.54) Social Skills (SD) 3.15 (0.59) 3.15 (0.59) Self-Reported Behaviors
Externalizing Behaviors (SD) 1.83 (0.65) 1.82 (0.64) Internalizing Behaviors (SD) 2.04 (0.63) 2.03 (0.62) Social Skills (SD) 2.99 (0.60) 3.00 (0.60)
44
Although the two samples are very similar, the analytic sample consists of slightly
more White students and fewer minority students. The analytic sample also has more
students from families in the two highest socio-economic status quintiles. The mean
scores for teacher and child reported behaviors are nearly identical across the two groups
Sampling Weights
It is important to note that sampling weights were not used in this study. School
weights were only provided in the base year of the ECLS-K, so schools to which students
transferred after kindergarten were not assigned a sampling weight. Because it is
necessary to use weights at all levels of multi-level regression, it was not possible to use
only the child weight. For this reason, the decision was made to conduct the analyses
without sampling weights. Unweighted data represent only those in the sample; without
weights the findings are not representative of the target population. For this reason, it is
not possible to conclude that the findings generalize to all students who began
kindergarten in the United States in 1998. However, the diversity of the sample still
allows for good generalizability.
Data Collection
This study used data collected in the spring of the third and fifth grade years from
multiple sources, including parent interviews, self-administered teacher questionnaires,
teacher assessments of children, self-administered principal questionnaires, child
assessments, third-party observations, and student records. Table 1 lists the completion
rates for these instruments in both third and fifth grade.
45
Information about the home environment and demographic characteristics comes
from parent interviews, which were computer assisted interviews conducted by
telephone. A small percentage (fewer than five percent) were conducted in person for
respondents who did not have a telephone. Although interviews were primarily done in
English, there were resources to conduct interviews in other languages such as Spanish.
The preferred respondent for the family interview was the respondent from the previous
round. If this person was not available, the order of preference was: (1) the child’s
mother, (2) another parent or guardian, or (3) some other adult household member. For
data collection in the fifth grade, 91% of respondents were the same as the respondent in
the third grade. In 81% of cases the respondent was the mother, and in 8% it was the
father. Other adults, usually grandparents, completed the remaining 11% of parent
interviews.
Teachers completed self-administered questionnaires that assessed school and
classroom characteristics, instructional practices, and teacher background. Teachers also
completed individual assessments for each child in the study. For third grade, each
sampled child’s regular classroom teacher, the one who taught them the majority of the
day, completed the teacher questionnaires. In the fifth grade, each sampled child’s
reading teacher and either their math or science teacher completed the questionnaires.
The regular classroom teacher in third grade, as well as the reading teacher in fifth grade,
completed the Social Rating Scale (SRS) about children’s social skills and behaviors, as
well as child-specific instructional information such as the child’s grade and additional
services the child received.

46
The principal of the school attended by the sampled child completed the school
administrator questionnaire in the spring of third and fifth grade. This questionnaire
included questions about the school, student body, teachers, school policies and the
administrator’s background. Although a designee could complete the sections containing
factual information about the school and programs offered, the principal was asked to
complete the sections about their background and the school climate.
In third and fifth grade, children completed the Self-Description Questionnaire
(SDQ) , which included questions about their own socio-emotional development. These
were administered to students one-on-one, and assessors read the SDQ questions to each
child to ensure reading abilities did not affect their responses.
For each year of data collection (third and fifth grade), field staff completed the
school facilities check list, which included information about the school and
neighborhood environment. School staff completed the student records abstract form,
which included information about each sampled child’s attendance and Individualized
Educational Plan (IEP), if applicable.
Table 2.2 Child-level completion rates for children with a scorable reading, math or science assessment, by survey instruments (full sample) Survey Instrument Third Grade Fifth grade Weighted Unweighted Weighted Unweighted Child Assessment 99.2 99.8 99.5 99.9 Parent interview 85.9 87.4 91.9 92.7 School administrator questionnaire 79.4 82.6 93.0 96.0 Facilities check list 93.3 95.3 95.3 97.9 Student records abstract 83.6 85.6 85.2 88.8 Teacher-level questionnaire 77.0 81.0 93.0 96.0 Reading teacher questionnaire N/A N/A 92.9 95.8 Math teacher questionnaire N/A N/A 92.3 95.4 Science teacher questionnaire N/A N/A 92.4 95.3 Sources: Third Grade Methodology Report (Tourangeau et al., 2004) & Fifth Grade Users Manual (Tourangeau et al., 2006)

47
Instruments Teacher Social Rating Scale (SRS)
Teachers rated individual students’ social development using the Social Rating
Scale (SRS). The SRS used in the ECLS-K was adapted from the Social Skills Rating
Scale: Elementary Scale A (SSRS) (Gresham and Elliott,1990), which is a reliable and
valid measure of children’s social development (Demaray et al., 1995). Exploratory
factor analyses were used to provide evidence of the validity of teacher SRS scales with
this sample (Pollack et al., 2005). The split-half reliabilities for the SRS scales are all
above 0.70, as shown in Table 2.3. The items were rated on a four-point scale: 1(student
never exhibits behavior), 2 (student exhibits this behavior occasionally or sometimes), 3
(student exhibits this behavior regularly but not all the time), and 4(student exhibits this
behavior most of the time), as well as an option for “No opportunity to observe this
behavior.” The 26 items formed five scales. Three of the scales measure positive social
outcomes, and two measure problem behaviors. The scale score is the mean rating on the
items included in the scale. Scale scores were only computed if the student was rated on
at least two-thirds of the items in that scale. Three of the five scales will be used in this
study:
• Peer Relations scale (Combination of Interpersonal Skills and Self-Control
scales): consists of nine items that rate the child’s skill in forming and
maintaining friendships, getting along with people who are different, comforting
or helping other children, expressing feeling, ideas and opinions in positive ways,
and showing sensitivity to the feelings of others and four items that measure the
child’s ability to control behavior by respecting the property rights of others,
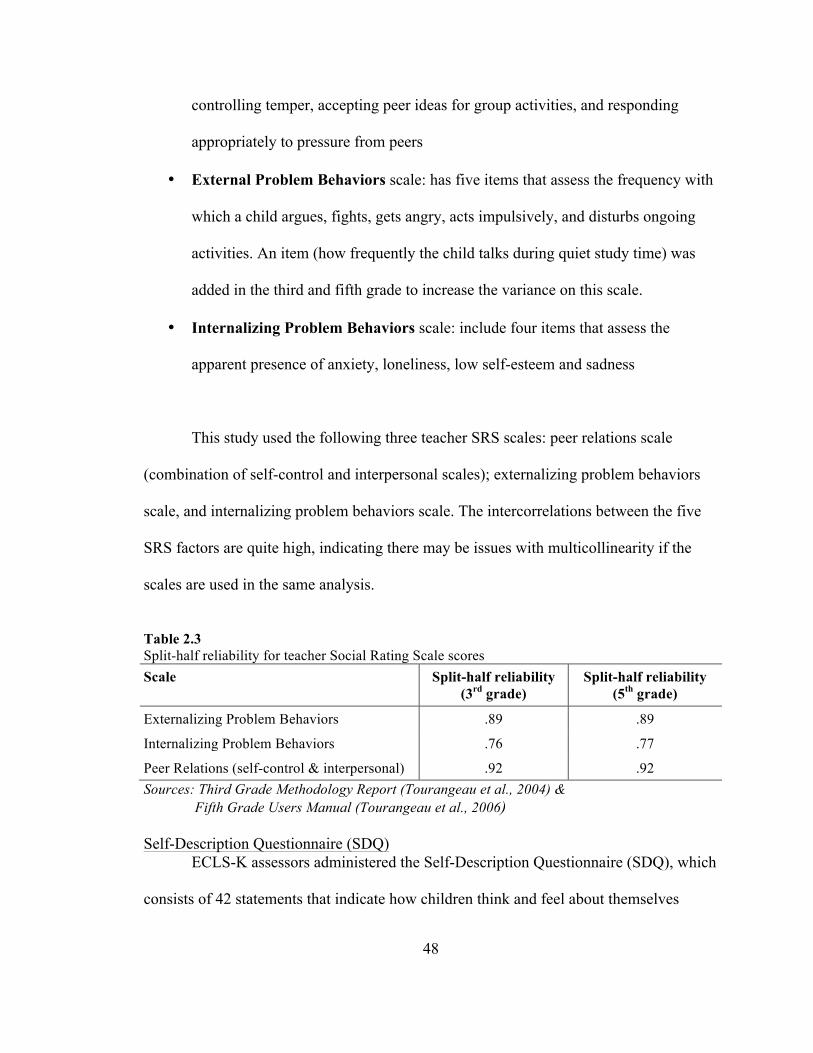
48
controlling temper, accepting peer ideas for group activities, and responding
appropriately to pressure from peers
• External Problem Behaviors scale: has five items that assess the frequency with
which a child argues, fights, gets angry, acts impulsively, and disturbs ongoing
activities. An item (how frequently the child talks during quiet study time) was
added in the third and fifth grade to increase the variance on this scale.
• Internalizing Problem Behaviors scale: include four items that assess the
apparent presence of anxiety, loneliness, low self-esteem and sadness
This study used the following three teacher SRS scales: peer relations scale
(combination of self-control and interpersonal scales); externalizing problem behaviors
scale, and internalizing problem behaviors scale. The intercorrelations between the five
SRS factors are quite high, indicating there may be issues with multicollinearity if the
scales are used in the same analysis.
Table 2.3 Split-half reliability for teacher Social Rating Scale scores Scale Split-half reliability
(3rd grade) Split-half reliability
(5th grade)
Externalizing Problem Behaviors .89 .89
Internalizing Problem Behaviors .76 .77
Peer Relations (self-control & interpersonal) .92 .92 Sources: Third Grade Methodology Report (Tourangeau et al., 2004) & Fifth Grade Users Manual (Tourangeau et al., 2006) Self-Description Questionnaire (SDQ) ECLS-K assessors administered the Self-Description Questionnaire (SDQ), which
consists of 42 statements that indicate how children think and feel about themselves
49
socially and academically. For the purpose of this study, children’s perceptions of their
academic performance will not be used. Only data about their perceptions of their
competence and popularity with peers, as well as their perceptions of their problem
behaviors will be used.
For each statement, children rated their perceptions of themselves on a four-point
scale: “not at all true,” “a little bit true,” “mostly true,” or “very true.” The 42 items
factored into six scales. Three scales focused on students’ perceptions of their academic
abilities and were not used in this study. The three scales that assessed students’
perceptions of their own behaviors were used in this study: SDQ Peer, SDQ
Anger/Distractibility, and SDQ Sad/Lonely/Anxious.
The SDQ Peer scale consists of six items that capture how well the students make
friends and get along with their peers, as well as their perceived popularity. The SDQ
Anger/Distractibility scale has six items that measure children’s perceptions of their
externalizing problem behaviors, such as fighting and arguing with other children, talking
and disturbing others, and problems with distractibility. The SDQ Sad/Lonely/Anxious
scale includes eight items about internalizing behaviors, such as feeling “sad a lot of the
time,” feeling lonely, feeling ashamed of mistakes, feeling frustrated and worrying about
school and friendships. While the items from the first four scales were adapted from the
Self-Description Questionnaire I (Marsh, 1990), the items for the two problem behavior
scales were developed specifically for the ECLS-K.
The scale scores on all SDQ scales are the mean of the items within that scale.
Missing data was not an issue because students who completed the SDQ answered nearly
all of the questions. The distributions of these scales are skewed; the positive behavior

50
scales are negatively skewed and the problem behavior scales are positively skewed. As
shown in the table below, the three SDQ scales that will be used in this study all have
acceptable reliability.
Table 2.4. Self-Description Questionnaire scale reliabilities Scale Number of items Alpha Coefficient
(3rd grade) Alpha Coefficient
(5th grade) Peer Relations 6 0.79 0.82 Externalizing Problems 6 0.77 0.78 Internalizing Problems 8 0.81 0.79 Sources: Third Grade Methodology Report (Tourangeau et al., 2004) & Fifth Grade Users Manual (Tourangeau et al., 2006) Measures and Variables Table 2.5 lists all variables that were used in the study, including a description of
the variable and how the variables were coded. These variables are described in more
depth below.
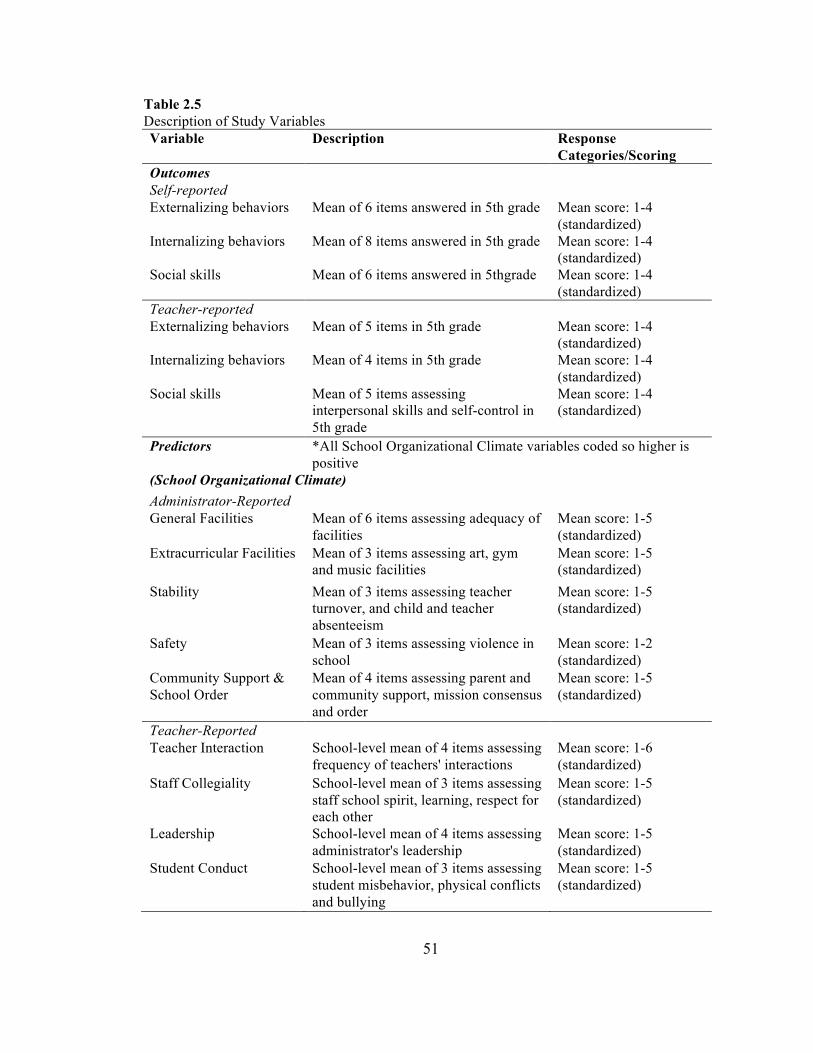
51
Table 2.5 Description of Study Variables Variable Description Response
Categories/Scoring Outcomes Self-reported Externalizing behaviors Mean of 6 items answered in 5th grade Mean score: 1-4
(standardized) Internalizing behaviors Mean of 8 items answered in 5th grade Mean score: 1-4
(standardized) Social skills Mean of 6 items answered in 5thgrade Mean score: 1-4
(standardized) Teacher-reported Externalizing behaviors Mean of 5 items in 5th grade Mean score: 1-4
(standardized) Internalizing behaviors Mean of 4 items in 5th grade Mean score: 1-4
(standardized) Social skills Mean of 5 items assessing
interpersonal skills and self-control in 5th grade
Mean score: 1-4 (standardized)
Predictors *All School Organizational Climate variables coded so higher is positive
(School Organizational Climate) Administrator-Reported General Facilities Mean of 6 items assessing adequacy of
facilities Mean score: 1-5 (standardized)
Extracurricular Facilities Mean of 3 items assessing art, gym and music facilities
Mean score: 1-5 (standardized)
Stability Mean of 3 items assessing teacher turnover, and child and teacher absenteeism
Mean score: 1-5 (standardized)
Safety Mean of 3 items assessing violence in school
Mean score: 1-2 (standardized)
Community Support & School Order
Mean of 4 items assessing parent and community support, mission consensus and order
Mean score: 1-5 (standardized)
Teacher-Reported Teacher Interaction School-level mean of 4 items assessing
frequency of teachers' interactions Mean score: 1-6 (standardized)
Staff Collegiality School-level mean of 3 items assessing staff school spirit, learning, respect for each other
Mean score: 1-5 (standardized)
Leadership School-level mean of 4 items assessing administrator's leadership
Mean score: 1-5 (standardized)
Student Conduct School-level mean of 3 items assessing student misbehavior, physical conflicts and bullying
Mean score: 1-5 (standardized)

52
!Mediator Teacher Job Satisfaction Mean of 3 items Mean score: 1-5
(standardized) Control Variables Child Gender Child's gender 0=male, 1=female Race Child's race 0=White, 1=Black,
2=Hispanic, 3=Asian, 4=Other
Academic achievement Mean of fifth grade math and reading scale scores
Mean: 57-187 (standardized)
Externalizing behaviors (self-reported)
Mean of 6 items answered in 3rd grade Mean score: 1-4 (standardized)
Externalizing behaviors (teacher-reported)
Mean of 5 items in 3rd grade Mean score: 1-4 (standardized)
Internalizing behaviors (self-reported)
Mean of 8 items answered in 3rd grade
Mean score: 1-4 (standardized)
Internalizing behaviors (teacher-reported)
Mean of 4 items in 3rd grade Mean score: 1-4 (standardized)
Social skills (self-reported)
Mean of 6 items answered in 3rd grade Mean score: 1-4 (standardized)
Social skills (teacher-reported)
Mean of 5 items assessing interpersonal skills and self-control in 3rd grade
Mean score: 1-4 (standardized)
Family Socio-economic Status SES Quintiles based on parents'
education, occupation and income 0=1st quintile, 1=2nd quintile, 2=3rd quintile, 3=4th quintile, 4=5th quintile
Family Structure Child lives in single-parent household 0=two-parent, 1=single-parent
Parental Depression Mean of 12 variables assessing depression symptoms
Mean: 1-4 (standardized)
Parental Warmth Mean of 4 variables assessing warmth between parent and child
Mean: 1-4 (standardized)
Parental Stress Mean of 4 variables assessing parent stress related to parenting
Mean: 1-4 (standardized)
Teacher Teacher Experience Years of experience as a teacher 1-35 (standardized) Teacher Education Teacher's highest level of education 0=Below Masters,
1=Master's or above Teacher Certification Teacher's certification 0= Emergency,
Temporary, Provisional, Probationary 1=Regular, standard, advanced professional
Teacher Race 0=White, 1=Non-white

53
Job security concerns “I worry about the security of my job because of the performance of the children in my class(es) on state or local tests.”
1=Strongly Disagree; 2=Disagree; 3=Neither Agree Nor Disagree; 4=Agree; 5=Strongly Agree
School Sector Type of school 0=Public, 1=Private Enrollment Number of students attending school 0=0-149, 1=150-299,
2=300-499, 3=500-749, 4=750+
Title I School's Title 1 status 0=No, 1=Yes Urbanicity Location of school 0=Suburb/large town,
1=city, 2=small town/rural (dummy)
Percent Minority Percent of students who are not White 0=<10%, 1=1-25%, 2=25-50%, 3=50-75%, 4=75% or more
School Achievement Mean of percent of students who are at/above grade-level in math and at/above grade-level in reading
Mean:1-100 (standardized)
Primary Independent Variable(s) School Organizational Climate
Data used to measure the school context came from two sources: school
administrator questionnaires and teacher questionnaires. Relevant items from these
instruments can be found in Appendix A, organized by reporter. In Aim 1, factor analysis
was used to group the items into scales. The composite value from each scale was used as
a separate variable in the analyses for Aim 2 and Aim 3. For these analyses, the
assumption was that the school organizational climate is an organization-level
characteristic and each rater (teacher) is a separate rater of the same entity of school
context. Based on previous research that indicates stability in school organizational
climate over several years (Brand et al., 2008), the school organizational climate
measures from third and fifth grade teachers within the same schools were combined. The

54
school-level scale score was determined by summing the responses from all teachers in a
school (from both the third grade and fifth grade waves), and dividing by the total
number of teachers contributing data for that school.
Primary Dependent Variable(s)
Children’s Socio-emotional outcomes
Students’ socio-emotional outcomes were based on both teacher and student
report. A total of six student socio-emotional outcomes were examined: teacher-rated
social skills, externalizing behaviors, and internalizing behaviors; self-rated social skills,
externalizing behaviors, and internalizing behaviors. The teacher-rated outcomes were
based on the following three teacher SRS scales: peer relations scale (combination of
self-control and interpersonal scales, name social skills in this study); externalizing
problem behaviors scale; and internalizing problem behaviors scale. Each scale has 6-9
items, which are each assessed on a 4-point scale. The score for each scale is the mean
rating of the items included in that scale. Higher scores for peer relations indicate positive
socio-emotional development. Higher scores for externalizing and internalizing behaviors
indicate negative socio-emotional development. Self-rated outcomes were based on
scores from three SDQ scales: SDQ Peer, SDQ Anger/Distractibility, and SDQ
Sad/Lonely/Anxious. Like the SRS scale scores, SDQ scale scores also have a 4-point
scale.
For each of the six outcomes (3 teacher SRS scale scores and 3 child SDQ scale
scores), the fifth grade score was used as the outcome and the third grade score was used
as a covariate. All scores were standardized to facilitate interpretation.

55
Mediating Variable (Aim 3)
Teacher Satisfaction
Teacher job satisfaction was measured at the individual teacher level and was a
composite variable consisting of the mean of three items on the fifth grade teacher
survey; higher values indicate greater job satisfaction. The items were: “I really enjoy my
present teaching job,” “I am certain I am making a difference in the lives of the children I
teach,” and “If I could start over, I would choose teaching again as my career.” All three
items were all answered on a Likert scale from 1 (strongly disagree) to 5 (strongly agree).
Using the sample in this study, the alpha for these items indicated acceptable reliability
(α=0.70).
Other Covariates
School Composition
The school organizational climate factors are the predictors of interest in this
study, but it was necessary to control for characteristics of the school that are less
modifiable, particularly the characteristics of the students in aggregate. Data for these
variables came from the fifth grade school administrator questionnaire. The following
variables are single items on the administrator questionnaire:
• Total enrollment in October of the given school year • Public or private school • School receipt of Tile I funding • Location of school (urbanicity)

56
Percent Minority Students in the School
This was a composite variable created based on the question in the school administrator
questionnaire that asked about the number or percentage of students particular race/ethnic
groups. The Percent Minority Students in the School is the sum for all categories except
White, not of Hispanic origin. If the necessary data were missing from the school
administrator questionnaire, the information was obtained from the Common Core of
Data (public schools) or the PSS (private schools).
School-Level Achievement
This was calculated by taking the mean of two variables: (1) the percent of students in the
school who tested at or above grade level in reading and (2) the percent of students in the
school who tested at or above grade-level in math. Therefore, the range of this variable
was from 0-100, with higher values indicating higher levels of school achievement.
Teacher Measures
Because previous research has found a relationship between teacher experience
and certification and students’ outcomes, several individual teacher characteristics were
included in the analysis. These variables were included for the fifth grade reading
teacher, since that teacher is expected to have the largest impact on the outcomes. These
were all self-reported by teachers in the teacher questionnaire and include:
Years of experience as a teacher
Teachers self-reported the number of years they had been teaching (including part-time
teaching).

57
Highest level of education completed
Teachers reported the highest level of education they had completed. Eight options were
provided: high school diploma or GED, associate’s degree, bachelor’s degree, at least one
year of course work beyond a Bachelor’s degree, Master’s degree, education specialist or
professional diploma based on at least one year of course work past a Master’s degree
level, and Doctorate. As previous studies using ELC-K data have done, the variable was
dichotomized as Consistent with previous studies using the ECLS-K, highest level of
education was dichotomized (1=Masters or higher).
Type of teaching certification
Similar to Jennings et al. (2010), the variable will be coded dichotomously, with the
regular or standard state certificate as the reference category. This will be compared to all
other response options (probationary certificate, provisional or other type of certificate,
temporary certificate, and emergency certificate or waiver) combined.
Teacher Race and Job Security Concerns
Two additional teacher variables were used in Aim 3. Teacher’s race was a dichotomous
variable (1=non-white). Job security concerns were assessed using a single item: “I worry
about the security of my job because of the performance of the children in my class(es)
on state or local tests.” Teachers answered based on a Likert scale: 1=Strong disagree-
5=Strongly agree.
Child and Family Measures
Academic Achievement
Because of the relationship between educational and socio-emotional outcomes, students’
cognitive skills were included as a covariate (Needham et al., 2004; Gutman et al., 2003;

58
DiPerna & Elliott, 2002). For the ECLS-K, a direct cognitive assessment was conducted
and scored using Item Response Theory (IRT). For this study, the mean of the overall
reading IRT scale score in third grade and the overall math IRT scale score in third grade
was used.
Gender
Child’s gender was collected in the parent interviews. If there was no parent interview,
gender was determined using other resources, such as by experimenters during the direct
child assessment. Gender was coded as 0=male and 1=female.
Race/Ethnicity
Child’s race and ethnicity were also collected in the parent interviews. Eight categories
were provided, and parents could select more than one. The eight categories included:
White, African American, Hispanic-race specified, Hispanic- race not specified, Asian,
Native Hawaiian, American Indian, and more than one race. The ECLS-K dataset
includes a composite variable for race/ethnicity that has 8 categories. For this study,
some of these categories were combined to create a total of five categories consistent
with Crosnoe and Cooper (2010): White, African-American, Hispanic, Asian and Other.
Socioeconomic Status
SES is an existing composite variable in the ECLS-K dataset that is made up of the
following variables from the parent questionnaire:
• Father/male guardian’s education • Mother/female guardian’s education • Father/male guardian’s occupation • Mother/female guardian’s occupation • Household income: All participants were asked to indicate their income range
from the list below. Households that met the size and income criteria related to poverty were asked to report income to the nearest $1,000.

59
The composite SES variable is categorical, with 1 representing the first quintile (low
status) and 5 representing the fifth quintile (highest status).
Family Structure
Family structure was a dichotomous variable with 1=single-parent household and 0=two-
parent household.
Parental Depressive Symptoms
In the third grade administration of the study, the respondent for the parent interview
(most often the child’s mother) answered twelve items based on a subset of the Center for
Epidemiologic Studies-Depression Scale. These items asked about depression- related
symptoms in the previous week, and had four possible responses: never, some of the
time, moderate amount of the time, and most of the time. These items included questions
such as “How often during the past week have you felt that you could not shake off the
blues even with help from your family and friends?” and “How often during the past
week have you felt depressed?” The mean of these twelve items was used as a
continuous measure for the Parental Depressive Symptoms variable. Higher values of this
variable indicate greater levels of parental depressive symptoms.
Parental stress and Parental warmth
Factor analysis was used to identify two constructs related to parenting using items in the
third grade parent questionnaire. Parental warmth includes four items about affection
between parent and child. Parental stress consists of four items that ask about parents’
feelings of anger and frustration toward the child and related to parenting. These

60
composite variables are similar to those used in previous studies using the ELCS-K
(Crosnoe & Cooper, 2010; Beaver et al., 2008).
Treatment of Missing Data
As has been done in previous studies using ECLS-K data (Crosnoe and Cooper,
2010), multiple imputation was used to estimate all item-level missing data. This
approach helped to maintain the large, heterogeneous sample and avoid the statistical bias
of listwise deletion (Crosnoe & Cooper, 2010). For Aim 1, data were imputed in Mplus
with five imputed datasets. For Aims 2 and 3, data were imputed with STATA’s “impute
chained” command [Stata- Corp, College Station, TX] with twenty imputed datasets. In
addition to variables used in the analytical models, other variables were also used in the
imputation models that were associated with the variables to be imputed or with
missingness of those variables. In order to maintain the multi-level structure of the data,
students from the same school were assigned the same imputed values for school-level
variables.
Analytic Methods
Exploratory Data Analysis
Exploratory data analysis was conducted on all outcome variables, primary
predictor variables, and control variables. Descriptive analyses included means, standard
deviations, ranges for continuous variables and percentages for categorical variables.
Variables were also examined graphically, using histograms, to assess the range of values
and normality. Correlations between variables were examined, and possible multi-

61
collinearity was investigated using VIF and tolerance scores. Several variables were
recoded or excluded based on findings. For example, because of collinearity between
percent in school achieving at or above grade in math and percent in school achieving at
or above grade in reading, a composite variable was created based on the mean of these
two items.
Aim 1
The same process for factor analysis was used with items from both the
administrator and teacher surveys. Because of the large sample size, it was possible to
validate the factor structure in a two-step process. The sample was randomly split in half
using Stata 11.0. One half was used for exploratory factor analysis (EFA), and then the
other half of the data was used for confirmatory factor analysis (CFA). EFA and CFA
were conducted using Mplus 7.0.
The WLSMV estimator, which is based on polychoric correlations, was used
because it is recommended for factor analysis with categorical outcomes (Finney &
DiStefano, 2006; Flora & Curran, 2004). Although ML is possible with the assumption of
missing at random (MAR), it is not recommended for categorical variables. WLSMV
uses pairwise present for missing variables and is based on the assumption of missing
completely at random (MCAR). Since MCAR cannot be assumed for this data, multiple
imputation was performed in Mplus before using WLSMV. Prior to analysis, negatively
coded variables were reverse coded so that for all variables higher values would be more
positive.
Because it is not possible to conduct EFA with imputed data in Mplus,
exploratory structural equation modeling (ESEM) was conducted with the imputed data.

62
In an ESEM, the initial model is specified as an EFA model and all the indicator
variables are allowed to load on all the factors (Muthen & Muthen, 2008). ESEM was
done with both oblique and orthogonal rotations.
Confirmatory factor analysis was conducted on the second half of the sample to
confirm the factor structure identified in EFA. Model fit was assessed using several fit
indices: the comparative fit index (CFI), the Tucker-Lewis Index (TLI), and the root
mean square error of approximation (RMSEA). For CFI, larger values indicate better
model fit, with values greater or equal than 0.95 considered to adequate fit (Hu &
Bentler, 1998). For RMSEA, the smaller the value the better the model fit; values less
than or equal to 0.08 indicate adequate fit (Hu & Bentler, 1998).
Although Cronbach’s alpha is widely used to assess scale reliability, critics of the
measure point out that it is based on the assumption that the items have the same loadings
and there are no residual correlations. Cronbach’s alpha may underestimate reliability for
ordinal indicators. Ordinal alpha has been shown to estimate reliability more accurately
than Cronbach’s alpha for binary and ordinal response scales (Zumbo, Gadermann &
Zeisser, 2007; Gadermann & Zumbo, 2012). Cronbach’s alpha is routinely based on the
Pearson covariance matrix, which assumes data are continuous. Ordinal alpha is based on
the polychoric correlation matrix, which is more appropriate for ordinal data. For these
reasons, ordinal alpha was calculated using R.
Aim 2
For this study, autoregressive techniques were used to analyze change over time
by predicting fifth grade outcomes net of third grade outcomes. A similar approach has
been used by other researchers utilizing ECLS-K data, although primarily for outcomes

63
in earlier grades (Li-Grining et al., 2006; McClelland et al., 2000, Claessens, Duncan, &
Engel, 2009, Duncan et al, 2007).
Multilevel multivariate linear regression was used to account for the clustering of
students within schools. It also allows for partitioning of outcome variance (between and
within school effects) to better assess school-level effects. Level 1 consisted of individual
students (between individual and within school effects). Level 2 consisted of schools
(between school effects). Because the six outcomes are highly correlated and the effect of
the school organizational climate may differ for each one, a separate model was used for
each outcome. All continuous level 1 variables were standardized, and thus grand mean
centered. Grand mean centering is recommended when the research question involves the
effect of a level-2 variable (Peugh, 2010; Enders & Tofighi, 2007).
Multi-level regression was then performed in four steps. First, unconditional
linear regression models with random effects were run to assess variation in students’
socio-emotional outcomes between and within schools. The Intra-Class Correlation (ICC)
was used to calculate the proportion of variance in the outcome variable accounted for at
each level of the model. For the two-level models, the ICC was calculated as:
ICC= ρ= τ00/(τ00 + σ2)
where σ2 is the variability within schools and τ00 is the variability between schools
After running the unconditional models, conditional linear regression models were run
with school organizational climate (SOC) scale scores. One set of models was examined
in which all nine school organizational climate variables were added simultaneously.

64
Another set was examined in which the SOC variables were entered in separate models.
The next step was to add covariates to the model for student, family and teacher
characteristics, and school composition. The variance in the outcomes that is attributable
to school organizational climate dimensions was examined, as were the regression
coefficients for each climate scale. In the final series of models, cross-level interaction
terms were added to the models described above to examine possible interactions
between school organizational climate variables and student-level risk. One set of models
included interaction terms for the school organizational climate variables and individual-
level socio-economic status (SES). Another set of models included interaction terms for
school organizational climate variables and self-rated externalizing behaviors in third
grade. For both sets of models, the significance of the interaction terms was examined to
determine if there was evidence that the association between each school organizational
climate variable and students’ outcomes varied based on students’ socio-economic status
or third grade behavior problems.
There are reasons to add the SOC variables to the models both separately and in
groups. It was important to examine the SOC variables separately because of the
relatively high correlations between these variables and the possibility of collinearity
(Leblanc et al., 2008). It is also possible that some dimensions of SOC mediate the effect
of other SOC dimensions on students’ outcomes. By including SOC variables in the same
model, it is possible to examine their relative effects on students’ outcomes, controlling
for other SOC variables (Saab and Klinger, 2010).

65
Models Step 1 Unconditional linear regression models were run that had random effects to assess variation in students’ socio-emotional outcomes both between and within schools. The equations below provide an example of these models, with descriptions based on one of the outcomes, teacher-reported externalizing behaviors. Level one model (Students) Yij= β0j+rij Level two model (Schools) β0j= γ00+u0j Yij=Estimated externalizing score for student i in school j β0j=Estimated mean externalizing score for students in school j rij= Estimated residual variance in externalizing score for student i in school j γ00=Estimated mean externalizing score for all schools u0j= Estimated residual variance in externalizing score for school j Step 2 Conditional linear regression models were run that included school organizational climate variables. These models provided information about the variance in the outcomes attributable to school organizational climate, as well as the association between school organizational climate variables and the outcomes. An example of these models is below: Level one model: Yij= β0j + rij Level two model: β0j= γ00+γ01 (General Facilities)j + γ02(Extracurricular Facilities) j ++ γ03(Stability) j + γ04(Safety) j +γ05(Support & Order) j +γ06(Teacher Interaction) j +γ07(Staff Collegiality) j +γ08(Leadership) j +γ09(Student Conduct) j + u0j Coefficients for school organizational climate variables were interpreted as follows: γ01 = estimated change in externalizing score per change in school General Facilities scale score Because both the outcomes and school organizational climate variables were standardized, coefficients are effect sizes and can be interpreted as follows: a one standard deviation increase in school j’s General Facilities scale score is associated with a γ01 standard deviation change in the externalizing score for student i in school j. Additionally, the size of coefficients for the school organizational climate variables can be compared.

66
Step 3 Covariates for individual student characteristics, teacher characteristics, family characteristics and school composition were added to the conditional model described above to determine the association between school organizational climate and fifth grade outcomes net third grade behavior and other important factors. An example of these models is below Level one model Yij= β0j+β1Sij + β2Tij + β3Fij +rij Level two model β0j= γ00+γ01 (General Facilities) j + γ02(Extracurricular Facilities)j ++ γ03(Stability)j + γ04(Safety)j +γ05(Support & Order) j +γ06(Teacher Interaction) j +γ07(Staff Collegiality) j +γ08(Leadership) j +γ09(Student Conduct) j +γ010(Student Conduct) j + γ011Wj + u0j β0j= estimated mean externalizing score for students in school j, controlling for student,
teacher, and family characteristics and school composition β1j = estimated mean change in externalizing score per change in student characteristics, controlling for teacher and family characteristics and school composition β2j = estimated change in externalizing score per change in teacher characteristics
controlling for student and teacher characteristics and school composition β3j= estimated change in externalizing score per change in family characteristics
controlling for student and teacher characteristics and school composition rij= estimated residual variance in externalizing score for student i in school j γ00= estimated mean externalizing score for all schools γ01 = estimated change in externalizing score per unit change in school General Facilities
scale score, controlling for student, teacher, and family characteristics and school composition
u0j= estimated residual variance in externalizing score for school j Sij= vector of student characteristics Fij= vector of family characteristics Tij= vector of teacher characteristics Wj = vector of school characteristics For this series of multi-level models, the parameters of interest were again the coefficients for each of the school organizational climate factors ( γ01-γ010). Step 4 In the final two sets of models, cross-level interaction terms were added to the models described above. One set of models included interaction terms for each SOC variable (Level 2) and student’s socio-economic status (Level 1). The other set of models

67
included interaction terms for each SOC variable and students’ self-reported externalizing behaviors in third grade. An example of these models is below with only two of the SOC variables and externalizing behaviors. Level one model: Yij= β0j+β1Sij + β2Tij +β3Fij + rij Level two model: β0j= γ00+γ01 Wj +γ02(Leadership)j ++γ03(Safety)j
+γ04(Leadership)j(EXT)ij ++γ05(Safety)j*(Externalizing)ij +u0j γ04 = estimated change in slope of the regression of school leadership scale score on
teacher externalizing score per standard deviation in third grade externalizing behaviors
Aim 3
Multi-level linear regression was also used for Aim 3. For the first step,
examining the relationship between school organizational climate dimensions and teacher
job satisfaction, two-level models were used with teachers at Level 1 and schools at
Level 2. All models controlled for school and teacher characteristics. In the second step,
the association between teacher job satisfaction and students’ socio-emotional outcomes
was assessed using three-level models (students, teachers and schools) and controlling for
child, family, teacher and school characteristics. In the final step, two sets of models were
used. One set of models included all covariates and one school organizational climate
variable. In another set of models, teacher job satisfaction was added. School
organizational climate dimensions were entered in separate models to determine the
unique effect of each one. The change in the coefficient for the school organizational
climate variable was examined to determine if job satisfaction mediated the effect of the
school organizational climate variable. Like in Aim 2 analyses, all continuous Level 1
variables were standardized (and therefore grand-mean centered) to facilitate
interpretation and comparability of coefficients. Also like Aim 2, for the final step third

68
autoregressive techniques were used to analyze change over time by predicting fifth
grade outcomes net of third grade outcomes.
Models Step 1.a Unconditional linear regression models were run that had random effects to assess variation in teachers’ job satisfaction between and within schools. The equations below provide an example of these models: Level one model (Teachers) Yij= β0j+rij Level two model (Schools) β0j= γ00+u0j Yij=Estimated job satisfaction for teacher i in school j β0j=Estimated mean job satisfaction for teachers in school j rij= Estimated residual variance in job satisfaction for teacher i in school j γ00=Estimated mean job satisfaction for all schools u0j= Estimated residual variance in job satisfaction for school j Step 1.b School organizational climate (SOC) variables were added to separate models, along with teacher and school level covariates. Level one model Yij= β0j+β1Tij +rij Level two model β0j= γ00+γ01 (SOC variable) j + γ02Wj + u0j β0j= estimated mean job satisfaction for teachers in school j, controlling for teacher characteristics and school composition β1j = estimated mean job satisfaction per change in teacher characteristics, controlling for teacher and school characteristics rij= estimated residual variance in job satisfaction for teacher i in school j γ00= estimated mean job satisfaction for all schools γ01 = estimated change in job satisfaction per change in school characteristics u0j= estimated residual variance in job satisfaction for school j Tij= vector of teacher characteristics Wj = vector of school characteristics

69
Step 2.a To examine the relationship between teacher job satisfaction and students’ socio-emotional outcomes, 3-level models were specified, with students at Level 1, teachers at Level 2, and schools at Level 3. The socio-emotional outcomes were the dependent variables. Level one model (Students) Yijk= π0jk + еijk Level two model (Teachers) π0jk = β00j + r0jk Level three model (Schools) β00j= γ00+ u00j
Step 2.b Job satisfaction was added to the model at Level 2. Level one model Yijk= π0jk + еijk Level two model π0jk = β00j + β01j(Satisfaction) jk+ r0jk Level three model β00j= γ00+u00j
Step 2.c Control variables were added at all levels. Level one model Yijk= π0jk + π1jkSijk+ + π2jkFijk+ еijk
Level two model π0jk = β00j + β01j(Satisfaction) jk+ β02j(T) jk+ r0jk
Level three model β00j= γ00+ + γ001(W)k+ u00j
Step 3.a

70
To determine whether teacher job satisfaction mediated the relationship between school organizational climate dimensions and socio-emotional outcomes, the coefficient for each school organizational climate dimension was examined before and after adding job satisfaction to the model. Each dimension of school organizational climate was examined in a separate model (denoted as SOC variable in the models below). Level one model (Students) Yijk= π0jk + π1Sijk+ еijk
Level two model (Teachers) π0jk = β00j + β01(T) jk + r0jk Level three model (Schools) β00j= γ00+ γ001(SOC variable)k + γ002(W)k+ u00j
Step 3.b Job satisfaction was added to the model at Level 2. The change in γ001 was examined to assess mediation. Level one model Yijk= π0jk + π1Sijk+ + π2Fijk+ еijk
Level two model π0jk = β00j + β01(T) jk + β02(Satisfaction) jk + r0jk
Level three model β00j= γ00+ γ001(SOC variable)k + γ002(W)k+ u00j

71
References !!Beaver, K.M., Wright, J.P., Maume, M.O. (2008). The effect of school classroom
characteristics on low self-control: A multilevel analysis. Journal of Criminal Justice, 36, 174-181.!
!Brand, S., Felner, R.D., Seitsinger, A., Burns, A., Bolton, N. (2008). A large scale study
of the assessment of the social environment of middle and secondary schools: The validity and utility of teachers’ ratings of school climate, cultural pluralism, and safety problems for understanding school effects and school improvement. Journal of School Psychology, 46:507-535.!
!Claessens, Duncan, & Engel, 2009 Claessens, A., Duncan, G. J., & Engel, M. (2009).
Kindergarten skills and fifth grade achievement: Evidence from the ECLS-K. Economics of Education Review, 28, 415–427.!
!Crosnoe, R. & Cooper, C.E. (2010). Economically Disadvantaged Children’s Transitions
into Elementary School: Linking Family Processes, School Contexts, and Educational Policy. American Education Research Journal, 47,2, 258-291.!
!Demaray, M. K., Ruffalo, S. L., Carlson, J., Busse, R. T., Olson, A. E., McManus, S. M.,
& Leventhal, A. (1995). Social skills assessment: A comparative evaluation of six published rating scales. School Psychology Review, 24(4), 648-671.!
!DiPerna JC, Elliott SN. (2002). Promoting academic enablers to improve student
achievement: an introduction to the mini-series. School Psychology Review, 31, 293–297.!
!Duncan, G. J., Dowsett, C. J., Claessens, A., Magnuson, K., Huston, A. C., Klebanov,
P.,Japel, C. (2007). School readiness and later achievement. Developmental Psychology, 43, 1428–1446.!
!Enders, C.K. & Tofighi, D. (2007). Centering Predictor Variables in Cross-Sectional
Multilevel Models: A New Look at an Old Issue. Psychological Methods, 12, 121-138.!
!Finney, S.J., DiStefano, C. (2006). Non-normal and categorical data in structural equation
modeling. In: Hancock, G.R., Mueller, R.O. (Eds.), Structural Equation Modeling: A Second Course. IAP Information Age Publishing, pp. 269–314.!
!Flora, D.B., Curran, P.J. (2004). An empirical evaluation of alternative methods of
estimation for confirmatory factor analysis with ordinal data. Psychological Methods, 9 (4), 466–491.!
!

72
Gadermann, A.M., Guhn, M., & Zumbo, B.D. (2012). Estimating ordinal reliability for Likert-type and ordinal item response data: A conceptual, empirical, and practical guide. Practical Assessment, Research and Evaluation, 17, 1-13.!
!Gresham, F., and Elliot, S. (1990). Social Skills Rating System. Circle Pines, MN:
American Guidance Services, Inc.!!Gutman, L. M., Sameroff, A. J., & Cole, R. (2003). Academic growth curve trajectories
from 1st grade to 12th grade: Effects of multiple social risks and preschool child factors. Developmental Psychology, 39, 777-790.!
!Saab, H. & Klinger, D. (2010). School differences in adolescent health and wellbeing:
Findings from the Canadian Health Behaviour in School-Aged Children Study. Social Science & Medicine, 70, 850-858.!
!Hu, L., & Bentler, P. M. (1998). Fit indices in covariance structure modeling: Sensitivity
to underparameterized model misspecification. Psychological Methods, 3, 424−453.!
!Jennings, J.L. & DiPrete, T.A. (2010). Teacher Effects on Social and Behavioral Skills in
Early Elementary School. Sociology of Education, 83(2), 135-159.!!LeBlanc, L., Swisher, R., Vitaro, F., Tremblay, R.E. (2008). High School Social Climate
and Antisocial Behavior: A 10 Year Longitudinal and Multilevel Study. Journal of Research on Adolescence, 18(3), 395-419.!
!Li-Grining, C. P., Votruba-Drzal, E., Bachman, H. J., & Chase-Lansdale, P. L. (2006).
Are certain preschoolers at risk in the era of welfare reform? The moderating role of children’s temperament. Children and Youth Services Review, 28, 1102–1123.!
!McClelland, M. M., Morrison, F. J., & Holmes, D. L. (2000). Children at risk for early
academic problems: The role of learning-related skills. Early Childhood Research Quarterly, 15, 307–329.!
!Needham B, Crosnoe R, Muller C. (2004) Academic failure in secondary school: the
interrelated role of health problems and educational context. Social Problems, 51:569–586.!
!Peugh, J.L. (2010). A practical guide to multilevel modeling. Journal of School
Psychology, 48, 85-112.!!Pollack, J.M., Atkins-Burnett, S., Najarian, M., and Rock, D.A. (2005). Early Childhood
Longitudinal Study, Kindergarten Class of 1998–99 (ECLS–K), Psychometric Report for the Fifth Grade (NCES 2006–036). U.S. Department of Education. Washington, DC: National Center for Education Statistics.!

73
!Tourangeau, K., Nord, C., Lê, T., Sorongon, A. G., and Najarian, M. (2009). Early
Childhood Longitudinal Study, Kindergarten Class of 1998–99 (ECLS-K), Combined User’s Manual for the ECLS-K Eighth-Grade and K–8 Full Sample Data Files and Electronic Codebooks (NCES 2009–004). National Center for Education Statistics, Institute of Education Sciences, U.S. Department of Education. Washington, DC.!
!Zumbo, B.D., Gadermann, A. M., & Zeisser, C. (2007). Ordinal versions of coefficients
alpha and theta for Likert rating scales. Journal of Modern Applied Statistical Methods, 6, 21-29.!

74
Chapter Three
Identification of School Organizational Climate Constructs in the
ECLS-K Using Factor Analysis

75
Abstract Background: Although previous studies have used items in the ECLS-K to examine the
relationship between school-level factors and students’ outcomes, there is a need to better
define constructs these items capture. The purpose of this study was to identify
dimensions of school organizational climate using items in the teacher and administrator
surveys of the 3rd and 5th grade waves of the ECLS-K.
Methods: To identify constructs of school organizational climate, two separate factor
analyses, one for the teacher survey and for the administrator survey, were conducted
with the same two-step process. The entire sample was split in half randomly. One half
was used for exploratory factor analysis (EFA), and the other half was used for
confirmatory factor analysis (CFA). Ordinal alphas were computed to assess scale
internal reliability. Intraclass correlation coefficients (ICCs) were calculated for each
teacher scale to determine if responses should be aggregated at the school level.
Results: For the school administrator survey, factor analysis yielded a 19-item, five-
factor model with adequate fit statistics (RMSEA=0.047; CFI=0.952; TLI=0.93 for
CFA). Four of the five factors had good internal reliability based on ordinal alpha values.
For the teacher survey, factor analysis yielded a 14-item, four-factor model with excellent
fit statistics (RMSEA=0.034; CFI=0.995; TLI=0.993). All four factors had good to
excellent internal reliability. Intraclass-correlation coefficients (ICCs) for the teacher
factors ranged from 0.17-0.36, supporting the conceptualization of these factors as
school-level characteristics.
Conclusion: School organizational climate scales with moderate to excellent internal
reliability were identified using items from the ECLS-K administrator and teacher

76
surveys were. These scales can be used by other researchers to examine the role of the
school environment.

77
Introduction There is increasing interest in interventions that aim to make school-level changes
to promote positive student outcomes. Along with school-based interventions, a growing
number of districts and states administer surveys to assess staff perceptions of the school
environment. In order to design effective interventions and informative surveys,
additional information is needed about the role of modifiable school characteristics.
Although school climate has been defined in many ways, school organizational climate is
assessed using data collected from school staff about their work environment. Hoy et al.
(1991) defined school organizational climate as “teachers’ perceptions of their work
environment; it is influenced by formal and informal relationships, personalities of
participants and leadership in the organization.” (p. 8). There is a history of research
examining the organizational climate in work settings. Reichers and Schneider (1990)
defined organizational climate as “shared perceptions of organizational policies, practices
and procedures, both formal and informal.” Research in organizational psychology has
demonstrated the importance of one’s work environment on performance and behavior
(Judge et al., 2001; Tobin et al., 2006; Kopelman et al., 1990)
Halpin and Croft (1963) were among the first to study organizational climate in
schools. They developed the Organizational Climate Description Questionnaire (OCDQ)
for elementary schools, which identified important aspects of teacher-teacher and
teacher-principal interactions to measure the “openness of schools.” Items selected for
inclusion in the OCDQ were those that had reasonable consensus among school staff
(Hoy et al., 1991). Sweetland and Hoy drew from this conceptualization of the school
organizational environment to develop the Organizational Health Inventory (OHI), one of

78
the most frequently used instruments for assessing school organizational climate. The
OHI- Elementary School Version (Hoy & Tarter, 1997) includes 37 items that measure
five dimensions: institutional integrity; principal leadership; availability of educational
materials; staff affiliation; and academic emphasis. Another commonly used instrument is
the School-Level Environment Questionnaire (SLEQ), which consists of constructs such
as affiliation, innovation, participatory decision making, resource adequacy and student
support (Johnson & Stevens, 2006). Although the OHI and SLEQ are two of the most
common instruments for assessing school organizational climate, constructs used by
previous studies have varied. Taylor and Tashakkori (1995) identified five dimensions of
the school organizational climate: principal leadership, student discipline, faculty
collegiality, lack of obstacles to teaching, and faculty communication. Tobin et al. (2006)
drew upon literature in organizational psychology to identify areas associated with
effective employee and organizational performance. They used items selected or adapted
from existing employee surveys to measure the following dimensions of the school
organizational climate: school facilities, academic materials, discipline and safety, staff
collegiality, administrator support of staff, staff coordination, professional development
and job satisfaction.
There is evidence that dimensions of the school organizational climate have an
impact on academic achievement, primarily due to the mediating effect of teacher
behaviors (Roeser, 2001; Hoy & Hannum, 1997; Goddard et al., 2000). For example,
school safety, strong principal leadership, and adequate school resources have all been
shown to be associated with higher levels of student achievement (Johnson & Stevens,
2006; Hoy & Hannum, 1997). High academic standards and a supportive work

79
atmosphere for teachers are also associated with better achievement, largely due to
teachers doing more to promote student learning. There is some evidence that
organizational climate is associated with student absenteeism and school suspensions
(Bevans et al., 2007; Gottfredson et al., 2005). !
Unit of analysis
Although there has been debate as to whether school climate characteristics are a
property of schools or a psychological property of individuals within the school (Miller &
Fredericks, 1990), several studies comparing the reliability and validity of individual-
level and school-level conceptualizations of school organizational climate have found
evidence favoring the school-level definition (van Horn, 2003; James et al., 1988;
Griffith, 2006). For example, on the elementary school version of the School Climate
Survey, van Horn (2003) found moderate inter-rater reliability among teachers and
demonstrated that the average school climate in each school predicted a statistically
significant amount of between-school variation in children’s academic achievement and
cognitive functioning, whereas differences between individual raters within the school
were not significantly related to child outcomes.
In order to assess the appropriateness of school-level aggregation, previous
studies have used the intraclass correlation coefficient (ICC), which takes into account
both between-school variance and within-school variance. ICC values greater than 0.2
indicate sufficient within group agreement to support creating aggregated group-level
variables. In other school climate studies in which teacher responses were aggregated at
the group level, ICCs for climate scales have ranged from 0.04-0.44, with most between
0.2 and 0.4 (Brand et al., 2008; Gottfredson et al., 2005; van Horn, 2003).

80
School Organizational Climate and the ECLS-K
The Early Childhood Longitudinal Study-Kindergarten Cohort (ECLS-K) is a
valuable resource for examining the school environment, because it is a large national
dataset and includes data collected from school administrators and teachers about their
perceptions of the school environment. Although previous studies have used items in the
ECLS-K teachers’ and administrators’ questionnaires to examine the relationship
between school-level factors and students’ outcomes, there is a need to better define the
constructs these items capture and to reduce the number of variables needed to describe
organizational characteristics by developing composite variables using the ECLS-K
teacher and administrator questionnaire items (Brown & Bogard, 2007; Hamilton &
Guarino, 2004). Although some work has been done to identify factors, most previous
studies have focused on earlier waves of the ECLS-K, which include a slightly different
group of items (Lee & Burkham, 2002). Factor analysis is helpful for identifying
constructs, as it provides information about the relationships among items, detects
underlying or latent constructs, and shows how to combine items and identify a smaller
number of more robust variables, or factors.
This study used separate factor analyses to identify the school climate constructs
captured in the administrator and teacher questionnaires of the ECLS-K. The ICC of each
scale from the teacher survey was then calculated to examine the appropriateness of
aggregating teacher responses at the school level. The identified school organizational
climate factors can support research to examine the relationship of these school level
factors to student outcomes and to other school and teacher characteristics.
81
Methods
Sample
Data for this study came from the Early Childhood Longitudinal Study-
Kindergarten Class (ECLS-K), which is maintained by the National Center for Education
Statistics (NCES). The ECLS-K selected a nationally representative sample of
kindergarten students in the fall of 1998 and followed those students through eighth grade
(Tourangeau et al., 2009). Given the growing importance of the school environment as
children reach later elementary school and a lack of previous research examining
constructs in surveys from later waves of the ECLS-K, this study only used data collected
during the third and fifth grade waves of the ECLS-K.
School Administrator Survey
The principal of the school attended by the sampled child completed the school
administrator questionnaire. Of the 5,413 sampled schools in the third and fifth grade
waves, 27% did not complete any part of the administrator questionnaire and were not
included in the analyses. In the third grade wave (Spring 2002), 1,868 school
administrators completed the survey. In the fifth grade wave (Spring 2004), 2,094 school
administrators completed the survey.
If the sampled child remained in the same school in third and fifth grade, the same
school could have been included in both waves (third and fifth grade), and different
responses could have been given in each of these years. Since exploratory factor analysis
with the third grade sample, the fifth grade sample, and the combined sample yielded
similar factor structures, each set of responses from a given school was treated as a
separate observation. For example, responses from School A in the third grade wave and
82
responses from School A in the fifth grade wave were considered to be two sets of
observations representing School A in the factor analysis. This yielded a total of 3,962
schools/school administrators.
Teacher Survey
Like the school administrator factor analysis described above, data for the teacher
factor analysis come from the third and fifth grade waves of the ECLS-K. Teachers
completed self-administered questionnaires that assessed school and classroom
characteristics, instructional practices, and teacher background. For third grade, each
sampled child’s regular classroom teacher, the one who taught them the majority of the
day, completed the teacher questionnaires. In the fifth grade, each sampled child’s
reading teacher and either their math or science teacher completed the questionnaires.
In the third and fifth grade waves, a total of 12,010 teachers were sampled. Of
these teachers, 10,029 (84%) responded, from a total of 2,879 schools. Of these, 4,381
(44%) were third grade teachers who completed the survey in Spring 2002. The
remaining teachers completed the survey in Spring 2004 and included 2,839 (28%) fifth
grade Reading teachers, and 2,809 (28%) fifth grade math teachers.
Measures
School Administrator Survey
The self-administered school administrator questionnaire included questions
about the school, student body, teachers, school policies and the administrator’s
background. Although a designee could complete the sections containing factual
information about the school and programs offered, the principal was asked to complete
the sections about his/her background and the school climate.

83
For this study, items were selected from the ECLS-K school administrator survey
that asked the administrator to assess the school environment and were similar to items in
existing school climate surveys for staff. Twenty variables (Appendix A) were used in the
factor analysis. Of these 20 variables, 17 were measured on a 5-point Likert scale. The
remaining three items were dichotomous.
Several other sets of variables were considered for inclusion, but were ultimately
excluded. Nine items asking about how much emphasis the principal places on a range of
objectives for her/his teachers were excluded because they assessed the principal’s
priorities rather than their appraisal of the school environment. Eight items asking about
the surrounding neighborhood, such as the presence of drugs, litter and violence, were
excluded because they reflect the neighborhood environment rather than the school
environment. Nine dichotomous items asking about the presence of specific security
measures, such as security guards, metal detectors, and locked exterior doors during the
day, were not included because preliminary analyses indicated these items did not
sufficiently load on their own factor or on other factors and had multiple cross-loadings.
Although these items did not function well as a scale, they may still be important and
warrant further exploration.
Missing Data
Of the 3,962 schools that submitted the school administrator questionnaire in
2002 and 2004, 89% answered all 20 questions included in this factor analysis, 6% were
missing one variable, and 5% were missing data for three or more variables. Percent
missing for the 20 variables included in the factor analysis ranged from 0.8% to 3%.

84
Exploratory data analysis indicated that data were not missing completely at random
(MCAR). It was assumed that data were missing at random (MAR).
Teacher Survey
Twenty-one variables on the ECLS-K teacher survey (Appendix B) were included
in this factor analysis. Items were selected that assessed teachers’ perceptions of the
school environment. Two additional sets of items were initially considered for inclusion,
but were not used. Five items assessing job satisfaction and enjoyment were not used as
school climate measures because they assess individual teacher attitudes, rather than
school-level characteristics. Eight items measuring teachers’ perceived adequacy of their
own preparation as a teacher were also excluded because they assessed individual
characteristics. Of the twenty-one items chosen for inclusion, seventeen had a response
scale of 1 to 5; the remaining four questions had a response scale of 1 to 6.
Missing Data
Of this sample of 10,029 teachers, 93% had complete data on all 21 variables
included in the factor analysis, 5% were missing data for one variable, and 2% were
missing data for two or more variables. Missingness for 19 of the variables was less than
1%, and was 1% and 2% for the remaining two variables. Exploratory data analysis
indicated data were not missing completely random (MCAR). It was assumed that data
were missing at random (MAR).
Data Analyses
The same process for factor analysis was used with items from both the
administrator and teacher surveys. Because of the large sample size, it was possible to
validate the factor structure in a two-step process. The sample was randomly split in half

85
using Stata 11.0. One half was used for exploratory factor analysis (EFA), and then the
other half of the data was used for confirmatory factor analysis (CFA). EFA and CFA
were conducted using Mplus 7.0.
The WLSMV estimator, which is based on polychoric correlations, was used
because it is recommended for factor analysis with categorical outcomes (Finney &
DiStefano, 2006; Flora & Curran, 2004). Although ML is possible with the assumption of
MAR, it is not recommended for categorical variables. WLSMV uses pairwise present
for missing variables and is based on the assumption of MCAR. Since MCAR cannot be
assumed for this data, multiple imputation was performed in Mplus before using
WLSMV. Prior to analysis, negatively coded variables were reverse coded so that for all
variables higher values would be more positive.
Exploratory Factor Analysis (EFA)
Because it is not possible to conduct EFA with imputed data in Mplus,
exploratory structural equation modeling (ESEM) was conducted with the imputed data.
In an ESEM, the initial model is specified as an EFA model and all the indicator
variables are allowed to load on all the factors (Muthen & Muthen, 2008). ESEM was
done with both oblique and orthogonal rotations. GEOMIN, an oblique rotation, was
selected because it yielded fewer cross-loadings than orthogonal rotations. Oblique
rotation also makes sense conceptually, since it is expected that different aspects of the
school organizational climate are correlated.
To determine the number of factors to retain, fit statistics were compared for
ESEM with four-factor, five-factor, and six-factor models. Items were considered for
removal if they had low loadings (absolute values lower than 0.35). Since a simple

86
structure was also the objective, variables were also considered for removal if they had
loadings greater than 0.30 on more than one factor.
Confirmatory Factor Analysis (CFA)
Confirmatory factor analysis was conducted on the second half of the sample to
confirm the factor structure identified in EFA. Model fit was assessed using several fit
indices: the comparative fit index (CFI), the Tucker-Lewis Index (TLI), and the root
mean square error of approximation (RMSEA). For CFI, larger values indicate better
model fit, with values greater or equal than 0.95 considered to adequate fit (Hu &
Bentler, 1998). For RMSEA, the smaller the value the better the model fit; values less
than or equal to 0.08 indicate adequate fit (Hu & Bentler, 1998). Consistent with oblique
rotation in EFA, factors were allowed to correlate. By default, Mplus identifies the latent
variable by fixing the loading for the first observed variable for each factor to 1. For this
study, the model was identified by fixing the variance of the latent variables to 1 and
freeing the loading of the first observed variable for each factor.
Scale Reliability
Although Cronbach’s alpha is widely used to assess scale reliability, critics of the
measure point out that it is based on the assumption that the items have the same loadings
and there are no residual correlations. Cronbach’s alpha may underestimate reliability for
ordinal indicators. Ordinal alpha has been shown to estimate reliability more accurately
than Cronbach’s alpha for binary and ordinal response scales (Zumbo, Gadermann &
Zeisser, 2007; Gadermann & Zumbo, 2012). Cronbach’s alpha is routinely based on the
Pearson covariance matrix, which assumes data are continuous. Ordinal alpha is based on
87
the polychoric correlation matrix, which is more appropriate for ordinal data. For these
reasons, ordinal alpha was calculated using R.
Results
School Administrator Survey
Results of exploratory factor analysis
Fit statistics for models with four, five and six factors were examined. Fit
statistics were best for the six-factor model, and the six-factor solution also had a simple
structure (no cross-loadings). However, the six-factor model included two factors that
each had only two indicators. For this reason, the five-factor solution (which had better fit
than the four-factor solution) was chosen.
The item “Parents welcome in school” was removed because it had low loadings
(<0.20) on all factors. Once this variable was removed, fit statistics for a five-factor
model indicated adequate fit (RMSEA= 0.046; CFI=0.969; TLI=0.938). The five factors
were: General Facilities as measured by adequacy of school facilities such as the
cafeteria, computer lab and classrooms; Extracurricular Facilities consisting of the
adequacy of art, music and gym facilities; Safety, as measured by weapons, fights and
attacks; Stability as measured by student absence, teacher tardiness and teacher turnover;
and Community Support and School Order as measured by parent and community
support, teacher consensus, and order. Factor loadings for the five-factor model are
shown in Table 1.
There are two issues to note in the five-factor model. First, the highest loadings for
the items asking about the adequacy of the computer lab, auditorium and multipurpose
room were somewhat low (0.38, 0.38 and 0.32 respectively, all on the General Facilities

88
factor), but the variables were left in because they fit conceptually with other items in that
group. Second, there was cross-loading with the item asking about parents’ involvement
and the item asking about community support. Although the highest loadings for these
two variables were on the Community Support and School Order factor, they also had
loadings above 0.35 on the Safety factor. In the six-factor model, the parent involvement
and community support variables loaded on one factor, while the items dealing with
consensus in the school and order in the school and loaded on another factor. This is
likely because the former two items address climate related to external characteristics of
the school (parents and community), while the latter two address climate related to
internal school features. Although a five-factor model without the parent involvement
and community support variables had slightly better fit statistics than a five-factor model
with them, removal of these variables left a Community Support and School Order factor
with only two indicators (consensus and order in the school). For this reason, the parent
involvement and community support items were retained and assigned to the factor for
which they had the highest loadings (Community Support and School Order)
Results of confirmatory factor analysis
CFA was used to assess the model identified with ESEM. Two five-factor models
that excluded some of the low loading facilities items were also examined. Finally, a
four-factor model was examined that excluded the Community Support and School Order
factor and constituent items. Table 2 lists the fit statistics for all models. Five-factor
models excluding one or both of the variables with lower loadings on the General
Facilities factor (adequacy of auditorium and multi-purpose room) had similar fit
statistics, although RMSEA values were slightly higher. Since the loadings for these two
89
items were only slightly below 0.40, the five-factor model that included all items was
selected as it indicates adequate fit (RMSEA=0.047; CFI=0.952; TLI=0.93). Item
loadings for the five-factor model with all variables are listed in Table 3.
Table 4 provides correlations among factors, indicating low to moderate
correlation between factors indicating that although these factors describing school
facilities and policies are inter-related within each school, they are meaningfully
distinguishable and represent distinct latent variables.
Scale Reliability
As shown in Table 5, ordinal alphas indicate moderate to high internal
consistency for Extracurricular Facilities (0.84), Safety (0.79), Stability (0.74) and
Community Support & School Order (0.81). The ordinal alpha for General Facilities is
only 0.60, indicating this group of variables may be more appropriately used as an index.
The alpha is slightly higher (0.64) if items asking about the adequacy of the auditorium
and multi-purpose room, the two variables with loadings below 0.40, are removed.
Teacher Survey
Results of exploratory factor analysis
Models with four, five and six factors were examined. Of the 21 items included
in the ESEM, four items (paperwork interferes with teaching, teachers’ influence on
school policy, teachers’ control over classroom issues, parents supportive of staff) had
loadings of less than 0.35 on all factors. Although keeping different combinations of
these variables was explored, all were ultimately removed. In addition to a lack of
empirical evidence to indicate they sufficiently loaded on a factor, these variables all had
weak conceptual links to any of the possible factors. Although there was some indication
90
(both empirical and conceptual) that three of the variables, paperwork interferes with
teaching, influence on school policy, and control of school issues, loaded on a factor
related to teacher agency, the loadings were not sufficiently large. Although parents
support staff had moderate loading (0.37) on the Student Conduct factor, the theoretical
link was not strong since this item asked about the amount of parental support of the
school. The item “Many of the children I teach are not capable of learning the material I
am supposed to teach them.” had a moderate loading on the factor related to student
conduct, but the conceptual reasoning for this is somewhat weak since this item is not
specifically related to misbehavior. Instead, it asks more generally about the teacher’s
perception of students’ capability to learn what they are supposed to teach them.
“Faculty are on a mission” loaded nearly equally on both the Leadership and Staff
Collegiality factors, with a slightly higher loading on Leadership. To achieve a simple
structure, this item was removed. Removing these seven variables yielded a simple factor
structure in which the remaining 14 items loaded on four factors (see Table 6).
Three factors were consistently apparent in the ESEM and were also supported
conceptually: Student Conduct, Leadership, and Staff Collegiality. Student Conduct
consists of three items that reflect students’ misbehavior, physical conflicts and bullying.
Staff Collegiality includes three items that capture teachers’ relationships with each other
and overall morale in the school. Finally, Leadership consists of four items that measure
teachers’ perceptions of the school administrator’s leadership. The fourth factor, Teacher
Interaction, showed some indication of being two separate factors; items dealing with
frequency of meeting to discuss lesson planning and curriculum development ask about
academics-related interactions, while items dealing with frequency of meeting to discuss

91
individual children and children with special needs ask about interactions dealing with
individual children. Although a five-factor solution with two interaction factors had better
fit indices than a four-factor solution with one interaction factor, it was not possible to
have two factors with two variables each. For this reason, and because the four variables
all assessed the amount of interaction among teachers, these four variables were grouped
together as one factor (Teacher Interaction).
Results of confirmatory factor analysis
Fit statistics for all models explored in the CFA are shown in Table 7. Fit indices
indicated that the four-factor model was adequate but could be improved
(RMSEA=0.070; CFI=0.976; TLI=0.970) (Hu & Bentler, 1999). Four residual
covariances were added to the model, which indicated that a common element other than
the latent variable was present. Residual covariances were added based on similar
wording in questions for the following pairs of items: physical conflict between students
is problem in the school, bullying is a problem; frequency of meeting to discuss
individual children and children with special needs. These residual covariances improved
the model fit (RMSEA=0.034; CFI=0.995; TLI=0.993). Standardized item loadings for
the four-factor model are in Table 8.
Table 9 provides correlations among factors, indicating low to moderate
correlation between factors. These correlations indicate that although the factors are
correlated, there is adequate discriminant validity and the factors represent distinct latent
variables. The correlation between Staff Collegiality and Leadership (0.62) is higher than
expected, but item loadings support these as two distinct factors.

92
Scale Reliability
After conducting confirmatory factor analysis, the internal reliability of each scale
was assessed using ordinal alpha (Table 10). Ordinal alphas indicated the scales had
moderate to high internal reliability. Teacher Interaction (4 items) had an alpha of 0.75;
Student Conduct (3 items) had an alpha of 0.84. Staff Collegiality (3 items) had an alpha
of 0.80. Leadership (4 items) had an alpha of 0.93.
Calculating scale scores
Scale scores were calculated by averaging the values for all items in a scale.
Previous research indicates stability in school organizational climate over several years
(Brand et al., 2008). For school administrator scales, if a school responded in both the
third and fifth grade wave, an average value was calculated based on the two responses.
For the teacher scales, it was first necessary to determine if it was appropriate to
aggregate values for all teachers in a school to create a school-level score. After
determining sufficient between-school variance (described below), responses from third
and fifth grade teachers within the same schools were combined. The school-level scale
score was determined by summing the responses from all teachers in a school (from both
the third grade and fifth grade survey administration) and dividing by the total number of
teachers contributing data for that school. To facilitate interpretation, scale scores were
standardized to have a mean of zero and standard deviation of one.
School-level Aggregation of teacher responses
For this data, there were an average of 5 teachers per school (combining teachers
that completed the survey in both the third and fifth grade waves of the ECLS-K). As
shown in Table 11, scale ICCs for this data ranged between 0.17 and 0.36, indicating a
93
moderate proportion of variance in scale scores was due to between school variance and
warranting school-level aggregation of teacher scores. These ICCs are similar to those
found in other school climate studies that have aggregated teacher responses at the
school-level (Brand et al., 2008; Gottfredson et al., 2005; van Horn, 2003). The Job
Satisfaction scale and Preparation scale, which consist of items excluded because they
measured more individual characteristics, have much lower ICCs than the scales included
in this study (0.06 and 0.09). The lower ICCs for these two scales indicate these items do
in fact measure more individual teacher characteristics, rather than a consistent school-
level feature, and confirm both the decision to omit them from this study and the validity
of aggregating the teachers’ responses within schools. These variables would, however,
be relevant for a study examining teacher characteristics.
Discussion
This study used ESEM to identify, and confirmatory factor analysis to confirm,
school organizational climate scales consisting of items in the administrator and teacher
surveys of the third and fifth grade waves of the ECLS-K. The five-factor model for the
administrator survey included the following factors: General Facilities, Extracurricular
Facilities, Safety, Stability, and Community Support and School Order. All scales except
General Facilities had acceptable internal reliability. It may be more appropriate to use
the General Facilities factor as an index rather than a scale. There were also three
variables on this factor that had loadings below 0.40, indicating they may not contribute
significantly to the latent variable. Although these variables fit conceptually with this
factor, it may not be necessary to include them. The teacher survey had a four-factor
model consisting of: Teacher Interaction, Staff Collegiality, Student Conduct and

94
Leadership. It is important to note that for the teacher survey, in order to achieve a
simple structure with adequate loadings (>0.35) it was necessary to remove items from
the factor analysis. Even though these items did not fit in the factor structure, they reflect
concepts shown to be relevant in previous research, including expectations of students,
and teacher control and influence (Hoy & Hannum, 1997; Goddard et al., 2000).
The scales identified in this study have both similarities and differences with
scales from other staff surveys that assess school climate. Overall, the scales identified in
this study reflect several key constructs also captured in the OHI-E and School-Level
Environment Questionnaire (SLEQ), two of the most accepted and frequently used staff
climate surveys. These constructs include school resources, teacher collegiality, student
behavior, school leadership, and relationships with parents and the surrounding
community. Although items in the ECLS-K represent similar constructs, the scales
identified in this study have 3-5 items, while scales in the OHI-E and SLEQ have
approximately 5-10 items. While this difference is reasonable given the many
components and large sample size of the ELCS-K, the constructs are likely measured
with less detail and depth. Although more items can increase the internal reliability and
improve construct validity, even with the relatively small number of items, scale internal
reliability for the scales identified in this study was generally good.
Like the OHI-E and SLEQ, items from the ECLS-K ask about the adequacy of
facilities. However, these questions are asked only of the administrator and only about
school-level facilities. Unlike the OHI-E and SLEQ, there are no items regarding the
adequacy of teachers’ supplies and educational materials. Another similarity with the
OHI-E and SLEQ is the Staff Collegiality scale in this study. This scale is similar to Staff
95
Affiliation in the OHI and Affiliation in the SLEQ. Items in the Teacher Interaction scale
are similar to some of the items in the SLEQ Professional Interest scale, although this
scale has a broader focus and also includes items related to involvement in professional
development in general. Leadership in this study is similar to Collegial Leadership in the
OHI. It is also important to note the relatively high correlation between Staff Collegiality
and Leadership in this study. While results of the ESEM And CFA confirm that they are
two separate factors, it is not surprising that they are so highly correlated since leadership
is expected to influence how staff interact with each other. Like the OHI and SLEQ, the
ECLS-K includes items about staff perceptions of students’ behavior. Specifically, the
Student Conduct scale identified in this study includes items similar to those in the
Student Support scale of the SLEQ. The Student Conduct scale does not include items
related to students’ academic behaviors, such as those included in the Academic
Emphasis scale of the OHI and Student Support scale of the SLEQ. The Community
Support and School Order scale aligns with several scales in the OHI-E and SLEQ,
reflecting the somewhat multi-dimensional nature of this scale. For example, one item is
similar to items in the SLEQ’s Mission Consensus scale and another item is like one in
the OHI-E Academic Emphasis scale. Although there are two items related to community
and parental support, they are framed more positively than similar questions in the OHI
and SLEQ, which ask about the ability to deal with pressures from parents and the
community. Several of the items that were removed because of low loadings were similar
to items in the Participatory decision-making scale of the SLEQ.
The Stability and Safety scales identified in this study include items not found in
the OHI-E and SLEQ. It may be that these two scales measure constructs that act as
96
components as well as predictors or outcomes of school organizational climate (Johnson,
2009). For example, Bevans et al. (2007) examined faculty turnover and student mobility
as predictors of school organizational climate, both of which were included in the
Stability scale of this study. They also examined the school suspension rate, which is
likely related to items in the Safety scale, as an indicator of school performance and
possible outcome of school organizational climate.
Although ICCs for the teacher survey factors supported aggregating teacher
responses by school, there are no clear guidelines for determining if a school climate
measure assesses a school-level or individual-level construct. Additionally, the average
number of teachers per school (combining the third grade and fifth grade waves of the
ECLS-K) is approximately five. A larger number of teachers per school would be
preferable to improve reliability of these measures.
Implications for future research
The study used items on the teacher and administrator questionnaires from the
third and fifth grade waves of the ECLS-K. Although there are similar items in other
waves, the questionnaires for kindergarten, first and eighth grade are slightly different
and additional research is needed to determine the factor structure for these surveys.
While a large body of research has examined student-perceived school climate, there is a
need to better understand school climate as perceived by staff (Mitchell et al., 2010).
Results from this study provide scales that can be used in future studies using ECLS-K
data to examine school organizational climate constructs. Given previous research linking
aspects of the school organizational climate to students’ outcomes, future research could
explore the relationship between scale scores and other school characteristics, such as the

97
variation in scale scores by school Title 1 status, urbanicity and minority enrollment. The
identification of these scales also provides an important starting point for better
understanding the role of the school environment in children’s development, particularly
because of the wealth of data in the ECLS-K, including longitudinal data about students’
academic and socio-emotional outcomes.
98
References
Bevans, K., Bradshaw, C., Miech, R., Leaf, P. (2007). Staff- and School-Level Predictors of School Organizational Health: A Multilevel Analysis. Journal of School Health, 77, 294-302.
Brand, S., Felner, R.D., Seitsinger, A., Burns, A., Bolton, N. (2008). A large scale study
of the assessment of the social environment of middle and secondary schools: The validity and utility of teachers’ ratings of school climate, cultural pluralism, and safety problems for understanding school effects and school improvement. Journal of School Psychology, 46: 507-535.
Brown, B.V. & Bogard, K.B. (2007). Pre-Kindergarten to 3rdGrade (PK-3) School-Based
Resources and Third Grade Outcomes. CrossCurrents. Issue 5. #2007-27. Washington, DC: ChildTrends.
Finney, S.J., DiStefano, C. (2006). Non-normal and categorical data in structural equation
modeling. In: Hancock, G.R., Mueller, R.O. (Eds.), Structural Equation Modeling: A Second Course. IAP Information Age Publishing, pp. 269–314.
Flora, D.B., Curran, P.J. (2004). An empirical evaluation of alternative methods of
estimation for confirmatory factor analysis with ordinal data. Psychological Methods, 9 (4), 466–491.
Gadermann, A.M., Guhn, M., & Zumbo, B.D. (2012). Estimating ordinal reliability for
Likert-type and ordinal item response data: A conceptual, empirical, and practical guide. Practical Assessment, Research and Evaluation, 17, 1-13.
Goddard, R. D., Sweetland, S. R., & Hoy, W. K. middle school. (2000). Academic
emphasis of urban elementary schools and student achievement in reading and mathematics: A multilevel analysis. Educational Administration Quarterly, 36(5), 683-702.
Gottfredson, G. D., Gottfredson, D. C., Payne, A. A., & Gottfredson, N. C. (2005).
School climate predictors of school disorder: Results from a national study of delinquency prevention in schools. Journal of Research in Crime and Delinquency, 42, 412–444.
Griffith, J. (2006). A Compositional Analysis of the Organizational Climate-Performance
Relation: Public Schools as Organizations. Journal of Applied Social Psychology, 36 (8), 1848-1880.
Halpin, A.W., & Croft, D. B. (1963). The organizational climate of schools. Chicago:
Midwest Administration Center of the University of Chicago.

99
Hamilton, L.S. & Guarino, C.M. (2004). Measuring the Practices, Philosophies, and Characteristics of Kindergarten Teachers. Working Paper Prepared for the National Center for Education Statistics. WR-199-EDU.
Hoy, W. K., & Hannum, J. W. (1997). Middle school climate: An empirical assessment
of organizational health and student achievement. Educational Administration Quarterly, 33, 290–311.
Hoy, W.K., Tarter, C.J., Kottkamp, R.B. (1991). Open Schools/Healthy Schools:
Measuring Organizational Climate. Beverly Hills, CA: Sage Publications. Hoy W.K., Tarter CJ. (1997). The Road to Open and Healthy Schools: A Handbook for
Change, Elementary Edition. Thousand Oaks, CA:Corwin Press. Hu, L., & Bentler, P. M. (1998). Fit indices in covariance structure modeling: Sensitivity
to underparameterized model misspecification. Psychological Methods, 3, 424−453.
James, L. R., Joyce, W. F., & Slocum, J. W. (1988). Organizations do not cognize.
Academy of Order Review, 19(1), 129-132. Johnson, B. & Stevens, J.J. (2006). Student achievement and elementary teachers’
perceptions of school climate. Learning Environment Research, 9, 111-122. Judge, T. A., Thorensen, C. J., Bono, J. E., & Patton, G. K. (2001). The job satisfaction-
job performance relationship: A qualitative and quantitative review. Psychological Bulletin, 127(3), 376-407.
Kopelman, R. E., Brief, A. P., & Guzzo, R. A. (1990). The role of climate and culture in
productivity. In B. Schneider (Ed.), Organizational climate and culture (pp. 282-318). San Francisco: Jossey-Bass.
Lee, V.; Burkham, D. Inequality at the starting gate. Washington, DC: Economic Policy
Institute; 2002. Miller, S. I., & Fredericks, J. (1990). The false ontology of school climate effects. Educational Theory, 40(3), 333-342.
Mitchell, M.M., Bradshaw, C.P. & Leaf, P.J. (2010). Student and Teacher Perceptions of
School Climate: A Multilevel Exploration of Patterns of Discrepancy. Journal of School Health, 80, 271-279.
Mplus Class Notes Freeing, Constraining, and Testing Parameters. UCLA: Statistical
Consulting Group. From http://www.ats.ucla.edu/stat/mplus/seminars/introMplus_part2/ additional.htm (accessed January 20, 2013).

100
Muthén, L., Muthén, B., 2008. Mplus User’s Guide. Muthén & Muthén, Los Angeles. Parsons, T. (1967). Some ingredients of a general theory of formal organization. In A.W.
Halpin (Ed.), Administrative theory in education (pp. 40-72). New York: Macmillan.
Reichers, A. E., & Schneider, B. (1990). Climate and culture: An evolution of constructs.
In B. Schneider (Ed.), Organizational climate and culture (pp. 5-39). San Francisco: Jossey-Bass.
Roeser, R. W. (2001). To cultivate the positive…introduction to the special issue on
schooling and mental health issues. Journal of School Psychology, 39, 99-110. Sirotnik, K. A. (1980). Psychometric implications of the unit-of-analysis problem.
Journal of Educational Measurement,17, 245-282. Taylor, D.L. & Tashakkori, (1995). Decision participation and school climate as
predictors of job satisfaction and teachers sense of efficacy. Journal of Experimental Education, 63(3), 217–230.
Tobin, T.J., Muller, R.O. & Turner, L.M. (2006). Organizational learning and climate as
predictors of self-efficacy. Social Psychology of Education, 9, 301-319. Tourangeau, K., Nord, C., Lê, T., Sorongon, A. G., and Najarian, M. (2009). Early
Childhood Longitudinal Study, Kindergarten Class of 1998–99 (ECLS-K), Combined User’s Manual for the ECLS-K Eighth-Grade and K–8 Full Sample Data Files and Electronic Codebooks (NCES 2009–004). National Center for Education Statistics, Institute of Education Sciences, U.S. Department o Education. Washington, DC.
van Horn, M.L. (2003). Assessing the Unit of Measurement for School Climate through
Psychometric and Outcome Analyses of the School Climate Survey. Educational and Psychological Measurement, 63(6), 1002-1019.
Zumbo, B.D., Gadermann, A. M., & Zeisser, C. (2007). Ordinal versions of coefficients
alpha and theta for Likert rating scales. Journal of Modern Applied Statistical Methods, 6, 21-29.
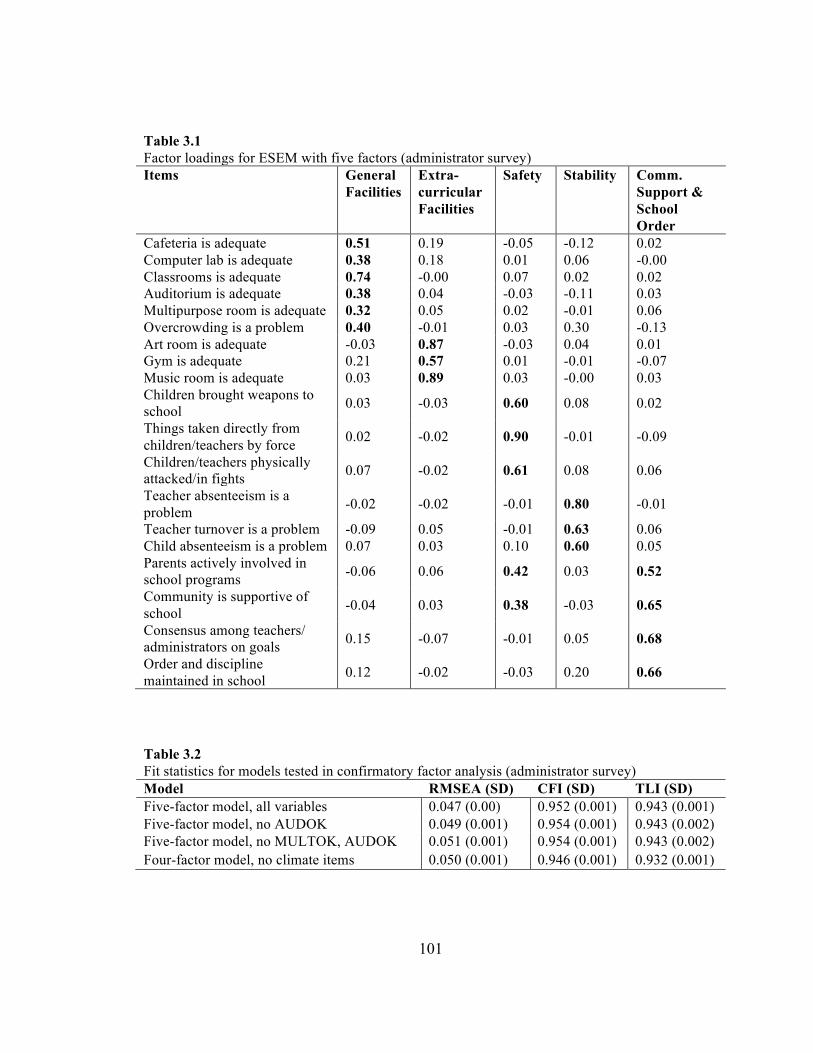
101
Table 3.1 Factor loadings for ESEM with five factors (administrator survey) Items General
Facilities Extra- curricular Facilities
Safety Stability Comm. Support & School Order
Cafeteria is adequate 0.51 0.19 -0.05 -0.12 0.02 Computer lab is adequate 0.38 0.18 0.01 0.06 -0.00 Classrooms is adequate 0.74 -0.00 0.07 0.02 0.02 Auditorium is adequate 0.38 0.04 -0.03 -0.11 0.03 Multipurpose room is adequate 0.32 0.05 0.02 -0.01 0.06 Overcrowding is a problem 0.40 -0.01 0.03 0.30 -0.13 Art room is adequate -0.03 0.87 -0.03 0.04 0.01 Gym is adequate 0.21 0.57 0.01 -0.01 -0.07 Music room is adequate 0.03 0.89 0.03 -0.00 0.03 Children brought weapons to school 0.03 -0.03 0.60 0.08 0.02
Things taken directly from children/teachers by force 0.02 -0.02 0.90 -0.01 -0.09
Children/teachers physically attacked/in fights 0.07 -0.02 0.61 0.08 0.06
Teacher absenteeism is a problem -0.02 -0.02 -0.01 0.80 -0.01
Teacher turnover is a problem -0.09 0.05 -0.01 0.63 0.06 Child absenteeism is a problem 0.07 0.03 0.10 0.60 0.05 Parents actively involved in school programs -0.06 0.06 0.42 0.03 0.52
Community is supportive of school -0.04 0.03 0.38 -0.03 0.65
Consensus among teachers/ administrators on goals 0.15 -0.07 -0.01 0.05 0.68
Order and discipline maintained in school 0.12 -0.02 -0.03 0.20 0.66
!!!Table 3.2 Fit statistics for models tested in confirmatory factor analysis (administrator survey) Model RMSEA (SD) CFI (SD) TLI (SD) Five-factor model, all variables 0.047 (0.00) 0.952 (0.001) 0.943 (0.001) Five-factor model, no AUDOK 0.049 (0.001) 0.954 (0.001) 0.943 (0.002) Five-factor model, no MULTOK, AUDOK 0.051 (0.001) 0.954 (0.001) 0.943 (0.002) Four-factor model, no climate items 0.050 (0.001) 0.946 (0.001) 0.932 (0.001)

102
!Table 3.3 Standardized item loadings for confirmatory factor analysis (administrator survey) Scale Items Item
Loading General Facilities
In general, how adequate are the classrooms for meeting the needs of children in your school?
0.72
In general, how adequate is the computer lab for meeting the needs of children in your school?
0.54
In general, how adequate is the cafeteria for meeting the needs of children in your school?
0.50
Overcrowding is a problem at this school 0.48 In general, how adequate is the multi-purpose room for meeting
the needs of children in your school? 0.39
In general, how adequate is the auditorium for meeting the needs of children in your school?
0.31
Extracurricular Facilities
In general, how adequate is the music room for meeting the needs of children in your school?
0.90
In general, how adequate is the art room for meeting the needs of children in your school?
0.86
In general, how adequate is the gym for meeting the needs of children in your school?
0.67
Safety During this school year, have children or teachers been
physically attacked or involved in fights? 0.83
Have things been taken directly from children/teachers by force/threat of force at school or to/from school?
0.74
During this school year, have children brought weapons to school?
0.60
Stability Teacher absenteeism is a problem at this school. 0.69 Child absenteeism is a problem at this school. 0.69 Teacher turnover is a problem at this school. 0.68 Community Support & School Order
The community served by this school is supportive of its goals and activities.
0.80
Order and discipline are maintained satisfactorily in the building(s).
0.79
There is consensus among administrators and teachers on goals and expectations.
0.70
Parents are actively involved in this school's programs. 0.68

103
Table 3.4 Correlations among factors (administrator survey) General
Facilities Extra-curricular Facilities
Safety Stability Community Support & School Order
General Facilities 1 Extracurricular Facilities
0.58 1
Safety 0.27 0.09 1 Stability 0.31 0.16 0.51 1 Community Support & School Order
0.31 0.17 0.50 0.62 1
Table 3.5 Scale reliabilities (administrator survey) Scale Number of Items Ordinal Alpha General Facilities 6 0.60 General Facilities (no AUDOK or MULTOK) 4 0.64 Extracurricular Facilities 3 0.84 Safety 3 0.79 Stability 3 0.74 Community Support & School Order 4 0.81
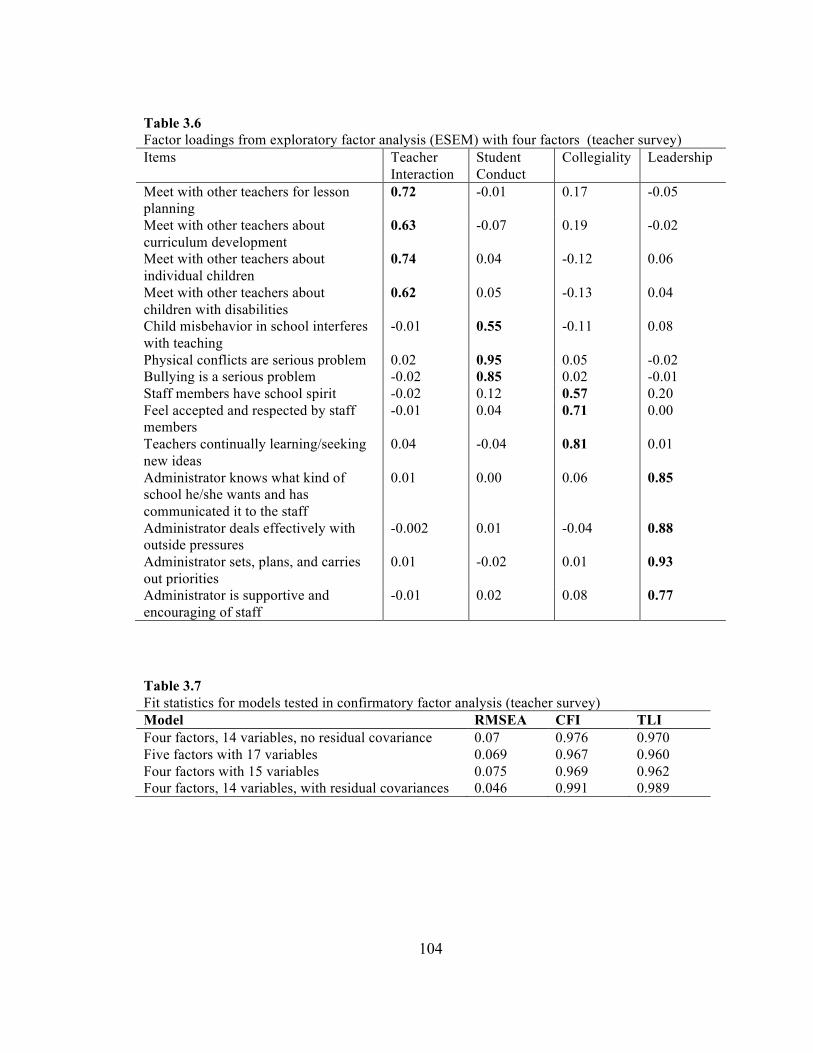
104
!Table 3.6 Factor loadings from exploratory factor analysis (ESEM) with four factors (teacher survey) Items Teacher
Interaction Student Conduct
Collegiality Leadership
Meet with other teachers for lesson planning
0.72 -0.01 0.17 -0.05
Meet with other teachers about curriculum development
0.63 -0.07 0.19 -0.02
Meet with other teachers about individual children
0.74 0.04 -0.12 0.06
Meet with other teachers about children with disabilities
0.62 0.05 -0.13 0.04
Child misbehavior in school interferes with teaching
-0.01 0.55 -0.11 0.08
Physical conflicts are serious problem 0.02 0.95 0.05 -0.02 Bullying is a serious problem -0.02 0.85 0.02 -0.01 Staff members have school spirit -0.02 0.12 0.57 0.20 Feel accepted and respected by staff members
-0.01 0.04 0.71 0.00
Teachers continually learning/seeking new ideas
0.04 -0.04 0.81 0.01
Administrator knows what kind of school he/she wants and has communicated it to the staff
0.01 0.00 0.06 0.85
Administrator deals effectively with outside pressures
-0.002 0.01 -0.04 0.88
Administrator sets, plans, and carries out priorities
0.01 -0.02 0.01 0.93
Administrator is supportive and encouraging of staff
-0.01 0.02 0.08 0.77
!!!Table 3.7 Fit statistics for models tested in confirmatory factor analysis (teacher survey) Model RMSEA CFI TLI Four factors, 14 variables, no residual covariance 0.07 0.976 0.970 Five factors with 17 variables 0.069 0.967 0.960 Four factors with 15 variables 0.075 0.969 0.962 Four factors, 14 variables, with residual covariances 0.046 0.991 0.989 !
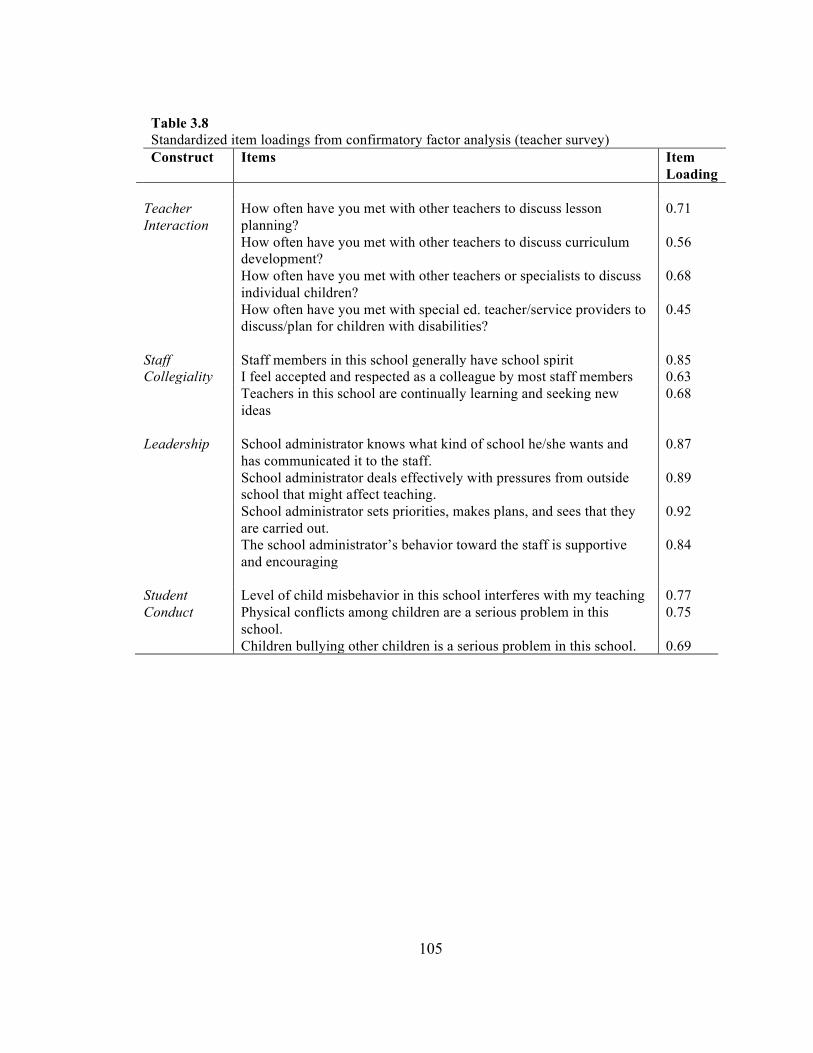
105
!Table 3.8 Standardized item loadings from confirmatory factor analysis (teacher survey) Construct Items Item
Loading Teacher Interaction
How often have you met with other teachers to discuss lesson planning?
0.71
How often have you met with other teachers to discuss curriculum development?
0.56
How often have you met with other teachers or specialists to discuss individual children?
0.68
How often have you met with special ed. teacher/service providers to discuss/plan for children with disabilities?
0.45
Staff Staff members in this school generally have school spirit 0.85 Collegiality I feel accepted and respected as a colleague by most staff members 0.63 Teachers in this school are continually learning and seeking new
ideas 0.68
Leadership School administrator knows what kind of school he/she wants and
has communicated it to the staff. 0.87
School administrator deals effectively with pressures from outside school that might affect teaching.
0.89
School administrator sets priorities, makes plans, and sees that they are carried out.
0.92
The school administrator’s behavior toward the staff is supportive and encouraging
0.84
Student Conduct
Level of child misbehavior in this school interferes with my teaching 0.77 Physical conflicts among children are a serious problem in this school.
0.75
Children bullying other children is a serious problem in this school. 0.69

106
Table 3.9 Correlations among factors (teacher survey) Teacher
Interaction Staff Collegiality
Leadership Student Conduct
Teacher Interaction 1 Staff Collegiality .30 1 Leadership 0.17 0.62 1 Student Conduct 0.03 0.47 0.41 1
!Table 3.10 Scale Reliabilities (teacher survey) Scale Number of Items Ordinal Alpha Teacher Interaction 4 0.75 Staff Collegiality 3 0.80 Leadership 4 0.93 Student Conduct 3 0.84
Table 3.11 Scale ICCs (teacher survey) Scale ICC (95% CI) Teacher Interaction 0.21 (0.18, 0.23) Staff Collegiality 0.17 (0.15, 0.20) Leadership 0.22 (0.19, 0.24) Student Conduct 0.36 (0.33, 0.39) Job Satisfaction 0.06 (0.04, 0.08) Preparation 0.09 (0.07, 0.11) *N=6,772; n=5; all significant at p<0.0001

107
Chapter Four
School Organizational Climate and
Students’ Socio-emotional Outcomes in Elementary School

108
Abstract Background: Behavior problems and poor social skills in elementary school are
associated with academic and social difficulties in the early years, and later consequences
including educational failure, unemployment, psychiatric problems, and criminality.
Researchers and policy makers have acknowledged this relationship between socio-
emotional and academic outcomes; there is growing interest in better integrating mental
health and educational efforts. Given the influence of work environment on staff
performance, more research is needed that examines the relationship between staff
perceptions of the school environment and students’ outcomes.
Methods: Using data from the Early Childhood Longitudinal Study-Kindergarten Class
(ECLS-K), multilevel multivariate regression models with 9,173 fifth grade students
nested in 1,523 schools were estimated to examine the relationship between nine school
organizational climate factors and students’ socio-emotional outcomes, controlling for
third grade socio-emotional outcomes, student, family, and teacher characteristics and
school composition variables. Cross-level interaction terms were used to examine
moderation by student-level risk.
Results: Better school-wide Student Conduct as perceived by teachers and greater
Community Support and School Order as perceived by administrators were associated
with lower levels of externalizing behaviors and higher levels of social skills in students.
Some of these relationships were moderated by student socio-economic status, such that
the relationship was strongest for students from families in the two lowest SES quintiles.
Conclusion: Findings highlight the importance of school-wide interventions such as
Positive Behavior Interventions and Supports that aim to improve school-wide behavior
109
and prevent bullying and suggest that the impact of improving the school environment
may be greatest for students from lower income families.

110
Introduction
Behavior problems and poor social skills in elementary school can lead to
academic and social difficulties in the early years, and later consequences such as
educational failure, unemployment, psychiatric problems, and criminality (Moffitt, 2006;
Roeser, 2001; Kessler et al., 2005; Schaeffer, 2003). Intervening early is crucial because
social behaviors become more difficult to change as children get older (Caspi et al., 1987;
Loeber, 1990, Kazdin, 1997). Schools have the potential to exert powerful positive
influences on children’s socio-emotional development. Researchers and policy makers’
recognition of the relationship between socio-emotional and academic outcomes has led
to effective school-based interventions (Kataoka et al., 2009; Hoagwood et al., 2007), but
many interventions are classroom-based and dependent on teachers’ implementation
(NRC & IOM, 2009; Walker et al., 1995). In addition to structured interventions, there is
a need to build on schools’ existing resources and foster organizational contexts that
promote positive psychological development and learning.
A growing body of school-based research seeks to understand and address
system-level factors that can positively shape children’s social and behavioral
competence in a sustainable manner. It is particularly important to identify protective
factors for students at increased risk of poor socio-emotional development, including
those from poor families and those with previous behavior problems. School
characteristics such as the aggregate level of poverty have been identified as risk factors
for poor socio-emotional outcomes, but compositional factors such as these are not
modifiable (Battistich et al., 1995; Hoglund et al., 2004).

111
This study examined the effects of the staff-perceived school environment on
students’ socio-emotional outcomes in fifth grade, controlling for third grade social and
emotional functioning. Research in organizational psychology has demonstrated the
importance of one’s work environment on performance and behavior (Moffitt, 2006).
There is evidence that dimensions of the school organizational climate, particularly
leadership and safety, have an impact on academic achievement, primarily due to the
mediating effect of teacher behaviors (Roeser, 2001; Kessler et al., 2005). However, there
is a lack of research examining how the school organizational climate affects students’
socio-emotional development, especially among elementary school students. As with
academic achievement, school organizational climate is likely to have an impact on
students’ socio-emotional outcomes by affecting how teachers relate to their students.
There has been increasing interest in interventions that aim to make school-level
changes to promote students’ development. There is also greater acknowledgement of the
importance of teachers’ perceptions of the school environment, which has led to more
school and district level surveys that assess staff perceptions of the school environment.
These trends make it particularly important to identify elements of the school
organizational climate that matter most for students’ socio-emotional development.
Additionally, although previous studies have found that schools explain a relatively small
proportion of the variance in students’ outcomes (Denny, 2011; Sellstrom & Bremberg,
2006), the school organizational climate may be particularly important for students who
are already at increased risk for mental health problems due to low socioeconomic status
or existing externalizing behavior problems.

112
Socio-emotional outcomes in middle childhood
Middle childhood, the period between early childhood and adolescence, is an
important time in children’s development. It is the period during which children
transition into formal schooling; contexts other than the family, such as school and peers,
become increasingly influential. During this period, children’s cognitive, academic and
socio-emotional skills develop; development during this time can both alter detrimental
trajectories initiated in early childhood and establish successful trajectories moving
forward into adolescence (Schaffer, 2002).
Indicators of children’s socio-emotional development include both negative
behavior problems and positive social skills. Children’s socio-emotional and behavioral
problems commonly fall into two categories: externalizing behaviors and internalizing
behaviors (Achenbach, 1991; Gumpel, 2010). Externalizing behaviors are characterized
by overactive, impulsive, and aggressive behaviors. Internalizing behaviors include
depressive, anxiety-related symptoms and social withdrawal (Reynolds, 2010). It is
estimated that each year, 20% of American children and adolescents experience a mental
disorder that is at least mildly impairing of their everyday functioning and 5-9% are
diagnosed with an emotional disturbance that interferes with their educational attainment
(US DHHS, 1999). Although there are specific disorders and diagnoses associated with
both externalizing and internalizing behaviors, even children without an identified
disorder have an increased risk of mental health problems and difficulties adjusting
(Bukowski & Adams, 2005).
Although preventing the development of internalizing and externalizing behaviors
is an important goal, it is not sufficient. Positive social skills are a crucial component of

113
children’s development. Positive mental health and social competence in children
involves the ability to achieve developmentally appropriate tasks and adapt to new tasks
in different social contexts, as well as a positive sense of self-esteem, well-being and
social inclusion (NRC & IOM, 2009; Kellam et al., 1975). Specifically in middle
childhood, competent functioning has been defined as academic achievement, appropriate
behavior, and positive peer relations (Masten & Coatsworth, 1995).
Significance of socio-emotional outcomes in middle childhood
Socio-emotional outcomes in middle childhood can affect a child’s behavioral
development and academic success (Roeser, 2001), as well as outcomes in adolescence
and adulthood. Intervening early is crucial because these internalizing and externalizing
behaviors become more difficult to change as children get older and can become resistant
to intervention (Campbell et al, 2002; Hawkins et al., 2001, Hawkins et al., 2005; Stiles
2000; Walker, Colvin, & Ramsey, 1995).
Children with externalizing behavior problems are more likely to be less engaged
in school, to do less well academically, and to develop conduct problems (Barriga et al.,
2002). Internalizing behaviors in childhood are associated with academic
underachievement and poor problem-solving skills (Kovacs & Devlin, 1998). Poor social
skills and externalizing and internalizing behaviors in childhood can compound over time
and have effects into adulthood, such as increased risk of educational failure,
unemployment, psychiatric problems and criminality (Broidy et al, 2003; Fergusson &
Horwood, 1998; Burt et al., 2008; Nock & Kazdin, 2002; Roza et al., 2003; Caspi et al.,
1987; Loeber, 1990). Positive social skills children develop in middle childhood are
linked with success in school and other contexts, and there is continuity of positive social

114
skills from middle childhood into adolescence and adulthood (Ladd and Burgess 1999;
Collins & van Dulman, 2006).
Children with poor social skills and externalizing and internalizing behaviors are
at risk for academic problems for several reasons. Mental health problems are associated
with absenteeism, higher rates of suspension and expulsion, lower grades and test scores,
and high school dropout (Ensminger, 1992; Hinshaw et al., 1992; Needham et al., 2004;
Reid et al., 2004; Gutman et al., 2003). Children with negative behaviors may also have
difficulty getting along with peers and teachers and following school rules (Gunter et al.,
1993; Gunter et al.,1994). For example, a student who has difficulty managing anger may
be more likely to be suspended or expelled, and this school absence can have an effect on
academic achievement (Birnbaum et al., 2003).
Role of schools in children’s socio-emotional development
While there are many factors and contexts that contribute to socio-emotional
development in middle childhood, the role of schools is of particular interest because of
the amount of time children spend in schools, as well the role of schools in socialization.
Schools can be a normative context in which children have the opportunity to receive
supports to help prevent the development of behavior problems (Baker et al., 2008;
Bronfenbrenner, 1979), such as through relationships with competent and caring adults
and mastery experiences to build self-efficacy (Masten, 2003). School provides an
optimal environment for children to accomplish developmental tasks such as academic
achievement, rule compliance and development of peer relations (NRC & IOM, 2009).
Achievement of these tasks can be affected by school characteristics such as teacher
behavior, organizational health, school connectedness, and family-school relations (NRC
115
& IOM, 2009). Intervention studies have demonstrated the interconnectedness of
educational and socio-emotional outcomes. For example, a program focused on school
bonding and achievement led to a reduction in risky behavior (Catalano et al., 1999).
Although the primary focus of schools is on educational outcomes, there has been
growing acknowledgement of the role of schools in promoting positive development of
other youth outcomes, including socio-emotional health (Masten, 2003; Atkins et al.,
2010).
School organizational climate and socio-emotional outcomes
First, it is important to note that although schools play an increasing role in
children’s development beginning in elementary school, individual and family factors
continue to play a significant role. Past studies have found that schools typically account
for approximately 10% of the variance in students’ outcomes (Mortimore, 1995; Wilcox
& Clayton, 2001; Sellstrom & Bremberg, 2006). Although this proportion of variance is
relatively small, identifying important school predictors is still valuable because they tend
to be more malleable than family and individual variables (Rowan et al., 1983).
Previous research has primarily examined the relationship between student-
reported school climate and socio-emotional outcomes, and shown an association
between students’ perceptions of the school environment and students’ psychological and
behavioral outcomes. Most of this research has been done in middle schools and high
schools, ages at which students are more able to provide reports on their school
environment. Dimensions of the (student-perceived) school environment that have been
shown to be associated with adolescent students’ socio-emotional development include:
teacher support, peer support, student autonomy, and clarity and consistency in school

116
rules (Brand et al., 2003; Kuperminc et al. 1997; Roeser et al. 1998; Way and Robinson
2003; Way et al. 2007). Although much of this research has been cross-sectional, there
have also been longitudinal studies, such as Roeser et al.’s (1998) findings that students’
perceptions of their school environment in seventh grade predicted change over time in
emotional functioning from seventh to eighth grade, after accounting for demographic
characteristics.
Few studies have examined the relationship between the (staff-perceived) school
organizational climate and students’ socio-emotional outcomes, particularly in
elementary school. Previous studies have found teacher well-being, satisfaction and
commitment to be associated with student drop-out, attendance and disciplinary problems
(Brand, 2008; Denny, 2011; Leblanc et al, 2008; Ostroff, 1992). However, not all of these
studies have used multilevel modeling to account for clustering of students within schools
or sufficiently accounted for other risk factors. School organizational climate may also
mediate the effect of school-level interventions on students’ behaviors. Bradshaw et al.
(2008) found that a school-wide intervention, Positive Behavioral Interventions and
Supports (PBIS), was associated with improvements in school organizational health.
Previous research on the school organizational climate has primarily focused on
the effects on students’ academic achievement. For example, school safety, strong
principal leadership, and adequate school resources have all been shown to be associated
with higher levels of student achievement (Johnson & Stevens, 2006; Hoy & Hannum,
1997). High academic standards and a supportive work atmosphere for teachers are also
associated with better achievement, largely due to teachers doing more to promote
student learning (Hoy & Hannum, 1997). There is some evidence that organizational
117
climate is associated with student absenteeism and school suspensions (Bevans et al.,
2007; Gottfredson etal., 2005). Teacher behaviors, particularly teachers’ interactions with
students and the teacher-student relationship, are also a likely mediator of the relationship
between school organizational climate and students’ socio-emotional outcomes. There is
ample evidence that high-quality teacher-student relationships in elementary school,
characterized by high levels of warmth and closeness and low levels of conflict, are
associated with lower levels of externalizing and internalizing behaviors, and better social
skills (Pianta & Nimetz, 1991; Birch & Ladd, 1998; Henricsson & Rydell, 2004;
Maldonado-Carreno & Votruba-Drzal, 2011). Support for teachers, both from the
administration and other teachers, can increase their ability and commitment to address
students’ emotional and behavioral needs (Cheney et al., 2002). There is also evidence
from research involving other organizations serving children of the link between
organizational climate, provider behavior and ultimately child outcomes. For example,
Glisson et al. (1998) studied children entering state custody and their caseworkers, and
found a relationship between good organizational climate in public children’s service
agencies, high service quality, and better child psychosocial functioning.
Interaction between school and individual characteristics
There is some evidence that students’ poverty level and behaviors moderate
school-level and teacher-level effects on students’ socio-emotional outcomes. In a meta-
analysis of school-based interventions to prevent aggressive behaviors, Wilson and
Lipsey (2007) found that individual students’ socioeconomic status moderated the effect
of universal school programs on students’ outcomes, with the largest effects for children
with low socioeconomic status. For selected/indicated programs, the largest effects were
118
for children who already exhibited problem behaviors. In cross-sectional research,
Kuperminc et al. (1997, 2001) found a positive school climate to be particularly
beneficial for boys from low-income families. Several longitudinal studies have found
that the beneficial effects of support from school staff and warm and supportive
relationships with teachers are greater among poor youth (Dubois et al., 1992; Dubois et
al., 1994).
Research Aims
The purpose of this study was to use data from the ECLS-K to assess the
relationship between dimensions of the school organizational climate and students’ socio-
emotional outcomes in fifth grade, controlling for third grade behaviors, other individual
student and family characteristics, school composition, and teacher characteristics. A
secondary aim was to determine if this relationship varied based on student-level risk as
measured by socio-economic status and third-grade externalizing behaviors.
Methods
Data for this study came from the Early Childhood Longitudinal Study-
Kindergarten Class (ECLS-K), which is maintained by the National Center for Education
Statistics (NCES). The ECLS-K selected a nationally representative sample of
kindergarten students in the fall of 1998 and followed those students through eighth grade
(Tourangeau et al., 2009). Children in the study represent diverse socioeconomic and
racial/ethnic backgrounds and were selected from public and private, and both half- and
full-day, kindergarten classes. The sample was selected using a multistage probability
sample design, beginning with 100 primary sampling units (counties or groups of
counties), then 1,280 schools, and finally 22,666 students. The probability of school
119
selection was proportional to a weighted measure of size based on the number of
kindergarteners enrolled. Public and private schools were distinct sampling strata.
Schools were sorted within each stratum to achieve sample representation across other
characteristics. The initial sample of kindergarten students included approximately 953
public schools and 460 private schools.
The sample for this study was restricted to children in ECLS-K who attended the
same school for third and fifth grade because the school context was the predictor of
interest and therefore needed to remain constant. The sample included students who
attended public and private schools, resulting in a final sample of 9,173 fifth grade
students nested in 1,523 schools.
This study used data collected in the spring of the third and fifth grade years from
multiple sources, including parent interviews, self-administered teacher questionnaires,
teacher assessments of children, self-administered principal questionnaires, child
assessments, third-party observations, and student records. Information about the home
environment and demographic variables came from parent interviews, which were
computer assisted interviews conducted by telephone. Teachers completed self-
administered questionnaires, which assessed school and classroom characteristics,
instructional practices, and teacher background. Teachers also completed individual
assessments for each child in the study.
The principal of the school attended by the sampled child completed the school
administrator questionnaire in the spring of third and fifth grade. This questionnaire
included questions about the school, student body, teachers, school policies and the
administrator’s background. Although a designee could complete the sections containing

120
factual information about the school and programs offered, the principal was asked to
complete the sections about their background and the school climate.
Missing data were addressed using multiple imputation (with STATA’s “impute
chained” command [Stata- Corp, College Station, TX]) with twenty imputed datasets.
All variables, including outcome variables, were imputed. Percent missing for all
variables was under 15%; for most variables, percent missing was less than 5%. In order
to maintain the multi-level structure of the data, students from the same school were
assigned the same imputed values for school-level variables.
Measures
Students’ socio-emotional outcomes
Students’ socio-emotional outcomes were based on both teacher and student
report for a total of six student socio-emotional outcomes: teacher-rated peer relations,
externalizing behaviors, and internalizing behaviors; self-rated peer relations,
externalizing behaviors, and internalizing behaviors. Teachers rated individual students’
social development using the Social Rating Scale (SRS). The SRS used in the ECLS-K
was adapted from the Social Skills Rating Scale: Elementary Scale A (SSRS), which was
created by Gresham and Elliott (1990) and is a reliable and valid measure of children’s
social development (Demary et al., 1995). The Peer Relations scale is a combination of
items from the Interpersonal Skills and Self-Control scales, which assess skills related to
friendships, positive peer interactions, and controlling behaviors. The Externalizing
Problem Behaviors scale has items that assess the frequency with which a child argues,
fights, gets angry, acts impulsively, and disturbs ongoing activities. The Internalizing
Problem Behaviors scale includes items that address the apparent presence of anxiety,

121
loneliness, low self-esteem and sadness. All items were assessed on a 4-point scale: 1
(student never exhibits behavior), 2 (student exhibits this behavior occasionally or
sometimes), 3 (student exhibits this behavior regularly but not all the time), and 4(student
exhibits this behavior most of the time). The score for each scale is the mean rating of
the items included in that scale. Higher scores for peer relations indicate positive socio-
emotional development. Higher scores for externalizing and internalizing behaviors
indicate negative socio-emotional development.
For self-reported outcomes, items for the peer relations scale were adapted from
the Self-Description Questionnaire I (SDQ; Marsh, 1990). Items for the two problem
behavior scales were developed specifically for the ECLS-K. The SDQ Peer scale
consists of six items that capture how well the students make friends and get along with
their peers, as well as their perceived popularity. The SDQ Anger/Distractibility scale has
six items that measure children’s perceptions of their externalizing problem behaviors,
such as fighting and arguing with other children, talking and disturbing others, and
problems with distractibility. The SDQ Sad/Lonely/Anxious scale includes eight items
about internalizing behaviors, such as feeling “sad a lot of the time,” feeling lonely,
feeling ashamed of mistakes, feeling frustrated and worrying about school and
friendships. Like the SRS scale scores, SDQ scale scores also have a 4-point scale based
on frequency of behaviors and the scale score is the mean of the items within the scale.
Higher scores for the externalizing and internalizing behavior scales indicate worse
socio-emotional functioning. Higher scores for the social skills scale indicates better
socio-emotional functioning.
122
To facilitate interpretation of coefficients, scores from all six scales were
standardized to have a mean of zero and standard deviation of one
School Organizational Climate
Data used to measure the school context came from two sources: school
administrator questionnaires and teacher questionnaires. Factor analysis was conducted
separately for the administrator items and teacher items and resulted in nine scales. All
scales except one (General Facilities) have acceptable internal reliability based on
ordinal alpha values above 0.70.
Five school context and climate factors were identified using items from the
school administrator questionnaire. General Facilities is an index of the adequacy of six
common aspects of school facilities such as the cafeteria, computer lab and classrooms
(ordinal alpha=0.6). All other measures are true scales with good to acceptable internal
consistency. Extracurricular Facilities includes three items that ask about the adequacy
of art, music and gym facilities (ordinal alpha=0.84). Safety includes three items about
the frequency of weapons, fights and attacks (ordinal alpha=0.79). Stability has three
items that ask about student absence, teacher tardiness and teacher turnover (ordinal
alpha=0.74). Community Support & School Order consists of 4 items about parent and
community support, teacher consensus, and order (ordinal alpha=0.81).
Four school climate factors were identified using items from the teacher
questionnaire. Student Conduct consists of three items that reflect students’ misbehavior,
physical conflicts and bullying (ordinal alpha=0.84). Staff Collegiality (ordinal
alpha=0.80) includes three items that capture teachers’ relationships with each other and
overall morale in the school. Leadership consists of four items that measure teachers’

123
perceptions of the school administrator’s leadership (ordinal alpha=0.93). The fourth
factor, Teacher Interaction, includes four items that assess the frequency of teachers’
interactions related to curricula planning and discussion of individual children (ordinal
alpha=0.75).
All items were coded such that higher scores indicate a more positive school
environment. Scale scores were calculated by taking the mean of all items in the scale.
For these analyses, the assumption was that the school organizational climate is an
organization-level characteristic and each teacher is a separate rater of the same entity of
school context. Based on previous research that indicates stability in school
organizational climate over several years (Brand et al., 2008), the school organizational
climate measures from third and fifth grade teachers within the same schools were
combined. The school-level scale score for each dimension of school organizational
climate was determined by summing the responses from all teachers in a school (from
both the third grade and fifth grade waves of ECLS-K) and dividing by the total number
of teachers contributing data for that school. All scale scores were standardized at the
school level to have a mean of zero and standard deviation of one.
Child and Family Characteristics
Gender was coded as 0=female and 1=male. The ECLS-K dataset includes a
composite variable for race/ethnicity that has 8 categories. For this study, some of these
categories were combined to create a total of five categories consistent with Crosnoe and
Cooper (2010): White, African-American, Hispanic, Asian and Other.
Because of the relationship between educational and socio-emotional outcomes,
students’ academic achievement was included as a covariate (Needham et al., 2004;

124
Gutman et al., 2003; Dipema & Elliott, 2002). The overall reading IRT scale score in
fifth grade and the overall math IRT scale score in fifth grade were used. These scores
come from a direct cognitive assessment scored using Item Response Theory (IRT).
Socio-economic status (SES) is an existing composite variable in the ECLS-K
dataset made up of the following variables from the parent questionnaire: father/male
guardian’s education, mother/female guardian’s education, father/male guardian’s
occupation, mother/female guardian’s occupation, and household income. The composite
SES variable is categorical, with 1 representing the first quintile (low status) and 5
representing the fifth quintile (highest status). Family structure was a dichotomous
variable with 1=single-parent household and 0=two-parent household.
Parent psychological health is a composite variable consisting of twelve items
from the parent questionnaire (most often answered by the child’s mother) based on a
subset of the Center for Epidemiologic Studies-Depression Scale. These items asked
about depression- related symptoms in the previous week, and had four possible
responses: never, some of the time, moderate amount of the time, and most of the time.
Examples include “How often during the past week have you felt that you could not
shake off the blues even with help from your family and friends?” and “How often during
the past week have you felt depressed?”
Factor analysis was used to identify two constructs related to parenting using
items in the third grade parent questionnaire. Parental warmth includes four items about
affection between parent and child. Parental stress consists of four items that ask about
parents’ feelings of anger and frustration toward the child and related to parenting. These

125
composite variables are similar to those used in previous studies using the ELCS-K
(Crosnoe & Cooper, 2010; Beaver et al., 2008).
School Composition
The school organizational climate factors were the predictors of interest in this
study, but it was necessary to control for characteristics of the school that are less
modifiable and may be related to both students’ outcomes and school organizational
climate. Data for these variables came from the fifth grade school administrator
questionnaire when available. If these variables were missing in the fifth grade wave,
data from the third grade school administrator questionnaire was used.
Sector was a dichotomous variable based on the school being public (=0) or
private (=1). Student enrollment was categorical: 0-149 (reference), 150-299, 300-499,
500-749, 750 and above. Percent minority was also categorical: less than 10%
(reference), 10%-less than 25%, 25-less than 50%, 50-less than 75%, 75% or more. Title
1 status was dichotomous (receive Title I benefits or not). School urbanicity consisted of
three categories: city (reference), suburb, and rural. The variable for school-level
academic achievement was the mean of percent of students in school at or above grade
level in math and percent of students at or above grade-level in reading. Higher values of
this variable indicate higher levels of school-level academic achievement (a greater
proportion of students are achievement at or above grade level).
Teacher Characteristics
Because previous research has found a relationship between teacher experience
and certification and students’ outcomes, several individual teacher characteristics were
included in the analyses. These variables were all self-reported by the fifth grade reading

126
teacher. Years of experience as a teacher was a continuous variable. Highest level of
education consisted of four categories. Similar to Jennings et al. (2010) and Crosnoe &
Cooper (2010), certification was coded dichotomously, with the regular or standard state
certificate as the reference category.
Analyses
This study used autoregressive techniques to analyze change over time by
predicting fifth grade outcomes net of third grade outcomes. A similar approach has been
used by other researchers utilizing ECLS-K data, although primarily for outcomes in
earlier grades (Li-Grining et al., 2006; McClelland et al., 2000, Claessens, Duncan, &
Engel, 2009, Duncan et al, 2007).
Multilevel multivariate regression was used to account for the clustering of
students within schools. It also allows for partitioning of outcome variance (between and
within school effects) to better assess school-level effects. Level 1 consisted of
individual students (between individual and within school effects). Level 2 consisted of
schools (between school effects). Because the six outcomes are highly correlated and the
effect of the school organizational climate may differ for each one, a separate model was
used for each outcome. All continuous level 1 variables were grand mean centered.
Descriptive statistics and correlations between variables were first examined to
explore the data. Multi-level regression was then performed in three steps. First,
unconditional linear regression models with random effects were run to assess variation
in students’ socio-emotional outcomes between and within schools. Next, conditional
linear regression models were run with the nine school organizational climate (SOC)
scale scores. Finally, covariates for third grade behaviors, child and family
127
characteristics, teacher characteristics and school composition were added to the models.
In the full models, SOC scale scores were examined both in the same model
simultaneously and in separate models. It was important to examine the SOC variables
separately because of the relatively high correlations between these variables and the
possibility of collinearity (Leblanc et al., 2008). By including SOC variables in the same
model, it was possible to examine their relative effects on students’ outcomes, controlling
for other SOC variables (Saab and Klinger, 2010). The variance in the outcomes that is
attributable to school organizational climate dimensions was examined, as were the
regression coefficients for each climate scale.
In the final series of models, cross-level interaction terms were added to the
models described above to examine possible interactions between school organizational
climate variables and student-level risk. One set of models included interaction terms for
the school organizational climate variables and individual-level socio-economic status
(SES). Another set of models included interaction terms for school organizational
climate variables and self-rated externalizing behaviors in third grade. For both sets of
models, the significance of the interaction terms was examined to determine if there was
evidence the effect of each school organizational climate variable varied based on third
grade behavior problems.
Results
Preliminary Analyses
Overall, as shown in Table 1, both teachers and students reported high levels of
social skills and low levels of problem behaviors. Mean scores for externalizing and
internalizing behaviors were slightly lower (better) in fifth grade compared to third grade,

128
and social skills scale scores were slightly higher in fifth grade. Compared to teacher-
reported scores, scores self-reported by children were slightly higher for externalizing
and internalizing behaviors and slightly lower for social skills. Staff perceptions of the
school environment were also generally positive. As shown in Table 2, for the
administrator scales, the lowest means were for Facilities (extracurricular and general)
and the highest was for Community Support and School Order. For the teacher scales,
Staff Collegiality had the highest mean.
As shown in Table 1, scores for the externalizing and internalizing scales are
positively correlated; social skills scores are negatively correlated with externalizing and
internalizing scale scores. The correlation between teacher and child-reported scores for
comparable scales is nearly twice as large for externalizing behaviors compared to
internalizing behaviors and social skills. Results of bivariate analyses (Table 3) were
generally as expected, with associations that indicated better socio-emotional outcomes in
schools with better organizational climate. Most of the nine school organizational climate
(SOC) scale scores were significantly negatively associated with externalizing and
internalizing behaviors and significantly positively associated social skills. Exceptions
included several coefficients for General Facilities and Teacher Interaction, some of
which were not significant or not in the expected direction.
Externalizing behaviors
For the unconditional models, the ICC was 0.11 for both teacher-reported and
self-reported behaviors (Table 4.7), indicating 11% of variance in fifth grade
externalizing behaviors was between schools. Both of these were statistically significant.
As shown in Table 4.4, higher levels of teacher-reported Student Conduct were associated
129
with lower levels of both self-reported and teacher-reported externalizing behaviors, net
other important factors including third grade self-reported externalizing behaviors. The
effect size was nearly twice as large for teacher-reported externalizing behaviors
compared to child-reported externalizing behaviors. Although Community Support &
School Order was only marginally significant with all SOC variables in the model, it was
significant (β= -0.03, p=0.035) when it was the only SOC variable in the model.
Although administrator-reported Safety was significantly negatively associated
externalizing behaviors in bivariate models, in the full model it had a positive relationship
with self-reported externalizing behaviors. However, when it was the only SOC variable
in the model for teacher-reported externalizing behaviors, it was significant and negative
(β=-0.03, p =0.05). When it (Safety) was the only SOC variable in the model for self-
reported externalizing behaviors it was not significant, and the interaction term with third
grade behavior problems was significant and negative. This indicates that as levels of
behavior problems in third grade increase, Safety has an increasingly inverse association
with self-rated externalizing behaviors. Stability was not significant when it was entered
simultaneously with other variables into the model for teacher-reported behaviors, but
was significant when it was the only variable in the model (β=-0.04, p =0.01).
Internalizing behaviors
Similar to externalizing behaviors, the ICC for self-reported internalizing
behaviors was 0.11 (Table 4.7). For teacher-reported internalizing behaviors, 9.5% of the
variance was between schools. Results are shown in Table 4.5. Like externalizing
behaviors, the relationship between administrator-reported Safety internalizing behaviors
was significant and negative in bivariate models but positive in the full model for self-
130
reported internalizing behaviors. No other school organizational climate (SOC) variables
were significantly associated with student-reported internalizing behaviors. None of the
SOC variables were significantly associated with teacher-reported internalizing
behaviors.
Social Skills
For social skills, the percent of variation between schools compared to within
schools varied based on reporter, with 13% for teacher-reported scores and 4% for self-
reported scores. Once again, few school organizational climate (SOC) variables were
significantly associated with the outcomes. As shown in Table 4.6, administrator-reported
Community Support & School Order was positively and significantly associated with
child-reported social skills, such that better climate was linked to higher levels of social
skills. Better Student Conduct as reported by teachers was also significantly associated
with more social skills.
Overall
The proportion variance explained for the six models with the climate variables
and covariates (but no interaction terms) ranged from 19% to 33%.
Third grade behaviors were strong and significant predictors for all six outcomes,
emphasizing both the importance of including this as a control variable and the predictive
role of earlier behaviors. As expected, males had significantly higher levels of
externalizing behavior problems and lower levels of social skills. Surprisingly, parent
psychological health was not statistically significant in most of the models. Parental
warmth and parental stress, however, were significant in many of the models. Parental
stress, in particular was highly significant for all outcomes except self-reported social

131
skills. Most of the teacher and school composition variables were not statistically
significant in the models. For both externalizing and internalizing behaviors, teachers
rated students in larger schools as having fewer problem behaviors compared to students
in the smallest schools. Surprisingly, for both school urbanicity and percent minority, the
associations with internalizing behaviors were in the opposite direction for student and
teacher rated behaviors. Compared to attending a school in a suburb, attending a school in
a rural area was associated with more internalizing behaviors as rated by students.
Attending a school in a large city was associated with more teacher-reported internalizing
behaviors. Compared to schools with fewer than 10% minority students, Attending a
school in which at least half of the students are not white was associated with higher
student-reported levels of internalizing behaviors, but this relationship was not observed
for teacher-reported internalizing behaviors.
Interaction effects
Third grade behaviors and socio-economic status were consistently and strongly
related to fifth grade outcomes. In order to determine if these characteristics moderated
the relationship between school organizational climate variables and students’ socio-
emotional outcomes, interaction terms were added to the models described above.
Results indicated that, for the most part, the effects of school organizational
climate did not differ based on a child’s level of externalizing behaviors in third grade.
There were a few exceptions. The interaction term for Safety and third grade behavior
was significant and negative for self-reported externalizing behaviors (β= -0.02,
p=0.016), indicating that the coefficient for Safety becomes more negative with higher
levels of behavior problems in third grade. Similarly, the association of Extracurricular

132
Facilities with self-rated social skills was greater for children with higher levels of
externalizing problems in third grade.
The relationship between Student Conduct and children’s self-rated externalizing
behaviors varied by family socio-economic status, such that the effect was strongest for
the lowest (poorest) quintile of students (β= -0.12, p<0.001) and less strong for the
children in the second SES quintile (β= -0.05, p=0.034). The relationship was not
significant for students in the third, fourth or fifth SES quintiles. Similarly, there was a
significant effect of Extracurricular Facilities on self-reported internalizing behaviors,
but only for children in the first SES quintile (β=-0.07, p=.006). Finally, Community
Support and School Order was significantly associated with teacher-reported
externalizing behaviors only for children in the first SES quintile (β= -0.08, p-0.003).
Discussion
Previous research examining the relationship between the school environment and
students’ socio-emotional outcomes has focused on middle and high schools and student-
perceived school climate. This primary aim of this study was to examine the relationship
between staff perceptions of the school environment and students’ socio-emotional
outcomes in fifth grade, controlling for third grade outcomes as well as a range of child,
family, and school characteristics. A secondary aim was to determine if this relationship
was moderated by student-level risk, as defined by low SES or high levels of
externalizing behaviors in third grade.
The percent variation at the between-school level for the six socio-emotional
outcomes examined ranged from four to thirteen percent with most around ten percent.
This finding is consistent with previous research on school effects and indicates that
133
while the school does play a role in children’s socio-emotional development, child and
family characteristics account for much of the variation in these outcomes (Denny,
Mortimore, 1995; Wilcox & Clayton, 2001; Sellstrom & Bremberg, 2006).
Although most of the nine school organizational climate variables examined in
this study were not significantly associated with any of the six outcomes, some aspects of
the school organizational climate were significantly related to students’ socio-emotional
outcomes. The strongest relationship was between teacher-perceived Student Conduct
and externalizing behaviors (both self-reported and teacher-reported). As expected, this
relationship was negative, such that students had lower levels of externalizing behaviors
in schools in which teachers perceived better overall student conduct. The effect size was
twice as large for teacher-reported externalizing behaviors compared to student-reported
externalizing behaviors. Although the Student Conduct measure was based on
aggregated responses from multiple teachers in the school, the larger effect for teacher-
reported outcomes may be due to inflation caused by shared method variance. However,
the finding is strengthened by the consistency across teacher and self-reported
externalizing behaviors. Student Conduct was positively associated with teacher-reported
social skills, indicating greater social skills in schools with better student conduct.
Administrator-perceived Community Support and School Order was also significantly
associated with self-reported externalizing behaviors and social skills. These findings
highlight the importance of school-wide student behavior for individual students’ socio-
emotional development and are consistent with previous research linking a school’s
discipline climate with students’ non-academic outcomes. (Ma, 2000; Ma & Klinger,
2000; Ma & Willms, 2004). These findings are similar to those of LeBlanc et al. (2008),
134
who examined the relationship between different aspects of the teacher-perceived school
climate and high school students’ behaviors. Like the current study, of the four measures
of school climate Le Blanc et al. assessed, only classroom behavior problems were
significantly associated with individual students’ antisocial behavior.
The hypothesis that school organizational climate matters more for students with
increased individual-level risk for poor socio-emotional outcomes was supported in some
of the models. Specifically, the association of Student Conduct with self-reported
externalizing behaviors, Extracurricular Facilities with self-reported internalizing
behaviors, and Community Support and School Order with teacher-reported externalizing
behaviors were all significant only for students in the first or second SES quintile. These
findings are al consistent with previous research that has found stronger effects or low-
income students of school-based interventions to prevent aggressive behaviors, positive
school climate and supportive relationships with teachers (Wilson & Lipsey, 2007;
Kuperminc et al., 2001; Dubois et al., 1994).
There are a variety of possible explanations for the relationship between Student
Conduct and students’ externalizing behaviors. One potential pathway is through
modeling. Previous research has shown that merely being around other youth engaging in
antisocial behavior can lead to increases in behavior problems (Dishion & Andrews,
1995; Dishion, McCord, & Poulin, 1999). Another possibility is that misbehavior of other
students impedes teachers’ ability to form positive relationships with students that
promote positive socio-emotional development. The association between school-wide
student conduct and students’ externalizing behaviors reinforces the importance of efforts
to improve school-wide behavior and prevent bullying. Additionally, although the

135
coefficients for Student Conduct and Community Support and School Order are fairly
small, it is important to point out that they are comparable in magnitude to Parental Stress
(which are also standardized and therefore comparable). As previous research has
highlighted, school characteristics may be more accessible for intervention than family
characteristics.
While some of the climate factors (e.g. Leadership and Stability) were not
significantly directly associated with the outcomes, they may be indirectly associated
through other SOC factors such as Student Conduct. For example, Bevans et al. (2007)
found that faculty turnover and student mobility (both part of the Stability scale in this
study) were associated with aspects of school organizational health including staff
affiliation. They also examined the school suspension rate, which is likely related to
items in the Safety scale, as an indicator of school performance and possible outcome of
school organizational climate. Additional research is needed to understand how these
SOC factors interact with each other and other school-level variables to lead to students’
outcomes.
It is important to note some of the limitations of this study. The dimensions of the
school organizational climate examined in this study were limited by the data collected in
the ECLS-K. It would be preferable to use organizational climate items and factors from
an existing instrument, such as the Organizational Health Inventory (OHI), to maintain
consistency with other research, but that was not possible. Another consequence of the
limited items is that there may be dimensions of the school organizational climate
associated with children’s socio-emotional development that are not assessed in the
ECLS-K. Measurement of the school organizational climate is based on only a few

136
reporters per school (several teachers and the administrator). Although previous research
supports the concept of school organizational climate as a school-level characteristic
experienced by all staff members, individual characteristics of staff can influence their
perceptions (Bevans et al., 2007). Based on previous research that indicates stability in
school organizational climate over several years, the school organizational climate
measures from teachers and administrators in third and fifth grade were combined. A
benefit of this approach is that it provides data about the school organizational climate
from more reporters. A potential problem is that there may be changes in the school
between the third and fifth grade ECLS-K administrations, such as a new principal, that
have important effects on the school organizational climate. The measurement of
children’s socio-emotional outcomes also has limitations, since they are based on teacher
and child report. All reporters can be considered to be biased in that their reports reflect
their own perspective and exposure to the child (Pigott & Cowen, 2000; Taylor, Gunter,
& Slate, 2001). For example, teachers’ ratings only reflect students’ behaviors in one
context: the school setting. Observational techniques for children’s socio-emotional
outcomes and family factors would have been optimal (Pianta et al., 2007). The
inclusion and exclusion criteria for the study sample may affect the generalizability of the
findings. Because the sample is limited to children who stayed in the same school from
third grade until fifth grade, children who moved during this time are excluded. This
means the findings are generalizable only to students who remain in the same school for
three years. Children who were excluded because of their mobility may be at higher risk
for psychopathology, since previous research has found that multiple household moves

137
contribute to social, emotional and behavioral problems in children (Ackerman et al.,
1999; Humke & Shaefer, 1995).
Surveys that assess staff perceptions of the school environment and interventions
that seek to alter the school environment have become increasingly popular. While these
efforts are valuable, it is important to understand how they relate to the ultimate endpoint:
students’ outcomes. Although additional research is needed to better understand how
different aspects of the school organizational climate may interact to affect student
outcomes, this study provides evidence from a large national study of a small but
statistically significant relationship between teachers’ perceptions of school-wide student
conduct and individual students’ behavior.

138
References !!Achenbach, T. M. (1991). Manual for the child behavior checklist/4–18. Burlington, VT:
University of Vermont Department of Psychiatry.!!Ackerman, B. P., Kogos, J., Youngstrom, E. A., Schoff, K., & Izard, C. (1999). Family
instability and the problem behaviors of children from economically disadvantaged families. Developmental Psychology, 35,258–268.!
!Atkins, M.S., Hoagwood, K.E., Kutash, K., Seidman, E. (2010). Toward the Integration
of Education and Mental Health in Schools. Administration and Policy of Mental Health, 37, 40-47.!
!Baker, J.A., Grant, S., & Morlock, L. (2008). The Teacher-Student Relationship As a
Developmental Context for Children With Internalizing or Externalizing Behavior Problems., School PsychologyQuarterly, 23(1), 3-15.!
!Barriga, A. Q., Doran, J. W., Newell, S. B., Morrison, E. M., Barbetti, V., & Dean
Robbins, B. (2002). Relationships between problem behaviors and academic achievement in adolescents: The unique role of attention problems. Journal of Emotional and Behavioral Disorders, 10(4), 233–240.!
!Battistich, V., Solomon, D., Kim, D., Watson, M., & Schaps, E. (1995). Schools as
communities, poverty levels of student populations, and students’ attitudes, motives and performance: A multilevel analysis. American Education Research Journal, 32, 627–658.!
!Beaver, K.M., Wright, J.P., Maume, M.O. (2008). The effect of school classroom
characteristics on low self-control: A multilevel analysis. Journal of Criminal Justice, 36, 174-181.!
!Bevans, K., Bradshaw, C., Miech, R., Leaf, P. (2007). Staff- and School-Level Predictors
of School Organizational Health: A Multilevel Analysis. Journal of School Health. 77, 294-302.!
!Birch, S. H., & Ladd, G. W. (1997). The teacher-child relationship and children’s early
school adjustment. Journal of School Psychology, 35(1), 61–79.!!Birch, S. H., & Ladd, G. W. (1998). Children’s interpersonal behaviors and the teacher-
child relationship. Developmental Psychology. 34(5), 934–946.!!Birnbaum, A.S., Lytle L.A., Hannan, P.J., Murray, D.M., Perry, C.L., & Forester, J.L.
(2003). School functioning and violent behavior among young adolescents: A contextual analysis. Health Education Research, 18, 389–404.!
!
139
Borman, G. D., & Overman, L. T. (2004). Academic resilience in mathematics among poor and minority students. The Elementary School Journal, 104, 177–195.!
!Bradshaw, C.P., Koth, C.W., Bevans, K.B., Ialongo, N., Leaf, P.J. (2008). The Impact of
School-Wide Positive Behavioral Interventions and Supports (PBIS) on the Organizational Health of Elementary Schools. School Psychology Quarterly, 23(4), 462-473.!
!Brand, S., Felner, R., Shim, M., Seitsinger, A., Dumas, T. (2003). Middle School
Improvement and Reform; Development and Validation of a School Level Assessment of Climate, Cultural Pluralism, and School Safety. Journal of Educational Psychology, 95(3), 570-588.!
!Brand, S., Felner, R.D., Seitsinger, A., Burns, A., Bolton, N. (2008). A large scale study
of the assessment of the social environment of middle and secondary schools: The validity and utility of teachers’ ratings of school climate, cultural pluralism, and safety problems for understanding school effects and school improvement. Journal of School Psychology, 46: 507-535.!
!Broidy, L. M., Nagin, D. S., Tremblay, R. E., Brame, B., Dodge, K., Fergusson, D., et al.
(2003). Developmental trajectories of childhood disruptive behaviors and adolescent delinquency: A six site, across national study. Developmental Psychology, 39, 222–245.!
!Bronfenbrenner, U. (1979). The ecology of human development: Experiments by nature
and design. Cambridge, Mass.: Harvard University Press.!!Bukowski, W. M., & Adams, R. (2005). Peer relationships and psychopathology:
Markers, moderators, mediators, mechanisms, and meanings. Journal of Clinical Child and Adolescent Psychology, 34, 3–10.!
!Burt, K. B., Obradovic, J., Long, J. D., & Masten, A. S. (2008). The interplay of social
competence and psychopathology over 20 years: Testing transactional and cascade models. Child Development,79, 359–374.!
!Campbell, F.A., Ramey, C.T., Pungello, E., Sparling, J., Miller-Johnson, S. (2002). Early
Childhood Education: Young Adult Outcomes from the Abecedarian Project. Applied Developmental Science, 6, 42-57.!
!Caspi, A., Elder, G. H., & Bem, D. J. (1987). Moving against the world: Life-course
patterns of explosive children. Development Psychology, 23, 308– 313.!!Cheney, D., Osher, T., & Caesar, M. (2002). Providing ongoing skill development and
support for educators and parents of students with emotional and behavioral disabilities. Journal of Child and Family Service, 11:79–89.!

140
!Claessens, A., Duncan, G. J., & Engel, M. (2009). Kindergarten skills and fifth grade
achievement: Evidence from the ECLS-K. Economics of Education Review, 28, 415–427. !
!Collins, W.A. & van Dulman, M. (2006). The significance of middle childhood peer
competence for work and relationships in early adulthood. In A. Huston and M. Ripke (Eds.). Developmental contexts in middle childhood: Bridges to adolescence and adulthood. New York: Cambridge University Press.!
!Crosnoe, R. & Cooper, C.E. (2010). Economically Disadvantaged Children’s Transitions
Into Elementary School: Linking Family Processes, School Contexts, and Educational Policy. American Educational Research Journal, 47(2), 258-291.!
!Demanet, J. & Van Houtte, M. (2011). Social-ethnic school composition and school
misconduct: does sense of futility clarify the picture? Sociological Spectrum, 31:2, 224-256.!
!Denny, S.J., Robinson, E.M., Utter, J., Fleming, T.M., Grant, S., Milfont, T.L., Crengle,
S., Ameratunga, S.N., Clark, T. (2011). Do Schools Influence Student Risk-taking Behaviors and Emotional Health Symptoms? Journal of Adolescent Health, 48: 259-267.!
!Dishion, T. J., & Andrews, D. W. (1995). Preventing escalation in problem behaviors
with high-risk young adolescents: Immediate and 1-year outcomes. Journal of Consulting and Clinical Psychology, 63, 538−548.!
!Dishion, T. J., McCord, J., & Poulin, F. (1999). When interventions harm: Peer groups
and problem behavior. American Psychologist, 54, 755−764.!!DuBois DL, Felner RD, Brand S, Adan AM, Evans EG. (1992). A prospective study of
life stress, social support, and adaptation in early adolescence. Child Development, 63, 542-557.!
!DuBois DL, Felner RD, Meares H, Krier M. (1994). Prospective investigation of the
effects of socioeconomic disadvantage, life stress, & social support on early adolescent adjustment. Journal of Abnormal Psychology, 103, 511–522.!
!Duncan, G. J., Dowsett, C. J., Claessens, A., Magnuson, K., Huston, A. C., Klebanov, P.,
. . . Japel, C. (2007). School readiness and later achievement. Developmental Psychology, 43, 1428–1446.!
!Ensminger ME, Slusarcick AL. (1992) Paths to high school graduation or dropout: a
longitudinal study of a first-grade cohort. Sociology of Education, 65, 95–113.!!

141
Fergusson, D.M. & Horwood, L. J. (1998). Early conduct problems and later opportunities. Journal of Child Psychology and Psychiatry, 39, 1097-1108.!
!Glisson, C., & Hemmelgarn, A. (1998). The effects of organizational climate and
interorganizational coordination on the quality and outcomes of children’s service systems. Child Abuse & Neglect, 22, 401–421.!
!Gottfredson, G. D., Gottfredson, D. C., Payne, A. A., & Gottfredson, N. C. (2005).
School climate predictors of school disorder: Results from a national study of delinquency prevention in schools. Journal of Research in Crime and Delinquency. 42, 412–444.!
!Gumpel, T.P. & Sutherland, K.S. (2010). The relation between emotional and behavioral
disorders and school-based violence. Aggression and Violent Behavior. 15, 349-356.!
!Gunter, P. L., Denny, R. K., Jack, S. L., & Shores, R. E. (1993). Aversive stimuli in
academic interactions between students with serious emotional disturbance and their teachers. Behavioral Disorders, 18(4), 265−274.!
!Gunter, P. L., Denny, R. K., Shores, R. E., & Reed, T. M. (1994). Teacher escape,
avoidance, and countercontrol behaviors: Potential responses to disruptive and aggressive behaviors of students with severe behavior disorders. Journal of Child and Family Studies, 3(2), 211−223!
!Gutman, L. M., Sameroff, A. J., & Cole, R. (2003). Academic growth curve trajectories
from 1st grade to 12th grade: Effects of multiple social risks and preschool child factors. Developmental Psychology, 39, 777-790.!
!Hawkins, J.D., Guo, J., Hill, K.G., Battin-Parson, S., Abbott, R.D. (2001). Long-term
Effects of the Seattle Social Development Intervention on School Bonding Trajectories. Applied Developmental Science, 5, 225-36.!
!Hawkins, J.D., Kosterman, R., Catalano, R.F., Hill, K.G., Abbott, R.D. (2005).
Promoting Positive Adult Functioning through Social Development Intervention in Childhood. Archives of Pediatrics and Adolescent Medicine, 159, 5-31.!
!Henricsson, L. & Rydell, A.M. (2006). Children with behavior problems: the influence of
social competence and social relations on problem stability, school achievement and peer acceptance across the first six years of schools. Infant and Child Development, 15(4), 347-366.!
!Hinshaw SP. (1992) Academic underachievement, attention deficits, and aggression:
comorbidity and implications for intervention. Journal of Consulting and Clinical Psychology, 60:893–903.!
142
!Hoagwood KE, Serene Olin S, Kerker BD, Kratochwill TR, Crowe M, Saka N. (2007).
Empirically based school interventions targeted at academic and mental health functioning. Journal of Emotional and Behavioral Disorders, 15, 66–92.!
!Hoglund, W.L. & Leadbeater, B.J. (2004). The Effects of Family, School and Classroom
Ecologies on Changes in Children’s Social Competence and Emotional and Behavioral Problems in First Grade. Developmental Psychology, 40(4), 533-544.!
!Hoy, W.K. & Hannum, J.W. (1997). Middle School Climate: An Empirical Assessment
of Organizational Health and Student Achievement. Educational Administration Quarterly, 33(3), 290-311.!
!Humke, C., & Shaefer, C. (1995). Relocation: A review of the effects of residential
mobility on children and adolescents. Psychology, A Journal of Human Behavior, 32, 16–24.!
!Jennings, J.L. & DiPrete, T.A. (2010). Teacher Effects on Social and Behavioral Skills in
Early Elementary School. Sociology of Education, 83(2), 135-159.!!Johnson, S.L. (2009). Improving the School Environment to Reduce Violence: A Review
of the Literature. Journal of School Health, 79, 451-465.!!Kataoka, S.H., Rowan, B., & Hoagwood, K.E. (2009). Bridging the Divide: In Search of
Common Ground in Mental Health and Education Research and Policy. Psychiatric Services, 60: 1510-1515.!
!Kazdin, A. E. (1997). Conduct disorder across the life-span. In S. Luthar, J. A. Burack,D.
Cicchetti, & J. R. Weisz (Eds.), Developmental psychopathology: Perspectives on adjustment, risk, and disorder (pp. 248–272). New York: Cambridge University Press.!
!Kellam, S.G., Branch, J.D., Agrawal, K.C., and Ensminger, M.E. (1975). Mental Health
and Going to School: The Woodlawn Program of Assessment, Early Intervention, and Evaluation. Chicago, IL: University of Chicago Press. (Cited in Preventing Mental, Emotional, and Behavioral Disorders Among Young People: Progress and Possibilities,!2009.!
!Kessler, R., Berglund, P., Demler, O., Jin, R., & Walters, E. E. (2005). Lifetime
prevalence and age-of-onset distributions of DSM-IV disorders in the national comorbidity survey replication. Archive of General Psychiatry, 62, 593-602.!
!Kovacs, M., & Devlin, B. (1998). Internalizing disorders in childhood. Journal of Child
Psychology and Psychiatry, 39(1), 47–63.!!

143
Kuperminc, G., Leadbeater, B. J., Emmons, C., & Blatt, S. J. (1997). Perceived school climate and problem behaviors in middle school students: The protective function of a positive educational environment. Journal of Applied Developmental Science, 1, 76–88.!
!Kuperminc, G.P., Leadbeater, B.J., & Blatt, S.J. (2001). School social climate and
individual differences in vulnerability to psychopathology among middle school students. Journal of School Psychology, 39(2), 141-159.!
!Ladd, G.W. & Burgess, K.B. (1999). Charting the relationship trajectories of aggressive,
withdrawn, and aggressive/withdrawn children during early grade school. Child Development, 70, 910-929.!
!LeBlanc, L., Swisher, R., Vitaro, F., Tremblay, R.E. (2008). High School Social Climate
and Antisocial Behavior: A 10 Year Longitudinal and Multilevel Study. Journal of Research on Adolescence, 18(3), 395-419.!
!Li-Grining, C. P., Votruba-Drzal, E., Bachman, H. J., & Chase-Lansdale, P. L. (2006).
Are certain preschoolers at risk in the era of welfare reform? The moderating role of children’s temperament. Children and Youth Services Review, 28, 1102–1123.!
!Loeber, R. (1990). Developmental and risk factors of juvenile antisocial behavior and
delinquency. Clinical Psychology Review, 10, 1–42.!!Ma, X. (2000). Health outcomes of elementary school students in new Brunswick: the
education perspective. Evaluation Review, 24, 435–456.!!Ma, X., & Klinger, D. A. (2000). Hierarchical linear modeling of student and school
effects on academic achievement. Canadian Journal of Education, 25, 41–55.!!Ma, X., & Willms, J. D. (2004). School disciplinary climate: characteristics and effects
on eighth grade achievement. Alberta Journal of Educational Research, 50, 169–188.!
!Maldonado-Carreno, C. and Votruba-Drzal, E. (2011). Teacher-Child Relationships and
the Development of Academic and Behavioral Skills During Elementary School: A Within-And Between-Child Analysis. Child Development, 82(2): 601-616.!
!Marsh, H. (1990). Self-Description Questionnaire Manual. Campbelltown, N.S.W,
Australia: University of Western Sydney, Macarthur.!!Masten, A.S., and Coatsworth, J.D. (1995). Competence, resilience, and
psychopathology. In D. Cicchetti and D.J. Cohen (Eds.), Developmental Psychopathology: Risk, Disorder, and Adaptation(vol. 2, pp. 715-752). New
144
York: Wiley. (Cited in Preventing Mental, Emotional, and Behavioral Disorders Among Young People: Progress and Possibilities,!2009).!
!McClelland, M. M., Morrison, F. J., & Holmes, D. L. (2000). Children at risk for early
academic problems: The role of learning-related skills. Early Childhood Research Quarterly, 15, 307–329.!
!Masten, A.S. (2003). Commentary: Developmental Psychopathology as a Unifying
Context for Mental Health and Education Models, Research, and Practice in Schools. School Psychology Review, 32(2), 169-173.!
!Moffitt, T. E. (2006) Life-course-persistent versus adolescent-limited antisocial behavior.
In D. Cicchetti & D. Cohen (Eds.), Developmental psychopathology (2nd ed., Vol. 1, pp. 570-598). Hoboken, NJ: John Wiley & Sons.!
!Mortimore, P. (1995). The positive effect of schooling. In M. Rutter (Ed.), Disturbances
in young people: Challenges for prevention (pp. 333–363). New York: Cambridge University Press.!
!National Research Council and Institute of Medicine. (2009). Preventing Mental,
Emotional, and Behavioral Disorders Among Young People: Progress and Possibilities. Committee on the Prevention of Mental Disorders and Substance Abuse Among Children, Youth, and Young Adults: Research Advances and Promising Interventions. Mary Ellen O’Connell, Thomas Boat, and Kenneth E. Warner, Editors. Board on Children, Youth, and Families, Division of Behavioral and Social Sciences and Education. Washington, DC: The National Academies Press.!
!Needham B, Crosnoe R, Muller C. (2004) Academic failure in secondary school: the
interrelated role of health problems and educational context. Social Problems, 51:569–586.!
!Nock, M. K., & Kazdin, A. E. (2002). Examination of affective, cognitive, and
behavioral factors and suicide-related outcomes in children and young adolescents. Journal of Clinical Child & Adolescent Psychology, 31(1), 48.!
!Ostroff, C. (1992). The Relationship Between Satisfaction, Attitudes, and Performance:
an Organizational Level Analysis. Journal of Applied Psychology, 77(5), 963-974.!
!Pianta, R. C., & Nimetz, S. L. (1991). Relationships between children and teachers:
Associations with classroom and home behavior. Journal of Applied Developmental Psychology, 12(3): 379–393.!
!

145
Pianta RC, Belsky J, Houts R, Morrison F. (2007). The NICHD Early Child Care Research Network. Opportunities to learn in America’s elementary classrooms. Science, 315(5820), 1795–1796.!
!Pigott, R. L., & Cowen, E. L. (2000). Teacher race, child race, racial congruence, and
teacher ratings of children’s school adjustment. Journal of School Psychology, 38, 177-196.!
!Reid R, Gonzalez J, Nordness P, et al. (2004) A meta-analysis of the academic status of
students with emotional/behavioral disturbance. Journal of Special Education, 38:130–143.!
!Reynolds, M.R., Sander, J.B. & Irvin, M.J. (2010). Latent Curve Modeling of
Internalizing Behaviors and Interpersonal Skills Through Elementary School. School Psychology Quarterly. 25(4), 189-201.!
!Roeser,R. W., & Eccles, J. S. (1998). Adolescents’ perceptions of middle school:
Relation to longitudinal changes in academic and psychological adjustment. Journal of Research on Adolescence. 8:123–158.!
!Rowan, B., Bossert, S. T., & Dwyer, D. C. (1983). Research on effective schools: A
cautionary note. Educational Researcher, April, 24–31.!!Roza, S. J., Hofstra, M. B., van der Ende, J., & Verhulst, F. C. (2003). Stable prediction
of mood and anxiety disorders based on behavioral and emotional problems in childhood: A 14-year follow-up during childhood, adolescence, and young adulthood. American Journal of Psychiatry, 160(12), 2116–2121.!
!Saab, H. & Klinger, D. (2010). School differences in adolescent health and wellbeing:
Findings from the Canadian Health Behaviour in School-aged Children Study. Social Science & Medicine, 70, 850-858.!
!Schaeffer, C., Petras, H., Ialongo, N., Poduska, J., & Kellam, S. (2003). Modeling growth
in boys’ aggressive behavior across elementary school: Links to later criminal involvement, conduct disorder, and antisocial personality disorder. Developmental Psychology, 3, 1020-1035.!
!Schaffer, H. R. (2002). The early experience assumption: Past present and future. In W.
W. Hartup & R. K. Silbereisen (Eds.), Growing points in developmental science. New York: Psychology Press.!
!Sellstrom, E. & Bremberg, S. (2006). Is there a “school effect” on pupil outcomes? A
review of multilevel studies. Journal of Epidemiology and Community Health, 60, 149-155.!
!

146
Stile, J. (2000). Neural Plasticity and Cognitive Development. Developmental Neuropsychology, 18, 237-72.!
!Taylor, P. B., Gunter, P. L., & Slate, J. R. (2001). Teachers’ perceptions of inappropriate
student behavior as a function of teachers’ and students’ gender and ethnic background. Behavioral Disorders, 26, 146-15!
!Tourangeau, K., Nord, C., Lê, T., Sorongon, A. G., and Najarian, M. (2009). Early
Childhood Longitudinal Study, Kindergarten Class of 1998–99 (ECLS-K), Combined User’s Manual for the ECLS-K Eighth-Grade and K–8 Full Sample Data Files and Electronic Codebooks (NCES 2009–004). National Center for Education Statistics, Institute of Education Sciences, U.S. Department of Education. Washington, DC.!
!United States Department of Health and Human Services. (1999). Mental Health: A
Report of the Surgeon General—Executive Summary. Rockville, MD: U.S. Department of Health and Human Services, Substance Abuse and Mental Health Services Administration, Center for Mental Health Services, National Institutes of Health, National Institute of Mental Health. Retrieved August 15, 2011, from http://www.surgeongeneral.gov/library/mentalhealth/summary.htm!
!Walker, H. M., Colvin, G., & Ramsey, E. (1995). Antisocial behavior in school:
Strategies and best practices. Pacific Grove, CA: Brooks/Cole.!!Way, N., Reddy, R., Rhodes, J. (2007). Students’ Perceptions of School Climate During
the Middle School Years: Associations with Trajectories of Psychological and Behavioral Adjustment. American Journal of Community Psychology.40, 194-213.!
!Way, N. & Robinson, M. G. (2003). Effects of perceived family, friends, and school
experiences on change in self-esteem among urban, low-SES adolescents. Journal of Adolescent Research,18, 324–346.!
!Wilcox, P., & Clayton, R. R. (2001). A multilevel analysis of school-based weapon
possession. Justice Quarterly, 18, 509–541.!!Wilson, S. J., & Lipsey, M. W. (2007). School-based interventions for aggressive and
disruptive behavior: Update of a meta-analysis. American Journal of Preventive Medicine, 33 (Suppl. 2 S), 130−143.!

147
!!
Table 4.1 Correlation Matrix for Socio-emotional Outcomes (Level 1)
1 2 3 4 5 6 7 8 9 10 11 12
Child-reported Behaviors
1. Externalizing (5th) 1.00 2. Internalizing (5th) 0.57 1.00
3. Social Skills (5th) -0.24 -0.20 1.00 4. Externalizing (3rd) 0.51 0.38 -0.19 1.00
5. Internalizing (3rd) 0.38 0.50 -0.15 0.64 1.00 6. Social Skills (3rd) -0.13 -0.09 0.41 -0.16 -0.10 1.00
Teacher-reported Behaviors 7. Externalizing (5th) 0.39 0.17 -0.09 0.29 0.17 -0.05 1.00
8. Internalizing (5th) 0.18 0.18 -0.18 0.15 0.15 -0.09 0.31 1.00 9. Social Skills (5th) -0.36 -0.17 0.16 -0.27 -0.16 0.10 -0.70 -0.38 1.00
10. Externalizing (3rd) 0.36 0.18 -0.13 0.34 0.20 -0.08 0.54 0.16 -0.46 1.00 11. Internalizing (3rd) 0.15 0.16 -0.15 0.15 0.17 -0.10 0.15 0.30 -0.20 0.31 1.00
12. Social Skills (3rd) -0.34 -0.20 0.16 -0.31 -0.21 0.12 -0.45 -0.22 0.46 -0.70 -0.37 1.00 Mean 1.82 2.03 3.00 1.94 2.16 3.04 1.64 1.63 3.15 1.66 1.60 3.17 SD 0.64 0.62 0.60 0.69 0.70 0.62 0.58 0.54 0.59 0.59 0.51 0.59 Min 1 1 1 1 1 1 1 1 1 1 1 1 Max 4 4 4 4 4 4 4 4 4 4 4 4 For all correlations, p<0.001

148
Table 4.2 Correlation Matrix for School Organizational Climate factors (Level 2) 1 2 3 4 5 6 7 8 9
Administrator-reported school organizational climate factors
1. General Facilities 1.00 2. Extracurricular Facilities 0.31*** 1.00
3. Stability 0.16*** 0.13*** 1.00 4. Safety 0.11*** 0.1*** 0.36*** 1.00
5. Comm. Support & School Order 0.17*** 0.14*** 0.5*** 0.39*** 1.00
Teacher-reported school organizational climate factors 6. Interaction 0.07* 0.28*** 0.03 -0.06* 0.08** 1.00
7. Collegiality 0.07** 0.1*** 0.26*** 0.18*** 0.23*** 0.18*** 1.00 8. Leadership 0.06* 0.05 0.2*** 0.17*** 0.25*** 0.15*** 0.52*** 1.00
9. Student Conduct 0.04 0.11*** 0.37*** 0.41*** 0.44*** -0.07** 0.36*** 0.37*** 1.00 Mean 3.58 3.44 4.06 1.82 4.23 3.14 4.21 3.99 3.71 SD 0.66 1.42 0.66 0.23 0.53 0.66 0.43 0.59 0.71 Min 1 1 1 1 1 1 1 1 1 Max 5 5 5 2 5 6 5 5 5 *p<0.05; **p<0.01; ***p<0.001 !

149
!!!!!
Table 4.3 ! ! ! ! ! !Bivariate Models for School Organizational Climate factors
Externalizing Behaviors Internalizing Behaviors Social Skills
!!Student-reported Teacher-reported Student-
reported Teacher-reported
Student-reported
Teacher-reported
Administrator General Facilities -0.029^ 0.019 -0.026^ -0.02 0.023^ -0.018 Extracurricular Facilities -0.070*** -0.007 -0.118*** 0.003 0.059*** 0.012 Stability -0.140*** -0.108*** -0.140*** -0.053*** 0.037** 0.109*** Safety -0.108*** -0.085*** -0.097*** -0.041** 0.026* 0.082*** Community Support & School Order -0.180*** -0.129*** -0.160*** -0.075*** 0.062*** 0.130*** Teacher Teacher Interaction 0.017 0.0298^ -0.043* 0.050** 0.021 -0.026 Staff Collegiality -0.091*** -0.060*** -0.084*** -0.039* 0.032* 0.076*** Leadership -0.056** -0.044** -0.044** -0.037* 0.024^ 0.039*** Student Conduct -0.212*** -0.203*** -0.181*** -0.093*** 0.024^ 0.171*** N=9,173 students in 1,523 schools ^p<0.1 *p<0.05 **p<0.01 ***p<0.001

150
Table 4.4 Multilevel Models for Externalizing Behaviors
Variable+ Self-report Teacher-Report School Organizational Climate
Administrator General Facilities -0.01 (0.01) 0.01 (0.01)
Extracurricular Facilities -0.00 (0.01) -0.00 (0.02) Stability 0.01 (0.01) -0.03^ (0.02) Safety 0.03* (0.01) -0.01 (0.02) Community Support & School Order -0.02^ (0.01) 0.01 (0.02) Teacher
Teacher Interaction 0.02^ (0.01) 0.01 (0.02) Staff Collegiality 0.00 (0.02) 0.00 (0.02) Leadership 0.01 (0.01) 0.02 (0.02) Student Conduct -0.06*** (0.02) -0.09*** (0.02)
Child and Family Third grade behavior 0.39*** (0.01) 0.47*** (0.01)
Gender (Female) -0.28*** (0.02) -0.26*** (0.02) Race/Ethnicity
White Reference Reference African-American 0.00 (0.04) 0.07^ (0.04) Hispanic -0.02 (0.03) -0.03 (0.03) Asian American -0.04 (0.04) -0.14*** (0.04) Other 0.10* (0.04) 0.07 (0.04) Socioeconomic Status
First Quintile Reference Reference Second Quintile -0.09** (0.03) -0.04 (0.03) Third Quintile -0.10** (0.03) 0.02 (0.03) Fourth Quintile -0.16***(0.03) -0.03 (0.03) Fifth Quintile -0.15*** (0.04) -0.06* (0.04) Academic Achievement -0.17***(0.01) -0.06*** (0.00) Parent Depression -0.00 (0.01) -0.00 (0.01) Parent Stress 0.06*** (0.01) 0.06*** (0.01) Parent Warmth -0.02 ^ (0.01) 0.00 (0.01) Family structure (single parent) 0.04 (0.02) 0.05* (0.02)
Teacher Education (Masters or higher) 0.01 (0.02) 0.01 (0.02)
Certification (Certified) -0.01 (0.03) -0.02 (0.04) Years of experience 0.01 (0.01) -0.01 (0.01)

151
!School
Urbanicity Suburban Reference Reference
Large city 0.01 (0.02) 0.07* (0.03) Rural 0.07* (0.03) 0.01 (0.04) Enrollment
! Less than 150 Reference Reference 150-299 -0.02 (0.05) -0.10^ (0.06) 300-499 -0.03 (0.05) -0.16** (0.06) 500-749 -0.04 (0.04) -0.21** (0.06) 750 and above -0.05 (0.06) -0.21** (0.07) Percent Minority
! Less than 10% Reference Reference 10-24% 0.06^ (0.03) -0.01 (0.04) 25-49% 0.03 (0.03) -0.02 (0.04) 50-74% 0.07 (0.04) -0.07 (0.05) 75% or more 0.09* (0.04) -0.09^ (0.05) School-level achievement 0.01 (0.01) 0.02 (0.02) Sector (private) 0.00 (0.03) -0.01 (0.04) Title 1 0.01 (0.02) 0.01 (0.03) ^ p ≤ 0.10 *p ≤0.05 **p ≤0.01 *** p ≤0.001
+Reference categories are male for gender, two-parent household for family structure, than Masters for Teacher Education, non-certified for teacher certification, public school for Sector, not Title I school
!

152
Table 4.5 Multilevel Models for Internalizing Behaviors Variable+ Self-Report Teacher-Report School Organizational Climate
Administrator General Facilities 0.01 (0.01) -0.01 (0.02)
Extracurricular Facilities -0.01 (0.01) -0.00 (0.02) Stability -0.00 (0.01) 0.00 (0.02) Safety 0.03* (0.01) 0.01 (0.02) Community Support & School Order -0.01 (0.01) -0.00 (0.02) Teacher
Teacher Interaction 0.01 (0.01) 0.04^ (0.02) Staff Collegiality 0.02^ (0.01) -0.02 (0.02) Leadership -0.00 (0.01) -0.00 (0.02) Student Conduct -0.02 (0.02) -0.03 (0.02)
Child and Family Third grade behavior 0.39*** (0.01) 0.26*** (0.01)
Gender (Female) -0.00 (0.02) -0.07** (0.02) Race/Ethnicity
White Reference Reference African-American -0.08* (0.04) -0.19*** (0.04) Hispanic 0.03 (0.03) -0.07^ (0.04) Asian American 0.07^ (0.04) -0.10* (0.05) Other 0.01 (0.04) -0.02 (0.05)
Socioeconomic Status First Quintile Reference Reference
Second Quintile -0.13*** (0.03) 0.04 (0.04) Third Quintile -0.18*** (0.03) -0.02 (0.04) Fourth Quintile -0.14*** (0.04) -0.03 (0.04) Fifth Quintile -0.13** (0.04) -0.09* (0.04) Academic Achievement -0.19*** (0.001) -0.15*** (0.00) Parent Depression 0.01 (0.01) 0.02* (0.01) Parent Stress 0.05*** (0.01) 0.03** (0.01) Parent Warmth -0.01 (0.02) 0.01 (0.01) Family structure (single parent) 0.02 (0.02) 0.11*** (0.03)
Teacher Education (Masters or higher) 0.00 (0.02) 0.05^ (0.02)
Certification (Certified) -0.04 (0.03) -0.02 (0.04)

153
School Urbanicity
Suburban Reference Reference Large city -0.01 (0.02) 0.09** (0.03) Rural 0.06* (0.03) -0.05 (0.04) Enrollment
Less than 150 Reference Reference 150-299 0.02 (0.05) -0.08 (0.07) 300-499 0.01 (0.05) -0.16* (0.07) 500-749 0.03 (0.05) -0.16* (0.07) 750 and above 0.07 (0.06) -0.21** (0.08) Percent Minority
Less than 10% Reference Reference 10-24% 0.05^ (0.03) -0.03 (0.04) 25-49% 0.03 (0.03) -0.05 (0.05) 50-74% 0.13** (0.04) -0.04 (0.06) 75% or more 0.15*** (0.04) -0.12^ (0.06) School-level achievement 0.01 (0.01) 0.04^ (0.02) Sector (private) 0.09** (0.03) -0.06 (0.05) Title 1 0.01 (0.02) 0.04 (0.03) ^ p ≤ 0.10 *p ≤0.05 **p ≤0.01 *** p ≤0.001
+Reference categories are male for gender, two-parent household for family structure, than Masters for Teacher Education, non-certified for teacher certification, public school for Sector, not Title I school

154
Table 4.6 Multilevel Models for Social Skills
Variable+ Self-report Teacher-Report
School Organizational Climate Administrator General Facilities -0.01 (0.01) -0.03^ (0.02)
Extracurricular Facilities 0.00 (0.01) 0.00 (0.02) Stability -0.01 (0.01) 0.02 (0.02) Safety 0.00 (0.01) 0.01 (0.02) Community Support & School Order 0.03* (0.02) 0.02 (0.02) Teacher
Teacher Interaction 0.00 (0.01) 0.00 (0.02) Staff Collegiality -0.00 (0.02) 0.00 (0.02) Leadership 0.00 (0.01) 0.03 (0.02) Student Conduct -0.01 (0.02) 0.04* (0.02)
Child and Family Third grade behavior 0.40*** (0.01) 0.38*** (0.01)
Gender (Female) 0.10*** (0.02) 0.31*** (0.02) Race/Ethnicity
White Reference Reference African-American 0.29*** (0.04) -0.08^ (0.04) Hispanic 0.01 (0.03) 0.06^ (0.03) Asian American -0.07^ (0.04) 0.20*** (0.04) Other -0.11* (0.05) -0.06^ (0.05) Socioeconomic Status
First Quintile Reference Reference Second Quintile 0.00 (0.04) 0.04 (0.03) Third Quintile 0.02 (0.04) 0.02 (0.04) Fourth Quintile 0.10** (0.04) 0.08* (0.04) Fifth Quintile 0.13*** (0.04) 0.12** (0.04) Academic Achievement 0.05*** (0.00) 0.11*** (0.01) Parent Depression -0.02 (0.01) 0.00 (0.01) Parent Stress -0.01 (0.01) -0.06*** (0.01) Parent Warmth 0.03** (0.01) 0.01 (0.01) Family structure (single parent) -0.04 (0.03) -0.02 (0.02)
Teacher Education (Masters or higher) 0.01 (0.02) 0.03 (0.02)
Certification (Certified) 0.01 (0.03) 0.07* (0.04) Years of experience 0.01 (0.01) 0.02^ (0.01)
School Urbanicity Suburban Reference Reference
Large city 0.00 (0.02) -0.03 (0.03) Rural -0.05 (0.03) 0.01 (0.04)

155
Enrollment Less than 150 Reference Reference
150-299 -0.01 (0.06) 0.05 (0.07) 300-499 0.01 (0.05) 0.07 (0.07) 500-749 0.05 (0.06) 0.12^ (0.07) 750 and above -0.03 (0.06) 0.11* (0.05) Percent Minority
Less than 10% Reference Reference 10-24% -0.04 (0.03) 0.05 (0.04) 25-49% -0.04 (0.03) 0.09* (0.05) 50-74% -0.04 (0.04) 0.09 (0.06) 75% or more -0.09** (0.04) 0.08 (0.05) School-level achievement -0.01 (0.01) -0.00 (0.02) Sector (private) 0.04 (0.03) 0.04 (0.04) Title 1 0.01 (0.03) 0.01 (0.03) ^ p ≤ 0.10 *p ≤0.05 **p ≤0.01 *** p ≤0.001
+Reference categories are male for gender, two-parent household for family structure, than Masters for Teacher Education, non-certified for teacher certification, public school for Sector, not Title I school
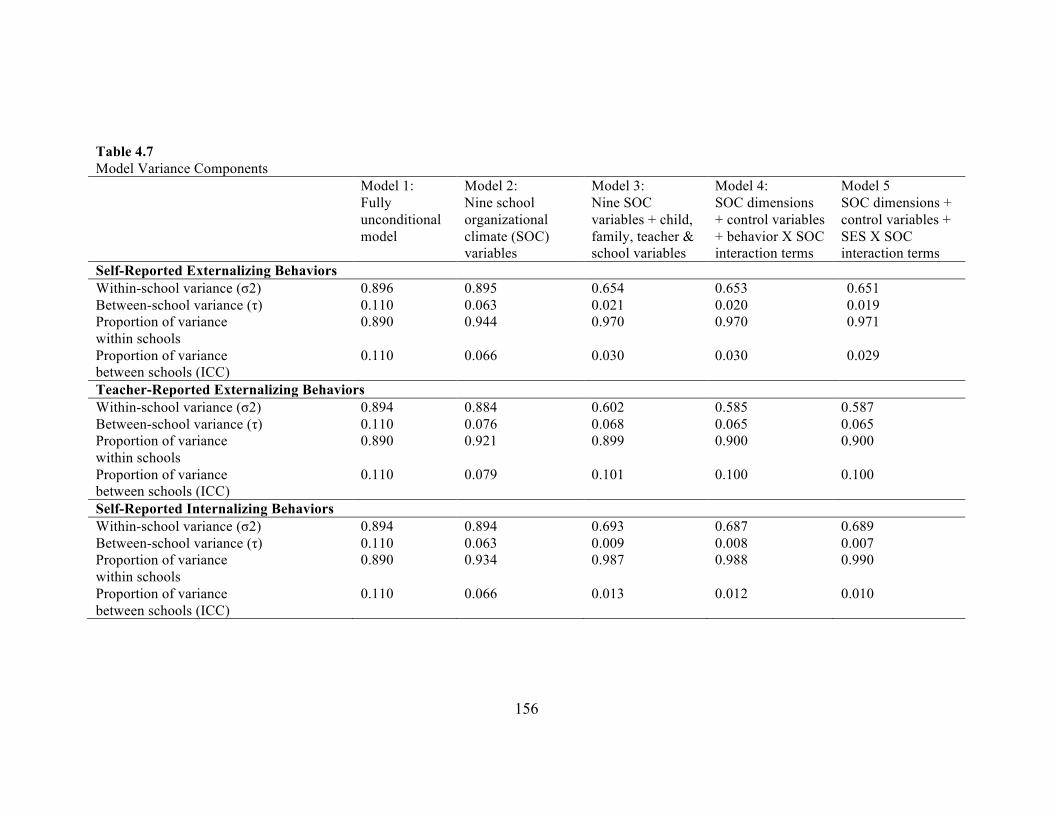
156
Table 4.7 Model Variance Components
Model 1: Fully unconditional model
Model 2: Nine school organizational climate (SOC) variables
Model 3: Nine SOC variables + child, family, teacher & school variables
Model 4: SOC dimensions + control variables + behavior X SOC interaction terms
Model 5 SOC dimensions + control variables + SES X SOC interaction terms
Self-Reported Externalizing Behaviors Within-school variance (σ2) 0.896 0.895 0.654 0.653 0.651 Between-school variance (τ) 0.110 0.063 0.021 0.020 0.019 Proportion of variance within schools
0.890 0.944 0.970 0.970 0.971
Proportion of variance between schools (ICC)
0.110 0.066 0.030 0.030 0.029
Teacher-Reported Externalizing Behaviors Within-school variance (σ2) 0.894 0.884 0.602 0.585 0.587 Between-school variance (τ) 0.110 0.076 0.068 0.065 0.065 Proportion of variance within schools
0.890 0.921 0.899 0.900 0.900
Proportion of variance between schools (ICC)
0.110 0.079 0.101 0.100 0.100
Self-Reported Internalizing Behaviors Within-school variance (σ2) 0.894 0.894 0.693 0.687 0.689 Between-school variance (τ) 0.110 0.063 0.009 0.008 0.007 Proportion of variance within schools
0.890 0.934 0.987 0.988 0.990
Proportion of variance between schools (ICC)
0.110 0.066 0.013 0.012 0.010

157
!
Model 1: Fully unconditional model
Model 2: Nine school organizational climate (SOC) variables
Model 3: Nine SOC variables + child, family, teacher & school variables
Model 4: SOC dimensions + control variables + behaviorXSOC interaction terms
Model 5 SOC dimensions + control variables + SESXSOC interaction terms
Teacher-Reported Internalizing Behaviors Within-school variance (σ2) 0.907 0.907 0.788 0.784 0.783 Between-school variance (τ) 0.096 0.085 0.086 0.082 0.082 Proportion of variance within schools
0.905 0.914 0.902 0.905 0.905
Proportion of variance between schools (ICC)
0.095 0.086 0.098 0.095 0.095
Self-Reported Social Skills Within-school variance (σ2) 0.958 0.956 0.792 0.781 0.791 Between-school variance (τ) 0.043 0.036 0.013 0.013 0.011 Proportion of variance within schools
0.956 0.963 0.984 0.983 0.985
Proportion of variance between schools (ICC)
0.043 0.037 0.016 0.017 0.015
Teacher-Reported Social Skills Within-school variance (σ2) 0.862 0.859 0.627 0.619 0.623 Between-school variance (τ) 0.134 0.108 0.104 0.099 0.099 Proportion of variance within schools
0.866 0.889 0.858 0.862 0.863
Proportion of variance between schools (ICC)
0.134 0.111 0.142 0.138 0.137
158
Chapter Five
Understanding the Link Between the School Work Environment and Students’ Socio-Emotional Development: the Role of Teacher Job
Satisfaction
159
Abstract
Background: In addition to influencing students’ socio-emotional outcomes directly,
school context can influence teachers’ ability to create a classroom environment that
prevents problem behaviors and promotes positive social skills.
Methods: Using data from two waves of the Early Childhood Longitudinal Study-
Kindergarten Class (ECLS-K), multi-level models consisting of 9,173 fifth grade
students, 3,448 fifth grade teachers, and 1,523 schools were estimated to examine the
relationship between dimensions of school organizational climate, teacher job satisfaction
and students’ socio-emotional outcomes.
Results: After controlling for teacher and school characteristics, five dimensions of
school organizational climate—Staff Collegiality, Leadership, Student Conduct,
Community Support and School Order, and Stability—were significantly positively
associated with teachers’ job satisfaction. The association between teacher job
satisfaction and four of the socio-emotional outcomes was significant, but small.
Conclusion: Findings indicate that teachers are more satisfied when they work in schools
in which staff respect each other and are continually learning; the principal encourages
and guides staff; there are low levels of student misbehavior, bullying and physical
conflict; parents and the community are supportive; and there are low levels of turnover
and absence among students and staff. Given the association between teachers’ job
satisfaction and students’ socio-emotional outcomes, efforts to enhance teachers’ job
satisfaction may also be a way to promote positive socio-emotional development in
students.

160
Introduction
Although schools’ primary focus is on educational outcomes, there has been
growing acknowledgement of the role of schools in promoting positive development of
other youth outcomes, including socio-emotional health (Masten, 2003; Atkins et al.,
2010). While there are many factors and contexts that contribute to socio-emotional
development in middle childhood, the role of schools is of particular interest because of
the amount of time children spend in schools, as well the role of schools in socialization.
Schools can be a normative context in which children have the opportunity to receive
supports to help prevent the development of behavior problems (Baker et al., 2008;
Bronfenbrenner,1979), such as through relationships with competent and caring adults
and mastery experiences to build self-efficacy (Masten, 2001).
Research in organizational psychology has demonstrated the importance of one’s
work environment on performance and behavior (Moffitt, 2006). There is evidence that
dimensions of the school organizational climate, particularly leadership and safety, have
an impact on academic achievement, primarily due to the mediating effect of teacher
behaviors, such as how actively teachers promote student learning (Roeser, 2000; Kessler
et al.,2005). Other teacher factors, particularly teachers’ interactions with students and
the teacher-student relationship, are also a likely mediator of the relationship between
school organizational climate and students’ socio-emotional outcomes. Support for
teachers, both from the administration and other teachers, can increase their ability and
commitment to address students’ emotional and behavioral needs (Cheney et al., 2002).
Different constructs, such as stress and burnout, have been used to assess
teachers’ well-being. Job satisfaction can also be a measure of teachers’ well-being. As

161
Jennings and Greenberg (2009) demonstrate in their model of the Prosocial Classroom, in
addition to influencing students’ outcomes directly, school contextual factors can
influence teachers’ well-being and socio-emotional competence, which in turn affects
their ability to create a classroom environment that promotes positive student
development. !Specifically, teachers’ level of well-being can affect their ability to
develop supportive relationships with students, establish and implement behavioral
guidelines, coach students through conflict situations, encourage cooperation among
students, and act as a role model for prosocial behavior (Jennings and Greenberg, 2009).
For example, teachers with higher stress levels use more harsh discipline and spend less
time engaging students in a positive manner (Bibou-Nakou, Stogiannidou, &
Kiosseoglou, 1999; Capel, 1992). Additionally, high-quality teacher-student relationships
in elementary school, characterized by high levels of warmth and closeness and low
levels of conflict, are associated with lower levels of externalizing and internalizing
problems, and better social skills (Pianta & Nimetz, 1991; Birch & Ladd, 1998;
Henricsson & Rydell, 2004; Maldonado-Carreno & Votruba-Drzal, 2011). Results of a
study by Maldonado-Carreno and Votruba-Drzal (2011) indicate that the quality of the
teacher-student relationship is positively associated with lower levels of externalizing and
internalizing behaviors through fifth grade. They also found that the importance of
teacher-child relationship quality did not decline between kindergarten and fifth grade.
Using data from the Early Childhood Longitudinal Study-Kindergarten Class
(ECLS-K), this study examined the relationship between school organizational climate,
teacher job satisfaction, and students’ socio-emotional outcomes in late elementary
school.

162
Defining School Organizational Climate and Job Satisfaction
There is a history of research examining the organizational climate in work
settings. Gilmer (1964) described organizational climate as “those characteristics that
distinguish the organization from other organizations and that influence the behavior of
people in the organization.” Reichers and Schneider (1990) defined organizational
climate as “shared perceptions of organizational policies, practices and procedures, both
formal and informal.”
The concept of organizational climate has also been applied to the specific context
of schools. Although “school climate” has been defined in many ways, and has
sometimes included organizational climate, this study specifically examined the effects of
school organizational climate. Consistent with the definition of school organizational
climate put forth by Hoy et al. (1991), this study used data collected from school staff
about perceptions of their school work environment.
Job satisfaction is frequently studied within the field of organizational
psychology. A commonly used definition of job satisfaction comes from Locke (1976),
who defined job satisfaction as “a pleasurable or positive emotional state resulting from
the appraisal of one’s job.” Teachers’ job satisfaction has been identified as an important
outcome because of its links to teacher attrition and retention, motivation, well-being, and
commitment to teaching (Cockburn, 2000; Cohn, 1992; McLaughlin, Pfeifer, Swanson-
Owens, & Yee, 1986; Meek, 1998; Wriqi, 2008; Zembylas & Papanastasiou, 2004 from
Skaalvik).
School Organizational Climate and Teacher Job Satisfaction
A variety of sources can influence teacher job satisfaction (Dinham and Scott,

163
2001) including intrinsic teacher qualities, factors external to the school such as external
perceptions of schools and the status of teachers, and school-based factors, which were
the focus of this study. There is some evidence from previous research that school
organizational climate is associated with teacher job satisfaction. A study of public
schools using data from the national Schools and Staffing Survey found that positive
student behavior and administrative support had significantly positive, small effects on
teacher job satisfaction. Staff collegiality had significantly positive, moderate, and large
effects on teacher job satisfaction (Shen et al., 2012). In a study of high school teachers
using data from the National Educational Longitudinal Study (NELS), principal
leadership, student discipline, and faculty collegiality were all significantly associated
with teacher satisfaction (Taylor and Tashakorri, 1995). Skaalvik et al. (2011) found that
job satisfaction was positively related to supervisory support, relations with colleagues,
and relations with parents and negatively related to discipline problems in a sample of
Norwegian elementary and middle schools. Other research has demonstrated links
between job satisfaction and support from administrators, cooperation with colleagues,
support from parents, and student misbehavior and violence (Leithwood & McAdie,
2007; Perie & Baker, 1997; Thornton, 2004). In a study of Chinese teachers, collegial
relations were only weakly related to job satisfaction (Wriqi, 2008 from Skaalvik).
Teacher Job Satisfaction and Children’s Socio-emotional Development
Previous research in organizational psychology has demonstrated a positive
relationship between job satisfaction and job performance (Judge, Bono, Thoresen, &
Patton, 2001 from Liu). Most studies examining the link between job satisfaction and job
performance in schools have examined the relationship between teacher job satisfaction

164
and students’ academic outcomes, providing some evidence that they are connected,
although the effect has generally been small (Johnson et al., 2012; others?). Although
previous research has not examined the link between teacher job satisfaction and student
socio-emotional outcomes, a few studies have explored the association of other teacher
psychosocial factors, such as self-efficacy, burnout and well-being, with student socio-
emotional outcomes. Previous studies have found teacher well-being, satisfaction and
commitment to be associated with lower student drop-out and disciplinary problems and
better attendance (Brand, 2008; Denny, 2011; Leblanc et al, 2008; Ostroff, 1992). Denny
et al. (2011) found that in secondary schools where teachers reported higher levels of
well-being, fewer students reported significant levels of depressive symptoms. Another
study found that child care providers who reported higher levels of depression were less
sensitive to children’s needs and more withdrawn than providers who reported lower
levels of depression (Hamre and Pianta, 2004). However, not all of these studies have
used multilevel modeling to account for clustering of students within schools or
sufficiently accounted for other potential explanatory factors.
School Organizational Climate, Teacher Job Satisfaction and Socio-emotional outcomes
Although there have been no previous studies examining the relationship between
school organizational climate, teacher job satisfaction and socio-emotional outcomes in
particular, studies examining other measures of organizational climate, employee
satisfaction and student outcomes have found varying relationships. For example, some
studies have found no significant direct effect between principal leadership and student
outcomes, but did find an indirect effect on students’ outcomes through school staff’s job
satisfaction (Griffith, 2003; Hallinger et al., 1996; Blasé et al, 1986; Bossert et al., 1982).
165
Given teachers’ direct interactions with students and the importance of the teacher-
student relationship, particularly in elementary school, it is not surprising to find this
indirect effect even in the absence of a direct effect of leadership. Similarly, Goddard et
al. (2007) concluded that the relationship between teacher collaboration and student
achievement is likely indirect.
Research Gap and Questions
Although previous research has found support for the relationship between school
organizational climate and job satisfaction, additional research is needed to determine if
job satisfaction then affects children’s socio-emotional development. This study also
extends previous research by using multi-level methods and utilizing both child and
teacher report to measure socio-emotional outcomes. The following research questions
were addressed:
1. Are dimensions of school organizational climate associated with teachers’ job
satisfaction? Specifically, are some dimensions more strongly associated than
others?
2. Is teacher job satisfaction associated with students’ socio-emotional outcomes?
Are some outcomes more strongly related to teachers’ job satisfaction?
3. Does job satisfaction mediate the relationship between school organizational
climate and students’ socio-emotional development?
Methods
Data
Data for this study came from the Early Childhood Longitudinal Study-
Kindergarten Class (ECLS-K), which is maintained by the National Center for Education

166
Statistics (NCES). The ECLS-K selected a nationally representative sample of
kindergarten students in the fall of 1998 and followed those students through eighth grade
(Tourangeau et al., 2009). Children in the study represent diverse socioeconomic and
racial/ethnic backgrounds and were selected from public and private, and both half- and
full-day, kindergarten classes. The sample was selected using a multistage probability
sample design, beginning with 100 primary sampling units (counties or groups of
counties), then 1,280 schools, and finally 22,666 students. The probability of school
selection was proportional to a weighted measure of size based on the number of
kindergarteners enrolled. Public and private schools were distinct sampling strata.
Schools were sorted within each stratum to achieve sample representation across other
characteristics. The initial sample of kindergarten students included approximately 953
public schools and 460 private schools.
The sample for this study was restricted to children in ECLS-K who attended the
same school for third and fifth grade because the school context was the predictor of
interest and therefore needed to remain constant. The sample included students who
attended both public and private schools, resulting in a final sample of 9,173 fifth grade
students, 3,448 fifth grade teachers, and 1,523 schools.
This study used data collected in the spring of the third and fifth grade years from
multiple sources, including parent interviews, self-administered teacher questionnaires,
teacher assessments of children, self-administered principal questionnaires, child
assessments, third-party observations, and student records. Information about the home
environment and demographic variables came from parent interviews, which were
computer assisted interviews conducted by telephone. Teachers completed self-
167
administered questionnaires, which assessed school and classroom characteristics,
instructional practices, and teacher background. Teachers also completed individual
assessments for each child in the study.
In fifth grade, up to two teachers per child could complete the teacher survey that
included questions about school organizational climate and job satisfaction. Each child’s
reading teacher was asked to complete the survey, and either the math or science teacher
was asked to complete the same survey.
The principal of the school attended by the sampled child completed the school
administrator questionnaire in the spring of third and fifth grade. This questionnaire
included questions about the school, student body, teachers, school policies and the
administrator’s background. Although a designee could complete the sections containing
factual information about the school and programs offered, the principal was asked to
complete the sections about their background and the school climate.
Missing data were addressed using multiple imputation (with STATA’s “impute
chained” command [Stata- Corp, College Station, TX]) with twenty imputed datasets. All
variables in the analyses, including outcome variables, were imputed. Percent missing for
all variables was under 15%; for most variables, percent missing was less than 5%. In
order to maintain the multi-level structure of the data, students from the same school
were assigned the same imputed values for school-level variables.
Measures
Students’ socio-emotional outcomes
Students’ socio-emotional outcomes were based on both teacher and student
report for a total of six student socio-emotional outcomes: teacher-rated peer relations,

168
externalizing behaviors, and internalizing behaviors; self-rated peer relations,
externalizing behaviors, and internalizing behaviors.
Teachers rated individual students’ social development using the Social Rating
Scale (SRS). The SRS used in the ECLS-K was adapted from the Social Skills Rating
Scale: Elementary Scale A (SSRS), which was created by Gresham and Elliott (1990) and
is a reliable and valid measure of children’s social development (Demaray et al., 1995).
Exploratory factor analyses were used to provide evidence of the validity of teacher SRS
scales with the fifth grade ELCS-K sample (Pollack et al., 2005). The split-half
reliabilities for the SRS scales range from 0.77 to 0.92 in the fifth grade sample
(Tourangeau et al., 2009). The Peer Relations scale is a combination of items from the
Interpersonal Skills and Self-Control scales, which assess skills related to friendships,
positive peer interactions, and controlling behaviors. The Externalizing Problem
Behaviors scale has items that assess the frequency with which a child argues, fights, gets
angry, acts impulsively, and disturbs ongoing activities. The Internalizing Problem
Behaviors scale includes items that address the apparent presence of anxiety, loneliness,
low self-esteem and sadness. All items were assessed on a 4-point scale: 1 (student never
exhibits behavior), 2 (student exhibits this behavior occasionally or sometimes), 3
(student exhibits this behavior regularly but not all the time), and 4(student exhibits this
behavior most of the time). The score for each scale is the mean rating of the items
included in that scale. Higher scores for peer relations indicate positive socio-emotional
development. Higher scores for externalizing and internalizing behaviors indicate
negative socio-emotional development.

169
For self-reported outcomes, items for the peer relations scale were adapted from
the Self-Description Questionnaire I (Marsh, 1990). Items for the two problem behavior
scales were developed specifically for the ECLS-K. The SDQ Peer scale consists of six
items that capture how well the students make friends and get along with their peers, as
well as their perceived popularity. The SDQ Anger/Distractibility scale has six items that
measure children’s perceptions of their externalizing problem behaviors, such as fighting
and arguing with other children, talking and disturbing others, and problems with
distractibility. The SDQ Sad/Lonely/Anxious scale includes eight items about
internalizing behaviors, such as feeling “sad a lot of the time,” feeling lonely, feeling
ashamed of mistakes, feeling frustrated and worrying about school and friendships. Like
the SRS scale scores, SDQ scale scores also have a 4-point scale based on frequency of
behaviors and the scale score is the mean of the items within the scale.
To facilitate interpretation of coefficients, scores from all six scales were
standardized to have a mean of zero and standard deviation of one.
Teacher Job Satisfaction
Teacher job satisfaction measured at the individual teacher level and was a
composite variable consisting of the mean of three items on the fifth grade teacher
survey, which were all answered on a Likert scale from 1 (strongly disagree) to 5
(strongly agree). The items were: “I really enjoy my present teaching job,” “I am certain
I am making a difference in the lives of the children I teach,” and “If I could start over, I
would choose teaching again as my career.” The alpha for these items indicated
acceptable reliability (α=0.70). Although two other items asked related questions, factor
analysis indicated these items measured different constructs. Including these items also

170
significantly decreased reliability of the scale. One of these items was used as a control
variable: “I worry about the security of my job because of the performance of the children
in my class(es) on state or local tests.” For this study, the reading teacher’s report of job
satisfaction was used, since that was the child’s only or primary fifth grade teacher.
School Organizational Climate
Data used to measure the school context came from two sources: school
administrator questionnaires and teacher questionnaires. Factor analysis was conducted
separately for the administrator items and teacher items and resulted in nine scales. Six of
these scales were used in this study. All scales have acceptable internal reliability based
on ordinal alpha values above 0.70. Factors from the school administrator questionnaire
include the following: Safety consists of three items about the frequency of weapons,
fights and attacks (ordinal alpha=0.79). Stability has three items that ask about student
absence, teacher tardiness and teacher turnover (ordinal alpha=0.74). Community Support
& School Order consists of 4 items about parent and community support, teacher
consensus, and order (ordinal alpha=0.81).
Three factors based on the teacher questionnaire were used: Student Conduct
consists of three items that reflect students’ misbehavior, physical conflicts and bullying
(ordinal alpha=0.84). Staff Collegiality (ordinal alpha=0.80) includes three items that
capture teachers’ relationships with each other and overall morale in the school.
Leadership consists of four items that measure teachers’ perceptions of the school
administrator’s leadership (ordinal alpha=0.93).
All items were coded such that higher scores indicate a more positive school
environment. Scale scores were calculated by taking the mean of all items in the scale.
171
For these analyses, the assumption was that the school organizational climate is an
organization-level characteristic and each teacher is a separate rater of the same entity of
school context. Based on previous research that indicates stability in school
organizational climate over several years (Brand et al., 2008), the school organizational
climate measures from third and fifth grade teachers within the same schools were
combined. The school-level scale score for each dimension of school organizational
climate was determined by summing the responses from all teachers in a school (from
both the third grade and fifth grade waves of ECLS-K) and dividing by the total number
of teachers contributing data for that school. All scale scores were standardized at the
school level to have a mean of zero and standard deviation of one.
Control Variables
Child and Family Characteristics
Gender was coded as 0=female and 1=male. The ECLS-K dataset includes a
composite variable for race/ethnicity that has 8 categories. For this study, some of these
categories were combined to create a total of five categories consistent with Crosnoe and
Cooper (2010): White, African-American, Hispanic, Asian and Other.
Because of the relationship between educational and socio-emotional outcomes,
students’ academic achievement was included as a covariate (Needham et al., 2004;
Gutman et al., 2003; Dipema & Elliott, 2002). The overall reading scale score in fifth
grade and the overall math scale score in fifth grade were based on a direct cognitive
assessment scored using Item Response Theory (IRT). Due to collinearity, academic
achievement was calculated as the mean of the math and reading scores.

172
Socio-economic status (SES) is an existing composite variable in the ECLS-K
dataset made up of the following variables from the parent questionnaire: father/male
guardian’s education, mother/female guardian’s education, father/male guardian’s
occupation, mother/female guardian’s occupation, and household income. The composite
SES variable is categorical, with 1 representing the first quintile (lowest status) and 5
representing the fifth quintile (highest status). Family structure was a dichotomous
variable with 1=single-parent household and 0=two-parent household.
Parent depressive symptoms consists of 12 items from the parent questionnaire
(most often answered by the child’s mother) based on a subset of the Center for
Epidemiologic Studies-Depression Scale. Symptom level was assessed in the previous
week, and had four possible responses: never, some of the time, moderate amount of the
time, and most of the time. Examples include “How often during the past week have you
felt that you could not shake off the blues even with help from your family and friends?”
and “How often during the past week have you felt depressed?”
Factor analysis was used to identify two constructs related to parenting using
items in the third grade parent questionnaire. Parental warmth includes four items about
affection between parent and child. Parental stress consists of four items that ask about
parents’ feelings of anger and frustration toward the child and related to parenting. These
composite variables are the same as those used in previous studies using the ELCS-K
(Crosnoe & Cooper, 2010; Beaver et al., 2008).
School Composition
Although school organizational climate dimensions were the primary school-level
variables of interest, previous research has shown that both school organizational climate

173
and job satisfaction are associated with other school characteristics. For example, Perie
and Baker (1997 from Shen) found that teachers in suburban schools have the highest
levels of job satisfaction, and school size and percentage of minority students were
negatively associated with job satisfaction. Data for these variables came from the fifth
grade school administrator questionnaire when available. If these variables were missing
in the fifth grade wave, data from the third grade school administrator questionnaire was
used if available.
Sector was a dichotomous variable based on the school being public (=0) or
private (=1). Student enrollment was categorical: 0-149 (reference), 150-299, 300-499,
500-749, 750 and above. Percent minority was also categorical: less than 10%
(reference), 10%-less than 25%, 25-less than 50%, 50-less than 75%, 75% or more. Title
1 status was dichotomous (receive Title I benefits or not). School urbanicity consisted of
three categories: suburban (reference), city, and rural. The variable for school-level
academic achievement was the mean of percent of students in school at or above grade
level in math and percent of students at or above grade-level in reading. Higher values of
this variable indicate higher levels of school-level academic achievement (a greater
proportion of students are achievement at or above grade level).
Teacher Characteristics
Because previous research has found a relationship between teacher experience
and certification and students’ outcomes, several individual teacher characteristics were
included in the analyses. These variables were all self-reported by the fifth grade reading
teacher. Years of experience as a teacher was a continuous variable. Consistent with
previous studies using the ECLS-K, highest level of education was dichotomized

174
(1=Masters or higher). Similar to Jennings et al. (2010) and Crosnoe & Cooper (2010),
certification was also coded dichotomously, with the regular or standard state certificate
as the reference category. Teacher’s race was a dichotomous variable (1=non-white). Job
security concerns were assessed using a single item: “I worry about the security of my
job because of the performance of the children in my class(es) on state or local tests.”
(1=Strong disagree-5=Strongly agree).
Analysis
Multilevel multivariate regression was used to account for the clustering of
students and teachers within schools. It also allows for partitioning of outcome variance
(between and within school effects) to better assess school-level effects. For the first step,
examining the relationship between school organizational climate dimensions and teacher
job satisfaction, two-level models were used with teachers at Level 1 and schools at
Level 2. All of these models controlled for school and teacher characteristics.
To examine the relationship between teach job satisfaction and students’ socio-
emotional outcomes, three-level models were estimated that consisted of students at
Level 1, teachers at Level 2 and schools at Level 3. Models also controlled for child,
family, teacher and school composition variables, including third grade behaviors. Two
sets of models were used to determine if teacher job satisfaction mediated the relationship
between school organizational climate (SOC) and socio-emotional outcomes. In the first
set, SOC dimensions were entered in separate models to determine the unique effect of
each one. In the second set of models, the job satisfaction variable was added and the
change in the coefficient for the SOC variable was examined. Autoregressive techniques
were used to analyze change over time by predicting fifth grade outcomes net of third

175
grade outcomes. A similar approach has been used by other researchers utilizing ECLS-K
data, although primarily for outcomes in earlier grades (Li-Grining et al., 2006;
McClelland et al., 2000, Claessens, Duncan, & Engel, 2009, Duncan et al, 2007).
These models all controlled for child/family, teacher and school covariates. All
continuous Level 1 variables were standardized (and therefore grand-mean centered) to
facilitate interpretation and comparability of coefficients (Like, 2004 from Pas Teacher
and School).
Results
Association between school organizational climate and teacher job satisfaction
Analyses of the unconditional model indicated an ICC of 0.07, meaning
approximately 7% of the variation in teacher satisfaction was between schools. All three
of the teacher-reported school organizational climate dimensions were statistically
significantly related to job satisfaction. Staff Collegiality was most strongly associated
with job satisfaction. Other variables being equal, an increase of one standard deviation
in school-level staff collegiality was associated with nearly one quarter of a standard
deviation increase in job satisfaction. Only one of the administrator-reported
organizational climate variables was significant, Stability (β=0.04, p<0.05), and the
coefficient was much smaller than the coefficients for the teacher-reported dimensions,
which ranged from 0.16-0.23. Safety was not significantly related to job satisfaction. The
complete results are shown in Table 1.
As previous studies have found, teachers in urban schools reported lower levels of
satisfaction than those in suburban schools. Also as expected, job security concerns due
to test scores were negatively associated with job satisfaction. Although previous studies
176
have found lower levels of job satisfaction in bigger schools, there was some indication
that teachers in bigger schools had marginally higher levels of satisfaction than teachers
in the schools with fewer than 150 students. However, the relationship was not linear.
The largest benefit appeared to be for the middle size group (300-499 students).
Association between teacher job satisfaction and students’ socio-emotional outcomes
As shown in Table 2, the association between teacher job satisfaction and four of
the socio-emotional outcomes was significant, but small. Student-reported social skills
were marginally associated with teacher job satisfaction, and teacher-reported
internalizing behaviors were not associated with teacher job satisfaction. As expected, the
association was negative for externalizing and internalizing behaviors, indicating fewer
problem behaviors among students with teachers reporting greater job satisfaction. The
association was positive for social skills, such that better social skills were reported for
students with more satisfied teachers. The relationship was stronger for teacher-reported
outcomes than for child-reported outcomes. Teacher job satisfaction was most strongly
related to teacher-reported social behaviors, for which the coefficient (β= 0.06; p<0.001)
was at least twice as large as the coefficients for the other outcomes.
School organizational climate and students’ socio-emotional outcomes
Although Staff Collegiality and Leadership were strongly associated with job
satisfaction, they were not significantly associated with any of the six socio-emotional
outcomes. Student Conduct was significantly associated with three of the six outcomes in
the expected directions. Higher levels of Student Conduct were associated with fewer
self-reported and teacher-reported externalizing behaviors, and more teacher-reported
social skills. Better Community Support & School Order was related to lower levels of

177
self-reported externalizing behaviors and marginally related to more self-reported social
skills. Finally, Stability was negatively associated with teacher-reported externalizing
behaviors, indicating fewer externalizing behaviors in schools with greater stability.
Teacher job satisfaction was added to the models described above if both the
school organizational climate variable and teacher satisfaction were significantly
associated with the outcome. The change in the coefficient for the school organizational
climate variable before and after adding job satisfaction was observed to determine
whether or not job satisfaction mediated the relationship. Table 3 shows the results of
these analyses. Although many of the coefficients for the school organizational climate
variables decreased slightly after adding job satisfaction, the reductions were all less than
ten percent (e.g. the coefficient for Student Conduct decreased from 0.052 to 0.049,
which is a 5% reduction). Based on these results, there was little evidence of mediation
by job satisfaction for the relationship between Student Conduct, Community Support &
School Order, and Stability and externalizing behaviors.
There were no significant associations between school organizational climate
variables and internalizing behaviors, or between job satisfaction and internalizing
behaviors. For this reason, no mediation relationships were explored for internalizing
behaviors. For similar reasons, no mediation was tested for child-reported social skills.
There was evidence that the relationship between Student Conduct and teacher-reported
social skills was mediated by job satisfaction. After adding job satisfaction to the model,
the coefficient for Student Conduct decreased by 23% and became insignificant.
178
Discussion
The purpose of this study was to determine if teacher job satisfaction was a
pathway by which school organizational climate affects students’ socio-emotional
outcomes. While there was evidence of a strong relationship between school
organizational climate and teacher job satisfaction, the relationship between job
satisfaction and socio-emotional outcomes was small. Job satisfaction was found to
mediate only one relationship: between Student Conduct and teacher-reported social
skills.
School Organizational Climate and Job Satisfaction
This study found that, after controlling for teacher and school characteristics, five
dimensions of school organizational climate—Staff Collegiality, Leadership, Student
Conduct, Community Support & School Order, and Stability—were significantly
associated with teachers’ job satisfaction. Higher levels of each of these dimensions at the
school-level were linked to greater job satisfaction among teachers. The teacher-reported
measures, which included Staff Collegiality, Leadership, and Student Conduct, were more
strongly associated with teacher satisfaction than the administrator reported measures.
While this may be partly due to teachers reporting both the predictor and outcome, school
organizational climate was based on aggregated teacher values at the school level and job
satisfaction was an individual teacher-level variable. These findings are also consistent
with previous research that has found collegiality, leadership and student conduct to be
particularly important (Johnson et al., 2012) and are in-line with organizational theories
that emphasize the importance of the work environment for employee satisfaction.
Findings indicate that teachers are more satisfied when they work in schools in which

179
staff respect each other and are continually learning, the principal encourages and guides
staff, there are low levels of student misbehavior, bullying and physical conflict, parents
and the community are supportive, and there are low levels of turnover and absence
among students and staff. Safety was not significantly associated with teacher job
satisfaction. There may have not been sufficient variation in this measure of school
organizational climate. Consistent with previous research, teachers in urban schools
reported lower job satisfaction compared to those in suburban schools (Shen et al., 2012;
Liu and Ramsey, 2008). Individual teacher characteristics were not noticeably related to
teachers’ job satisfaction.
Teacher Job Satisfaction and Socio-emotional outcomes
Teacher job satisfaction was significantly associated with four of the six of the
socio-emotional outcomes examined in this study. Teacher job satisfaction was most
strongly associated with two of the teacher-reported outcomes: externalizing behaviors
and social skills. Students with more satisfied teachers demonstrated lower levels of
externalizing behaviors and self-reported internalizing behaviors, as well as higher levels
of social skills. The findings are similar across reporters, although the relationship is
stronger for teacher-reported student behaviors. This may be due to the fact that the same
teacher responded about both job satisfaction and teacher-reported behaviors.
School Organizational Climate and Socio-emotional outcomes
Of the three types of socio-emotional outcomes, externalizing behaviors were the
most influenced by school organizational climate. Social skills were somewhat affected,
and there was little effect of school organizational climate on internalizing behaviors.
Only some dimensions of school organizational climate were associated with socio-

180
emotional outcomes. Despite being strongly associated with job satisfaction, Staff
Collegiality and Leadership were not significantly associated with any of the six socio-
emotional outcomes. This finding coincides with previous research that has found lack of
a direct effect of principal leadership on academic outcomes, but significant effects on
teacher attitudes and satisfaction, which are more proximal outcomes (Griffith, 2004;
Hallinger et al., 1996). Student Conduct was significantly associated with both self-
reported and teacher-reported externalizing behaviors, as well as teacher-reported social
skills. Community Support and School Order was negatively associated with self-rated
externalizing behaviors, while Stability was negatively associated with teacher-rated
externalizing behaviors.
Teachers’ job satisfaction partially mediated one of these relationships, providing
some insight into a possible pathway connecting school organizational climate and
students’ socio-emotional outcomes. Teachers who work in schools with more
supportive environments are more satisfied, and this greater level of satisfaction likely
influences the way they act with students, enabling them to better promote positive
development. Other studies have linked teachers’ job satisfaction with teacher
empowerment, self-efficacy and lower levels of burnout, all of which may help explain
the link between job satisfaction and students’ outcomes (Wriqi, 2008; Zembylas &
Papanastasiou, 2004). Although Staff Collegiality and Leadership were strongly
associated with job satisfaction and job satisfaction was related to most of the socio-
emotional outcomes, there was not a direct relationship between these two dimensions of
school organizational climate and socio-emotional outcomes.

181
All of the school organizational climate dimensions tap into staff perceptions of
their working environment, but some of the dimensions can be experienced more directly
by students. For example, Student Conduct is a characteristic of the school environment
that students can experience directly, such as by being a perpetrator or victim of bullying.
This is in contrast to dimensions of school organizational climate such as Leadership and
Staff Collegiality, which only teachers experience directly. For this reason, it is not
surprising that Student Conduct is directly associated with socio-emotional outcomes,
while Leadership and Staff Collegiality are only indirectly associated with students’
outcomes through job satisfaction.
Given the presence of indirect relationships but lack of direct relationships, multi-
dimensional nature of school organizational climate, and possible relationships between
different dimensions of school organizational climate, structural equation modeling
(SEM) may be a more appropriate method for understanding the set of relationships
examined in this study. Many previous studies, like this study, have used multi-level
regression to examine mediation in clustered data. However, authors such as Preacher et
al. (2010, 2011) have identified potential limitations of using multi-level regression to
examine mediation and have asserted that multi-level structural equation modeling may
provide less biased values for mediation effects in clustered data.
Limitations and Strengths
It is important to acknowledge some of the limitations of this study. First,
measurement of teacher job satisfaction and dimensions of school organizational climate
and were limited by the variables available in the ECLS-K. Although these variables
demonstrated acceptable psychometric properties, each one was comprised of only a few

182
items. Other studies examining teacher job satisfaction have included multiple
dimensions of the construct. Similarly, instruments such as the Organizational Health
Inventory (OHI) include 5-10 items for each dimension. In this study, measurement of
the school organizational climate was based on only a few reporters per school (several
teachers and the administrator). Although previous research supports the concept of
school organizational climate as a school-level characteristic experienced by all staff
members, individual characteristics of staff can influence their perceptions (Bevans et al.,
2007). Based on previous research that indicates stability in school organizational climate
over several years, the school organizational climate measures from teachers and
administrators in third and fifth grade were combined. A benefit of this approach is that it
provides data about the school organizational climate from more reporters. A potential
problem is that there may be changes in the school between the third and fifth grade
ECLS-K administrations, such as a new principal, that have important effects on the
school organizational climate. The inclusion and exclusion criteria for the study sample
may affect the generalizability of the findings. Because the sample is limited to children
who stayed in the same school from third grade until fifth grade, children who moved
during this time are excluded. This means the findings are generalizable only to students
who remain in the same school for three years. Children who were excluded because of
their mobility may be at higher risk for psychopathology, since previous research has
found that multiple household moves contribute to social, emotional and behavioral
problems in children (Ackerman et al., 1999; Humke & Shaefer, 1995).
Despite these limitations, this study has several strengths. While observational
techniques for assessing children’s socio-emotional outcomes would have been optimal

183
(Pianta et al., 2007), one of the strengths of this study is that multiple reporters were used
to measure students’ socio-emotional outcomes. This is particularly important given
school organizational climate and teacher job satisfaction were both teacher-reported, and
shared method variance can lead to inflated relationships. The richness of this dataset
also made it possible to control for a range of student, teacher and school variables,
which makes the findings more robust.
Implications
This study applied research in organizational psychology linking job satisfaction
and job performance to the school setting by examining the relationship between
teachers’ work conditions, job satisfaction and students’ socio-emotional outcomes.
Findings highlight the importance of Staff Collegiality, Leadership, and school-wide
Student Conduct for teachers’ job satisfaction. Consistent with past research on the
relationship between school organizational features and students’ outcomes, results of
this study indicated only a few small direct associations between dimensions of the
school organizational climate and students’ socio-emotional outcomes. As Tobin et al.
(2006) have pointed out, the link between school characteristics and students’ outcomes
may be better conceptualized as being mediated by teacher attitudes and behaviors.
Although teachers’ job satisfaction mediated one of the significant relationships between
school organizational climate dimensions and students’ outcomes, additional research is
needed to identify teacher characteristics that may mediate the link between other
dimensions of school organizational climate and students’ socio-emotional outcomes.
Teachers’ job satisfaction is an important outcome on its own, particularly given links to
teacher retention. The association between teachers’ job satisfaction and students’ socio-

184
emotional outcomes suggests that increasing teachers’ job satisfaction may also promote
positive socio-emotional development in students.

185
References !!Ackerman, B. P., Kogos, J., Youngstrom, E. A., Schoff, K., & Izard, C. (1999). Family
instability and the problem behaviors of children from economically disadvantaged families. Developmental Psychology, 35,258–268.!
!Atkins, M.S., Hoagwood, K.E., Kutash, K., Seidman, E. (2010). Toward the Integration
of Education and Mental Health in Schools. Administration and Policy of Mental Health, 37, 40-47.!
!Baker, J.A., Grant, S., & Morlock, L. (2008). The Teacher-Student Relationship As a
Developmental Context for Children With Internalizing or Externalizing Behavior Problems. School Psychology Quarterly, 23(1), 3-15.!
!Beaver, K.M., Wright, J.P., Maume, M.O. (2008). The effect of school classroom
characteristics on low self-control: A multilevel analysis. Journal of Criminal Justice, 36, 174-181.!
!Bevans, K., Bradshaw, C., Miech, R., Leaf, P. (2007). Staff- and School-Level Predictors
of School Organizational Health: A Multilevel Analysis. Journal of School Health. 77, 294-302.!
!Bibou-Nakou, I., Stogiannidou, A., & Kiosseoglou, G. (1999). The relation between
teacher burnout and teachers’ attributions and practices regarding school behaviour problems. School Psychology International, 20, 209–217.!
!Birch, S. H., & Ladd, G. W. (1998). Children’s interpersonal behaviors and the teacher-
child relationship. Developmental Psychology. 34(5), 934–946.!!Blase, J.J., Derick, C. and Strathe, M. (1986). Leadership behavior of school principals in
relation to teacher stress, satisfaction, and performance. Journal of Humanistic Counseling, Education, and Development, 24, 159-71.!
!Bogler, R. & Nir, A.E. (2010). The importance of teachers’ perceived organizational
support to job satisfaction. Journal of Educational Administration, 50, 287-306.!!Borman, G. D., & Overman, L. T. (2004). Academic resilience in mathematics among
poor and minority students. The Elementary School Journal, 104, 177–195.!!Bossert, S., Dwyer, D., Rowan, B. and Lee, G. (1982). The instructional management
role of the principal. Educational Administration Quarterly, 18, 34-64.!!Brand, S., Felner, R.D., Seitsinger, A., Burns, A., Bolton, N. (2008). A large scale study
of the assessment of the social environment of middle and secondary schools: The validity and!utility of teachers’ ratings of school climate, cultural pluralism, and

186
safety problems for understanding school effects and school improvement. Journal of School Psychology, 46: 507-535.!
!Bronfenbrenner, U. (1979). The ecology of human development : Experiments by nature
and design. Cambridge, Mass.: Harvard University Press.!!Capel, S. A. (1992). Stress and burnout in teachers. European Journal of Teacher
Education, 15, 197–211.!!Cheney, D., Osher, T., & Caesar, M. (2002). Providing ongoing skill development and
support for educators and parents of students with emotional and behavioral disabilities. Journal of Child and Family Service, 11:79–89.!
!Claessens, A., Duncan, G., Engel, M. (2009). Kindergarten skills and fifth grade
achievement: Evidence from the ECLS-K. Economics of Education Review, 28, 415-427.!
!Crosnoe, R. & Cooper, C.E. (2010). Economically Disadvantaged Children’s Transitions
into Elementary School: Linking Family Processes, School Contexts, and Educational Policy. American Education Research Journal, 47,2, 258-291.!
!Demaray, M. K., Ruffalo, S. L., Carlson, J., Busse, R. T., Olson, A. E., McManus, S. M.,
& Leventhal, A. (1995). Social skills assessment: A comparative evaluation of six published!rating scales. School Psychology Review, 24(4), 648-671.!
!Denny, S.J., Robinson, E.M., Utter, J., Fleming, T.M., Grant, S., Milfont, T.L., Crengle,
S., Ameratunga, S.N., Clark, T. (2011). Do Schools Influence Student Risk-taking Behaviors!and Emotional Health Symptoms? Journal of Adolescent Health, 48: 259-267.!
!Dinham, S., & Scott, C. (1998). A three domain model of teacher and school executive
career satisfaction. Journal of Educational Administration, 36, 362-378.!!Diperna JC, Elliott SN. (2002). Promoting academic enablers to improve student
achievement: an introduction to the mini-series. School Psychology Review, 31, 293–297.!
!Duncan, G. J., Dowsett, C. J., Claessens, A., Magnuson, K., Huston, A. C., Klebanov, P.,
Japel, C. (2007). School readiness and later achievement. Developmental Psychology, 43, 1428–1446.!
!Forehand, G. A., Gilmer, B. V. H. (1964), “Environmental variation in studies of
organizational behaviour”, Psychological Bulletin, Vol. 62, No. 6, pp. 361-382.!!

187
Goddard, Y.L., Goddard, R.D., Tschannen-Moran, M. A. (2007). Theoretical and Empirical Investigation of Teacher Collaboration for School Improvement and Student Achievement in Public Elementary Schools. Teachers College Record, 109 (4), 877-896.!
!Gresham, F., and Elliot, S. (1990). Social Skills Rating System. Circle Pines, MN:
American Guidance Services, Inc.!!Griffith, J. (2004). Relation of principal transformational leadership to school staff job
satisfaction, staff turnover and school performance. Journal of Educational Administration, 42, 333-356.!
!Gutman, L. M., Sameroff, A. J., & Cole, R. (2003). Academic growth curve trajectories
from 1st grade to 12th grade: Effects of multiple social risks and preschool child factors. Developmental Psychology, 39, 777-790.!
!Hallinger, P., Bickman, L. and Davis, K. (1996). School context, principal leadership,
and student reading achievement. The Elementary School Journal, 96, 527-49.!!Hamre, B.K. & Pianta, R.C. (2004). Self-reported depression in nonfamilial caregivers
and associations with caregiver behavior in child-care settings. Early Childhood Research Quarterly, 19, 297-318.!
!Henricsson, L. & Rydell, A.M. (2006). Children with behavior problems: the influence of
social competence and social relations on problem stability, school achievement and peer acceptance across the first six years of schools. Infant and Child Development, 15(4), 347-366.!
!Hoy, W.K., Tarter, C.J., Kottkamp, R.B. (1991). Open Schools/Healthy Schools:
Measuring Organizational Climate. Beverly Hills, CA: Sage Publications.!!Humke, C., & Shaefer, C. (1995). Relocation: A review of the effects of residential
mobility on children and adolescents. Psychology, A Journal of Human Behavior, 32, 16–24.!
!Jennings, J.L. & DiPrete, T.A. (2010). Teacher Effects on Social and Behavioral Skills in
Early Elementary School. Sociology of Education, 83(2), 135-159.!!Johnson, S.M., Kraft, M.A., Papay, J.P. (2012). How Context Matters in High-Need
Schools: The Effects of Teachers’ Working Conditions on Their Professional Satisfaction and Their Students’ Achievement. Teachers College Record, 114, 1-39.!
!
188
Judge, T. A., Bono, J. E., Thoresen, C. J., & Patton, G. K. (2001). The job satisfaction–job performance relationship: A qualitative and quantitative review. Psychological Bulletin, 127, 376–407.!
!Kessler, R., Berglund, P., Demler, O., Jin, R., & Walters, E. E. (2005). Lifetime
prevalence and age-of-onset distributions of DSM-IV disorders in the national comorbidity survey replication. Archive of General Psychiatry, 62, 593-602.!
!Kokkinos, C.M., Panayiotou, G., Dvazoglou, A.M. (2005). Correlates of Teacher
Appraisals of Student Behaviors. Psychology in the Schools, 42(1), 79-89.!!Leithwood, K., & McAdie, P. (2007). Teaching working conditions that matter.
Education Canada, 47(2), 42–45.!!LeBlanc, L., Swisher, R., Vitaro, F., Tremblay, R.E. (2008). High School Social Climate
and Antisocial Behavior: A 10 Year Longitudinal and Multilevel Study. Journal of Research on Adolescence, 18(3), 395-419.!
!Li-Grining, C. P., Votruba-Drzal, E., Bachman, H. J., & Chase-Lansdale, P. L. (2006).
Are certain preschoolers at risk in the era of welfare reform? The moderating role of children’s temperament. Children and Youth Services Review, 28, 1102–1123.!
!Liu, X.S., Ramsey, J. (2008). Teachers’ job satisfaction: Analyses of the Teacher Follow-
up Survey in the United States for 2000–2001. Teaching and Teacher Education, 24, 1173-1184.!
!Locke, E.A. (1976), “The nature and causes of job satisfaction”, in Dunnette, M.D. (Ed.),
Handbook of Industrial and Organizational Psychology, Rand McNally, Chicago, IL, pp. 1297-343.!
!Maldonado-Carreno, C. and Votruba-Drzal, E. (2011). Teacher-Child Relationships and
the Development of Academic and Behavioral Skills During Elementary School: A Within-and Between-Child Analysis. Child Development, 82(2): 601-616.!
!Marsh, H. (1990). Self-Description Questionnaire Manual. Campbelltown, N.S.W,
Australia: University of Western Sydney, Macarthur.!!Masten, A.S. (2003). Commentary: Developmental Psychopathology as a Unifying
Context for Mental Health and Education Models, Research, and Practice in Schools. School Psychology Review, 32(2), 169-173.!
!McClelland, M. M., Morrison, F. J., & Holmes, D. L. (2000). Children at risk for early
academic problems: The role of learning-related skills. Early Childhood Research Quarterly, 15, 307–329.!
!

189
Moffitt, T. E. (2006) Life-course-persistent versus adolescent-limited antisocial behavior. In D. Cicchetti & D. Cohen (Eds.), Developmental psychopathology (2nd ed., Vol. 1, pp. 570-598). Hoboken, NJ: John Wiley & Sons.!
!Needham B, Crosnoe R, Muller C. (2004) Academic failure in secondary school: the
interrelated role of health problems and educational context. Social Problems, 51:569–586,!
!Ostroff, C. (1992). The Relationship Between Satisfaction, Attitudes, and Performance:
an Organizational Level Analysis. Journal of Applied Psychology, 77(5), 963-974.!
!Pas, E.T., Bradshaw, C.P., Hershfeldt, P.A. (2012). Teacher- and school-level predictors
of teacher efficacy and burnout: Identifying potential areas for support. Journal of School Psychology, 50, 129-145.!
!Perie, M., & Baker, D. P. (1997). Job satisfaction among America’s teachers: Effects of
workplace conditions, background characteristics, and teacher compensation (NCES 97-471). Washington, DC: U.S. Government Printing Office.!
!Pianta, R. C., & Nimetz, S. L. (1991). Relationships between children and teachers:
Associations with classroom and home behavior. Journal of Applied Developmental Psychology.!
!Pianta RC, Belsky J, Houts R, Morrison F. (2007). The NICHD Early Child Care
Research Network. Opportunities to learn in America’s elementary classrooms. Science, 315(5820), 1795–1796.!
!Pigott, R. L., & Cowen, E. L. (2000). Teacher race, child race, racial congruence, and
teacher ratings of children’s school adjustment. Journal of School Psychology, 38, 177-196.!
!Preacher, K.J., Zyphur, M.J., Zhang, Z. (2010). A General Multilevel SEM Framework
for Assessing Multi-level Mediation. Psychological Methods, 15, 209-233.!!Preacher, K.J., Zyphur, M.J., Zhang, Z. (2011). A General Multilevel SEM Framework
for Assessing Multi-level Mediation. Structural Equation Modeling, 18, 161-182.!!Reichers, A. E., & Schneider, B. (1990). Climate and culture: An evolution of constructs.
In B. Schneider (Ed.), Organizational climate and culture (pp. 5-39). San Francisco:!Jossey-Bass.!
!Roeser, R.W., Eccles, J.S., Sameroff, A.J. School as a Context of Early Adolescents’
Academic and Socio-Emotional Development: A Summary of Research Findings. The Elementary School Journal, 5, 443-471.!

190
!Shen, J., Leslie, J.M., Spybrook, J.K., Ma, X. (2012). Are Principal Background and
School Process Related to Teacher Job Satisfaction? A Multilevel Study Using Schools and Staff Survey 2003-04. American Educational Research Journal, 49(20), 200-230.!
!Skaalvik, E.M. & Skaalvik, S. (2011). Teacher job satisfaction and motivation to leave
the teaching profession: Relations with school context, feeling of belonging, and emotional exhaustion. Teaching and Teacher Education, 27, 1029-1038.!
!Taylor, D.L. & Tashakkori, (1995). A. Decision participation and school climate as
Predictors of job satisfaction and teachers sense of efficacy. Journal of Experimental Education,!63(3), 217–230.!
!Taylor, P. B., Gunter, P. L., & Slate, J. R. (2001). Teachers’ perceptions of inappropriate
student behavior as a function of teachers’ and students’ gender and ethnic background.!Behavioral Disorders, 26, 146-15!
!Thornton, H. J. (2004). What can we learn about retaining teachers from PDS teachers’
voices? Middle School Journal,35(4), 5–12.!!Tobin, T.J., Muller, R.O. & Turner, L.M. (2006). Organizational learning and climate as
predictors of self-efficacy. Social Psychology of Education, 9, 301-319.!!Tourangeau, K., Nord, C., Lê, T., Sorongon, A. G., and Najarian, M. (2009). Early
Childhood Longitudinal Study, Kindergarten Class of 1998–99 (ECLS-K), Combined User’s Manual for the ECLS-K Eighth-Grade and K–8 Full Sample Data Files and Electronic Codebooks (NCES 2009–004). National Center for Education Statistics, Institute of Education Sciences, U.S. Department of Education. Washington, DC.!
!Wriqi, C. (2008). The structure of secondary school teacher job satisfaction and its
relationship with attrition and work enthusiasm. Chinese Education and Society, 40(5), 17-31.!
!Zembylas, M., & Papanastasiou, E. (2004). Job satisfaction among school teachers in
Cyprus. Journal of Educational Administration, 42, 357-374.!
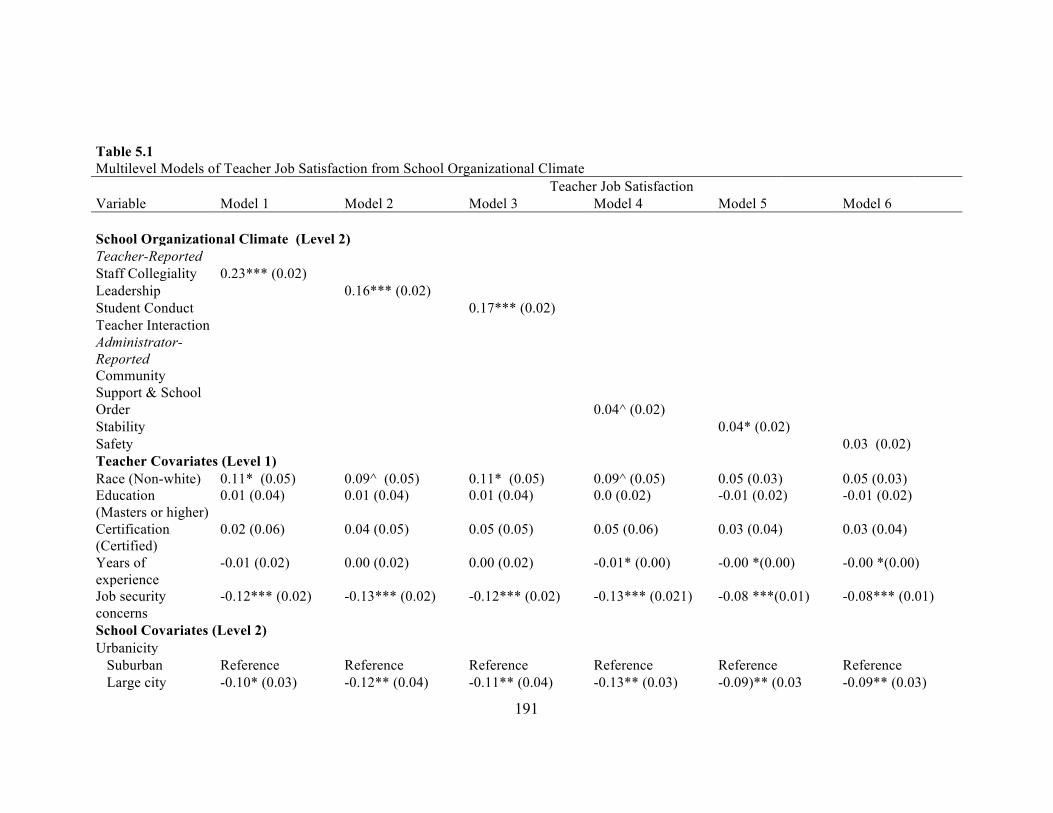
191
Table 5.1 Multilevel Models of Teacher Job Satisfaction from School Organizational Climate
Teacher Job Satisfaction Variable Model 1 Model 2 Model 3 Model 4 Model 5 Model 6
School Organizational Climate (Level 2) Teacher-Reported
Staff Collegiality 0.23*** (0.02) Leadership
0.16*** (0.02)
Student Conduct
0.17*** (0.02) Teacher Interaction
Administrator-Reported
Community Support & School Order
0.04^ (0.02)
Stability
0.04* (0.02) Safety
0.03 (0.02)
Teacher Covariates (Level 1) Race (Non-white) 0.11* (0.05) 0.09^ (0.05) 0.11* (0.05) 0.09^ (0.05) 0.05 (0.03) 0.05 (0.03)
Education (Masters or higher)
0.01 (0.04) 0.01 (0.04) 0.01 (0.04) 0.0 (0.02) -0.01 (0.02) -0.01 (0.02)
Certification (Certified)
0.02 (0.06) 0.04 (0.05) 0.05 (0.05) 0.05 (0.06) 0.03 (0.04) 0.03 (0.04)
Years of experience
-0.01 (0.02) 0.00 (0.02) 0.00 (0.02) -0.01* (0.00) -0.00 *(0.00) -0.00 *(0.00)
Job security concerns
-0.12*** (0.02) -0.13*** (0.02) -0.12*** (0.02) -0.13*** (0.021) -0.08 ***(0.01) -0.08*** (0.01)
School Covariates (Level 2) Urbanicity
Suburban Reference Reference Reference Reference Reference Reference Large city -0.10* (0.03) -0.12** (0.04) -0.11** (0.04) -0.13** (0.03) -0.09)** (0.03 -0.09** (0.03)

192
Rural -0.06 (0.05) -0.06 (0.05) -0.08 (0.05) -0.08 (0.05) -0.05 (0.04) -0.06 (0.04) Enrollment
Less than 150 Reference Reference Reference Reference Reference Reference 150-299 0.11 (0.11) 0.08 (0.12) 0.09 (0.12) 0.07 (0.12) 0.06 (0.08) 0.06 (0.08) 300-499 0.21^ (0.11) 0.22^ (0.11) 0.24* (0.11) 0.19^ (0.11) 0.14 (0.07)^ 0.14 (0.07)^ 500-749 0.17 (0.11) 0.16 (0.11) 0.20^ (0.11)) 0.14 (0.11) 0.12 (0.07) 0.12 (0.07) 750 and above 0.19^ (0.11) 0.18 (0.12) 0.16 (0.12) -0.04 (0.07) 0.12 (0.08) 0.11 (0.08) Percent Minority
Less than 10% Reference Reference Reference Reference Reference Reference 10-24% -0.04 (0.06) -0.03 (0.06) -0.00 (0.06) -'0.01 (0.06) -0.00(0.04) -0.00(0.04) 25-49% -0.08 (0.06) -0.07 (0.06) -0.02 (0.06) -0.02 (0.06) -0.01(0.04) -0.01(0.04) 50-74% -0.11 (0.07) -0.10 (0.07) -0.07 (0.07) -0.03 (0.05) -0.05 (0.05) -0.04 (0.05) 75% or more -0.03 (0.06) -0.07 (0.07) 0.02 (0.07) 0.02 (0.04) -0.02 (0.04) -0.03 (0.04) School-level achievement 0.00 (0.02) 0.00 (0.02) -0.00 (0.02) 0.00 (0.01) 0.01 (0.01) 0.01 (0.01) Sector (private) 0.10 (0.06) 0.13* (0.02) 0.11^ (0.07) 0.06 (0.04) 0.08 (0.04) 0.08 (0.04)^ Title 1 -0.04 (0.04) -0.04 (0.04) -0.01 (0.04) 0.00 (0.03) -0.03 (0.01) -0.04 (0.01) ^ p ≤ 0.10 *p ≤0.05 **p ≤0.01 *** p ≤0.001 +Reference categories are white for race, less than Masters for education, not certified for certification, public school for sector, not Title I school
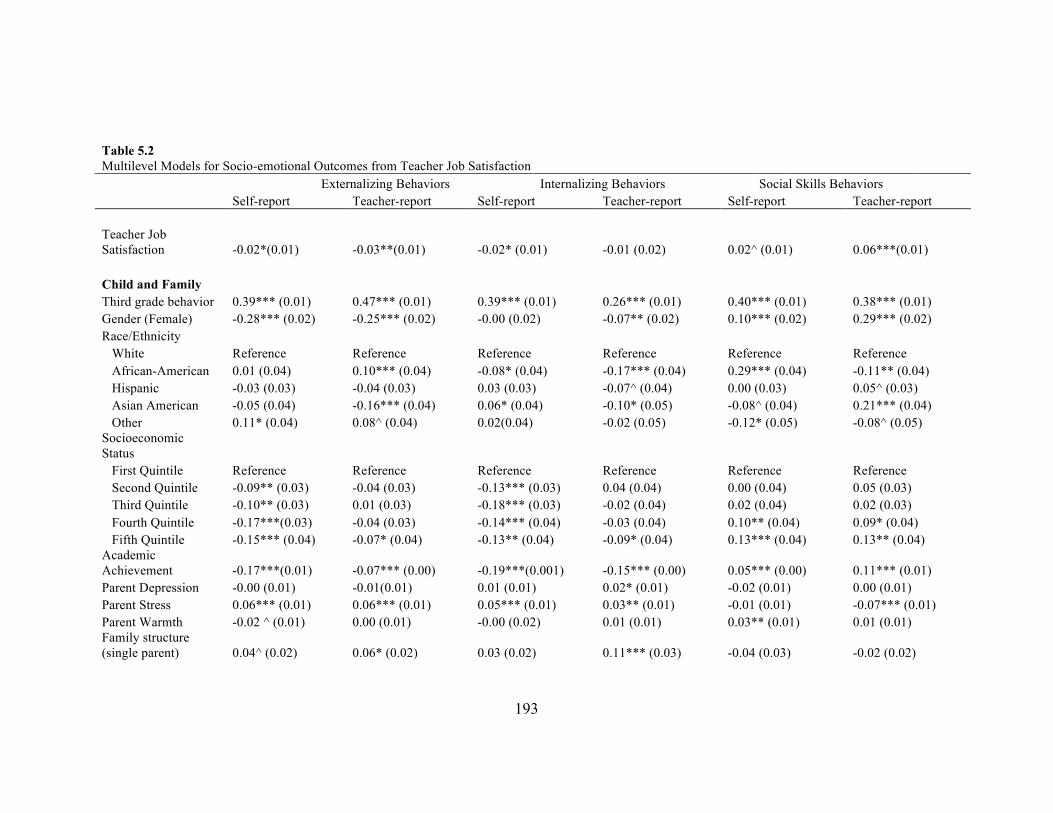
193
Table 5.2 Multilevel Models for Socio-emotional Outcomes from Teacher Job Satisfaction
Externalizing Behaviors Internalizing Behaviors Social Skills Behaviors Self-report Teacher-report Self-report Teacher-report Self-report Teacher-report
Teacher Job Satisfaction -0.02*(0.01) -0.03**(0.01) -0.02* (0.01) -0.01 (0.02) 0.02^ (0.01) 0.06***(0.01)
Child and Family Third grade behavior 0.39*** (0.01) 0.47*** (0.01) 0.39*** (0.01) 0.26*** (0.01) 0.40*** (0.01) 0.38*** (0.01)
Gender (Female) -0.28*** (0.02) -0.25*** (0.02) -0.00 (0.02) -0.07** (0.02) 0.10*** (0.02) 0.29*** (0.02) Race/Ethnicity
White Reference Reference Reference Reference Reference Reference African-American 0.01 (0.04) 0.10*** (0.04) -0.08* (0.04) -0.17*** (0.04) 0.29*** (0.04) -0.11** (0.04) Hispanic -0.03 (0.03) -0.04 (0.03) 0.03 (0.03) -0.07^ (0.04) 0.00 (0.03) 0.05^ (0.03) Asian American -0.05 (0.04) -0.16*** (0.04) 0.06* (0.04) -0.10* (0.05) -0.08^ (0.04) 0.21*** (0.04) Other 0.11* (0.04) 0.08^ (0.04) 0.02(0.04) -0.02 (0.05) -0.12* (0.05) -0.08^ (0.05) Socioeconomic Status
First Quintile Reference Reference Reference Reference Reference Reference Second Quintile -0.09** (0.03) -0.04 (0.03) -0.13*** (0.03) 0.04 (0.04) 0.00 (0.04) 0.05 (0.03) Third Quintile -0.10** (0.03) 0.01 (0.03) -0.18*** (0.03) -0.02 (0.04) 0.02 (0.04) 0.02 (0.03) Fourth Quintile -0.17***(0.03) -0.04 (0.03) -0.14*** (0.04) -0.03 (0.04) 0.10** (0.04) 0.09* (0.04) Fifth Quintile -0.15*** (0.04) -0.07* (0.04) -0.13** (0.04) -0.09* (0.04) 0.13*** (0.04) 0.13** (0.04) Academic Achievement -0.17***(0.01) -0.07*** (0.00) -0.19***(0.001) -0.15*** (0.00) 0.05*** (0.00) 0.11*** (0.01) Parent Depression -0.00 (0.01) -0.01(0.01) 0.01 (0.01) 0.02* (0.01) -0.02 (0.01) 0.00 (0.01) Parent Stress 0.06*** (0.01) 0.06*** (0.01) 0.05*** (0.01) 0.03** (0.01) -0.01 (0.01) -0.07*** (0.01) Parent Warmth -0.02 ^ (0.01) 0.00 (0.01) -0.00 (0.02) 0.01 (0.01) 0.03** (0.01) 0.01 (0.01) Family structure (single parent) 0.04^ (0.02) 0.06* (0.02) 0.03 (0.02) 0.11*** (0.03) -0.04 (0.03) -0.02 (0.02)
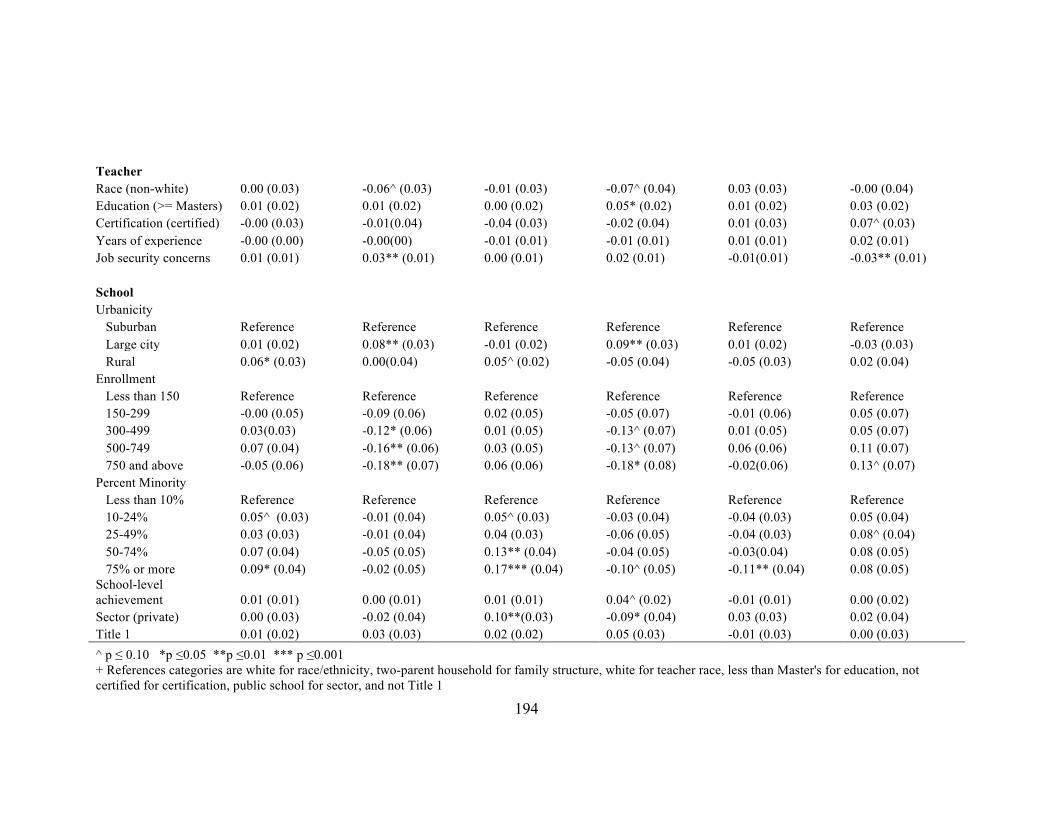
194
!Teacher
Race (non-white) 0.00 (0.03) -0.06^ (0.03) -0.01 (0.03) -0.07^ (0.04) 0.03 (0.03) -0.00 (0.04) Education (>= Masters) 0.01 (0.02) 0.01 (0.02) 0.00 (0.02) 0.05* (0.02) 0.01 (0.02) 0.03 (0.02) Certification (certified) -0.00 (0.03) -0.01(0.04) -0.04 (0.03) -0.02 (0.04) 0.01 (0.03) 0.07^ (0.03) Years of experience -0.00 (0.00) -0.00(00) -0.01 (0.01) -0.01 (0.01) 0.01 (0.01) 0.02 (0.01) Job security concerns 0.01 (0.01) 0.03** (0.01) 0.00 (0.01) 0.02 (0.01) -0.01(0.01) -0.03** (0.01)
School Urbanicity Suburban Reference Reference Reference Reference Reference Reference
Large city 0.01 (0.02) 0.08** (0.03) -0.01 (0.02) 0.09** (0.03) 0.01 (0.02) -0.03 (0.03) Rural 0.06* (0.03) 0.00(0.04) 0.05^ (0.02) -0.05 (0.04) -0.05 (0.03) 0.02 (0.04) Enrollment
Less than 150 Reference Reference Reference Reference Reference Reference 150-299 -0.00 (0.05) -0.09 (0.06) 0.02 (0.05) -0.05 (0.07) -0.01 (0.06) 0.05 (0.07) 300-499 0.03(0.03) -0.12* (0.06) 0.01 (0.05) -0.13^ (0.07) 0.01 (0.05) 0.05 (0.07) 500-749 0.07 (0.04) -0.16** (0.06) 0.03 (0.05) -0.13^ (0.07) 0.06 (0.06) 0.11 (0.07) 750 and above -0.05 (0.06) -0.18** (0.07) 0.06 (0.06) -0.18* (0.08) -0.02(0.06) 0.13^ (0.07) Percent Minority
Less than 10% Reference Reference Reference Reference Reference Reference 10-24% 0.05^ (0.03) -0.01 (0.04) 0.05^ (0.03) -0.03 (0.04) -0.04 (0.03) 0.05 (0.04) 25-49% 0.03 (0.03) -0.01 (0.04) 0.04 (0.03) -0.06 (0.05) -0.04 (0.03) 0.08^ (0.04) 50-74% 0.07 (0.04) -0.05 (0.05) 0.13** (0.04) -0.04 (0.05) -0.03(0.04) 0.08 (0.05) 75% or more 0.09* (0.04) -0.02 (0.05) 0.17*** (0.04) -0.10^ (0.05) -0.11** (0.04) 0.08 (0.05) School-level achievement 0.01 (0.01) 0.00 (0.01) 0.01 (0.01) 0.04^ (0.02) -0.01 (0.01) 0.00 (0.02) Sector (private) 0.00 (0.03) -0.02 (0.04) 0.10**(0.03) -0.09* (0.04) 0.03 (0.03) 0.02 (0.04) Title 1 0.01 (0.02) 0.03 (0.03) 0.02 (0.02) 0.05 (0.03) -0.01 (0.03) 0.00 (0.03) ^ p ≤ 0.10 *p ≤0.05 **p ≤0.01 *** p ≤0.001
+ References categories are white for race/ethnicity, two-parent household for family structure, white for teacher race, less than Master's for education, not certified for certification, public school for sector, and not Title 1

195
Table 5.3 Multilevel Models of Socio-emotional Outcomes from School Organizational Climate Dimensions, with and without teacher job satisfaction Externalizing Behaviors Internalizing Behaviors Social Skills Self-reported Teacher-reported Self-reported Teacher-reported Self-reported Teacher-reported Teacher-Reported Organizational Climate Staff Collegiality NS NS NS NS NS NS Leadership NS NS NS NS NS NS Student Conduct -0.05***
(0.01) -0.05** (0.01)
-0.09*** (0.02)
-0.09*** (0.02)
NS NS -0.03^ (0.02)
-0.03^ (0.02)
NS NS 0.04* (0.02)
0.03 (0.02)
Teacher Job Satisfaction
-0.02* (0.01)
-0.02* (0.01)
-0.02^ (0.01)
NS 0.02^ (0.02)
0.06*** (0.01)
Administrator-Reported Organizational Climate Community Support & School Order
-0.03* (0.01)
-0.03* (0.01)
NS NS NS NS NS NS 0.02^ (0.01)
0.02^ (0.02)
NS NS
Teacher Job Satisfaction
-0.02* (0.01)
-0.03** (0.01)
-0.02^ (0.01)
NS 0.03^ (0.02)
0.06*** (0.01)
Stability NS NS -0.03* (0.01)
-0.03* (0.01)
NS NS NS NS NS NS NS NS
Teacher Job Satisfaction
-0.02* (0.01)
-0.03** (0.01)
-0.02^ (0.01)
NS 0.02^ (0.01)
0.06*** (0.01)
*All models controlled for child/family, teacher and school variables included in models in previous steps ^ p ≤ 0.10 *p ≤0.05 **p ≤0.01 *** p ≤0.001

196
Chapter Six
Conclusion

197
Children’s socio-emotional outcomes are linked to later well-being and success,
and there is growing acknowledgement of the role of schools in promoting these types of
non-cognitive outcomes. This study used data from a national sample to examine the
relationship between staff perceptions of school organizational climate and students’
socio-emotional outcomes in late elementary school. School organizational climate scales
were identified using items from the teacher and administrator surveys in the Early
Childhood Longitudinal Study- Kindergarten Class (ECLS-K) and supported the
conceptualization of school organizational climate as a school-level measure. Of the
scales examined, Student Conduct was most strongly and significantly associated with
children’s outcomes, with the strongest associations for children from the poorest
families. Dimensions of school organizational climate, particularly Leadership, Staff
Collegiality, and Student Conduct were also significantly associated with teacher job
satisfaction, which may in turn affect students’ socio-emotional development. Findings
highlight the importance of interventions that aim to improve school-wide student
conduct, as well as surveys that ask staff to report their perceptions of the school
environment. This chapter summarizes the findings of the study, outlines implications
for practice and research, and describes limitations and strengths.
Summary of Results
Chapter Three described how exploratory structural equation modeling (ESEM)
was used to identify, and confirmatory factor analysis to confirm, school organizational
climate scales consisting of items in the administrator and teacher surveys of the third and
198
fifth grade waves of the ECLS-K. The five-factor model for the administrator survey
included the following factors: General Facilities, Extracurricular Facilities, Safety,
Stability, and Community Support and School Order. All scales except General Facilities
had acceptable internal reliability. The teacher survey had a four-factor model consisting
of: Teacher Interaction, Staff Collegiality, Student Conduct and Leadership. Overall, the
scales identified in this study reflect several key constructs also captured in the OHI-E
and School-Level Environment Questionnaire (SLEQ), two of the most accepted and
frequently used staff climate surveys. These constructs include school resources, teacher
collegiality, student behavior, school leadership, and relationships with parents and the
surrounding community. ICCs for the teacher scales ranged from 0.17 to 0.36, indicating
a moderate proportion of variance in scale scores was due to between-school variance
and warranting school-level aggregation of teacher scores.
Chapter Four examined the relationship between staff perceptions of the school
organizational climate and students’ socio-emotional outcomes in fifth grade, controlling
for third grade outcomes as well as a range of child, family, and school characteristics. A
secondary aim was to determine if this relationship was moderated by student-level risk,
as defined by low SES or high levels of externalizing behaviors in third grade. Only a
few of the nine school organizational climate variables examined in this study were
significantly associated with students’ socio-emotional outcomes. The strongest
relationship was between teacher-perceived Student Conduct and externalizing behaviors
(both self-reported and teacher-reported). As expected, this relationship was negative,
such that students had lower levels of externalizing behaviors in schools in which
teachers perceived better overall student conduct. Student Conduct was positively

199
associated with teacher-reported social skills, indicating greater social skills in schools
with better student conduct. Administrator-perceived Community Support and School
Order was also significantly associated with self-reported externalizing behaviors and
social skills. These findings highlight the importance of school-wide student conduct for
individual students’ socio-emotional development and are consistent with previous
research linking a school’s discipline climate with students’ non-academic outcomes.
(Ma, 2000; Ma & Klinger, 2000; Ma & Willms, 2004). Although there was not strong
evidence from this study that the relationship between school organizational climate and
students’ socio-emotional outcomes varied significantly based on third grade behavior,
some associations were stronger for students from poorer families.
The purpose of the study described in Chapter Five was to determine if teacher
job satisfaction is a pathway by which school organizational climate affects students’
socio-emotional outcomes. There was evidence of a strong relationship between school
organizational climate—particularly Leadership, Staff Collegiality and Student
Conduct—and teacher job satisfaction. Job satisfaction had a small, but significant,
relationship with several socio-emotional outcomes. Students with more satisfied teachers
demonstrated lower levels of externalizing behaviors and self-reported internalizing
behaviors, as well as higher levels of social skills, after controlling for third grade
behaviors and other important child, family, teacher and school factors. Job satisfaction
was found to mediate only one relationship: the link between Student Conduct and
teacher-reported social skills.
200
Implications for Policy and Practice
This study makes several valuable contributions to the scientific study of schools
and children’s mental health, and has practical policy implications. There is growing
recognition that schools play an important role in fostering children’s socio-emotional
development. This is evident in the increase in programs such as the federal Safe
Schools/Healthy Schools (SS/HS) Initiative that calls on schools to prevent violence and
negative behaviors, and promote positive development in students using a range of
strategies such as bullying prevention activities, after-school learning opportunities,
identification of at-risk children and provision of services (Furlong et al., 2003).
However, schools have limited resources and competing demands. These time and
resource constraints make it important to prioritize efforts and identify approaches that
have multiple benefits (Durlak et al., 2011).
Along with an increase in school interventions to address socio-emotional
development, many school districts and states administer staff surveys to assess the
school environment. As part of the SS/HS Initiative, school districts are required to
administer surveys to staff, such as the California School Climate Survey. These surveys
include questions similar to the questionnaire items that were examined in this study.
Results of this study highlight the importance and value of these surveys by
demonstrating a link between teachers’ perceptions of the school environment and
students’ outcomes. This study provides evidence from a large national study of a small
but statistically significant relationship between teachers’ perceptions of school-wide
student conduct and individual students’ externalizing behavior and social skills in late
201
elementary school. Results also indicate the influence of school-wide student conduct is
strongest for children from families with low socio-economic status.
Like past research, this study also found that approximately 10% of the variance
in students’ outcomes was at the school level. While this proportion of variance may
seem relatively small, schools are often targeted for interventions because they are seen
as more amenable and accessible than families, another influential and central
environment for children’s development. There is evidence that universal school
interventions, such as School Wide Positive Behavioral Interventions and Supports
(SWPBIS), can have significant effects on students’ problem behaviors and social skills.
A recent randomized controlled trial in 37 elementary schools found that children in
SWPBIS schools had significantly lower levels of disruptive behaviors and significantly
higher levels of prosocial behaviors and emotion regulation compared to control schools
(Bradshaw et al., 2012). The current study highlights the importance of interventions like
SWPBIS.
While this study found some significant direct associations between school
organizational climate and students’ socio-emotional outcomes, most dimensions of
school organizational climate were not directly associated with the outcomes examined.
However, most of the school organizational climate dimensions, especially those reported
by teachers, were not only significantly associated with teacher satisfaction, they
accounted for a relatively large proportion of the school-level variance in teachers’ job
satisfaction. While school-wide Student Conduct is most directly related to students’
socio-emotional outcomes, other aspects of school organizational climate such as Staff
Collegiality and Leadership are important predictors of teachers’ job satisfaction, which

202
may in turn affect students’ outcomes. Previous research has demonstrated the
importance of teacher job satisfaction for retention and to some extent, academic
outcomes. This study has also shown that teacher job satisfaction matters for children’s
socio-emotional development.
Implications for Research
While a large body of research has examined student-perceived school climate,
there is a need to better understand school climate as perceived by staff (Mitchell et al.,
2010). Results from this study provide scales that can be used in future studies using
ECLS-K data to examine school organizational climate constructs. Given previous
research linking aspects of the school organizational climate to students’ outcomes, future
research could explore the relationship between scale scores and other school
characteristics, such as the variation in scale scores by school Title 1 status, urbanicity
and minority enrollment. The identification of these scales also provides an important
starting point for better understanding the role of the school environment in children’s
development, particularly because of the wealth of data in the ECLS-K, including
longitudinal data about students’ academic and socio-emotional outcomes.
This study examined dimensions of school organizational climate both in separate
regression models and simultaneously in the same model. This approach provides
information both about the unique effect of each dimension and the effect given other
dimensions. It does not, however, provide information about how these dimensions affect
each other. For example, the relationship between Leadership and students’ outcomes
may be mediated by Student Conduct. One possible pathway linking school factors and
203
student outcomes was examined in this study, but more research is needed to understand
the mechanisms through which school-level characteristics result in student outcomes.
While many studies look at school-level factors and students’ outcomes or teachers’
qualities and students’ outcomes, there is a need to link these relationships and better
understand how these multiple levels interact with each other.
One method that may be helpful for better understanding the complexities of
school organizational climate is structural equation modeling, which facilitates a more
explicit examination of both indirect and direct effects, as well as relationships between
independent variables. Another useful method may be latent class analysis, which would
involve characterizing schools based on multiple dimensions of school organizational
climate. For example, while schools that have high levels of leadership are also likely to
have high levels of staff collegiality and other dimensions of climate, it would be
interesting to better understand common school organizational climate profiles.
Limitations and Strengths
Limitations
It is important to acknowledge that despite the robust design and significance of this
study, there are several limitations.
There are several limitations related to the measurement of school organizational
climate. The dimensions of the school organizational climate examined in this study were
limited by the data collected in the ECLS-K. It would have been preferable to use
organizational climate items and factors from an existing instrument, such as the
Organizational Health Inventory (OHI), to maintain consistency with other research, but

204
that was not possible. However, the factors identified in Aim 1 reflected many of the
same constructs. Another consequence of the limited items is that there may be
dimensions of the school organizational climate associated with children’s socio-
emotional development that were not assessed in the ECLS-K. Another limitation was
that measurement of the school organizational climate was based on only a few reporters
per school (several teachers and the administrator). Although the findings from Aim 1, as
well as previous research, support the concept of school organizational climate as a
school-level characteristic experienced by all staff members, individual characteristics of
staff can influence their perceptions (Bevans et al., 2007). Finally, based on previous
research that indicates stability in school organizational climate over several years, the
school organizational climate measures from teachers and administrators in third and fifth
grade were combined. A benefit of this approach is that it provides data about the school
organizational climate from more reporters. A potential problem is that there may have
been changes in the school between the third and fifth grade ECLS-K administrations,
such as a new principal, that have important implications for school organizational
climate. This would contribute to measurement error and may have led to an
underestimation of the relationship between organizational climate and students’
outcomes.
The measurement of children’s socio-emotional outcomes also has limitations, since
they were based on teacher and child report. All reporters can be considered to be biased
in that their reports reflect their own perspective and exposure to the child (Pigott &
Cowen, 2000; Taylor, Gunter, & Slate, 2001). For example, teachers’ ratings only reflect
students’ behaviors in one context; the school setting. Observational techniques for
205
children’s socio-emotional outcomes and family factors would have been optimal (Pianta
et al., 2007).
Another concern is that teacher report was used for both predictor measures (school
organizational climate) and outcome measures (teachers SRS ratings), so observed
associations may have been an artifact of rater effects. Importantly, this issue was
mitigated because the school organizational climate was based on data aggregated across
the teachers and administrators and children’s socio-emotional outcomes were also be
examined using child report.
The inclusion and exclusion criteria for the study sample may affect the
generalizability of the findings. Because the sample was limited to children who stayed in
the same school from third grade until fifth grade, children who moved during this time
are excluded. This means the findings are generalizable only to students who remain in
the same school for three years. Children who were excluded because of their mobility
may be at higher risk for psychopathology, since previous research has found that
multiple household moves contribute to social, emotional and behavioral problems in
children (Ackerman et al., 1999; Humke & Shaefer, 1995).
Although many important covariates were included in the models, it is impossible to
be sure that all potentially confounding factors have been included in the analyses.
Additionally, while teacher job satisfaction was examined as a possible mediator and
teacher characteristics were included as covariates, other characteristics of class
composition and characteristics were not included.

206
Strengths
Despite the limitations described above, the study also has important strengths.
First, because the ECLS-K is a national sample, it has good external generalizability and
findings can be applied to children in elementary schools across the nation. The large
sample size is also a strength.
In addition to the sample, a strength of the study is the breadth of the variables
included in the models, which acknowledges the socio-ecological nature of socio-
emotional development and the importance of risk factors from multiple contexts.
Although the focus of the study was on school effects, accurately identifying the
contribution of schools requires also acknowledging the influence of other contexts.
Including third grade behavior was also important given the predictive value of earlier
behaviors.
The analytical methods are also a strength. Factor analysis facilitated the creation
of school organizational climate dimensions that are more meaningful and reliable than
individual items. Multi-level modeling helped to account for clustering of students within
schools and non-independence of the subjects. It also allowed for partitioning of variance,
which provided important information about how much of the variation in child outcomes
is due to individual/family characteristics and how much is related to differences between
schools.
Although there are limitations in the measurement of children’s socio-emotional
outcomes, the inclusion of both teacher and child report of these outcomes is a strength.
This multi-method approach has been suggested by other researchers (Luckner & Pianta,

207
2011). Both positive and negative outcomes are included, which is valuable since both
are central to children’s psychological development.
Finally, this study attempted to elucidate not only the effects of schools, but also
the ways in which these effects are related to influential factors in other contexts. In the
second aim, interactions between school variables and individual-level risk were
examined. The third aim involved relationships between school, teacher and student
characteristics. These types of analyses reflect the complex determinants of children’s
socio-emotional development and provide a more nuanced view of school-level effects.
Conclusion
While this study confirmed that school organizational climate does play a role in
students’ socio-emotional development, it also highlighted some of the complexities of
the relationship. Of the socio-emotional outcomes examined in this study, externalizing
behaviors were the most influenced by school organizational climate. Social skills were
somewhat affected, and there was little effect of school organizational climate on
internalizing behaviors. Better school-wide Student Conduct as perceived by teachers was
associated with lower levels of externalizing behaviors and more social skills, supporting
the use of school-level efforts to improve student conduct and reduce bullying. As
hypothesized, the relationship between school organizational climate and socio-emotional
outcomes was stronger for children from poorer families. Many dimensions of school
organizational climate examined in this study had no direct effect on students’ socio-
emotional outcomes, and the direct effects that were observed were small. The finding
that Staff Collegiality and Leadership were strongly associated with teacher job

208
satisfaction and teacher job satisfaction was associated with several of the socio-
emotional outcomes suggests that school organizational climate may influence students’
outcomes indirectly through teacher attitudes and behaviors.

209
References !!Ackerman, B. P., Kogos, J., Youngstrom, E. A., Schoff, K., & Izard, C. (1999). Family
instability and the problem behaviors of children from economically disadvantaged families. Developmental Psychology, 35,258–268.!
!Bevans, K., Bradshaw, C., Miech, R., Leaf, P. (2007). Staff- and School-Level Predictors
of School Organizational Health: A Multilevel Analysis. Journal of School Health. 77, 294-302.!
!Bradshaw, C.P., Waasdorp, T.E., Leaf, P.J. (2012). Effects of School-Wide Positive
Behavioral Interventions and Supports on Child Behavior Problems. Pediatrics, 130, e1136-e1145.!
!Durlak, J.A., Weisberg, R.P., Dymnicki, A.B., Taylor, R.D. & Schellinger, K.B. (2011).
The Impact of Enhancing Students’ Social and Emotional Learning: a Meta-Analysis of School-Based Universal Interventions. Child Development, 82, 1, 405-432.!
!Furlong, M., Paige, L.Z., Osher, D. (2003). The Safe Schools/Health Students (SS/HS)
Initiative: Lessons Learned from Implementing Comprehensive Youth Development Programs. Psychology in the Schools, 40(5): 447-456.!
!Humke, C., & Shaefer, C. (1995). Relocation: A review of the effects of residential
mobility on children and adolescents. Psychology, A Journal of Human Behavior, 32, 16–24.!
!Luckner, A.E. and Pianta, R.C. (2011).Teacher-student interactions in fifth grade
classrooms: Relations with children’s peer behavior. Journal of Applied Developmental Psychology. 32: 257-266.!
!Mitchell, M.M., Bradshaw, C.P. & Leaf, P.J. (2010). Student and Teacher Perceptions of
School Climate: A Multilevel Exploration of Patterns of Discrepancy. Journal of School Health, 80, 271-279.!
!Pianta RC, Belsky J, Houts R, Morrison F. (2007). The NICHD Early Child Care
Research Network. Opportunities to learn in America’s elementary classrooms. Science, 315(5820), 1795–1796.!
!Pigott, R. L., & Cowen, E. L. (2000). Teacher race, child race, racial congruence, and
teacher ratings of children’s school adjustment. Journal of School Psychology, 38, 177-196.!
!

210
Taylor, P. B., Gunter, P. L., & Slate, J. R. (2001). Teachers’ perceptions of inappropriate student behavior as a function of teachers’ and students’ gender and ethnic background. Behavioral Disorders, 26, 146-15.
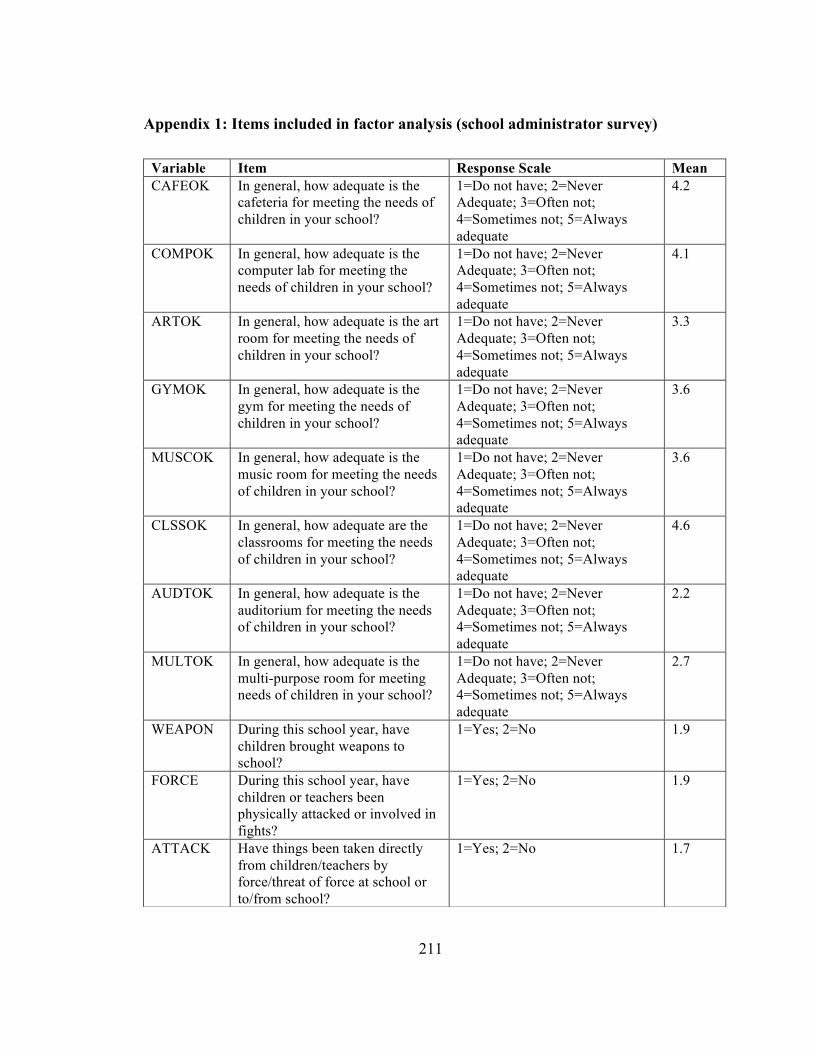
211
!Appendix 1: Items included in factor analysis (school administrator survey)
Variable Item Response Scale Mean CAFEOK In general, how adequate is the
cafeteria for meeting the needs of children in your school?
1=Do not have; 2=Never Adequate; 3=Often not; 4=Sometimes not; 5=Always adequate
4.2
COMPOK In general, how adequate is the computer lab for meeting the needs of children in your school?
1=Do not have; 2=Never Adequate; 3=Often not; 4=Sometimes not; 5=Always adequate
4.1
ARTOK In general, how adequate is the art room for meeting the needs of children in your school?
1=Do not have; 2=Never Adequate; 3=Often not; 4=Sometimes not; 5=Always adequate
3.3
GYMOK In general, how adequate is the gym for meeting the needs of children in your school?
1=Do not have; 2=Never Adequate; 3=Often not; 4=Sometimes not; 5=Always adequate
3.6
MUSCOK In general, how adequate is the music room for meeting the needs of children in your school?
1=Do not have; 2=Never Adequate; 3=Often not; 4=Sometimes not; 5=Always adequate
3.6
CLSSOK In general, how adequate are the classrooms for meeting the needs of children in your school?
1=Do not have; 2=Never Adequate; 3=Often not; 4=Sometimes not; 5=Always adequate
4.6
AUDTOK In general, how adequate is the auditorium for meeting the needs of children in your school?
1=Do not have; 2=Never Adequate; 3=Often not; 4=Sometimes not; 5=Always adequate
2.2
MULTOK In general, how adequate is the multi-purpose room for meeting needs of children in your school?
1=Do not have; 2=Never Adequate; 3=Often not; 4=Sometimes not; 5=Always adequate
2.7
WEAPON During this school year, have children brought weapons to school?
1=Yes; 2=No 1.9
FORCE During this school year, have children or teachers been physically attacked or involved in fights?
1=Yes; 2=No
1.9
ATTACK Have things been taken directly from children/teachers by force/threat of force at school or to/from school?
1=Yes; 2=No 1.7

212
!
!
!
!
!
!
!
!
!
!
INVOLV Parents are actively involved in this school's programs.
1=Strongly disagree; 2=Disagree; 3=Neither agree/disagree; 4=Agree; 5=Strongly agree
4.0
ABSENT Teacher absenteeism is a problem at this school.
1=Strongly disagree; 2=Disagree; 3=Neither agree/disagree; 4=Agree; 5=Strongly agree
1.8
TRNOVR Teacher turnover is a problem at this school.
1=Strongly disagree; 2=Disagree; 3=Neither agree/disagree; 4=Agree; 5=Strongly agree
1.7
CHLDOU Child absenteeism is a problem at this school.
1=Strongly disagree; 2=Disagree; 3=Neither agree/disagree; 4=Agree; 5=Strongly agree
2.3
SPPRT The community served by this school is supportive of its goals and activities.
1=Strongly disagree; 2=Disagree; 3=Neither agree/disagree; 4=Agree; 5=Strongly agree
4.2
CNSNSS There is consensus among administrators and teachers on goals and expectations
1=Strongly disagree; 2=Disagree; 3=Neither agree/disagree; 4=Agree; 5=Strongly agree
4.3
ORDR Order and discipline are maintained satisfactorily in the building(s)
1=Strongly disagree; 2=Disagree; 3=Neither agree/disagree; 4=Agree; 5=Strongly agree
4.4
OVRCRD Overcrowding is a problem at this school
1=Strongly disagree; 2=Disagree; 3=Neither agree/disagree; 4=Agree; 5=Strongly agree
2.4
WLCOME Parents of children in this school are welcome to observe classes any time they are in session.
1=Strongly disagree; 2=Disagree; 3=Neither agree/disagree; 4=Agree; 5=Strongly agree
4.1

213
!
Appendix 2: Items included in factor analysis (teacher survey)
Variable Item Response Scale Mean LESPL How often have you met with
other teachers to discuss lesson planning?
1=Never; 2=1/month; 3=2-3 times/month, 4=1-2/week, 5=3-4 times/week; 6=daily
3.6
CURRD How often have you met with other teachers to discuss curriculum development?
1=Never; 2=1/month; 3=2-3 times/month, 4=1-2/week, 5=3-4 times/week; 6=daily
2.9
INDCH How often have you met with other teachers or specialists to discuss individual children?
1=Never; 2=1/month; 3=2-3 times/month, 4=1-2/week, 5=3-4 times/week; 6=daily
3.4
DISCH How often met with special ed. teacher/service providers to discuss/plan for children with disabilities?
1=Never; 2=1/month; 3=2-3 times/month, 4=1-2/week, 5=3-4 times/week; 6=daily
2.9
SCHSP Staff members in this school generally have school spirit
1=Strongly disagree; 2=Disagree; 3=Neither agree/disagree; 4=Agree; 5=Strongly agree
4.0
MISBH Level of child misbehavior in this school interferes with my teaching
1=Strongly disagree; 2=Disagree; 3=Neither agree/disagree; 4=Agree; 5=Strongly agree
2.4
NOTCA Many of the children I teach are not capable of learning the material I am supposed to teach them
1=Strongly disagree; 2=Disagree; 3=Neither agree/disagree; 4=Agree; 5=Strongly agree
2.1
ACCPT I feel accepted and respected as a colleague by most staff members
1=Strongly disagree; 2=Disagree; 3=Neither agree/disagree; 4=Agree; 5=Strongly agree
4.4
CNTNL Teachers in this school are continually learning and seeking new ideas
1=Strongly disagree; 2=Disagree; 3=Neither agree/disagree; 4=Agree; 5=Strongly agree
4.2
PAPRW Routine administrative duties and paperwork interfere with my job of teaching
1=Strongly disagree; 2=Disagree; 3=Neither agree/disagree; 4=Agree; 5=Strongly agree
3.3
PSUPP Parents are supportive of school staff
1=Strongly disagree; 2=Disagree; 3=Neither agree/disagree; 4=Agree; 5=Strongly agree
3.7

214
Variable Item Response Scale Mean SCHPL At your school, how much
influence do you think teachers have over school policy in areas such as determining discipline policy, deciding how some school funds will be spent, and assigning children to classes?
1=No Influence; 2=Slight influence; 3=Some influence; 4=Moderate influence; 5=Great deal
3.2
CNTRL How much control do you feel you have IN YOUR CLASSROOM over such areas as selecting skills to be taught, deciding about teaching techniques, and disciplining children?
1=No Control; 2=Slight control; 3=Some control; 4=Moderate control; 5=Great deal
4.2
STNDL The academic standards at this school are too low
1=Strongly disagree; 2=Disagree; 3=Neither agree/disagree; 4=Agree; 5=Strongly agree
1.9
MISSI There is broad agreement among the entire school faculty about the central mission of the school
1=Strongly disagree; 2=Disagree; 3=Neither agree/disagree; 4=Agree; 5=Strongly agree
3.9
ALLKN School administrator knows what kind of school he/she wants and has communicated it to the staff
1=Strongly disagree; 2=Disagree; 3=Neither agree/disagree; 4=Agree; 5=Strongly agree
4.1
PRESS School administrator deals effectively with pressures from outside school that might affect teaching.
1=Strongly disagree; 2=Disagree; 3=Neither agree/disagree; 4=Agree; 5=Strongly agree
3.9
PRIOR The school administrator sets priorities, makes plans, and sees that they are carried out.
1=Strongly disagree; 2=Disagree; 3=Neither agree/disagree; 4=Agree; 5=Strongly agree
3.9
ENCOU The school administrator’s behavior toward the staff is supportive and encouraging
1=Strongly disagree; 2=Disagree; 3=Neither agree/disagree; 4=Agree; 5=Strongly agree
4.0
PHSCN Physical conflicts among children are a serious problem in this school.
1=Strongly disagree; 2=Disagree; 3=Neither agree/disagree; 4=Agree; 5=Strongly agree
2.2
BULLY Children bullying other children is a serious problem in this school.
1=Strongly disagree; 2=Disagree; 3=Neither agree/disagree; 4=Agree; 5=Strongly agree
2.4
215
McHale Newport-Berra 642 S. California Avenue Palo Alto, CA 94306
(541) 740-1662 [email protected]
Date of Birth: April 24, 1979 Place of Birth: Oregon, USA
EDUCATION
Johns Hopkins Bloomberg School of Public Health Baltimore, MD PhD, Population, Family and Reproductive Health October 2013 Dissertation: School Organizational Climate and Students’ Socio-emotional Outcomes University of Michigan School of Public Health Ann Arbor, MI MPH, Health Behavior and Health Education April 2006 San Jose State University San Jose, CA Multiple Subject Teaching Credential 2001-2003 Duke University Durham, NC BA English May 2001 Chemistry Minor School for International Training Kenya Semester in Kenya September-December 1999 Independently conducted research and wrote paper: Perspectives on Child Health Among the Pokot
HONORS AND AWARDS American Educational Research Association Dissertation Grant July 2012-July 2013 John and Alice Chenoweth Pate Fellowship Award April 2012 Department of Population, Family, and Reproductive Health Maternal and Child Health Epidemiology Fellowship October 2011-May 2012 Maternal and Child Health Bureau, US Dept. of Health & Human Services Johnson and Johnson Community Health Care Scholar August 2010-May 2013 Donald A. Cornely Scholar April 2011 Department of Population, Family, and Reproductive Health Child Mental Health Services & Service System Fellowship Sept. 2009-August 2011 National Institute of Mental Health (NIMH)
216
PROFESSIONAL EXPERIENCE
Applied Survey Research San Jose, CA Senior Research Analyst September 2013-Present Responsibilities include study and survey design, data analysis, and data presentation to help clients meet their needs and improve their programs. Focus on school readiness assessments, educational programs and health interventions. !Johns Hopkins Bloomberg School of Public Health Baltimore, MD Research Assistant April 2012-January 2013 Worked with team to evaluate CookShop, a nutrition education program in New York City public schools. Role included survey development, creation of survey tool for iPads, and data management. Maryland State Department of Health & Mental Hygiene Baltimore, MD Maternal and Child Health Epidemiology Fellow October 2011-May 2012 • Analyzed Maryland Pregnancy Risk Assessment Monitoring System (PRAMS) data to
examine the relationship between homelessness, pregnant mothers’ behaviors and birth outcomes
• Wrote policy brief on findings Johnson and Johnson Community Health Care Program Baltimore, MD/Detroit, MI Johnson and Johnson Community Health Care Scholar August 2010-May 2013 Provide devaluation technical assistance to a community-based organization implementing interventions to prevent childhood obesity !Johns Hopkins Bloomberg School of Public Health Baltimore, MD Research Assistant November 2009-March 2010 Worked with the Department of Pediatrics, School of Public Health, and East Baltimore community organizations to develop and write a proposal for early childhood services in East Baltimore !Children’s Hospital at Montefiore/Montefiore School Health Program Bronx, NY Evaluation of the Moving Smart Intervention in Increasing Physical Activity in Bronx Elementary School Students Research Consultant September 2007-December 2010 • Wrote academic standards-based scripts that integrate learning and exercise • Coordinated and supervised staff for collection of data • Explained and demonstrated intervention to teachers and administrators • Provided input regarding study design, intervention implementation and data collection
217
Montefiore School Health Program Bronx, NY Community Health Organizer September 2006- July 2009 • Facilitated school health committees at multiple schools and worked with other people
in the school community to identify health needs, and develop and implement health programs and policies
• Liaised between school-based clinic and school • Conducted evaluation for Community Health Division of the Montefiore School
Health Program, including logic model development, creation of quantitative and qualitative instruments, and data collection, analysis and presentation
America Reads Ann Arbor, MI Team Leader September 2004-April 2006 • Supervised undergraduate tutors and provided tutor training • Communicated with principals and teachers • Helped revise assessment for tutees University of Michigan Ann Arbor, MI Review of Judgment and Decision Making Literature Pertinent to the Development of Traffic Offender Training/Improvement Programmes Research Assistant September 2005- March 2006 • Reviewed articles and entered relevant information into FileMaker Pro database • Wrote sections of manuscript University of California-Berkeley, Center for Weight and Health Berkeley, CA Community-Based Intervention to Reduce the Risk of Type 2 Diabetes in Overweight African-American 9-10 Year Old Children MPH Intern May-August 2005 • Reviewed 3-day food and activity diaries • Assisted with development and implementation of intervention I Have A Dream Summer Program, Costaño Elementary School East Palo Alto, CA Reading Teacher May-August 2004 Designed and taught reading curriculum for third graders Alum Rock Union School District/ Teach for America San Jose, CA Elementary School Teacher Kindergarten Teacher, Arbuckle Elementary School September 2001 - June 2002 Third Grade Teacher, Arbuckle Elementary School September 2002 - June 2003 Substitute Teacher February-May 2004

218
TEACHING EXPERIENCE
Johns Hopkins Bloomberg School of Public Health Baltimore, MD Teaching Assistant August 2011-October 2011 Course: Life Course Perspectives on Health Johns Hopkins Bloomberg School of Public Health Baltimore, MD Teaching Assistant March 2011-May 2011 Course: Schools and Health !
PUBLICATIONS Strecher, V.J., Shope, J., Bauermeister, J.A., Chang, C., Newport-Berra, M., Candee, E., Boonin, A., Ewing, L., Giroux, A., & Guay, E. (2006). Review of Judgment and Decision Making Literature Pertinent to the Development of Traffic Offender Training/ Improvement Programs [Technical report]. London, UK: Department of Transport.
PRESENTATIONS
Newport-Berra M. (2013, October). School Organizational Climate and Students’ Socio-emotional Outcomes: Does the Relationship Vary by Student-Level Risk? Poster presentation at Annual Conference on Advancing School Mental Health. Arlington, VA. Newport-Berra M. (2013, April). Elementary School Organizational Climate and Students’ Socio-emotional Outcomes. Invited Poster Session for AERA Grantees at the Annual Meeting of the American Educational Research Association. San Francisco, CA. Newport-Berra, M. Hopkins, P., Nwankwo, R., Eiler, S., Law, D.J., Fonseca-Becker, F. (2012, December). Promoting Health Equity Through a Multi-Sector Collaboration to Prevent Childhood Obesity in an Under-Served Urban Community. Poster presentation at the 2012 Science of Eliminating Health Disparities Summit. National Harbor, MD. Newport-Berra, M. Blank, A. E. & Charlop, M. (2009, November). Role of Community Health Organizers in public schools: Lessons learned. Presentation at the Annual Meeting of the American Public Health Association. Philadelphia, PA.
SKILLS Statistical Software: STATA, Mplus, Epi Info Computer Software: Microsoft Office Package Languages Skills: Proficient in Spanish !