an experimental determination of gross calorific value of ... · the calorific value is the energy...
TRANSCRIPT
Natural Resources, 2016, 7, 57-68 Published Online January 2016 in SciRes. http://www.scirp.org/journal/nr http://dx.doi.org/10.4236/nr.2016.71006
How to cite this paper: Gravalos, I., Xyradakis, P., Kateris, D., Gialamas, T., Bartzialis, D. and Giannoulis, K. (2016) An Expe-rimental Determination of Gross Calorific Value of Different Agroforestry Species and Bio-Based Industry Residues. Natural Resources, 7, 57-68. http://dx.doi.org/10.4236/nr.2016.71006
An Experimental Determination of Gross Calorific Value of Different Agroforestry Species and Bio-Based Industry Residues Ioannis Gravalos1, Panagiotis Xyradakis1, Dimitrios Kateris1, Theodoros Gialamas1, Dimitrios Bartzialis2, Kyriakos Giannoulis2 1Department of Biosystems Engineering, School of Agricultural Technology, Technological Educational Institute of Thessaly, Larissa, Greece 2Laboratory of Agronomy and Applied Crop Physiology, Department of Agriculture, Crop Production & Rural Environment, University of Thessaly, Volos, Greece
Received 13 November 2015; accepted 19 January 2016; published 22 January 2016
Copyright © 2016 by authors and Scientific Research Publishing Inc. This work is licensed under the Creative Commons Attribution International License (CC BY). http://creativecommons.org/licenses/by/4.0/
Abstract
Solid biomass fuels are useful and cost effective renewable energy source. The energy content of biomass is determined by its calorific value. The objective of this study was to determine experi-mentally the gross calorific value (GCV) of different agroforestry species and bio-based industry residues that could be used by: a) companies specialized in processing raw biomass solid biofuel production, b) small-scale consumers (households, medium-sized residential buildings, etc.). The fuel samples used were from agricultural residues and wastes (rice husks, apricot kernels, olive pits, sunflower husks, cotton stems, etc.), energy crops and wetland herbs (cardoon, switchgrass, common reed, narrow-leaf cattail), and forest residues (populus, fagus, pinus). The GCV of the bio- mass samples was experimentally determined based on CEN/TS 14918:2005, and an oxygen bomb calorimeter was used (Model C5000 Adiabatic Calorimeter, IKA®-Werke, Staufen, Germany). The GCV of different agroforestry species and residues ranges from 14.3 - 25.4 MJ∙kg−1. The highest GCV was obtained by seeds and kernels due to higher unit mass and higher lipid content. Pinus sylvestris with moisture content 24.59% obtained the lowest GCV (13.973 MJ∙kg−1).
Keywords
Gross Calorific Value, Bomb Calorimeter, Biomass, Bioenergy, Agroforestry Residues

I. Gravalos et al.
58
1. Introduction Biomass is a biological material derived from living organisms (plants and animals). Often, it refers to plant based materials, which simply are called lignocellulosic biomass [1] [2]. Biomass includes not only wastes and residues from agro forestry and related bio-based industries but also plantation biomass (energy crops) [3]. Agricultural residues include stalks, leaves, roots, husks, nuts or seed shells. Energy crops are herbaceous plan-tations (sugarcane, switch grass, sorghum) and trees grown through traditional agricultural practices (eucalyptus, poplar, oil palm). Wood wastes and forestry residues include wood chips, bark, sawdust, timber slash, and mill scrap [4]. Examples of bio-based industry wastes that have potential for biomass production are pulp sludge, fruit pits, alcohol fermentation stillage, and other organic wastes [5].
Solid biomass fuels are useful and cost effective renewable energy source widely used in developing countries, where it accounts for about 35% of primary energy consumption [6]. Last years, in some developed countries, the interest in using biomass fuels for heating purposes is increasing [7]. Solid biomass fuels have advantages over fossil fuels due to environmental aspects. In addition, the production of biomass creates new jobs and en-hances energy security by dependence on imports. The disadvantage to using agricultural residues is crop sea-sonality that creates an unsteady and unreliable biomass supply [8]. On the other hand, biomass materials are stored in large quantities and increase transport requirements. Processing of biomass materials to pellets or bri-quettes makes transportation more efficient [9].
Biomass can be converted into energy (heat or electricity) or energy carriers (charcoal, oil, or gas) using both thermo chemical and biochemical conversion technologies [10] [11]. Combustion is the most developed and most frequently applied process used for solid biomass fuels because of its low costs and high reliability. During combustion, the biomass first loses its moisture content at temperatures up to 100˚C, using heat from other par-ticles that release their heat value. As the dried particle heats up, volatile gases containing hydrocarbons, CO, CH4 and other gaseous components are released [12]. In a combustion process, these gases contribute about 70% of the heating value of the biomass. Finally, char oxidizes and ash remains [13].
The calorific value is the energy released during combustion of unit mass of fuel. It forms the basis for deter-mining the performance of energy system. In determining of thermo chemical processes it is necessary to sepa-rate the higher heating value (HHV) or gross calorific value (GCV) from the lower heating value (LHV) or net calorific value (NCV) [14]. In the GCV including the latent heat of moisture, which is not applied to the NCV which has removed the latent heat evaporating the moisture content. GCV is a significant indicator of biomass quality that depends on: a) elemental composition, b) moisture content, and c) ash content [15]. The GCV can be determined experimentally in the laboratory with adiabatic calorimeter. Typically, the latent heat of water is not recovered and so it is more appropriate to use the NCV that is calculated from the GCV [16]. However, in scien-tific and practical use GCV. The GCV of different types of biomass is ranging from 14 - 23 MJ∙kg−1 (dry basis) [17]-[20]. The differences are mainly due to different carbon content (main energy source) and different ash content (not combustible material).
Moisture is considered a contaminant, for thermo chemical processes, which must be removed to the greatest possible rate, drying (physical or thermal) [21]. The moisture in the case of combustion of biomass reduces the final usable energy and thus the efficiency of the energy system, contributing at the same time, the increased emission pollutants. There is a practical limit autogenous combustion at about 67% moisture. Above that limit, the moisture biomass cannot be burned self-sustaining and any thermo chemical process is impossible [22] [23].
The ash considered as a byproduct, depending on the chemical composition [24], and quantity may create se-rious problems in combustion or gasification units, because at high melting temperatures and causes the glazing (slag), which destroys both the walls, and the grill. Also, the high percentage of ash creates the need for auto-matic removal of the combustion chamber, and installation systems retention of fly ash into the fuel. Biomass ash contains useful plant nutrients such as K, Mg, and P but it also contains heavy metals and therefore it is not possible for recycling to agricultural fields or forests [25].
The objective of this study was to determine experimentally the gross calorific value of different agro forestry species and bio-based industry residues that could be used by: a) companies specializing in processing raw biomass solid biofuel production, b) small-scale consumers (households, medium-sized residential buildings, etc.).
2. Materials and Methods 2.1. Biomass Samples Selection and Preparation The fuel samples used were from agricultural residues and wastes (rice husks, apricot kernels, olive pits, sun-

I. Gravalos et al.
59
flower husks, cotton stems, etc.), energy crops and wetland herbs (cardoon, switch grass, common reed, nar-row-leaf cattail), and forest residues (Populus, Fagus, Pinus). Cotton (Gossypium hirsutum L.) plant is primarily an agricultural crop, but it can also be found growing wild. There are more than 30 species of cotton plants, but only few are used to supply the world market for cotton. The plant has many branches with one main central stem. Overall, the plant is cone or pyramid-shaped. Vegetative branches grow from the bottom of the plant and produce very little cotton. Fruiting branches on the main stem of the plant produce most of the cotton. The leaves are heart-shaped, lobed, and coarse veined, somewhat resembling a maple leaf [26]. The Cardoon (Cyna-ra cardunculus L. var. altilis) is a plant with very good adaptability and high output, the final height of plant reaches the 2.6 m. The production of dry mass reaches 17 - 33 t∙ha−1. It is a naturally occurring variant of the same species as the globe artichoke, and has many cultivated varieties. It is native to the Mediterranean, where it was domesticated in ancient times. Cardoon has attracted recent attention as a possible source of biodiesel. The oil, extracted from the seeds of the cardoon, called artichoke oil, is similar to safflower and sunflower oil in composition and use [27]. The above mentioned industrial crops as cotton and cardoon were obtained from a farm near Larissa, Thessaly, Central Greece. They were collected in the form of whole plants with moisture content of 6.0% - 13% (wb).
Switch grass (Panicum virgatum L.) is a warm-season perennial grass (lifetime over 15 years) planted for many purpose such as livestock grazing and energy crop. Switch grass has thin procumbent stems and is 1.8 - 2.2 m tall. Its leaves also have a characteristic V-shaped patch of hair on their upper surfaces. Switch grass comprises an important energy crop, due to its high productivity and its high adaptability in almost all soil types [28]. Switch grass (cv. Alamo; lowland ecotype supplied from Colorado USA), was sown in two different soil- climatic environments e.g. in Palamas (West Thessaly or Karditsa plain) and in Velestino (East Thessaly or La-rissa plain), Central Greece, in the period 2009-2012. Palamas soil is a deep, sandy loam to loam (sand 37% - 45%, silt 51% - 43%, clay 12%), moderately fertile (0.9% organic matter content at 40 cm depth), characterized by a groundwater table fluctuating from some 2 m below the soil surface (receives artificial drainage) in May, to deeper layers later in the summer. On the other hand, Velestino soil is a clay loam to clay (sand 19% - 21%, silt 39% - 41%, clay 38% - 42%), fertile (organic matter content 1.4% - 1.8% at 40 cm depth). The experimental de-sign was a 2 × 4 split-plot with four replications (blocks) and eight plots per replication (8 × 4 = 32 plots). Irri-gation comprised the main factor (0 mm (rain fed), and 250 mm (irrigated)), and N-fertilization comprised the sub-factor (0, 80, 160, and 240 kg∙ha−1). Plot size was 48 m2 (6 m width × 8 m length).
Narrow-leaf cattail (Typha angustifolia) plants grow along lake margins and in marshes, often in dense colo-nies. Narrow-leaf cattail leaves are alternate and mostly basal to a simple, jointless stem that eventually bears the flowering spikes. The rhizomes spread horizontally beneath the surface of muddy ground to start new upright growth [29]. Common reed (Phragmites australis) is a large perennial grass found in wetlands throughout tem-perate and tropical regions of the world. It is sometimes regarded as the sole species of the genus Phragmites, though some botanists divide Phragmites australis into three or four species. The erect stems grow to 2 - 6 m tall, with the tallest plants growing in areas with hot summers and fertile growing conditions. The leaves are long for a grass, 20 - 50 cm and 2 - 3 cm broad. The flowers are produced in late summer in a dense, dark purple panicle, about 20 - 50 cm long. Later the numerous long, narrow, sharp pointed spikelets appear greyer due to the growth of long, silky hairs [30]. Wetland herbs as Phragmites australis and Typha angustifolia were taken from the area of Prespes Lakes, Florina, Macedonia, Greece. They were collected in the form of whole plant with moisture content of 5.0% - 12% (wb).
The other forest wood biomass residues (Populus, Fagus, Pinus), and agricultural residues and wastes (rice husks, apricot kernels, pistachios shells, etc.) were obtained from the local furniture and bio-based industries, during the collaboration of our laboratory with companies that wanted to use the above residues and wastes for the production of solid biofuels (pellets, briquettes, etc.) and industries with low thermal requirements.
Biomass in its raw form is difficult to grind. The cellulose and lignin are very fibrous and quite hard to break. A hammer mill was used for grinding of biomass (switch grass, cotton, cardoon and wetland herbs). The ham-mer mill unit is powered by a 1.5 kW electric motor. The materials were subjected to hammer mill with 6 ham-mers, a 3.0 mm screen size, and an operating speed of 3600 rpm for 20 min. After grinding, samples of grind were placed successively in a stack of sieves arranged from the largest to the smallest opening. The sieve series corresponded with ASAE sizes (19.0 mm, 12.5 mm, 6.3 mm, 4 mm, and 1.18 mm). The duration of sieving was 10 min and was previously determined through trials to be optimal. Sieve analysis was repeated three times for each sample. The geometric mean diameter of the sample and geometric standard deviation of particle diameter

I. Gravalos et al.
60
were calculated according to ASAE standard S319.3 [31]. Particle size distribution is an important parameter used for understanding the combustion behaviour of biomass fuels.
2.2. Determination of Calorific Value, Moisture and Ash Content An oxygen bomb calorimeter (Model C5000 Adiabatic Calorimeter, IKA®-Werke, Staufen, Germany) was used to determine the calorific value of the different agroforestry species and bio-based industry residues. The oxygen bomb calorimeter is the most prevalent technique of measuring calorific value both in laboratory and in indus-trial environments. The principle operation of the calorimeter is based on measuring the heat released from the complete combustion of a fuel in an oxygen environment. The bomb is immersed in a given amount of water. The bomb and the surrounding water, which are in direct thermal contact, forming the measuring system of the calorimeter. The bomb calorimeter and the metal vessel surrounding it form the kernel of the calorimetric sys-tem, which is placed in a thermally insulated jacket. A primary temperature transducer, placed inside the unit, records the change in the system temperature due to the combustion of the fuel in the bomb. The calorimeter al-so contains a cooling system. The bomb calorimeter enables a rapid analysis to be carried out, the basic time of which cannot be reduced, since it is related to the fuel combustion process itself [32].
The first law of thermodynamics in the case of oxygen bomb calorimeter (isochoric change with zero me-chanical work), is expressed as shown in equation [33]:
systU q∆ = (1)
Considering that the outer vessel is adiabatic, the combustion process will lead to increase the temperature of the water surrounding the bomb in ΔT. If it is known the energy equivalent (total heat capacity) of the calorime-ter C, the amount heat qsyst due to the combustion of the fuel and the ignition wire, is given by equation:
syst fs fs ct ctq C T m H m H C T= ⋅ ∆ ⇒ ⋅ + ⋅ = ⋅ ∆ (2)
where mfs is the mass of the fuel sample [g], mct is the mass of the cotton thread [g], Hfs is the calorific value of the fuel sample [J∙g−1], Hct is the calorific value of the cotton thread [J∙g−1].
The heat capacity of the calorimeter C can be determined by the calibration of the instrument by measuring the calorific value of benzoic acid (C6H5COOH). The combustion reaction of the benzoic acid at 25˚C is defined as:
( ) ( ) ( ) ( )6 5 2 2 2C H COOH s 7.5O g 7CO g 3H O I+ → + (3)
The heat capacity is calculated according to equation [32]:
ba ba ct ct
c
m H m HCT
⋅ + ⋅=
∆ (4)
where mba is the mass of the benzoic acid [g], mct is the mass of the cotton thread [g], Hba is the calorific value of the benzoic acid [J∙g−1], Hct is the calorific value of the cotton thread [J∙g−1], and ΔTc is the observed change in temperature during calibration experiment [˚C].
Having identified the C, the calorific value of the fuel sample can be calculated according to the equation:
fs ct ctfs
fs
C T m HH
m⋅ ∆ − ⋅
= (5)
where ΔΤfs is the observed change in temperature during combustion of the fuel sample [˚C]. The gross calorific value (GCV) of the biomass samples was experimentally determined based on CEN/TS
14918:2005 [34]. CEN/TS 14918:2005 describes the method for determining gross calorific value of solid bio-fuels. A sample of biomass powder is pressed to produce an unbreakable pellet (tablet) in order to limit the speed of combustion. Many samples of biomass once they have been ground into a powder are not easily pressed into pellets, because the fibers are not adhering to each other during the pelleting process. Another me-thod to ignite the sample is to place the powder inside a special capsule. The capsule ignites easily thus causing the sample to ignite. The calorific value of capsules must be previous determined. The test procedure includes the following steps:
• The instrument was calibrated and verified using a benzoic acid tablet.

I. Gravalos et al.
61
• The biomass sample of 0.5 - 1.0 g was weighed on a precision balance. • The powdered sample was inserted in the capsule and the capsule was pressed to compact the material. • The capsule was carefully placed into the holder. • The cotton thread was attached and the firing cotton was ensured that lies on top of the capsule. • The bomb was lowered in the calorimeter and the cover was then closed. • The start button was pressed to begin the test. The C5000 Adiabatic Calorimeter automatically makes all necessary calculations to produce the gross calo-
rific of combustion of the biomass sample. GCV obtained from all the agroforestry species and bio-based industry residues were subjected to basic de-
scriptive statistical analysis to determine the mean and standard deviation of the calorific values using the fol-lowing equations:
1
1Average of n
ii
x x xn =
= = ∑ (6)
( )
( )
2
1Std. deviation of the mean of 1
n
ii
n x xx
n n=
−=
−
∑ (7)
where xi are the calorific values and n is the number of measurements. Finally, analysis of variance (ANOVA) was used to determine if there was significant variation in the data obtained for GCV within individual species at p < 0.05.
Moisture content and bulk density after grinding are important properties for downstream processing. There is a small range of test methods including oven drying (air or nitrogen atmosphere), microwave drying and field tests [35]. In this study, biomass samples were measured by a direct method of weight loss in drying oven ac-cording to CEN/TS 14774-1:2009 [36]. CEN/TS 14774-1:2009 describes the reference method for total mois-ture in solid biofuels. The sample of biofuel (sample mass > 300 g) was oven dried for 24 h at 105˚C ± 2˚C in air atmosphere until constant mass is achieved and percentage moisture calculated from the loss in biomass of the sample. The moisture content measurements were repeated five times.
Ash content is another important test for determining biomass fuel properties. The ash content of the samples was determined based on CEN/TS 14775:2004 [37]. CEN/TS 14775:2004 describes the method for ash content of solid biofuels. A sample (sample mass > 1 g) is initially ashed at 250˚C until volatiles are burnt off slowly (to avoid losing entrained particles with fast burning) (250˚C - 550˚C in 60 min with defined temperature raise 5˚C·min−1) and then a heating regime is followed to finish with an ashing temperature of 550˚C ± 10˚C for at least 2 hours. The ash content measurements were repeated five times.
3. Results and Discussion The energy content of biomass is determined by its calorific value. The calorific value influenced by biomass elemental composition, moisture and ash content. Table 1 shows minimum, maximum, range, mean, and stan-dard deviation of GCV for all the samples of agricultural residues and wastes. Watermelon seeds and cotton seeds of agricultural wastes have the highest energy content 23.473 MJ∙kg−1 and 22.933 MJ∙kg−1 respectively, while rice husk and rice straw have the lowest calorific values. The energy value of seeds has been little studied. Sunflower seed shell and rice husks gave gross calorific values of 17.7 MJ∙kg−1 and 13.9 MJ∙kg−1 respectively according to Ref. [38]. Karaj and Müller [39] found that the gross calorific values of Jatropha curcas L. was 26.23 MJ∙kg−1 for seeds and 30.20 MJ∙kg−1 for kernels. In this study, apricot and peach kernels (p < 0.003 and p < 0.006, respectively) show a significant decline in calorific values when compared to the watermelon, grape or cotton seeds (p < 0.012, p < 0.112 and p < 0.011, respectively). In any case, seeds and kernels have higher gross calorific values because they have higher unit mass and higher lipid content which reflects optimal environmen-tal condition for the plants. The energy stored in this part is used to support growth and reproduction of plants in the following season.
Rice husk and rice straw with moisture content 8.30% and 12.19% respectively have lower calorific values than rice husk and rice straw without moisture (dried at 105˚C for 24 h). It shows that biomass with low mois-ture content has high calorific value. Rice husk and rice straw are used as fuel in boilers and for power genera-

I. Gravalos et al.
62
tion. These husk residues contain about 75% organic volatile matter and the balance 25% of the weight of these husk residues are converted into ash during the firing process that is known as rice husk ash (RHA) [40]. In this study was found that rice husk and rice straw have high ash content 17.20% and 14.00% respectively. It has been reported by Poddar et al. [41] that an obscure relation prevails between ash content and calorific value of biomass samples (the significance of ash content on calorific value is not yet realized). Further, silica is the ma-jor composition of RHA. With such a large ash content and silica in the ash it becomes economical to extract si-lica from the ash, which has wide market [42] [43].
In addition, Table 1 presents calorific energy (MJ∙kg−1) distribution in different organs of the cotton plant: root, main stem, terminal, vegetative branches, fruit branches, leaves, bur or locks. Significant differences in ca-lorific energy were observed between the various cotton plant organs. Biomass samples from root and main stem show higher calorific values (17.707 MJ∙kg−1 and 17.733 MJ∙kg−1 respectively). The calorific values of vegeta-tive branches of cotton plants were measured 17.376 MJ∙kg−1, for the fruiting branches were measured 17.368 MJ∙kg−1, whereas low amount of energy was observed in the cotton leaves (16.059 MJ∙kg−1) and terminal buds (16.396 MJ∙kg−1).
Table 2 shows minimum, maximum, range, mean, and standard deviation of GCV for all the samples of energy crops (cardoon and switchgrass) and wetland herbs (common reed and narrow-leaf cattail). If we com-
Table 1. Gross calorific values of agricultural residues and wastes.
Agricultural residue and waste species Minimum GCV (MJ∙kg−1)
Maximum GCV (MJ∙kg−1)
Range GCV (MJ∙kg−1)
Mean GCV (MJ∙kg−1)
Standard deviation
Rice husk with moisture content 8.30% 15.875 16.057 0.182 15.972 0.075
Rice husk without moisture (dried at 105˚C for 24 h) 16.546 16.748 0.202 16.643 0.078
Rice straw with moisture content 12.19% 15.012 15.130 0.118 15.092 0.049
Rice straw without moisture (dried at 105˚C for 24 h) 16.345 16.580 0.235 16.475 0.093
Pistachios shells 17.247 17.431 0.184 17.320 0.097
Leaves of Pistachio trees 15.477 16.618 1.141 16.120* 0.585
Dark red sweet cherry seeds 19.358 20.441 1.083 19.870* 0.544
Apricot kernels 18.508 18.642 0.134 18.562 0.071
Peach kernels 18.901 19.091 0.190 18.995 0.095
Watermelon fruit seeds 23.321 23.585 0.264 23.473 0.137
Grape seeds 20.038 20.839 0.801 20.388* 0.410
Olive pits 17.369 18.582 1.213 17.970* 0.537
Almont husks 18.007 18.318 0.311 18.176 0.112
Sunflower husks 18.444 18.831 0.387 18.674 0.173
Sunflower seed cake with moisture content 12.72% 21.160 21.277 0.117 21.231 0.042
Rapeseed cake with moisture content 11.17% 21.442 21.844 0.402 21.569 0.158
Cotton (Gossypium hirsutum L.) plant root 17.671 17.768 0.097 17.707 0.036
Cotton plant main stem 17.645 17.799 0.154 17.733 0.054
Cotton plant terminal bud 16.105 16.643 0.538 16.396 0.160
Cotton plant vegetative branches 17.070 17.598 0.528 17.376 0.143
Cotton plant fruiting branches 17.065 17.505 0.440 17.368 0.143
Cotton plant leaves 15.955 16.126 0.171 16.059 0.048
Cotton plant (25 weeks/harvest) bur 16.993 17.292 0.299 17.141 0.084
Cotton plant (25 weeks/harvest) locks 16.543 16.870 0.327 16.679 0.099
Cotton plant seeds 22.750 23.078 0.328 22.933 0.111 *denotes significance (p < 0.05).
I. Gravalos et al.
63
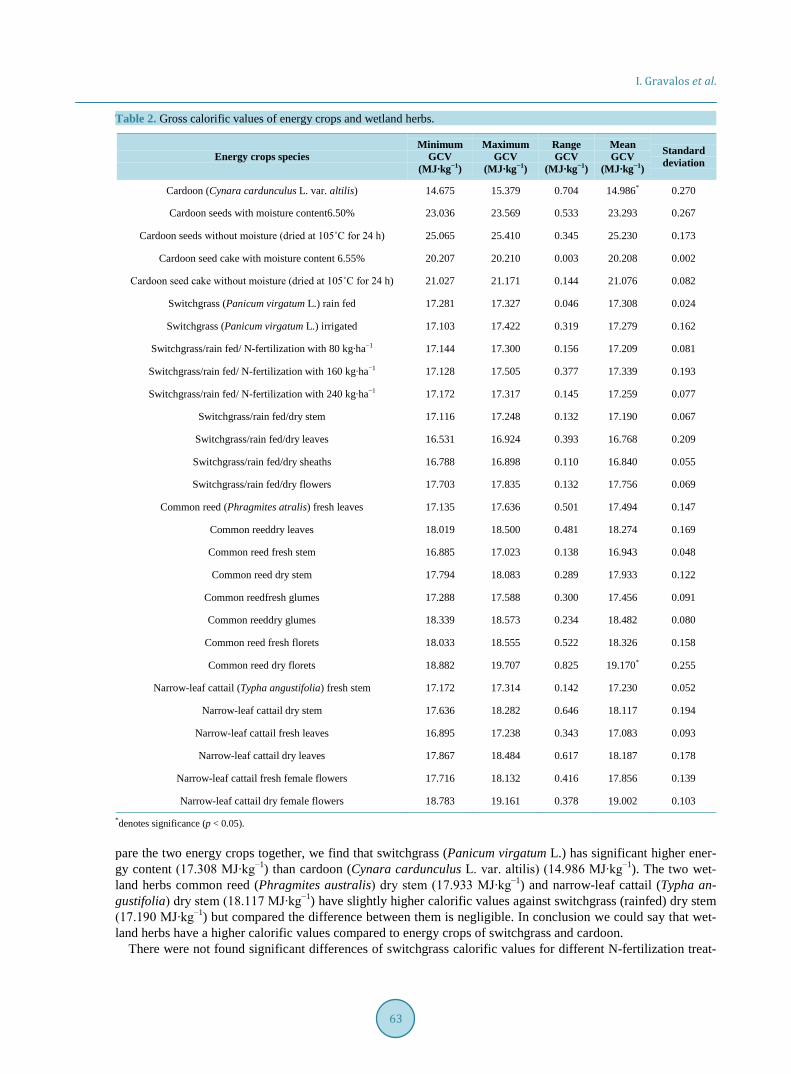
Table 2. Gross calorific values of energy crops and wetland herbs.
Energy crops species Minimum
GCV (MJ∙kg−1)
Maximum GCV
(MJ∙kg−1)
Range GCV
(MJ∙kg−1)
Mean GCV
(MJ∙kg−1)
Standard deviation
Cardoon (Cynara cardunculus L. var. altilis) 14.675 15.379 0.704 14.986* 0.270
Cardoon seeds with moisture content6.50% 23.036 23.569 0.533 23.293 0.267
Cardoon seeds without moisture (dried at 105˚C for 24 h) 25.065 25.410 0.345 25.230 0.173
Cardoon seed cake with moisture content 6.55% 20.207 20.210 0.003 20.208 0.002
Cardoon seed cake without moisture (dried at 105˚C for 24 h) 21.027 21.171 0.144 21.076 0.082
Switchgrass (Panicum virgatum L.) rain fed 17.281 17.327 0.046 17.308 0.024
Switchgrass (Panicum virgatum L.) irrigated 17.103 17.422 0.319 17.279 0.162
Switchgrass/rain fed/ N-fertilization with 80 kg∙ha−1 17.144 17.300 0.156 17.209 0.081
Switchgrass/rain fed/ N-fertilization with 160 kg∙ha−1 17.128 17.505 0.377 17.339 0.193
Switchgrass/rain fed/ N-fertilization with 240 kg∙ha−1 17.172 17.317 0.145 17.259 0.077
Switchgrass/rain fed/dry stem 17.116 17.248 0.132 17.190 0.067
Switchgrass/rain fed/dry leaves 16.531 16.924 0.393 16.768 0.209
Switchgrass/rain fed/dry sheaths 16.788 16.898 0.110 16.840 0.055
Switchgrass/rain fed/dry flowers 17.703 17.835 0.132 17.756 0.069
Common reed (Phragmites atralis) fresh leaves 17.135 17.636 0.501 17.494 0.147
Common reeddry leaves 18.019 18.500 0.481 18.274 0.169
Common reed fresh stem 16.885 17.023 0.138 16.943 0.048
Common reed dry stem 17.794 18.083 0.289 17.933 0.122
Common reedfresh glumes 17.288 17.588 0.300 17.456 0.091
Common reeddry glumes 18.339 18.573 0.234 18.482 0.080
Common reed fresh florets 18.033 18.555 0.522 18.326 0.158
Common reed dry florets 18.882 19.707 0.825 19.170* 0.255
Narrow-leaf cattail (Typha angustifolia) fresh stem 17.172 17.314 0.142 17.230 0.052
Narrow-leaf cattail dry stem 17.636 18.282 0.646 18.117 0.194
Narrow-leaf cattail fresh leaves 16.895 17.238 0.343 17.083 0.093
Narrow-leaf cattail dry leaves 17.867 18.484 0.617 18.187 0.178
Narrow-leaf cattail fresh female flowers 17.716 18.132 0.416 17.856 0.139
Narrow-leaf cattail dry female flowers 18.783 19.161 0.378 19.002 0.103
*denotes significance (p < 0.05).
pare the two energy crops together, we find that switchgrass (Panicum virgatum L.) has significant higher ener-gy content (17.308 MJ∙kg−1) than cardoon (Cynara cardunculus L. var. altilis) (14.986 MJ∙kg−1). The two wet-land herbs common reed (Phragmites australis) dry stem (17.933 MJ∙kg−1) and narrow-leaf cattail (Typha an-gustifolia) dry stem (18.117 MJ∙kg−1) have slightly higher calorific values against switchgrass (rainfed) dry stem (17.190 MJ∙kg−1) but compared the difference between them is negligible. In conclusion we could say that wet-land herbs have a higher calorific values compared to energy crops of switchgrass and cardoon.
There were not found significant differences of switchgrass calorific values for different N-fertilization treat-

I. Gravalos et al.
64
ments. The average calorific values were 17.209 MJ∙kg−1, 17.339 MJ∙kg−1 and 17.259 MJ∙kg−1 for N-fertilization treatments with 80 kg·ha−1, 160 kg∙ha−1, and 240 kg∙ha−1, respectively (Table 2). In literature has been reported that there was found an increase to the calorific value with the increase to the N-fertilization from 0 kg∙ha−1 to 80 kg∙ha−1. The calorific value that is reported in the same study is 18.49 MJ∙kg−1 and 18.92 MJ∙kg−1 for 0 kg∙ha−1 and 80 kg∙ha−1, respectively [44]. Moreover, it was found a non-significant difference between irrigation levels with the non-irrigated treatment having slightly higher calorific value, regardless the experimental site. Specifically, there was measured the calorific energy (MJ∙kg−1) distribution in different organs of the switch-grass (Table 2) and there was found that there was significant difference between the calorific values. Floral stems had the higher values due to the seed existence and their oil content (17.756 MJ∙kg−1). The calorific value of switchgrass (rainfed) dry stem was measured 17.190 MJ∙kg−1, whereas low amount of energy was observed in the switchgrass leaves (16.768 MJ∙kg−1).
There were not found significant differences at ash content of switchgrass for different treatments. It was ob-served a slightly non-significant difference in the ash content between the irrigation levels with the non-irrigated treatment having higher values. The average ash content at the rainfed switchgrass was 4.42% and 4.11%, while at irrigated switchgrass was 4.11% and 3.84% in Palamas and Velestino, respectively. This shows that the aver-age values of switchgrass ash content were changing with treatment and experimental site. More specifically, it was found that there was significant difference between the switchgrass organs ash. The organ with the lower ash content was the stem (about 2% - 4%), while leaves were the organs with the higher ash content (about 8% - 9%). In literature [45] [46], it is reported that switchgrass is an energy crop characterized as a high quality raw material of high volatile content, ranging from 70% - 85% and relatively low ash content, ranging from 1.8 to 10%, on a dry basis. These results are in agreement with the findings of this study.
The results of calorific energy analysis in common reed and narrow-leaf cattail could be helpful to determine the energy that obtained from wetland herbs. Table 2 presents calorific energy (MJ∙kg−1) distribution in different organs of the above mentioned wetland herbs: main stem, leaves, and flowers. There were significant differenc-es in calorific energy in the different herbs organs. For the main stem, calorific energy varied between 16.943 - 18.117 MJ∙kg−1. The narrow-leaf cattail main stems had a little higher calorific energy values than common reed stems. The differences between main stem and leaves were significant. Specifically, for narrow-leaf cattail, the main stems measured 17.636 - 18.282 MJ∙kg−1, while for the leaves calorific values varied between 17.867 - 18.484 MJ∙kg−1. Great interest is the higher amount of energy observed in the common reed dry leaves (18.274 MJ∙kg−1) against common reed dry stem (17.933 MJ∙kg−1). Narrow-leaf cattail and common reed flowers have higher energy values compared to other plant organs. This higher energy value of common reed dry glumes (18.339 - 18.573 MJ∙kg−1) and dry florets (18.882 - 19.707 MJ∙kg−1) might be due to higher lipid content.
Table 3 lists minimum, maximum, range, mean, and standard deviation of GCV for all the samples of bio-mass from different residues of forest species (Populus euro-america, Fagus sylvatica, Pinus sylvestris, Abies borisii-regis) obtained from the local furniture industry. From the results, it can be said that the dry forest bio-mass had higher heating values from agricultural crops and wetland herbs. The heating values of Pinus sylvestris and mixture of Pinus sylvestris with Abies borisii-regis were slightly higher than that of Populus euro-america and Fagus sylvatica. Pinus sylvestris without moisture (dried at 105˚C for 24 h) had the highest GCV of 20.082 MJ∙kg−1. From these heating values, it can be said that the differences between GCVs of dried forest biomass and GCVs of biomass with moisture (15.83% - 24.59%) are significant. This might be due to the high moisture content that absorbs forest grinds. Populus euro-america and Pinus sylvestris determined 24.17% and 24.59% moisture, respectively. Low ash content is also crucial to the combustion process, just as very strict ash deposi-tion limits in some countries have adopted. Forest residue biomass had significant lower values of ash deposition in comparison with the agricultural crops and wetland herbs (Table 4).
After grinding of energy crops and wetland herbs, the grinds from the hammer mill screen size of 3.2 mm were distributed in large range and produced particles with geometric mean particle diameter of 0.67 and 0.52 mm for wetland herbs and energy crops, respectively. According to Mani et al. [47] [48], wider particle size dis-tribution is suitable for compaction (pelleting or briquetting) process. During compaction, smaller particles rear-range and fill in the void space of larger particles producing denser and durable compacts. Compaction of bio-mass through pelletization process leads to the formation of biomass pellet a superior biofuel that has conveni-ence in handling and transportation and high energy content. All these pellets have the recommended diameter. Gross calorific values, of pellets from different agricultural and energy crops are given in Table 4. Cardoon pel-lets without moisture (dried at 105˚C for 24 h) produced higher gross calorific value (18.227 MJ∙kg−1) than car-

I. Gravalos et al.
65
Table 3. Gross calorific values of forest species.
Forest species Minimum
GCV (MJ∙kg−1)
Maximum GCV
(MJ∙kg−1)
Range GCV
(MJ∙kg−1)
Mean GCV
(MJ∙kg−1)
Standard deviation
Poplar (Populus euro-america) with moisture content 24.17% 14.323 14.613 0.290 14.432 0.116
Poplar(Populus euro-america) without moisture (dried at 105˚C for 24 h) 19.193 19.476 0.283 19.371 0.114
Beech (Fagus sylvatica) with moisture content 15.83% 16.120 16.268 0.148 16.202 0.054
Beech(Fagus sylvatica)without moisture (dried at 105˚C for 24 h) 19.070 19.317 0.247 19.225 0.095
Pine (Pinus sylvestris) with moisture content 24.59% 13.973 15.229 1.256 14.589 0.455
Pine (Pinus sylvestris) without moisture (dried at 105˚C for 24 h) 19.680 20.242 0.562 20.082 0.231
Fir (Abiesborisii-regis) + Pine (Pinus sylvestris) (50% + 50%) with moisture content 22.09 % 15.303 16.023 0.720 15.648* 0.257
Fir (Abiesborisii-regis) + Pine (Pinus sylvestris) (50% + 50%) without moisture (dried at 105˚C for 24 h) 19.902 20.300 0.398 20.042 0.173
*denotes significance (p < 0.05).
Table 4. Results analyses of pellets from agricultural crops, wetland herbs, and forest residues.
Biomass Pellet Diameter (mm)
Length (mm)
GCV (MJ∙kg−1)
Ash content (%)
Sunflower husk pellets 6.20 21.75 18.830 3.85
Medicago sativa pellets 6.20 21.75 16.019 4.42
Cardoon pellets with moisture content 10.20% 6.20 21.74 16.786 8.33
Cardoon pellets without moisture (dried at 105˚C for 24 h) 6.20 21.75 18.227 7.22
Cotton pellets 6.20 21.75 16.988 3.49
Common reed pellets 6.20 21.75 16.471 7.46
Narrow-leaf cattail pellets 6.20 21.75 16.584 6.78
Poplar (Populus euro-america) pellets 6.20 21.76 17.814 0.79
Beech (Fagus sylvatica) pellets 6.20 21.75 18.050 0.77
Pine (Pinus sylvestris) pellets 6.20 21.74 18.754 0.64
Fir (Abiesborisii-regis) + Pine (Pinus sylvestris) pellets (50% + 50%) 6.20 21.75 18.367 0.71
*denotes significance (p < 0.05).
doon pellets with moisture content 10.20% (16.786 MJ∙kg−1). The lowest calorific values gave the Medicago sa-tiva pellets (16.019 MJ∙kg−1). Moreover, it can be seen that all pellets from forest residues have a similar high calorific values and ash content. Pellets from agricultural crop and forage residues show lower calorific values and higher ash content.
4. Conclusions The main conclusions that may be drawn from the present study on the gross calorific value of different agrofo-restry species and bio-based industry residues for heating and other purposes are listed below: The gross calorific values of different agroforestry species and bio-based industry residues are ranging from
14.3 - 25.4 MJ∙kg−1. The energy content differences are mainly due to different carbon content (main energy source), moisture content, ash content (not combustible material) or the experimental site.

I. Gravalos et al.
66
Quantitative calorific energy analysis in crop plants and wetland herbs showed that significant differences exist in calorific energy distribution on different plant organs. Root and main stem had the same calorific energy values. The lowest mean calorific energy value in all plant organs was observed at leaves. Also, seeds, kernels and flowers had the highest energy values due to higher lipid content.
It was found that rice husk and rice straw had high ash content. Further, silica is the major composition of rice husk ash. With such a large ash content and silica in the ash it becomes economical to extract silica from the ash, which has wide market.
There were not found significant differences of switchgrass gross calorific values for different N-fertilization and irrigation levels treatments. Whereas, it was observed a slightly non-significant difference in the ash content between the irrigation levels with the non-irrigated treatment having higher values.
Biomass from forest residues (dried at 105˚C for 24 h) shown higher gross calorific values in comparison with biomass from agricultural crop and wetland herbs.
Pellets from forest residues had significant lower ash content than pellets from agricultural crop and wetland herbs.
References [1] Heinimö, J. (2008) Methodological Aspects on International Biofuels Trade: International Streams and Trade of Solid
and Liquid Biofuels in Finland. Biomass Bioenergy, 32, 702-716. http://dx.doi.org/10.1016/j.biombioe.2008.01.003 [2] Biomass Energy Center (2008) http://www.biomassenergycentre.org.uk [3] Asian Biomass Handbook (2008) http://www.jie.or.jp/biomass/AsiaBiomassHandbook [4] UNEP (2009) Converting Waste Agricultural Biomass into a Resource. United Nations Environmental Programme,
Division of Technology, Industry and Economics, International Environmental Technology Centre, Osaka/Shiga. [5] OECD (2011) Toward Green Growth. OECD. http://www.oecd.org/greengrowth [6] Farrell, A.E. and Gopal, A.R. (2008) Bioenergy Research Needs for Heat, Electricity and Liquid Fuels. MRS Bulletin,
33, 373-380. http://dx.doi.org/10.1557/mrs2008.76 [7] Ravindranath, N.H., Balachandra, P., Dasappa, S. and Usha Rao, K. (2006) Bioenergy Technologies for Carbon Ab-
atement. Biomass Bioenergy, 30, 826-837. http://dx.doi.org/10.1016/j.biombioe.2006.02.003 [8] Ragauskas, A.J., Williams, C.K., Davison, B.K., Britovsek, G., Cairney, J., Eckert, C.A., Frederick Jr. W.J., Hallett,
J.P., Leak, D.J., Liotta, C.L., Mielenz, J.R., Murphy, R., Templer, R. and Tschaplinski, T. (2006) The Path Forward for Biofuels and Biomaterials. Science, 311, 484-489. http://dx.doi.org/10.1126/science.1114736
[9] Hillring, B. (2006) World Trade in Forest Production and Wood Fuel. Biomass Bioenergy, 30, 815-825. http://dx.doi.org/10.1016/j.biombioe.2006.04.002
[10] McKendry, P. (2002) Energy Production from Biomass (Part 1): Overview of Biomass. Bioresource Technology, 83, 37-46. http://dx.doi.org/10.1016/S0960-8524(01)00118-3
[11] Binder, J.B. and Raines, R.T. (2009) Simple Chemical Transformation of Lignocellulosic Biomass into Furans for Fu-els and Chemicals. Journal of the American Chemical Society, 131, 1979-1985. http://dx.doi.org/10.1021/ja808537j
[12] Nussbaumer, T. (2003) Combustion and Co-Combustion of Biomass: Fundamentals, Technologies and Primary Meas-ures for Emission Reduction. Energy & Fuels, 17, 1510-1521. http://dx.doi.org/10.1021/ef030031q
[13] Van Loo, S. and Koppejan, J. (2002) Handbook of Biomass Combustion and Co-Firing. IEA Bioenergy Task, 32, 7-53. [14] Gravalos, I., Kateris, D., Xyradakis, P., Gialamas, T., Loutridis, S., Augousti, A., Georgiades, A. and Tsiropoulos, Z.
(2010) A Study on Calorific Energy Values of Biomass Residue Pellets for Heating Purposes. Proceedings of the 43rd FORMEC Conference on Forest Engineering: Meeting the Needs of the Society and the Environment, Padova, 11-14 July 2010.
[15] Sotelo Montes, C., Silva, D.A., Garcia, R.A., Muñiz, G.I.B. and Weber, J.C. (2011) Calorific Value of Prosopis afri-cana and Balanites aegyptiaca Wood: Relationships with Tree Growth, Wood Density and Rainfall Gradients in the West African Sahel. Biomass Bioenergy, 35, 346-353. http://dx.doi.org/10.1016/j.biombioe.2010.08.058
[16] DD CEN/TS 14918 (2005) Solid Bio Fuels e Method for the Determination of Calorific Value. [17] Erakhrumen, A.A. (2009) Energy Value as a Factor of Agroforestry Wood Species Selectivity in Akinyele and Ido
Local Government Areas of Oyo State, Nigeria. Biomass Bioenergy, 33, 1428-1434. http://dx.doi.org/10.1016/j.biombioe.2009.06.007
[18] Telmo, C. and Lousada, J. (2011) The Explained Variation by Lignin and Extractive Contents on Higher Heating Val-ue of Wood. Biomass Bioenergy, 35, 1663-1667. http://dx.doi.org/10.1016/j.biombioe.2010.12.038

I. Gravalos et al.
67
[19] Günther, B., Gebauer, K., Barkowski, W., Rosenthal, M. and Bues, C.-T. (2012) Calorific Value of Selected Wood Species and Wood Products. European Journal of Wood and Wood Products, 70, 755-757. http://dx.doi.org/10.1007/s00107-012-0613-z
[20] Patel, B. and Gami, B. (2012) Biomass Characterization and Its Use as Solid Fuel for Combustion. Iranica Journal of Energy & Environment, 3, 123-128. http://dx.doi.org/10.5829/idosi.ijee.2012.03.02.0071
[21] Núñez-Regueira, L., Prouṕin-Castiñeiras, J. and RodŕiguezAñón, J.A. (2002) Energy Evaluation of Forest Residues Originated from Eucalyptus globules Labill in Galicia. Bioresource Technology, 82, 5-13. http://dx.doi.org/10.1016/S0960-8524(01)00156-0
[22] Boundy, B., Diegel, S.W., Wright, L. and Davis, S.C. (2011) Biomass Energy Data Book: Edition 4. Energy Efficiency and Renewable Energy, US Department of Energy. http://cta.ornl.gov/bedb
[23] Bahadori, A., Zahedi, G., Zendehboudi, S. and Jamili, A. (2014) Estimation of the Effect of Biomass Moisture Content on the Direct Combustion of Sugarcane Bagasse in Boilers. International Journal of Sustainable Energy, 33, 349-356. http://dx.doi.org/10.1080/14786451.2012.748766
[24] Sluiter, A., Hames, B., Ruiz, R., Scarlata, C., Sluiter, J. and Templeton, D. (2008) Determination of Ash in Biomass. National Renewable Energy Laboratory, Golden, CO.
[25] Biedermann, F. and Obernberger, I. (2005) Ash-Related Problems during Biomass Combustion and Possibilities for a Sustainable Ash Utilization. Austrian Bioenergy Centre GmbH, Bios Bioenergiesysteme GmbH. http://www.bios-bioenergy.at/uploads/media/Paper-Biedermann-AshRelated-2005-10-11.pdf
[26] Oosterhuis, D.M. and Jernstedt, J. (1999) Morphology and Anatomy of the Cotton Plant (Chapter 2.1). In: Smith, W.C. and Cothren, J.T., Eds., Cotton: Origin, History, Technology, and Production, John Wiley & Sons, Inc.
[27] Ramos, P.A.B., Guerra, Â.R., Guerreiro, O., Freire, C.S.R., Silva, A.M.S., Duarte, M.F. and Silvestre, A.J.D. (2013) Lipophilic Extracts of Cynara cardunculus L. var. Altilis (DC): A Source of Valuable Bioactive Terpenic Compounds. Journal of Agricultural and Food Chemistry, 61, 8420-8429. http://dx.doi.org/10.1021/jf402253a
[28] Shen, H., Fu, C., Xiao, X., Ray, T., Tang, Y., Wang, Z. and Chen, F. (2009) Developmental Control of Lignification in Stems of Lowland Switch-Grass Variety Alamo and the Effects on Saccharification Efficiency. BioEnergy Research, 2, 233-245. http://dx.doi.org/10.1007/s12155-009-9058-6
[29] Miklovic, S. (2000) Typha angustifolia Management: Implications for Glacial Marsh Restoration. Restoration and Reclamation Review, 6, 1-11.
[30] Swearingen, J. and Saltonstall, K. (2010) Phragmites Field Guide: Distinguishing Native and Exotic Forms of Com-mon Reed (Phragmites australis) in the United States. Plant Conservation Alliance, Weeds Gone Wild. http://www.nps.gov/plants/alien/pubs/index.htm
[31] ASAE (2001) Method of Determining and Expressing Fineness of Feed Materials by Sieving, ASAE S319.3. American Society of Agricultural Engineers, St. Joseph, 573-576.
[32] IKA®-WERKE C 5000 (2004) Control/Duo Control. Operating Instructions. Ver. 09 02.04, 1-128. [33] Chang, R. (2000) Physical Chemistry for the Chemical and Biological Sciences. University Science Books, Sausalito,
74-117. [34] CEN/TS 14918:2005 (2005) Solidbio Fuels—Method for the Determination of Calorific Value, 66. [35] Hennessy, W. (2010) Review of Wood Fuel Testing Standards. CRL Energy Report No. 10-11013 for EECA, Wel-
lington, 33. [36] CEN/TS 14774-1:2009 (2009) Solid Biofuels—Methods for the Determination of Moisture Content—Oven Dry Me-
thod Total Moisture—Reference Method, 12. [37] CEN/TS 14775:2004 (2004) Solid Biofuels—Method for the Determination of Ash Content, 12. [38] Haykiri-Acma, H. and Yaman, S. (2011) Comparison of the Combustion Behaviors of Agricultural Wastes under Dry
Air and Oxygen. Proceedings of the World Renewable Energy Congress: Bioenergy Technology (BE), Linkӧping, 8-13 May 2011. http://dx.doi.org/10.3384/ecp11057251
[39] Karaj, S. and Müller, J. (2010) Determination of Physical, Mechanical and Chemical Properties of Seeds and Kernels of Jatropha curcas L. Industrial Crops and Products, 32, 129-138. http://dx.doi.org/10.1016/j.indcrop.2010.04.001
[40] Wannapeera, J., Worasuwannarak, N. and Pipatmanomai, S. (2008) Product Yields and Characteristics of Rice Husk, Rice Straw and Corncob during Fast Pyrolysis in a Drop-Tube/Fixed-Bed Reactor. Songklanakarin Journal of Science and Technology, 30, 393-304.
[41] Poddar, S., Kamruzzaman, M., Sujan, S.M.A., Hossain, M., Jamal, M.S., Gafur, M.A. and Khanam, M. (2014) Effect of Compression Pressure on Lignocellulosic Biomass Pellet to Improve Fuel Properties: Higher Heating Value. Fuel, 131, 43-48. http://dx.doi.org/10.1016/j.fuel.2014.04.061
I. Gravalos et al.
68
[42] Valchev, I., Lasheva, V., Tzolov, T.Z. and Josifov, N. (2009) Silica Products from Rice Hulls. Journal of the Universi-ty of Chemical Technology and Metallurgy, 44, 257-261.
[43] Ludueña, L., Fasce, D., Alvarez, V.A. and Stefani, P.M. (2011) Nanocellulose from Rice Husk Following Alkaline Treatment to Remove Silica. BioResources, 6, 1440-1453.
[44] Kludze, Η., Deen, Β. and Dutta, Α. (2013) Impact of Agronomic Treatments on Fuel Characteristics of Herbaceous Biomass for Combustion. Fuel Processing Technology, 109, 96-102. http://dx.doi.org/10.1016/j.fuproc.2012.09.043
[45] Christian, D.G., Riche, A.B. and Yates, N.E. (2002) The Yield and Composition of Switch-Grass and Coastal Panic Grass Grown as a Biofuel in Southern England. Bioresource Technology, 83, 115-124. http://dx.doi.org/10.1016/S0960-8524(01)00201-2
[46] Vamvuka, D., Topouzi, V. and Sfakiotakis, S. (2010) Evaluation of Production Yield and Thermal Processing of Switch-Grass as a Bio-Energy Crop for the Mediterranean Region. Fuel Processing Technology, 91, 988-996. http://dx.doi.org/10.1016/j.fuproc.2010.02.018
[47] Mani, S., Tabil, L.G. and Sokhansanj, S. (2003) An Overview of Compaction of Biomass Grinds. Powder Handling and Processing, 15, 160-168.
[48] Mani, S., Tabil, L.G. and Sokhansanj, S. (2004) Grinding Performance and Physical Properties of Wheat and Barley Straws, Corn-Stover and Switch-Grass. Biomass and Bioenergy, 27, 339-352. http://dx.doi.org/10.1016/j.biombioe.2004.03.007