an experimental study of performance and emission on
TRANSCRIPT

AN EXPERIMENTAL STUDY OF PERFORMANCE AND EMISSION ON ETHANOL FUELLED PRE AND POST INJECTION IN HIGH COMPRESSION IGNITION ENGINE
WITH ZIRCONIA COATING
Velliangiri Murugasen Assistant professor
Coimbatore Institute of Technology Coimbatore Tamilnadu
India
Sureshkannan Gurusamy Assistant professor
Coimbatore Institute of Technology Coimbatore Tamilnadu
India
Krishnan Annur Srinivasan Associate professor
Coimbatore Institute of Technology Coimbatore Tamilnadu
India
ABSTRACT The research article presented here mainly focuses on
the influence of pre and post-injection (split in to three
injections) technique that was used to improve the ethanol fuel
combustion in compression ignition mode (CI), with and
without zirconia surface coating. Combustion simulation results
and experimental results were investigated and compared with
different experimental conditions. This research was used (95%
Ethanol +5% water) as a fuel in a four stroke single cylinder
variable compression ratio (VCR) engine. The VCR engine was
used to optimize compression ratio (28.8:1) and conducted
various experiments. Performance and exhaust emissions of
NOx, CO and HC were compared with ethanol fuel split
injection mode, single injection mode and diesel fuel mode.
Brake thermal efficiency of pre and post injection mode was
better than direct injection (DI) ethanol mode. The VCR engine
operating with ethanol fuel split injection mode showed peak
brake thermal efficiency (BTE) of 29%, which is nearly
operating range in the baseline diesel engine. Ethanol fuel was
mixed with 3% castorene R40 (lubrication oil) oil by volume
due to fully soluble in alcohol fuels. It was used both air and
liquid cooled engines running on methanol and ethanol fuel. Pre
and post ethanol injection mode was 54.4 % reduction of
Oxides of nitrogen (NOx) compared with single injection mode
of operation. In comparison of diesel mode operation with
zirconia coating was 3.8% increased than without coating.
KEYWORDS – Ethanol Direct injection - pre and post
Injection – Zirconia coating - high compression ignition –
Experimental investigation- performance and emission-
simulation.
NOMENCLATURE BMEP Brake Mean Effective Pressure
NOx Oxides of nitrogen
IMEP Indicated Mean Effective Pressure
LHR Low Heat Rejection engine
TFC Total Fuel Consumption
SFC Specific Fuel Consumption
Wnet Work output
BP Brake Power
IP Indicated Power
BTE Brake thermal efficiency
ITE Indicated thermal efficiency
ME Mechanical efficiency
UHC Unburned Hydrocarbon
CO Carbon Monoxide
CI Compression Ignition
PSZ Partially Stabilized Zirconia
PM Particulate Matter
BSFC Brake Specific Fuel Consumption
E SIM Ethanol fuel simulation
E EXP Ethanol fuel experimental
CR Compression ratio
VCR Variable compression ratio
1.0 INTRODUCTION Petroleum fuel energy conservation and diversification
of sources of energy, which resulted from the initial sharp
increase in the price of crude oil in the early 2000, served as a
stimulant for research on all aspects of use of non-fossil fuels
for internal combustion engines. Alcohols, especially ethanol
and methanol, comprise one group of alternative fuels which is
1 Copyright © 2014 by ASME
Proceedings of the ASME 2014 International Mechanical Engineering Congress and Exposition IMECE2014
November 14-20, 2014, Montreal, Quebec, Canada
IMECE2014-36479

considered attractive for this purpose. Both ethanol and
methanol can be produced from indigenous energy resources
like biomass, coal and natural gas. Nowadays, the extinction
usage of fossil fuel due to continuous usage becomes the focus
attention for all the people in the world who depend on this
energy source in every activity.
The researchers attention is focused on fossil fuel due
to the fact that continuously usage of this fuel believed causing
environment problem i.e., air pollution and global warming.
Hence IC engine researchers all over the world have been trying
to look for a solution by exploring and using an alternate fuel,
which is environmental friendly and sustainable availability.
Compression ignition (CI) engine has higher thermal efficiency
and produces higher power that can save more fuel compared to
gasoline engine [1]. Therefore, diesel engines are usually used
on large buses, trucks, heavy duty equipments, agricultural
equipments and industrial machineries. However, diesel engines
also produce gaseous pollutants such as carbon monoxide (CO),
carbon dioxide (CO2), sulphur oxides (SOx), nitrogen oxides
(NOx), unburned hydrocarbons (HC), and particulate matter
(PM) [1-3]. Until now diesel fuel is usually derived from fossil
fuel, therefore alternative fuels are needed to replace fossil
based fuels, for both reducing the consumption of fossil fuels
and pollutants in the exhaust gases.
The heat transfer can be minimized by reducing the
heat transferred from combustion chamber to the pistons. This
leads to the idea of insulating the piston and cylinder walls.
These types of engines are known as Low Heat Rejection
(LHR) engines. This can be realized by zirconia coating the
pistons, cylinder walls with ceramics which can withstand high
thermal stresses. The piston heat flux is reduced due to low
thermal conductivity which reduces heat lost by the coolant.
When cylinder cooling losses were reduced, more of the heat
was delivered to the exhaust system. Thus, efficient recovery of
energy of the exhaust improves the thermal efficiency of a low
heat rejection engine.
1.2 PARTIALLY STABILIZED ZIRCONIA (PSZ) Partially stabilized Zirconia is a mixture of zircona
polymorphs, because insufficient cubic phase-forming oxide
(Stabilizer) has been added and a cubic plus Meta stable
tetragonal ZrO2 mixture is obtained. A smaller addition of
stabilizer to the pure zirconia will bring its structure into a
tetragonal phase at a temperature higher than 1,000°C, and a
mixture of cubic phase and monoclinic (or tetragonal)-phase at
a lower temperature. Therefore, the partially stabilized zirconia
is also called as Tetragonal Zirconia Polycrystalline
(TZP). Usually such PSZ consists of larger than 8 mol% (2.77
wt %) of MgO, 8 mol% (3.81 wt %) of CaO, or 3-4 mol% (5.4-
7.1 wt %) of Y2O3. PSZ is a transformation-toughened material.
The Micro crack is depending on difference in the thermal
expansion between the cubic phase particle and monoclinic (or
tetragonal)-phase particles in the PSZ. Coefficient of thermal
expansion for the monoclinic form is 6.5-6
/°C. The cubic form is
10.5-6
/°C up to 1200°C. This difference creates micro cracks
that dissipate the energy of propagating cracks. The induced
stress explanation depends upon the tetragonal-to-monoclinic
transformation, once the application temperature over pass the
transformation temperature at about 1000°C. The pure zirconia
particles in PSZ can metastabily retain the high-temperature
tetragonal phase. The cubic matrix provides a compressive
force that maintains the tetragonal phase. The stress energies
gained from propagating cracks, due to the transition from the
meta stable tetragonal to the stable monoclinic zirconia. The
energy was used by this transformation is sufficient to slow or
stop propagation of the cracks. Partially Stabilized Zirconia has
been used where extremely high temperatures are required.
The low thermal conductivity (about 8 Btu/ft2/in/°F at
1800°F) ensures low heat losses, and the high melting point
permits stabilized zirconia refractory’s to be used continuously
or intermittently at temperatures of 2,200°C (4000°F) in neutral
or oxidizing atmospheres. Above 1,650°C (3000°F), in contact
with carbon, zirconia is converted in to zirconium carbide. The
photographic view of Zirconia coated piston is shown in fig 25.
2.0 LUBRICATION Compression ignition (CI) engines are used on diesel
fuel injection equipments. Injection systems were lubricated by
the fuel itself. When ethanol fuel was substituted for diesel, the
lubricant must be supplied within the fuel to provide lubrication
of the fuel injection pump and injector.
The lubricant chosen has to be miscible with the fuel.
Ethanol fuel was mixed with 3% by volume of castorene R40
was used. Castorene R40 is a Castor oil based blend
incorporating synthetic lubricants and additives which enhance
the castor oils, naturally high film strength and resistance to
seizure. This enhancement represents significant advance in
lubrication containing vegetable oil and minimizes the risk of
thickening or lacquer formation. Lubrication oil was fully
soluble in alcohol fuels and ideally suited for use in both air and
liquid cooled engines running on methanol and ethanol fuel.
Ethanol Fuel properties are shown in Table-1
Table: 1- Ethanol Fuel Properties Chemical formula of ethanol C2H5OH
Molecular weight of ethanol 46.0
Composition of ethanol by weight
Carbon 52.0%
Hydrogen 13.0%
Oxygen 35.0%
Specific gravity at 15.5 oC 0.794
Boiling point oC 78.0
Latent heat of vaporization in kJ/kg 900
Vapor pressure at 58 0C in bar 0.21
Lower calorific value in kJ/kg 27,880
Mixing heating value in kJ/kg 2970
Stoichiometric air/fuel ratio 9.0
Ignition limit Air/ fuel ratio 3.57 to17
2 Copyright © 2014 by ASME
Self ignition temperature 420 oC
Cetane number 11
Octane numbers 102
(a) For Research 111
(b) For Motor 94
3.0 IMPLEMENTATION OF MATHEMATICAL MODELS FOR PRACTICAL CALCULATIONS
Diesel RK-model was used for multi fuel
thermodynamic combustion simulation, predicts performance
and emission parameters. Thermodynamic simulation software
DIESEL-RK was intended for calculation and optimization of
the super and turbocharged internal combustion engines.
This simulation tool was (version of the DIESEL-RK
is 4.1.3.189 (June 2012)) different from analogues. RK-
model was used for mixture formation, combustion in different
fuels in CI and SI engines and also the tool was used for multi-
parameter optimization. Main features of DIESEL-RK are
similar to known thermodynamic programs.
The DIESEL-RK has new advanced applications
which are absent in other programs. DIESEL-RK was oriented
on diesel combustion optimization, fuel injection analysis and
optimization. It was used for simulation and optimization of
piston bowl shape, injector design and location. Shape of
injection profile and multiple injections (split injections)
parameters were analyzed.
The RK-model was accounted for fuel drop sizes,
interaction of free sprays with swirl spray, and wall
impingement, evolution of near-wall flow formed by spray, hit
of fuel on cylinder head surface, hit of fuel on cylinder liner,
effect of piston motion and swirl intensity on heat release rate.
A precise description of the combustion process is
important in modeling the formation of harmful substances in
the cylinder. For example, the error in determining the
temperature in the cylinder 80-90K leads to a change in the
calculated NOx output by 30%, error in determining the
temperature of 190 K change in the calculated NOx output was
2.7 times [19]. Obviously, using the proposed mathematical
simulation tool rather than empirical or semi empirical models
provide a more accurate calculation and formation of harmful
substances in the diesel engine cylinder.
Simulation was concluded that the developed Diesel
Rk tool was allowed not only to describe the dynamics of heat
generation with sufficient accuracy, but also to adequately
respond to changes in design and adjustments in the parameters
of diesel and ethanol fuel combustion chamber. Pre and post
injection profile is shown in fig 2. Thermodynamic simulation
tool was used to predict NOx generation for every cycle in
ethanol and diesel pre and post injection mode.
3.1 SIMULATIONS OF ETHANOL FUEL CI COMBUSTION WITH VARIOUS COMPRESSION RATIOS
The multi-zone RK-model was used for ethanol fuel
combustion, injection parameter optimization, fuel injection
profile prediction, account of exhaust gas recirculation (EGR),
temperatures of piston and cylinder head and heat release rate
computation.
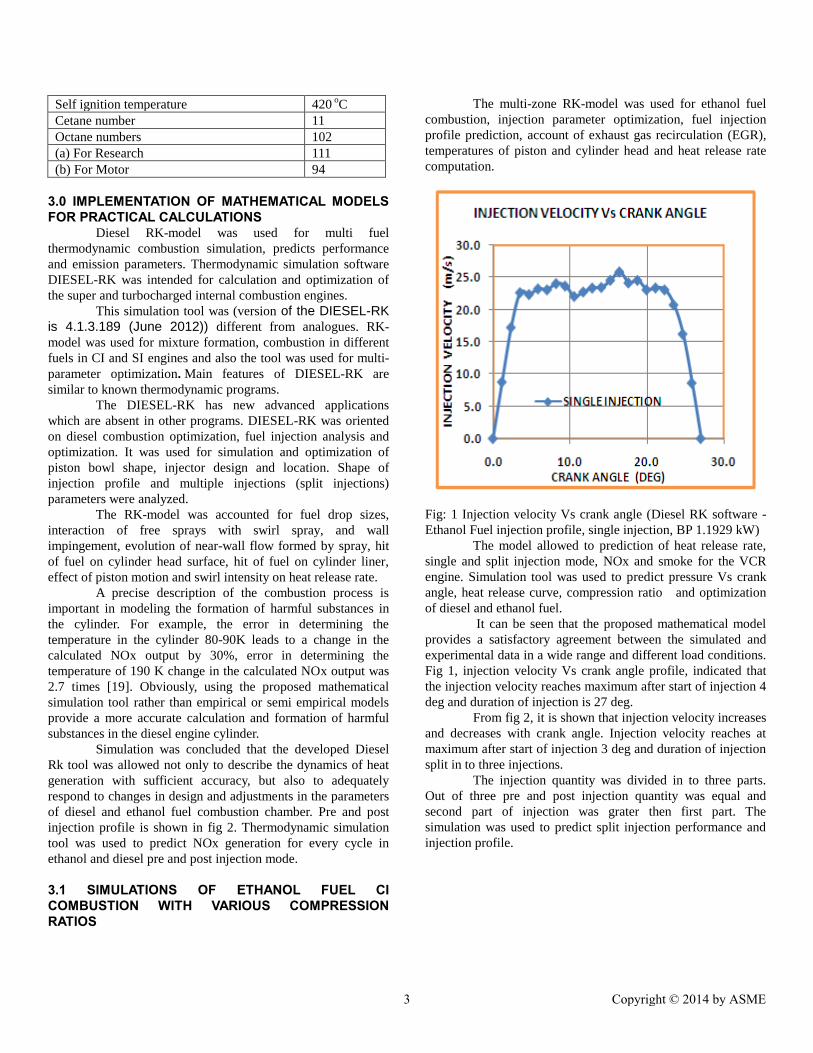
Fig: 1 Injection velocity Vs crank angle (Diesel RK software -
Ethanol Fuel injection profile, single injection, BP 1.1929 kW)
The model allowed to prediction of heat release rate,
single and split injection mode, NOx and smoke for the VCR
engine. Simulation tool was used to predict pressure Vs crank
angle, heat release curve, compression ratio and optimization
of diesel and ethanol fuel.
It can be seen that the proposed mathematical model
provides a satisfactory agreement between the simulated and
experimental data in a wide range and different load conditions.
Fig 1, injection velocity Vs crank angle profile, indicated that
the injection velocity reaches maximum after start of injection 4
deg and duration of injection is 27 deg.
From fig 2, it is shown that injection velocity increases
and decreases with crank angle. Injection velocity reaches at
maximum after start of injection 3 deg and duration of injection
split in to three injections.
The injection quantity was divided in to three parts.
Out of three pre and post injection quantity was equal and
second part of injection was grater then first part. The
simulation was used to predict split injection performance and
injection profile.
3 Copyright © 2014 by ASME

Peak Injection velocity = 26 m/s, x axis – crank angle (deg)
Fig: 2 Pre and post fuel injection profile (split injection-rpm -
1500)
Fig : 3 Combustion Chamber Parameters (compression ratio –
28.8:1 )
From fig 3, it is shown, combustion chamber
parameters. The piston bowl was represented as a solid of
rotation with an axis that was parallel to the cylinder axis. On
the right sketch the piston bowl given by the current basic data
was displayed. The view of this piston bowl dynamically
changes at editing basic data. The sketch was given for the
modern piston bowl; the set of basic data makes it possible to
carry out calculation of engines with spherical piston bowl and
piston. Diesel RK thermodynamic simulation tool used for
predict pressure Vs crank angle diagram for ethanol fuel high
compression (28.8:1) high pressure injection (single injection
and split injection mode).
Fig: 4 Injection parameters of combustion simulations (split
injection mode)
In the fig 4, fuel injection parameters, number of
injectors, distance between spray center and bowl axis were
shown. Distance between spary center and cylinder head plane
was used 2.03 mm. This simulation used 6 hole injector and all
sprays were identical.
Fig: 5 Pressure Vs Crank angle (Ethanol fuel single Injection
angle of injection BTDC-15 deg -rpm 1500.)
Diesel RK thermodynamic simulation tool used for
predict pressure Vs crank angle diagram for ethanol fuel high
pressure injection (single injection mode). From the fig 5 show
that, the combustion simulation was used fuel injection angle
before top dead center (BTDC) -15 deg and cylinder peak
pressure was predicted with variable load conditions. The
maximum peak pressure 128 bar was attained at after TDC 110.
Compression ratio 28.8:1 was used for simulation and predicted
in cylinder peak pressure.
Crank Angle, deg
4 Copyright © 2014 by ASME

Fig: 6 pressure Vs crank angle (Ethanol fuel mode simulation
using variable injection angle before TDC 17 T0 29 Deg, CR –
28.8:1, rpm - 1500)
From the fig 6, it is shown that the combustion
simulation in cylinder peak pressure was increased with
increasing compression ratio with constant load conditions and
fuel injection varies from BTDC 17 T0 29 Deg (CR – 28.8:1).
The maximum cylinder peak pressure 142 bar was attained at
after TDC 110. Pressure Vs crank angle diagram was used to
predict and optimized injection angle was implemented in
experimental.
Fig: 7 Pressure Vs crank angle (variable compression Ratio
range 24 t0 28.7)
From the fig 7, it is shown that the in cylinder peak
pressure was increased with increasing compression ratio
(variable compression Ratio range 24 to 28.8:1) with constant
load and speed. The maximum peak pressure 138 bar was
attained at after TDC 110.
Fig: 8 Concentration of NOX (ethanol fuel single injection mode
simulation results - variable injection angle variable injection
angle BTDC 17 T0 26 Deg- CR – 28.8:1, rpm- 1500)
From the figure 8, it is shown that NOx was increased
with increasing fuel injection angle before top dead center
(BTDC 17 T0 26 Deg, CR – 28.8:1) Ethanol single injection
mode simulation at maximum load condition (BTDC 17 T0 26
Deg-CR – 28.8:1) was started from 2000ppm to 6000ppm. It
was clear that ethanol fuel single injection angle was (17 deg)
optimized for reduction of NOx emission.
Fig: 9 - Operating mode data (simulation data sheet)
The fig 9 shows engine parameters viz, engine bore,
piston stroke, compression ratio, basic engine mechanism
design data, and connecting rod length. This base data was used
to simulate combustion and emission parameters.
5 Copyright © 2014 by ASME

Fig: 10 Concentration of NOx (Ethanol fuel simulation results
pre and post injection- rpm -1500)
From the figure 10 show that NOx was increased with
increasing load conditions. Ethanol fuel pre and post injection
mode simulation at maximum load condition was 900 ppm. It is
clear that ethanol fuel Pre and post injection mode was 54.4 %
greater reduction of oxides of nitrogen than single injection
mode. Pre and post injection mode was low temperature
combustion to compare single injection combustion mode. It
was concluded that NOx formation rate was reduced in split
injection mode of operation.
Fig: 11 Heat release Rate (j/deg ) Vs crank angle (ethanol fuel
mode simulation variable injection angle BTDC 17 T0 29 deg
CR – 28.8:1, rpm -1500)
The figure 11 shows heat release rate Vs crank angle,
in which, heat release rate was increased with increasing fuel
injection angle before top dead center (BTDC 17 T0 39 Deg-
CR – 28.8:1).
Fig: 12 Heat release Rate j/deg (simulation pre and post
injection)
The figure 12 shows, pre and post injection heat
release rate Vs crank angle simulation results. Heat release rate
was split in to three peaks, first peak was at 350 deg, second
peak was attained at 365 deg and third peak was attained at 385
deg. It was increased with increasing different load conditions.
Fig: 13 Heat release Rate j/deg comparison of ethanol single
and split injection mode simulation (angle of injection BTDC
17 CR – 28.8:1)
The figure 13 shows, simulation results of single
injection and split injection heat release rate Vs crank angle.
Split injection heat release split in to three peaks, first peak was
at 350 deg, second peak was attained at 365 deg and third peak
was attained at 385 deg. It was increased with increasing
different load conditions. Pre and post injection mode was low
temperature combustion than single injection combustion mode.
6 Copyright © 2014 by ASME

Fig : 14 pressure Vs creank angle comparison of ethanol single
and split injection.
The fig 14 shows the experimental comparison of
ethanol single and split injection in-cylinder pressure.
Combustion simulation data was used to predict peak pressure.
Cylinder peak pressure was increased with single injection
mode of simulation compare with split injection. The maximum
peak pressure of split injection mode was 124 bar attained at
after TDC 120. It was clear that split injection was low
temperature combustion.
4.0 DIESEL ENGINE COMBUSTION SIMULATION AND SINGLE AND SPLIT INJECTION The multi-zone RK-model was used for diesel fuel
combustion, injection parameter optimization, fuel injection
profile prediction, account of exhaust gas recirculation (EGR),
temperatures of piston bowl, cylinder head and heat release rate
computation. The model was allowed prediction of heat release
rate, single and split injection mode, NOx and smoke for the
VCR engine. Simulation tool was used to predict pressure Vs
crank angle, heat release rate curve, and compression ratio
optimization for diesel fuel. Detail Kinetic Mechanism for
correct prediction of NOx emission in CI engine with split
injection and single (199 reactions, 33 species). Detail Kinetic
Mechanism (DKM) is supported by the local release of
DIESEL-RK. It is known the "prompt" NOx have a large effect
at low combustion temperature (multiple injections, HCCI, in
ethanol fuel and diesel fuel, etc.). Reaction of "prompt" NO
formation is used by the equation 1 and 2.
CH + N2 = HCN + N. (1)
After HCN transmit into NOx with some delay using the
equation scheme.
HCN → CN → NH → HNO → NO. (2)
Current concentrations of CH radical (1) are calculated by use
the Detail Kinetic Mechanism (DKM) of combustion process.
Detail Kinetic Mechanism consists of two parts, first part
Kinetic of first breakup of fuel molecules consists of 40
reactions with 10 species and second part Detail kinetic
mechanism of ethanol oxidation and NO formation consists of
199 reactions with 33 species.
Fig; 15 Pressure Vs crank angle simulation (diesel fuel split
injection mode CR – 17.5 – rpm 1500)
As shown in fig 15, diesel fuel combustion simulation
in cylinder peak pressure was increased with increasing load
conditions. The maximum peak pressure 82 bar was attained at
after TDC 120. Indicator diagrams derived from the cylinder
pressure data offer detailed into the combustion process and
allow the drawing of conclusions regarding the process of
combustion.
Fig; 16 Experimental Pressure Vs crank angle( diesel fuel split
injection mode CR – 17.5,rpm-1500)
The fig 16 shows experimental comparison of diesel
split injection in-cylinder pressure with different load
conditions. Experimental data were used to predict peak
pressure. Cylinder peak pressure was increased with increasing
load. The maximum peak pressure of single injection mode was
68 bar attained at after TDC 120. It was clear that diesel split
injection was low temperature combustion.
From the figure 17 it is shown that diesel fuel
combustion simulation NOx emission was increased with
increasing brake power. Single injection mode simulation
compression ratio is 17.5, from low load to maximum load
condition was shown that 410ppm to 2000 ppm. Diesel fuel
7 Copyright © 2014 by ASME
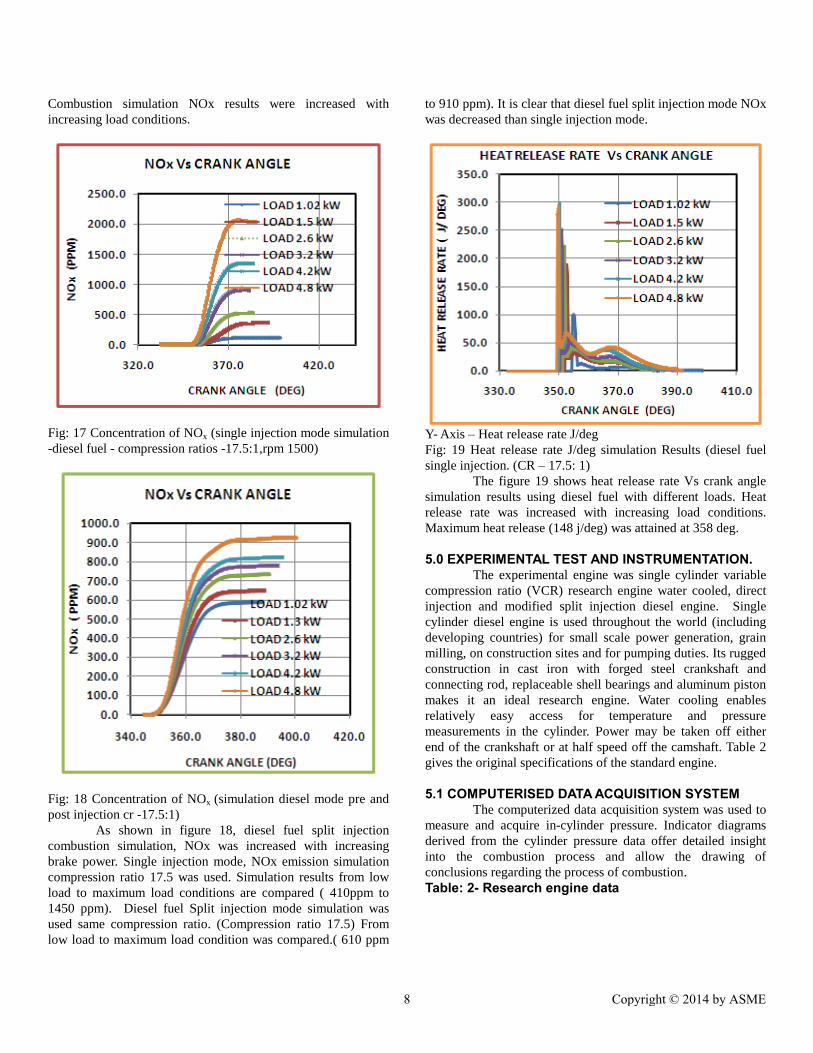
Combustion simulation NOx results were increased with
increasing load conditions.
Fig: 17 Concentration of NOx (single injection mode simulation
-diesel fuel - compression ratios -17.5:1,rpm 1500)
Fig: 18 Concentration of NOx (simulation diesel mode pre and
post injection cr -17.5:1)
As shown in figure 18, diesel fuel split injection
combustion simulation, NOx was increased with increasing
brake power. Single injection mode, NOx emission simulation
compression ratio 17.5 was used. Simulation results from low
load to maximum load conditions are compared ( 410ppm to
1450 ppm). Diesel fuel Split injection mode simulation was
used same compression ratio. (Compression ratio 17.5) From
low load to maximum load condition was compared.( 610 ppm
to 910 ppm). It is clear that diesel fuel split injection mode NOx
was decreased than single injection mode.
Y- Axis – Heat release rate J/deg
Fig: 19 Heat release rate J/deg simulation Results (diesel fuel
single injection. (CR – 17.5: 1)
The figure 19 shows heat release rate Vs crank angle
simulation results using diesel fuel with different loads. Heat
release rate was increased with increasing load conditions.
Maximum heat release (148 j/deg) was attained at 358 deg.
5.0 EXPERIMENTAL TEST AND INSTRUMENTATION.
The experimental engine was single cylinder variable
compression ratio (VCR) research engine water cooled, direct
injection and modified split injection diesel engine. Single
cylinder diesel engine is used throughout the world (including
developing countries) for small scale power generation, grain
milling, on construction sites and for pumping duties. Its rugged
construction in cast iron with forged steel crankshaft and
connecting rod, replaceable shell bearings and aluminum piston
makes it an ideal research engine. Water cooling enables
relatively easy access for temperature and pressure
measurements in the cylinder. Power may be taken off either
end of the crankshaft or at half speed off the camshaft. Table 2
gives the original specifications of the standard engine.
5.1 COMPUTERISED DATA ACQUISITION SYSTEM
The computerized data acquisition system was used to
measure and acquire in-cylinder pressure. Indicator diagrams
derived from the cylinder pressure data offer detailed insight
into the combustion process and allow the drawing of
conclusions regarding the process of combustion.
Table: 2- Research engine data
8 Copyright © 2014 by ASME

Make Research engine
No of cylinder One
Type of cooling Water
Ignition Compression ignition
Bore 87.5mm
Stroke 110 mm
Compression ratio 17.5: 1
Speed 1500 rpm
Brake power 4.9 kw
5.2 PRESSURE SIGNAL Pressure transducers are widely used in engine
research for acquisition of in-cylinder pressure data. For this
study a Kistler - type 6123 AI (Serial No. SN 370721) air
cooled piezoelectric pressure transducer was used. The small
transducer output charge was converted and amplified to a
pressure proportional voltage signal using a Kistler charge
amplifier .which is basically a charge-voltage converter. After
amplification the signal was fed into a 12 bit Analog to Digital
converter which digitizes the amplitude of the measured signal.
6.0 EXPERIMENTAL SETUP The experimental setup used in this study is shown in
fig 20. The experimental work was conducted on four stroke
single cylinder VCR split injection setup, water cooled, and
(DI) direct injection engine coupled on an eddy current
dynamometer. For measuring BP, exhaust temperature, NOX,
CO, CO 2 and Unburned HC level was measured in the exhaust
pipe. The engine exhaust temperature was measured using
digital chromel -alumel thermocouple.
The NOX level was measured using NOX analyzer. The
carbon monoxide and unburned hydrocarbon was measured by
using infrared analyzer. Fuel consumption was measured with
the help of burette and digital stop watch. The experiments were
conducted at various loads from no load to full load with and
without coated piston with different fuels. (Wet ethanol, diesel).
7.0 ENGINE MODIFICATION The selected engine was variable compression ratio
(VCR) diesel engine. The specifications and technical details of
the research engine are shown in table 2. The engine is water
cooled and single cylinder vertical engine. The engine is
mounted on a sturdy concrete bed to withstand the dynamic
forces and vibrations produced. The required compression ratio
and pre and post injection setups were provided with
modifications.
7.1 EXPERIMENTAL TEST DESCRIPTION The experimental engine was designed for this work was
derived from the single cylinder VCR diesel engine, modified
suitably to accommodated pre and post injection (split
injection) electronic control module (ECU). The experiment tests were conducted using ethanol fuel
and diesel fuel with the compression ratio from 17:1 to 29.4:1.
The experimental results were reported and discussed. The
purpose of the computerized data acquisition system was used
to measure and acquire cylinder pressure. Indicator diagrams
derived from the cylinder pressure data offer detailed insight
into the combustion process and allow the drawing of
conclusions regarding the process of combustion itself.
Experimental set up was used to measuring and acquiring
cylinder pressure data. It consists of a pressure transducer, a
crankshaft encoder giving the basis for pressure measurements
and a measuring system for storing and evaluating the pressure
signals. Four different types of fuel injectors were evaluated for
measured engine brake thermal efficiency as well as spray
characteristics with Ethanol fuel.
Fig: 20 Computerized Data Acquisition System VCR Engine
Experimental setup.
8.0 RESULTS AND DISCUSSION The experimental and simulation results were
compared and discussed various load conditions, single and
split injection mode of operations. Unburned hydrocarbon
(HC), carbon monoxide (CO), oxides of nitrogen (NOx), total
fuel consumption (TFC), specific fuel consumption (SFC),
brake thermal efficiency (BTE) of the research VCR engine
operating with ethanol fuel and base line engine results were
compared and discussed.
The high pressure direct injection diesel mode and pre
and post injection mode experimental results were compared for
performance and Emissions with Coating and without coating.
8.1 UNBURNEDHYDROCARBON EMISSIONS
From the fig 21, it is clear that, 10% of unburned
hydrocarbon emission was reduced in pre and post injection
mode than ethanol fuel single mode of operation. Experimental
mode ethanol (pre and post injection mode) HC emission
9 Copyright © 2014 by ASME

slightly increased than simulation. Ethanol pre and post
injection with coating mode slightly decreased than without
coating experimental mode.
E SIM-Ethanol simulation, E EXP- Ethanol Experimental,
DIESEL EXP – Diesel Experimental mode
Fig: 21 HC Vs BP Comparison at Constant Speed Mode ( rpm -
1500 )
The ethanol fuel has sufficient amount of oxygen, due
to that unburned hydrocarbon (HC) emission is reduced. As a
result of this, the HC will split into H and C which mixes with
O2, thereby reducing the HC emissions both pre and post
injection and single injection mode. Experimental observation
for diesel mode with coating is 4.2% reduced than without
coating.
8.2 CO EMISSIONS In fig 22, different modes of experimental and
simulation results were compared and discussed. It is clear that
CO was decreased with zirconia coating due to the complete
combustion. The carbon monoxide, which arises mainly due to
incomplete combustion. It is a measure of combustion
efficiency.
Generally, oxygen availability of ethanol was high,
due to that carbon easily combines with oxygen and reduces the
CO emission. It was observed that pre and post injection 40.2%
CO emissions were less than baseline diesel engine. Diesel with
coating and without coating results are compared and shown.
Ethanol fuel simulation and experimental results are compared.
Fig: 22 CO Vs BP Comparison at Constant Speed Mode (RPM-
1500)
Fig: 23 NOx Vs BP Comparison at Constant Speed Mode (rpm-
1500)
From the fig 23, it is shown that the NOx was
increased with increased load conditions at all test conditions.
Diesel injection without coating slightly decreased compare to
with zirconia coating. Ethanol single injection mode with
zirconia coating slightly increased with compare to without
coating. Ethanol split injection mode with coating NOx
emission was decreased compare to single injection with
coating mode. From the fig. 10 shows that simulation of NOx
range from 400 to 820 ppm. It was clear that ethanol fuel Pre
10 Copyright © 2014 by ASME

and post injection mode was a 54.4 % greater reduction of
oxides of nitrogen than single injection mode. In comparison of
Diesel mode operation with coating is 3.8% increased than
without coating.
8.3 BRAKE THERMAL EFFICIENCY From the fig 24 it is shown that brake thermal
efficiency of zirconia coated ethanol fuel pre and post injection
mode was 5.3% increased than single injection. Brake thermal
efficiency was increased due to reduction of heat loss to
surroundings from the engine.
Fig: 24 BTE Vs BP Comparisons of Constant Speed Mode
(rpm-1500) and variable load mode.
Ethanol fuel was also favorable compared to that of
the baseline diesel engine. Maximum ethanol mode simulation
BTE (34%) of pre and post injection mode operation was
achieved.
Fig: 25 Zirconia coated piston (Research Engine piston)
.
Fig: 26 Photographic view of modified piston
9.0 CONCLUSION The present engine, optimized compression ratio for
alcohol fuels, exceeds the performance of current conventional
fueled engines, and has potential as a lower-cost alternative to
the diesel.
Brake Thermal Efficiency of Zirconia coated ethanol
fuel pre and post injection mode was 5.3% increased
than single injection mode.
Emissions of NOx, CO and HC using a conventional
engine were shown to be extremely low with ethanol
mode
VCR ethanol fuel Pre and post injection mode engine
was 54.4 % greater reduction of oxides of nitrogen
than single injection mode due to low temperature
combustion to compare with single injection
combustion mode.
In comparison of Diesel mode operation, with coating
was 3.8% increased than without coating.
The unburned hydrocarbon emission is 10.2 % reduced
in pre and post injection (with coating) than ethanol
fuel single mode of operation. Pre and post injection
mode was better combustion than single injection.
Brake thermal efficiency with ethanol fuel is also
favorable compared to that of the baseline diesel
engine. In comparison of Diesel mode operation, with coating
NOx was 3.8% increased than without coating. Maximum ethanol mode BTE was 29 % of pre and
post injection mode operation was achieved by
experimental method.
10 .0 ACKNOWLEDGMENTS
The authors express their deep gratitude to the
management of Coimbatore Institute of Technology for
providing the necessary facilities for carrying out the
experiments. The authors would like to thank in particular,
beloved Correspondent Dr. S. R. K. Prasad, Secretary Dr. R.
Prabhakar, and our Principal Dr. V.Selladurai who have been
constantly encouraging and supporting us in this research.
11 Copyright © 2014 by ASME

REFERENCES [1]. Kuleshov, A. S., 2006, “Use of Multi-Zone DI Diesel Spray
Combustion Model for Simulation and Optimization of
Performance and Emissions of Engines with Multiple
Injection”, SAE Paper No 2006-01-1385.
[2]. Kuleshov, A.S., 2007, “Multi-Zone DI Diesel Spray
Combustion Model and its application for Matching the Injector
Design with Piston Bowl Shape”, SAE Paper No 2007-01-
1908.
[3]. A. Kuleshov and K. Mahkamov, 2008, “Multi-zone diesel
fuel spray combustion model for the simulation of a diesel
engine running on biofuel” , Proc. Mechanical Engineers, Vol.
222, Part A, Journal of Power and Energy, pp. 309 – 321.
[4]. Zeldovich Ya. B., and Raizer Yu.P., “Physics of shock
waves and high-temperature hydrodynamic phenomena”,
Moscow: Nauka.
[5] M. N. Nabi, et al., 2000, “Ultra Low Emission and High
Performance Diesel Combustion with Highly Oxygenated
Fuel”, SAE Paper 2000-01-0231.
[6.] N. Miyamoto, et al., 1998, “Smokeless, Low NOx, High
Thermal Efficiency, and Low Noise Diesel
Combustion with Oxygenated Agents as Main Fuel, SAE Paper
980506, 1998.
[7]. R. Baranescu, et al., 1989, “Prototype Development of a
Methanol Engine for Heavy-Duty Application-
Performance and Emissions”, SAE Paper 891653.
[8] .B. Dhaliwal, et al., 2000, “Emissions Effects of Alternative
Fuels in Light-Duty and Heavy-Duty Vehicles”, SAE Paper
2000-01-0692.
[9]. N. D. Brinkman, 1977, “Effect of Compression Ratio on
Exhaust Emissions and Performance of a Methanol- Fueled
Single-Cylinder Engine”, SAE Paper 770791.
[10]. P. Mohanan, and M. K. Gajendra Babu, 1991, “A
Simulation Model for a Methanol-Fueled Turbocharged
Multi- Cylinder Automotive Spark Ignition Engine”, SAE
Paper 912417.
[11]. T. Ryan, and S. Lestz, 1980, "The Laminar Burning
Velocity of Isooctane, N-Heptane, Methanol, Methane and
Propane at Elevated Temperatures and Pressures in the Presence
of a Diluent", SAE Paper 800103.
[12].V. Battista, et al., 1990, “Review of the Cold Starting
Performance of Methanol and High Methanol Blends in Spark
Ignition Engines: Neat Methanol”, SAE Paper 902154.
[13]. K. Hikino, T. Suzuki, 1989, “Development of Methanol
Engine with Autoignition for Low NOx Emission and Better
Fuel Economy”, SAE Paper 891842.
[10].L. G. Dodge, et al., 1998, “Development of an Ethanol-
Fueled Ultra-Low Emissions Vehicle”, SAE 981358.
[14]. K. Iwachidou, and M. Kawagoe, 1988, “Transient
Unburned Methanol and Formaldehyde Emission
Characteristics in Cold Operation of a SI Engine Powered
by High-Methanol-Content Fuels”, VIII Int. Symp. On Alcohol
Fuels, pp. 443-448.
[15].N. Iwai, et al., 1988, “A Study on Cold Start ability
and Mixture Formation of High-Percentage Methanol
Blends”, SAE Paper 880044.
[16]. D. M. Swain, and D. Yerace, 2002, “Cold-Start
Hydrocarbon Reduction Strategy for Hybrid Vehicles, M.
S. Thesis, University of Michigan.
[17]. W. Clemmens, 1987, “Performance of Sequential Port
Fuel Injection on a High Compression Ratio Neat
Methanol Engine”, SAE Paper 872070.
[18]. C. D. de Boer, et al., 1988, “The Optimum Methanol
Engine with Electronic Control for Fuel Efficiency and Low
Emissions”, VIII Int. Symp. On Alcohol Fuels, pp. 425-430.
[19]. R. I. Bruetsch, and K. H. Hellman, 1992, “Evaluation of
a Passenger Car Equipped with a Direct Injection Neat
Methanol Engine”, SAE Paper 920196.
[20] Priesching, P., Ramusch, G., Ruetz, J. and Tatschl, R.,
2007, “3D-CFD Modeling of conventional and Alternative
Diesel Combustion and Pollutant Formation - A Validation
Study”, SAE 2007-01-1907.
12 Copyright © 2014 by ASME

ANNEX A
EXPERIMENTAL DATA
Experimental Data compression ratio ( CR-17.5:1)
Experimental data ethanol of split injection mode without zirconia coating (pre and post injection) CR-28.8:1
Experimental Data ethanol split injection mode with zirconia coating (pre and post injection) compression Ratio -28.8:1
13 Copyright © 2014 by ASME