performance and emission evaluation of triglyceride-gasoline
TRANSCRIPT

Applied Engineering in Agriculture
Vol. 30(4): 523-534 © 2014 American Society of Agricultural and Biological Engineers ISSN 0883-8542 DOI 10.13031/aea.30.10390 523
PERFORMANCE AND EMISSION EVALUATION OF TRIGLYCERIDE-GASOLINE BLENDS IN
AGRICULTURAL COMPRESSION IGNITION ENGINES
A. Lakshminarayanan, D. B. Olsen, P. E. Cabot
ABSTRACT. This article details the approach of using untreated oilseed triglycerides (plant oil) that can be produced at local and regional scales to supply fuel for farming operations. The main objective of this research was to conduct fuels and engines testing on triglyceride gasoline blends, congruent with practices already adopted at farm scales. Most farm equipment is powered by diesel engines. One of the major drawbacks of substituting triglycerides for diesel fuel is their density and viscosity in cold conditions. By blending triglycerides with 10% to 30% gasoline, however, their density and viscosity can be lowered, thus allowing the blended fuel substitute to be consumed in an unmodified diesel engine. Blended and unblended triglycerides were tested in 4.5Ll EPA Tier-2 and EPA Tier-3 diesel engines at the CSU Engines & Energy Conversion Laboratory. Maximum power testing was conducted in the field on a tractor. The Cold Filter Plug Point and Cloud Point of these blends were tested. The values differed significantly when compared to diesel. The viscosities were 7X greater than that of diesel. Phosphorous, sulfur, sodium, and potassium contents were greater compared to diesel but within the ASTM 6751 Biodiesel standard limits. The emission testing on the 4.5L Tier-3 engine showed that levels were within ±5% of diesel and PM was within ±10% of diesel for the triglyceride blend. The thermal efficiency was close to diesel while the mass based fuel consumption was approximately 10% higher than that of diesel. Reduction in the peak power was observed due to a reduction in lower heating value.
Keywords. Biofuels, Diesel, Engines, Emissions, Fuel, Oilseeds, Triglyceride gasoline blends.
he need for alternative fuels development in agriculture is clear in light of increased fuel demand and costs. Because fuel costs comprise a major share of farm enterprise budgets, farmers
are looking more closely at alternative fuels. Biofuels are being promoted to reduce greenhouse gas emissions and move towards achieving U.S. energy security (United States DOE, 2012). Agricultural rural communities are tied to energy supplies that vary year after year in an economic climate that needs greater predictability in the cost of farming inputs. Fuel costs represent one of the most significant and steadily-growing costs supported by farming operations (Uri and Day, 1992; Skalsky et al., 2008). Shifts in fuel prices require adaptation in agricultural sectors, as these shifts also affect food and biofuel feedstock production. Plant oil, or triglycerides, can be produced by crushing oilseed crops. Innovative farmers are currently evaluating oilseed crops (e.g., canola,
sunflower, camelina, carinata) that appear viable under various climatic and irrigation water supply conditions (Johnson et al., 2009). These evaluations are needed to help guide those focused on the use of triglycerides in rural machinery used for farming (Fuls, 1984; Paulsen et al., 2011). Keske et al., (2013), for example, concludes that oilseeds (camelina, in particular) can offset on-farm diesel use, making it economically feasible for farmers to grow their own fuel.
In some parts of the country, farmers are using oilseeds as a feedstock for triglyceride-gasoline blends (TGBs) and ultimately used as biofuel for diesel engines. The famer-collaborators in this study are producers in Rocky Ford, Colorado, where they have taken significant steps to establish a small-scale crushing facility and refinery to produce filtered oil primarily from canola and sunflower crops. The core aspect of the refinery is an advanced sequential pressing-centrifugation process that is unique compared to most operations of similar size and scope. Another unique aspect of this refinery is the cooperative model that it represents. The crushing facility is integrated on-site with the infrastructure of an animal feeding operation (AFO). After oilseeds are delivered by local farmers to the AFO for processing, the solids byproduct (“cake”) generated during the crushing step is purchased from the AFO for meal, thus generating an additional revenue stream back to the farmer. The clean oil is also retrieved by the farmer, some of whom use it as the basis for TGBs or a feedstock for another biofuel.
Submitted for review in August 2013 as manuscript number PM
10390; approved for publication by the Power & Machinery Division ofASABE in May 2014.
The authors are Arunachalam Lakshminarayanan, Graduate Student, Daniel B. Olsen, Associate Professor, Engines and Energy Conversion Laboratory, Colorado State University, Fort Collins,Colorado; and Perry E. Cabot, ASABE Member, Research Scientist andExtension Specialist, Colorado Water Institute and CSU Extension,Colorado State University, Fort Collins, Colorado. Corresponding author: Perry E. Cabot, Orchard Mesa Research Center, 3168 B ½ R,Grand Junction, CO 81503; phone: 970-434-3264 x203; e-mail: [email protected].
T

524 APPLIED ENGINEERING IN AGRICULTURE
Potential users of TGBs as biofuels need a fuller under-standing of its long-term impacts on their machinery. Currently, the discussion of TGBs occurs on various internet blogs and web sites that promulgate largely anecdotal evidence, un-replicated research, and opinions both positive and negative. Previous claims of favorable experience with triglyceride fuel blends, however, do exist (Goering et al., 1982; Zubik et al., 1984; Dorado et al., 2002; Drenth et al., 2014). No peer reviewed literature is found on TGBs, while there is an abundance of published work on other biofuels (Allen et al., 1999; Miers et al., 2007; Thornton et al., 2009; Bartoli et al., 2010; Shonnard et al., 2010; Bezergianni et al., 2012; Lapuerta et al., 2013). There is a substantial body of work on the practice of blending diesel fuel with triglycer-ides (Baker and Sweigert, 1947; Peterson et al., 1983; Ziejewski, 1983; Dorado, 1995). One of the major drawbacks of using triglycerides directly as fuel is the density and viscosity of the oil, which can generally cause problems for the fuel delivery system, especially in cold conditions (Srivastava and Prasad, 2000). Triglycerides also contain metals, which can affect long-term engine and exhaust after treatment system performance.
The collaborators on this project are located in southern Colorado, but the practice of blending triglycerides with petroleum products occurs in scattered areas throughout the United States. The research presented in this article summarizes an evaluation of the engine performance of a simplified biofuel that farmers can use as a means of reducing the economic insecurity associated with volatile and increasingly expensive fuel supplies. Nevertheless, because this approach is contrasted with the more standardized use of diesel and biodiesel, many farmers are interested but understandably have questions regarding the impact of TGBs on their vehicles, tractors, and generator engines. This research addresses many of these questions by conducting testing on an expanded suite of fuels and engines.
OBJECTIVES The main objective of this research project was to
conduct fuels and engines testing on several TGBs, congruent with practices already adopted at farm scales. This work was carried out in three different phases, which correspond to resource availability. As resources became available, TGB fuels were blended and testing was performed on available engines. Consequently, three different engines and different TGBs were utilized for the different phases of work. The TGBs were prepared in the same manner for each phase of testing, which was to match the specific gravity of typical diesel fuel. The objective of the engine testing was not to compare the performance of different engines running on TGBs, or to compare the performance of different TGBs on the same engine. Rather, it was to evaluate the performance and emissions of TGBs prepared in a consistent manner relative to diesel fuel in diesel engines. The objectives of this work are summarized in the list below.
• Test and evaluate TGBs produced using the same methodology currently being used in the field.
• Analyze fuel properties of TGB fuels and compare to diesel.
• Perform TGB fuel testing on agricultural engines to assess differences relative to diesel fuel in power, emissions, fuel consumption, and efficiency.
EXPERIMENTAL SETUP TEST FUELS
The typical approach to triglyceride blending is to use a thinning agent such as regular unleaded gasoline (RUG) in order to achieve a blended specific gravity (SG) comparable to that of diesel (DSL) fuel burned in conventional compression ignition engines. This blending process is intended to produce a simple miscible fluid in the range of 0.865 to 0.870, similar to diesel fuel. The farmers collaborating on this project will either mix the fuel volumetrically for sake of convenience or gravimetrically by measuring SG using an off-the-shelf hydrometer, VEE GEE Precision Hydrometer Model Cat#6602-4 (Kirkland, Wash.). For the gravimetric process, RUG is added to the triglyceride source to form a TGB at SG ≈ 0.87.
A complete summary of the fuels and TGBs tested is provided in table 1. The composition of each TGB blend varies since the properties of triglycerides vary for different harvests and oilseed types. Different amounts of RUG are required to achieve a target specific gravity close to 0.87, which is a representative value for diesel fuel at approximately 60°F. However, the most common approach is to measure the SG of diesel fuel supplied locally and then to match that value. Each TGB is designated by a subscript that correlates to a specific composition in the table. For example TGB2 corresponds to 32% RUG and 68% sunflower oil by volume. Similarly, TGB/DSL blends are designated by subscripts.
The triglycerides used to develop the blends originated from an on-farm oilseed crushing facility. Harvested oilseeds are trucked to this facility, located at an AFO in Rocky Ford, Colorado, and later crushed and filtered onsite. The seed is first crushed using rough presses, which produces meal for the AFO. The produced oil is then run through a modified screwpress designed by the farmer-cooperators and finally a 2-micron high-speed centrifuge manufactured by Servizi Industriali® to super-clean the oil. The TGB and TGB/DSL blends were blended and stored at room temperature in capped containers out of direct sunlight. They were agitated daily to ensure good mixing until the day of engine testing.
FUEL ANALYSIS TGB1 and diesel fuels were tested at the EECL fuels
laboratory for measuring the physical properties, including density and viscosity (ASTM D7042), metal content (ASTM 6751), cold flow plug point (CFPP – ASTM 6371), cloud point (CP –D2500), and the calorific value. These values for TGB1 were then compared to that of diesel fuel. Instruments used were Anton Parr for physical properties, Lawler Manufacturing Company’s cold flow property tester (Edison, N.J.), Ametek-Spectro for metals (Kleve, Germany), and a bomb calorimeter (IKA C200, Wilmington, N.C.) for calorific value.

30(4): 523-534 525
LABORATORY ENGINE CONFIGURATIONS Maximum power, fuel consumption and thermal
efficiency assessments were performed on a turbocharged and intercooled 4.5 L EPA Tier 2 John Deere 4045 test engine (Moline, Illinois) rated at 175 hp. The 100% load value for this program is de-rated to 154 hp (115 kW) due to high altitude (5000 ft/1530 m), test cell cooling limitations, and reduced LHV for TGB. Additional assessments of fuel consumption, thermal efficiency and emissions were performed on a 4.5 L Tier 3 John Deere 4045 test engine (Moline, Illinois) rated at 175 hp. The engine is turbocharged and intercooled, with a variable geometry turbocharger and exhaust gas recirculation. Both engines have electronically controlled common rail fuel injection.
The test engines at the Engines & Energy Conversion Laboratory (EECL) are connected to a 175 hp Eddy current dynamometer (Mid West Induction Dynamometer Model 1014A, Jackson, Wis.). Two different probes extracted exhaust for emissions measurements. An averaging probe was used for gaseous emissions and an isokinetic probe
was used for particulate measurement. Heated sample lines carry exhaust gas to gas analyzers and a dilution tunnel.
The laboratory engine test schematic is shown in figure 1. Engine performance and emissions were tested at 8 modes (table 2) per ISO 8178-4 (European Commission, 1998) test cycle C1. Data at each mode was recorded for 5 min once the engine was at steady state. Two fuels were tested at all eight modes to permit comparison of ISO weighted average emissions representing the full operating range of the engine. This is necessary in order to compare emissions with regulatory limits. Most fuels were not tested at all eight modes, in which case comparisons were made at individual operating modes. The fuel from each tank was delivered to the engine with a lift pump. A three-way valve was used to divert the return fuel to the waste tank or back to the engine. A Micro Motion flow meter (Model Number 2700R11BBCEZZZ, St. Louis, Mo.) was used to measure the net mass flow rate of fuel. The Micro Motion flow meter was the standard approach to measure net fuel flow rate. However, an electronic scale was used in two different scenarios. (1) It was used when fuel quantities were limited. (2) For some TGBs unstable flow meter readings
Table 1. Summary of fuels tested.
Engine Configuration Fuels Tested
Fuel Composition (by volumetric percentage) Specific % Triglyceride
Sunflower Canola % RUG[a] % DSL[b] GravityJohn Deere Tier 3 4045
Laboratory Test DSL[b] 100 0.84 TGB1 90.0 10.0 0.89[c]
John Deere Tier 2 4045 Laboratory Test
DSL 100 Not measured TGB2 68 32.0 0.87
TGB/DSL1 35 15.0 50.0 0.87 TGB/DSL2 23.1 10.9 66.0 0.87
John Deere Tier 2 4400 Field Test
DSL 100 Not measured TGB3 66.7 33.3 0.87
TGB/DSL3 33.5 16.5 50.0 0.87 TGB/DSL4 45.0 5.0 50.0 0.87
TGB1 90.0 10.0 0.89[c] [a] Regular Unleaded Gasoline (RUG). [b] Diesel (DSL). [c] Summer blend with higher specific gravity.
Figure 1. Laboratory engine test schematic for 4.5 L 175 hp John Deere 4045 Tier 2 and Tier 3 engines.

526 APPLIED ENGINEERING IN AGRICULTURE
were experienced, presumably due to gasoline vaporization in the return line. For those cases the fuel was retested using the electronic scale. When the electronic scale was used a small container of fuel was placed on the scale, with supply and return lines located in the fuel container with ends approximately 2 cm from the bottom of the container. The net fuel flow rate was calculated from the rate of change of the electronic scale readings. The electronic scale was a Pelouze Model 4010 (Bridgeview, Illinois).
Oxides of nitrogen (NO ), carbon monoxide (CO), total hydrocarbons (THC), carbon dioxide (CO2), and oxygen (O2) are determined with a Rosemount 5-gas emissions bench. A Peltier-type condenser removes water from the exhaust sample before the gas enters the analyzers. Chemiluminescence, infra-red absorption, flame ionization, and paramagnetic gas detection methods are used for NO , CO and CO2, THC, and O2, respectively.
A partial flow dilution tunnel is used to measure PM in the exhaust. A small portion of exhaust is discharged from the exhaust pipe through an isokinetic probe, through a heated sample line, and to the dilution tunnel via a venturi on the dilution air inlet. The dilution air flowrate is measured with a turbine meter. The exhaust flowrate is measured using differential pressure across the venturi as it flows into the dilution air. The mixture is passed through a residence chamber to simulate particulate mixing with ambient air. Then a portion of the flow is pulled from the base of the residence chamber a Teflon filter where PM is collected downstream of the PM10 cyclone, which eliminates particulates larger than 10 µm. The filter collects all particulate matter that passes through the cyclone. The filters are weighted before and after the test using a precision balance, accurate to 1 microgram. A complete description of the gas analyzers and the dilution tunnel can be found in Muktibodh (2009).
Measurements of maximum power, fuel consumption, brake thermal efficiency, and pollutant emissions were carried out on three different engines. The maximum power developed by an engine with a certain fuel is determined by running the engine at a set speed and increasing the load on the engine until it is unable to maintain the set speed. This assessment was performed on the John Deere-EPA Tier 2 laboratory engine and the John Deere 4440 tractor engine. In general, laboratory testing was performed by first bringing the engine to a desired operating point. Key parameters such as pollutant emissions, coolant temperature, air manifold temperature, and fuel flow rate were observed. Once key parameters were stable, 5 min of data was recorded at approximately 1 Hz. Average values over 5 min were calculated. Brake thermal efficiency and
brake specific emissions were computed from average parameters. The laboratory TGB data is presented as percent of the diesel baseline.
FIELD ENGINE Field testing was carried out on a John Deere Model
4440 tractor (Moline, Ill.) at a farm in Rocky Ford, Colorado. The tractor had a John Deere 7.6l engine, Model 6466T, rated at 142 hp at 2000 rpm. This tractor engine was manufactured prior to the implementation of the EPA multiple tier emissions standards. It can be considered Tier 0. The fuel system was a pump-line-injector type. Four fuels were used, which were (1) off road red diesel, (2) TGB1, (3) TGB3, and (4) 50% red diesel and 50% TGB1. The primary purpose of this testing was to measure maximum power output for different fuels.
The power take-off (PTO) shaft of the tractor was coupled to a Hydra Gauge Dynamometer manufactured by M&W Gear Company (Gibbson City, Ill.). The PTO shaft had a gear ratio of 2:1; hence readings displayed on the dynamometer were at 1000 rpm when the engine speed was 2000 rpm. The engine rack position was set to maximum and load was applied with the dynamometer. The dynamometer load was increased until the engine speed was reduced to 2000 rpm. The dynamometer power was recorded at this point, which corresponded to the maximum power at 2000 rpm.
TEST RESULTS FUEL PROPERTIES
The result of mixing the triglyceride source with RUG at the volumetric ratios described in table 1 above is a miscible fluid characterized by a pale yellow color. A sample of TGB1 was stored in a capped class container at room temperature. There has been no visible separation of triglyceride and gasoline after approximately 1 year of storage with no external mixing. Thus, qualitatively the mixture appears to be stable.
The fuel property test results are presented in tables 3-5. Phosphorous content in TGB1 was 10 times greater than diesel but only ∼1 ppm above the ASTM D6751 Biodiesel standard. Sulfur content is more than 9 times than that of diesel and the ASTM 6751 Biodiesel standard. Sodium and potassium contents were higher by orders of magnitude compared to diesel but still well within the ASTM 6751 Biodiesel limit. The elevated levels of sulfur and potassium are of concern for newer engines with after-treatment systems. These metals can poison catalysts, leading to accelerated degradation and reduced catalyst life. High sulfur level could lead to an increase in the SO emissions, though it is not likely to significantly impact NO emissions (Tan et al., 2009). It should be noted that the triglycerides used for this study were processed only by filtration. With additional processing steps, such as de-gumming and de-waxing, the metal levels could be decreased (Lambelet et al., 2003; Tasan et al., 2003).
The cold filter plugging point (CFPP) of TGB1 is much higher compared to diesel. Elevated CFPP may result in
Table 2. Test conditions of 8-mode map for engine performance and emissions per ISO 8178-4 (European Commission, 1998).
Mode Number Speed Torque (%) 1 Rated 100 2 Rated 75 3 Rated 50 4 Rated 10 5 Intermediate 100 6 Intermediate 75 7 Intermediate 50 8 Low 0

30(4): 523-534 527
difficulties running this TGB1 at extremely low tempera-tures. The cloud point (CP) of TGB1 is close to that of diesel, while the kinematic viscosity of TGB1 is approximately 7 times higher than diesel. The differences in CFPP, CP and kinematic viscosity could impact the ability of TGB1 to be pumped through the fuel system at lower temperatures. The difference in the cold flow properties is most likely due to the fact that the saturated fuels have a higher melting point than unsaturated fuels (Knothe, 2005). Because TGB1 exhibits high viscosity, low volatility and poor cold flow properties, it is possible that its use may cause injector coking, combustion chamber deposits and sticking of piston rings (Srivastava and Prasad, 2000). On-going durability testing is being conducted to evaluate these effects. It is possible that the RUG contained in TGBs may act as a solvent and counteract these effects. Note that the measured densities are very different. The density of TGB1 is higher than the target value of 0.87, and the diesel density is significantly lower than the assumed value of 0.87. TGB1 is a summer blend with a larger specific gravity, intended to have higher percent triglycerides. The assumed specific gravity for diesel of 0.87 is a representative value; specific values in different parts of the country are expected to deviate above and below this value.
Calorific value, or lower heating value (LHV), of TGB1 is ~8.7% lower than diesel. Reduced LHV is expected as triglycerides exhibit LHVs 10% to 15% lower than diesel. The LHV for RUG is slightly higher than diesel.
MAXIMUM POWER Figure 2 shows the average percent variation in the
maximum power output on the John Deere-EPA Tier 2 laboratory engine relative to diesel. The uncertainties (0.1% to 0.25%) were calculated by visually observing the analog rpm meter pointer over the test and the percent error was deduced. The data show TGB2 exhibited ~11% reduction in maximum power compared to diesel while the maximum power output for TGB/DSL1 and TGB/DSL2 were lower than diesel by 7% and 6%, respectively. The maximum
power increased with increasing percentage of diesel in the blends due to an increase in the LHV of diesel fuel compared to TGB2. Maximum power field test results are plotted in figure 3. The uncertainties (3.3%) were deduced by calculating the coefficient of variance over the averaging time of the data point. The variations in the peak power correspond to variations of LHVs of the fuels. The power of TGB/DSL3 fuel is reduced to 141 HP, a 3.2% reduction compared to DSL. This reduction is attributed to a smaller LHV of this fuel (40,500 kJ/kg), which is ~5% lower than that of DSL. The maximum horsepower of the TGB3 fuel was ~134 hp, a 7% reduction compared to DSL. This corresponds to a LHV approximately 9% lower than diesel. The horsepower of TGB/DSL4 fuel was ~142 HP, which was ~3% lower than that of diesel. This reduction is attributed to a smaller LHV (40,200 kJ/kg), which is ~5.5% lower than that of diesel. The TGB1 fuel gave a maximum horsepower of 130 hp, which was 10% lower than that of diesel. The LHV of this fuel (37,700 kJ/kg) is approximate-ly 11% lower than that of diesel.
Note that in each case the percent reduction in LHV is greater than the percent reduction in peak power observed. This is indicative of higher brake thermal efficiency for the blends. This outcome may be due to the lower compressi-bility of the TGB fuels. TGB1 exhibits 13.4% lower compressibility as compared to diesel. The relationship is similar for biodiesel. This observation could explain why the engines running on triglycerides and biodiesel have advanced combustion phasing, which can increase NO emissions (Mueller et al., 2009; Peng and Boehman. 2012). The field engines are pump-line-injector systems. Compared to common-rail injection systems, pump-line-injector systems are likely more sensitive to compressibility effects due to pressure transients in the line between the injector pump and the injector. Another possible factor is the cetane number of the fuel. Fuels with higher cetane numbers have shorter ignition delays and earlier combustion phasing, which can increase brake thermal efficiency.
Table 3. Fuel test results for comparison of diesel and TGB1 against ASTM D6751-12 for biodiesel.
Metal Species Concentration (ppm) Fuels Tested P S Na K Na + K ASTM standard 10 15 5 Diesel (DSL) 1.15 14.4 < 0.098 0.858 0.858 TGB1 11.3 133 3.54 0.895 4.43 Note: Multiple runs performed for each measurement and R value wasbetween 0.93 and 0.97.
Table 4. Physical properties of diesel and TGB1. ASTM Standard
D1298 D6371 D2500 D7042
Sound Velocity
@ 20°C Density @ 20°C
Cold Filter Plugging Point (CFPP)
Cloud Point (CP)
Kinematic Viscosity (ν) @ 40 °C
Fuels Tested (m s-1) (g cm-3) (°C) (°C) (mm2 s-1) Off road diesel 1370.8 ± 0.1 0.838 ± 1E-6 -19.0 ± 0.5 -18.0 ± 0.5 2.57 ± 0.01 TGB1 1426.8 ± 0.1 0.893 ± 1E-6 -13.0 ± 0.5 -17.0 ± 0.5 15.7 ± 0.1 Note: The accuracy/uncertainty values are calculated from the manufacturer specifications for each instrument.
Table 5. Calorific Value of Diesel and TGB1. Calorific Value
Fuels Tested (LHV MJ kg-1) Off Road Diesel 42.8 ± 0.2
TGB1 37.0 ± 0.2 RUG[a] 40.5 ±0.2
[a] Regular Unleaded Gasoline (RUG). Note: The accuracy/uncertainty values are calculated from the
specification sheet for the bomb calorimeter.

528 APPLIED ENGINEERING IN AGRICULTURE
FUEL CONSUMPTION AND THERMAL EFFICIENCY Figure 4 presents the average fuel consumption relative
to diesel for three engine operating conditions. The uncertainties (1%) were deduced by calculating the coefficient of variance over the averaging time of the data point. On average the fuel consumption rates for TGB/DSL1 and TGB3 were about 5% and 12%, respectively, greater than diesel. These increases are primarily due to the variation in the LHV differences of the blends.
The brake thermal efficiency for the fuels is plotted in figure 5. In general, thermal efficiency for the 80% load 1700 rpm data point was the highest, followed by 100% load 1700 rpm and then the 80% load 2200 rpm data. Thermal efficiency normalizes the variations in LHV. TGB/DSL1 produced a thermal efficiency of 0.05% to
0.30% higher than diesel. TGB3 has a thermal efficiency approximately the same (within ±0.1%) as diesel fuel. The uncertainties of the primary measurement (0.057% to 0.28%) were evaluated by calculating the coefficient of variance over the averaging time of the data point. For this comparison the uncertainties are generally large compared to differences in brake thermal efficiency. Thus, the differences in brake thermal efficiency are not statistically significant.
Mass based fuel consumption is presented in figure 4 as a percent of diesel for the John Deere 4.5 l EPA Tier 3 engine for the 8-mode map. The 8-mode test data was collected by running a diesel point, followed by a TGB1 point, then a final diesel point for each mode. This approach gave a more direct comparison with diesel performance. The results in figure 6 are similar to those for the John Deere 4.5 l Tier 2 engine.
Figure 2. Maximum power test John Deere 4.5 l Tier 2 engine.
Figure 3. Peak power for John Deere 4440 tractor engine and heating value of fuels.

30(4): 523-534 529
Higher fuel consumption is observed with TGB1 for most data points. However, the trend reverses when the fuel consumption is expressed on a volumetric basis (fig. 7). The volume-based fuel consumption is generally lower for TGB1 compared to diesel with exceptions for the low load data points where it was higher than diesel by 2% to 10%.
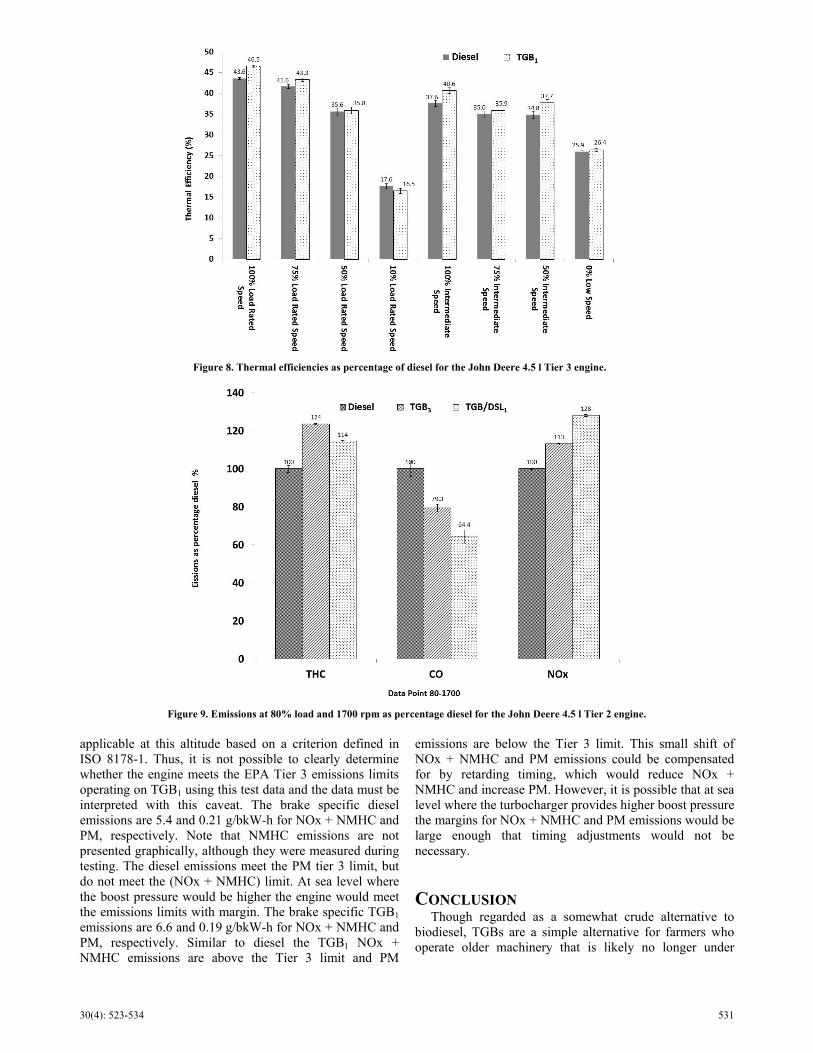
The thermal efficiency was calculated and plotted against diesel (fig. 8). The thermal efficiency of the TGB1 blend was generally higher than diesel by approximately 2% to 3%. This result is consistent with previous research by Faletti et al. (1984) who reported higher brake thermal efficiencies in various hybrid fuels consisting of partial vegetable oils.
The results indicate that end users would observe improved fuel consumption for TGB1, since fuel economy for on-road vehicles and farm machinery is normally
expressed in miles per gallon and gallons per hour, respectively. TGB1 is approximately 7% denser than diesel. The density difference in addition to slightly higher thermal efficiencies explains the volumetric fuel consumption benefit of using TGB1.
POLLUTANT EMISSIONS Exhaust emissions THC, CO, and NO are plotted with
respect to diesel in figures 9-11 for three engine operating conditions. The THC emissions are significantly higher for TGBs but display an inconsistent trend. Carbon monoxide decreases as the amount of TGB increases. Triglycerides are oxygenated, which may help promote more effective oxidation of carbon monoxide. Emissions of NO display an increasing trend with increasing levels of TGB. This is similar to behavior sometimes observed with biodiesel.
Figure 4. Fuel consumption by mass as percentage as diesel for the John Deere 4.5 l Tier 2 engine.
Figure 5. Brake thermal efficiency for the John Deere 4.5 l Tier 2 engine.

530 APPLIED ENGINEERING IN AGRICULTURE
Two possible explanations are: (1) faster combustion rates lead to higher cylinder temperatures that accelerate NO formation, and (2) oxygenated fuel combustion contains additional kinetic paths for NO formation.
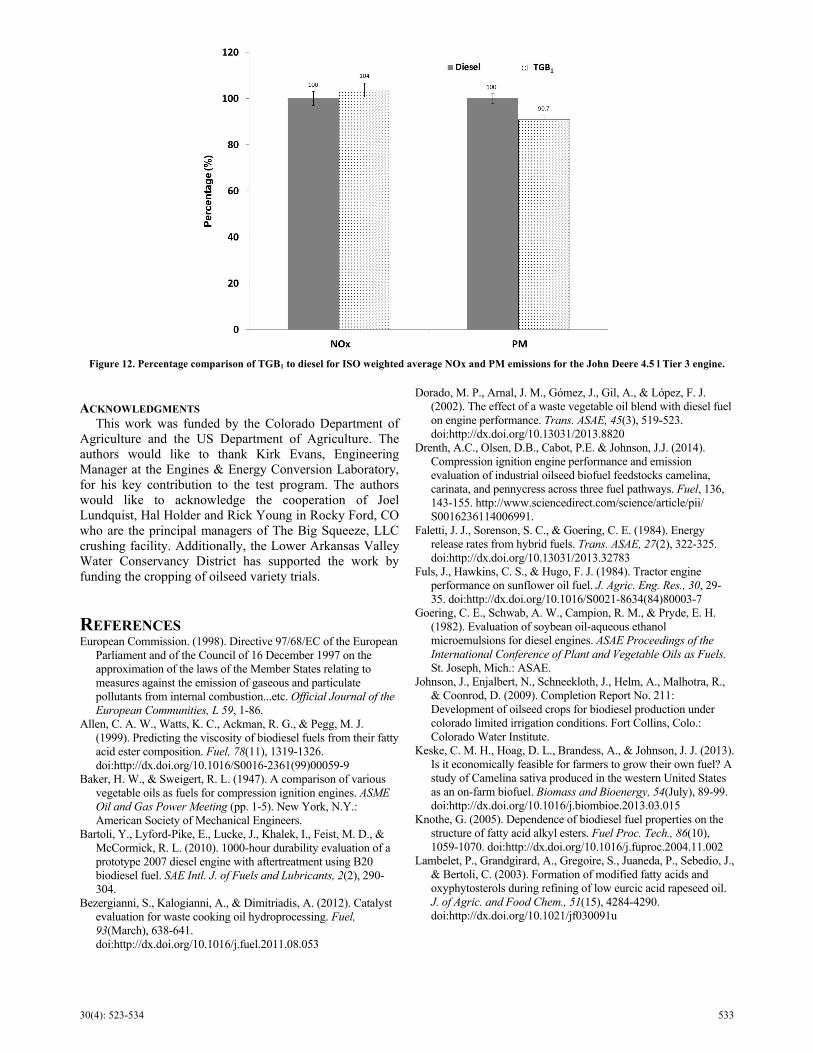
Emissions of NO and PM for the TGB1 test on the John Deere 4.5 l Tier 3 engine are shown in figure 12. These values are computed based on ISO 8178 8-mode weighting factors. The NO emissions for TGB1 is about 3.5% higher than diesel while PM was about 8% lower than diesel. Emissions of NO and PM typically trend in opposite directions, which is consistent with the data. For example, if the rate of combustion is faster for TGB1, then the combustion pressure peak occurs earlier and cylinder average temperature is higher, producing more NO .
Conversely, higher combustion temperatures tend to consume PM more completely prior to exhaust valve opening when combustion products are emitted into the exhaust system. The data is also consistent with the data presented above for the John Deere 4.5 l Tier 2 engine. Injection timing retard could be implemented to bring PM and NO closer to diesel levels.
EPA Tier 3 weighted average emission limits are 4.0 g/bkW-h for NOx + Non Methane Hydrocarbons (NMHC) and 0.3 g/bkW-h for PM. However, the engine is only required to meet these limits within a range of atmospheric conditions. This testing is performed at 1530 m (5000 ft) above sea level where the atmospheric pressure is approximately 84 kPa. The emissions limits are not
Figure 6. Mass based fuel consumption as percentage of diesel for the John Deere 4.5 l Tier 3 engine.
Figure 7. Volume based fuel consumption as percentage of diesel for John Deere 4.5 l Tier 3 engine.
30(4): 523-534 531
applicable at this altitude based on a criterion defined in ISO 8178-1. Thus, it is not possible to clearly determine whether the engine meets the EPA Tier 3 emissions limits operating on TGB1 using this test data and the data must be interpreted with this caveat. The brake specific diesel emissions are 5.4 and 0.21 g/bkW-h for NOx + NMHC and PM, respectively. Note that NMHC emissions are not presented graphically, although they were measured during testing. The diesel emissions meet the PM tier 3 limit, but do not meet the (NOx + NMHC) limit. At sea level where the boost pressure would be higher the engine would meet the emissions limits with margin. The brake specific TGB1 emissions are 6.6 and 0.19 g/bkW-h for NOx + NMHC and PM, respectively. Similar to diesel the TGB1 NOx + NMHC emissions are above the Tier 3 limit and PM
emissions are below the Tier 3 limit. This small shift of NOx + NMHC and PM emissions could be compensated for by retarding timing, which would reduce NOx + NMHC and increase PM. However, it is possible that at sea level where the turbocharger provides higher boost pressure the margins for NOx + NMHC and PM emissions would be large enough that timing adjustments would not be necessary.
CONCLUSION Though regarded as a somewhat crude alternative to
biodiesel, TGBs are a simple alternative for farmers who operate older machinery that is likely no longer under
Figure 8. Thermal efficiencies as percentage of diesel for the John Deere 4.5 l Tier 3 engine.
Figure 9. Emissions at 80% load and 1700 rpm as percentage diesel for the John Deere 4.5 l Tier 2 engine.

532 APPLIED ENGINEERING IN AGRICULTURE
warranty by manufacturers. The diesel engines used in this study were capable of burning TGBs without modification. While the initial testing suggests modestly favorable applications of TGBs in specific engines, research in this area requires long-term durability testing to assess the impact of using TGBs in the combustion chamber, fuel system, and after-treatment components.
Based on this research, some specific observations and conclusions about the engine performance and fluid properties of TGBs can be provided. The overall thermal efficiencies under various engine operating conditions when using TGB were slightly higher than for diesel, suggesting a slightly more efficient energy conversion. High viscosity (∼7X diesel) and poor cold flow properties were measured for the TGB containing 90% canola-
triglyceride and 10% regular unleaded gasoline (TGB1). These properties will likely affect engine performance and reliability in colder temperatures. The lower heating value (LHV) of TGBs is lower than diesel. The LHV will vary with the percent gasoline in the blend, but for TGB1, the LHV was approximately 9% lower than that of diesel.
The metal content of TGBs is generally higher than diesel. Although this is a concern for catalysts in after-treatment systems, it could be addressed by adding additional triglyceride processing steps. Engines running on TGBs produced higher levels of NO but lower levels of CO and PM compared to diesel. Emissions of NO increased by less than 5% and PM decreased by less than 10%. Injection timing could be adjusted to shift emission back closer to diesel levels.
Figure 10. Emissions at 100% load 1700 rpm as percentage diesel for the John Deere 4.5 l Tier 2 engine.
Figure 11. Emissions at 80% load 2200 rpm as percentage diesel for the John Deere 4.5 l Tier 2 engine.
30(4): 523-534 533
ACKNOWLEDGMENTS This work was funded by the Colorado Department of
Agriculture and the US Department of Agriculture. The authors would like to thank Kirk Evans, Engineering Manager at the Engines & Energy Conversion Laboratory, for his key contribution to the test program. The authors would like to acknowledge the cooperation of Joel Lundquist, Hal Holder and Rick Young in Rocky Ford, CO who are the principal managers of The Big Squeeze, LLC crushing facility. Additionally, the Lower Arkansas Valley Water Conservancy District has supported the work by funding the cropping of oilseed variety trials.
REFERENCES European Commission. (1998). Directive 97/68/EC of the European
Parliament and of the Council of 16 December 1997 on the approximation of the laws of the Member States relating to measures against the emission of gaseous and particulate pollutants from internal combustion...etc. Official Journal of the European Communities, L 59, 1-86.
Allen, C. A. W., Watts, K. C., Ackman, R. G., & Pegg, M. J. (1999). Predicting the viscosity of biodiesel fuels from their fatty acid ester composition. Fuel, 78(11), 1319-1326. doi:http://dx.doi.org/10.1016/S0016-2361(99)00059-9
Baker, H. W., & Sweigert, R. L. (1947). A comparison of various vegetable oils as fuels for compression ignition engines. ASME Oil and Gas Power Meeting (pp. 1-5). New York, N.Y.: American Society of Mechanical Engineers.
Bartoli, Y., Lyford-Pike, E., Lucke, J., Khalek, I., Feist, M. D., & McCormick, R. L. (2010). 1000-hour durability evaluation of a prototype 2007 diesel engine with aftertreatment using B20 biodiesel fuel. SAE Intl. J. of Fuels and Lubricants, 2(2), 290-304.
Bezergianni, S., Kalogianni, A., & Dimitriadis, A. (2012). Catalyst evaluation for waste cooking oil hydroprocessing. Fuel, 93(March), 638-641. doi:http://dx.doi.org/10.1016/j.fuel.2011.08.053
Dorado, M. P., Arnal, J. M., Gómez, J., Gil, A., & López, F. J. (2002). The effect of a waste vegetable oil blend with diesel fuel on engine performance. Trans. ASAE, 45(3), 519-523. doi:http://dx.doi.org/10.13031/2013.8820
Drenth, A.C., Olsen, D.B., Cabot, P.E. & Johnson, J.J. (2014). Compression ignition engine performance and emission evaluation of industrial oilseed biofuel feedstocks camelina, carinata, and pennycress across three fuel pathways. Fuel, 136, 143-155. http://www.sciencedirect.com/science/article/pii/ S0016236114006991.
Faletti, J. J., Sorenson, S. C., & Goering, C. E. (1984). Energy release rates from hybrid fuels. Trans. ASAE, 27(2), 322-325. doi:http://dx.doi.org/10.13031/2013.32783
Fuls, J., Hawkins, C. S., & Hugo, F. J. (1984). Tractor engine performance on sunflower oil fuel. J. Agric. Eng. Res., 30, 29-35. doi:http://dx.doi.org/10.1016/S0021-8634(84)80003-7
Goering, C. E., Schwab, A. W., Campion, R. M., & Pryde, E. H. (1982). Evaluation of soybean oil-aqueous ethanol microemulsions for diesel engines. ASAE Proceedings of the International Conference of Plant and Vegetable Oils as Fuels. St. Joseph, Mich.: ASAE.
Johnson, J., Enjalbert, N., Schneekloth, J., Helm, A., Malhotra, R., & Coonrod, D. (2009). Completion Report No. 211: Development of oilseed crops for biodiesel production under colorado limited irrigation conditions. Fort Collins, Colo.: Colorado Water Institute.
Keske, C. M. H., Hoag, D. L., Brandess, A., & Johnson, J. J. (2013). Is it economically feasible for farmers to grow their own fuel? A study of Camelina sativa produced in the western United States as an on-farm biofuel. Biomass and Bioenergy, 54(July), 89-99. doi:http://dx.doi.org/10.1016/j.biombioe.2013.03.015
Knothe, G. (2005). Dependence of biodiesel fuel properties on the structure of fatty acid alkyl esters. Fuel Proc. Tech., 86(10), 1059-1070. doi:http://dx.doi.org/10.1016/j.fuproc.2004.11.002
Lambelet, P., Grandgirard, A., Gregoire, S., Juaneda, P., Sebedio, J., & Bertoli, C. (2003). Formation of modified fatty acids and oxyphytosterols during refining of low eurcic acid rapeseed oil. J. of Agric. and Food Chem., 51(15), 4284-4290. doi:http://dx.doi.org/10.1021/jf030091u
Figure 12. Percentage comparison of TGB1 to diesel for ISO weighted average NOx and PM emissions for the John Deere 4.5 l Tier 3 engine.

534 APPLIED ENGINEERING IN AGRICULTURE
Lapuerta, M., Rodríguez-Fernández, J., Agudelo, J. R., & Boehman, A. L. (2013). Blending scenarios for soybean oil derived biofuels with conventional diesel. Biomass and Bioenergy, 49(0), 74-85. doi:http://dx.doi.org/10.1016/j.biombioe.2012.12.002
Miers, S. A., Kastengren, A. L., El-Hannouny, E. M., & Longman, D. E. (2007). An experimental investigation of biodiesel injection characteristics using a light-duty diesel injector. Proc. 2007 ASME Internal Combustion Engine Division Fall Technical Conference. Charleston, S.C.: ICEF.
Mueller, C., Boehman, A., & Martin, G. (2009). An experimental investigation of the origin of increased nox emissions when fueling a heavy-duty compression-ignition engine with soy biodiesel. SAE Intl. J. of Fuels and Lubricants, 2(1), 789-816.
Muktibodh, A. S. (2009). Effect of fuel additives on performance and emissions of industrial diesel engines. Unpublished M.S. Thesis. Fort Collins, Colo.: Colorado State University, Department of Mechanical Engineering.
Paulsen, H. M., Wichmann, V., Schuemann, U., & Richter, B. (2011). Use of straight vegetable oil mixtures of rape and camelina as on farm fuels in agriculture. Biomass and Bioenergy, 35(9), 4015-4024. doi:http://dx.doi.org/10.1016/j.biombioe.2011.06.031
Peng, Y., & Boehman, A. L. (2012). An investigation of the impact of injection strategy and biodiesel on engine nox and particulate matter emissions with a common-rail turbocharged di diesel engine. Fuel, 97(0), 476-488.
Peterson, C. L., Wagner, G. L., & Auld, D. L. (1983). Vegetable oil substitutes for diesel fuel. Trans. ASAE, 26(2), 322-327. doi:http://dx.doi.org/10.13031/2013.33929
Shonnard, D. R., Williams, L., & Kalnesc, T. N. (2010). Camelina-derived jet fuel and diesel: Sustainable advanced biofuels. Environ. Progress & Sustainable Energy, 29(3), 382-392. doi:http://dx.doi.org/10.1002/ep.10461
Skalsky, S. A., Jacobs, J. J., Menkhaus, D. J., & Stevens, W. B. (2008). Impact of fuel and nitrogen prices on profitability of Selected crops: A case study. Agron. J., 100(4), 1161-1165. doi:http://dx.doi.org/10.2134/agronj2007.0094
Srivastava, A., & Prasad, R. (2000). Triglycerides-based diesel fuels. Renewable and Sustainable Energy Rev., 4(2), 111-133. doi:http://dx.doi.org/10.1016/S1364-0321(99)00013-1
Tan, P.-Q., Hu, Z. Y., & Lou, D.-M. (2009). Regulated and unregulated emissions from a light-duty diesel engine with different sulfur content fuels. Fuel, 88(6), 1086-1091. doi:http://dx.doi.org/10.1016/j.fuel.2008.11.031
Tasan, M., & Devirc, M. (2003). Trans FA in Sunflower oil at different steps of refining. J. American Oil Chemists' Soc., 80(8), 825-828. doi:http://dx.doi.org/10.1007/s11746-003-0779-9
Thornton, M. J., Alleman, T. L., Luecke, J., & McCormick, R. L. (2009). Impacts of biodiesel fuel blends oil dilution on light-duty diesel engine operation. Presented at the 2009 SAE International Powertrains, Fuels, and Lubricants Meeting. Florence, Italy: Conference Paper NREL/CP-540-44833.
United States Department of Energy. (2012). Biofuels Issues and Trends. Washington, D.C.: Energy Information Administration, U.S. Deptartment of Energy.
Uri, N. D., & Day, K. (1992). Energy efficiency, technological change and the dieselization of agriculture in the United States. Transportation Planning and Tech., 16(3), 221-231. doi:http://dx.doi.org/10.1080/03081069208717485
Ziejewski, M. (1983). Vegetable oils as a potential alternate fuel in DI diesel engines. SAE Paper No. 831359. Warrendale, Pa.: Society of Automotive Engineers. doi:http://dx.doi.org/10.4271/831359
Zubik, J., Sorenson, S. C., & Goering, C. E. (1984). Diesel engine combustion of sunflower oil fuels. Trans. ASAE, 27(5), 1252-1256. doi:http://dx.doi.org/10.13031/2013.32955