on-road emission performance of late model diesel and ...€¦ · on-road emission performance of...
TRANSCRIPT

1
No. B 2281
June 2017
On-Road Emission Performance of Late Model Diesel and Gasoline Vehicles as Measured by Remote Sensing
Åke Sjödin, Martin Jerksjö, Henrik Fallgren, Håkan Salberg, Rasmus Parsmo, Cecilia Hult, Mohammad-Reza Yahya, Tomas Wisell, Jenny Lindén

2
Author: Åke Sjödin, Martin Jerksjö, Henrik Fallgren, Håkan Salberg, Rasmus Parsmo, Cecilia Hult, Mohammad-Reza Yahya, Tomas Wisell, Jenny Lindén Funded by: Swedish Transport Administration, Swedish Environmental Protection Agency, Opus Group and the Foundation for IVL Swedish Environmental Research Institute Report number B2281 ISBN 978-91-88319-70-8 Edition Only available as PDF for individual printing © IVL Swedish Environmental Research Institute 2017 IVL Swedish Environmental Research Institute Ltd. P.O Box 210 60, S-100 31 Stockholm, Sweden Phone +46-(0)10-7886500 // www.ivl.se This report has been reviewed and approved in accordance with IVL's audited and approved management system.

3
Preface This research was funded by the Swedish Transport Administration, Opus Group, the Swedish Environmental Protection Agency and the Research Foundation of the Swedish Environmental Research Institute. Niranjan Vescio, Robert Gentala and Peter McClintock at Opus Inspection Technical Development Centre in Tuczon are deeply acknowledged for providing the new RSD 5000 instrument, including field training as well as long-distance support, and for careful treatment and evaluation of collected data. The Local Environmental Authority of the City of Gothenburg is acknowledged for providing and operating the mobile air quality monitoring station, including the provision of quality assured monitoring data.

4
Table of contents
Summary ................................................................................................................................ 5
Sammanfattning..................................................................................................................... 6
1 Introduction .................................................................................................................... 7
2 Methods and scope ...................................................................................................... 10
2.1 Remote sensing measurements ...................................................................................................... 10 2.2 Kerbside air quality measurements ................................................................................................. 11 2.3 Measurement sites .......................................................................................................................... 11
2.3.1 Gullbergsmotet ....................................................................................................................... 12 2.3.2 Gibraltargatan ......................................................................................................................... 13
3 Results ........................................................................................................................... 14
3.1 Remote sensing measurements ...................................................................................................... 14 3.1.1 Overview ................................................................................................................................. 14 3.1.2 Emissions by Euro standard .................................................................................................... 15 3.1.3 Impact of ambient temperature on NOX emissions from Euro 4, 5 and 6 diesel cars ............ 23 3.1.4 NOX emissions from Euro 5 and 6 diesel passenger cars by make/model .............................. 25
3.2 Street canyon air quality measurements combined with dispersion modelling and remote sensing measurements ....................................................................................................... 35
3.2.1 Overview ................................................................................................................................. 35 3.2.2 Simulated vs measured air pollutant street canyon concentrations ...................................... 38 3.2.3 HBEFA emission factors vs emission factors measured by remote sensing for diesel cars .... 42
4 Conclusions ................................................................................................................... 44
5 References .................................................................................................................... 45

5
Summary A newly developed remote sensing instrument with NO2 and NOX measurement capability was operated in the fall of 2016 over 19 workdays in Gothenburg, Sweden, to measure real driving emissions from a large number light- and heavy-duty vehicles. From more than 30,000 registered vehicle passages, a final QA/QC-reviewed dataset consisting of about 15,000 paired records containing emissions, driving condition and detailed vehicle information data, was used to evaluate the real-world emission performance of in particular Euro 5 and Euro 6 diesel vehicles. More than 9,000 records were of diesel vehicles, of which about 5,500 were of Euro 5 vehicles and about 2,600 of Euro 6 vehicles. The following conclusions were made from the evaluation:
- Measurements on more than 6,000 diesel passenger cars reveal that the real driving emissions of NOX from Euro 6 diesel cars on average have been reduced by about 60% from pre-Euro 6 levels, e.g. Euro 5. This may be considered a major breakthrough, since the real-world NOX emissions from diesel passenger cars have been virtually unchanged between Euro 2 and Euro 5, although the NOX emission standard has been significantly lowered from Euro 2 to Euro 5. Still, Euro 6 diesel passenger car real-world NOX emissions are roughly more than 5 times higher than the Euro 6 standard, as well as than the measured average on-road NOX emissions from Euro 6 gasoline passenger cars.
- For NOX emissions, an almost identical pattern as for diesel passenger cars was observed for both diesel light-duty commercial vehicles and diesel heavy-duty vehicles (trucks and buses), i.e. virtually no change in real-world emissions between Euro 2 and Euro 5, followed by a major drop in emissions for Euro 6.
- Primary NO2 emissions from diesel light-duty vehicles (both PC and LCV) have been reduced from Euro 4 through Euro 6, implying that the emission ratio of NO2 to NOX has also been reduced, but the ratio is still as high as about 25% for both Euro 5 and Euro 6 (compared to about 15% for Euro 2). The opposite pattern exists for heavy-duty vehicles, for which the NO2/NOX-ratio increased from about 10% for Euro 4-5 to ≈35% for Euro 6.
- For all categories of diesel vehicles, real-world PM emissions have dropped steadily from Euro 2 through Euro 6 – reductions are in the order of 90% for Euro 6 compared to Euro 2.
- For Euro 4, 5 and 6 diesel passenger cars, real-world emissions of both NOX and NO2 increase with decreasing ambient air temperature. The temperature dependence appears to be strongest for Euro 5 cars. At 25-30 degrees C average Euro 5 NOX on-road emissions are around 15 g/kg fuel burned, rising to 20-25 g/kg fuel burned at around 10 degrees C.
- Large differences in the on-road NOX emission performance were observed between different makes, models, as well as individual vehicles among Euro 5 and Euro 6 diesel passenger cars.
- For the first time, remote sensing measurements were combined with air quality measurements and dispersion calculations in an urban street canyon. Calculated average concentrations of NO2, NOX and PM based on HBEFA 3.2 were comparable with corresponding measured concentrations, but the discrepancy increased with increasing concentrations, with calculated concentrations being lower than measured. The latest version of the HBEFA emission model (version 3.3), launched in May 2017, provided a good match with the remote sensing measurements for both NOX and NO2 as well as exhaust PM, but at the same time tended to lead to an overestimation of street canyon concentrations of NO2 and NOX in dispersion calculations carried out in this study.

6
1 Sammanfattning Ett nyutvecklat ”remote sensing”-instrument, med funktionalitet för mätning av NO2 och NOX, användes under sammanlagt 19 dagar under hösten 2016 i Göteborg i syfte att samla in stora mängder utsläppsdata för lätta och tunga fordon i verklig trafik. Från mer än 30 000 registrerade fordonspassager utsorterades ett slutligt kvalitetssäkrat dataset om ca 15 000 parade poster, med information om utsläpp, körförhållanden, fordonsdata (från bilregistret) m fl i sammanhanget relevanta parametrar, vilket utnyttjades för att utvärdera diesel- och bensindrivna fordons verkliga emissionsprestanda, i synnerhet fordon svarande mot emissionskraven för Euro 5 och Euro 6. Mer än 9 000 poster var dieselfordon, varav ca 5 500 svarade mot kraven för Euro 5 och ca 2 600 mot kraven för Euro 6. Följande slutsatser kan dras från utvärderingen:
- Mätningar på mer än 6 000 dieseldrivna personbilar visar att NOX-utsläppen från bilar certifierade för den senaste avgasstandarden Euro 6 i verklig trafik i genomsnitt har minskat med ca 60 % jämfört med bilar certifierade för Euro 5. Detta kan ses som ett stort genombrott, eftersom NOX-utsläppen från dieseldrivna personbilar i verklig trafik praktiskt taget varit oförändrade - trots att utsläppskraven skärpts kraftigt - mellan Euro 2 och Euro 5. Trots den observerade minskningen är utsläppen från Euro 6-dieselbilar omkring fem gånger högre än vad Euro 6-standarden anger.
- Beträffande de verkliga NOx-utsläppen, är mönstret för dieseldrivna personbilar och för båda lätta diesellastbilar och tunga dieselfordon (lastbilar och bussar) nästan identiskt, det vill säga praktiskt taget ingen förändring av utsläppen i verklig trafik från och med Euro 2 till och med Euro 5, men en betydande minskning i Euro 6-klassade fordon.
- Direktemissionen av NO2 från lätta dieselfordon (både personbilar och lätta lastbilar) har minskat från Euro 4 till Euro 6, vilket medför att även utsläppskvoten NO2/NOX har sjunkit, men kvoten är fortfarande så hög som ca 25 % för både Euro 5- och Euro 6-fordon (jämfört med ca 15 % för Euro 2-fordon). Det motsatta förhållandet gäller för tunga dieselfordon, där NO2/NOX-kvoten ökat från ca 10 % för Euro 4 och 5 till ca 35% för Euro 6.
- För alla kategorier av dieselfordon har utsläppen av partiklar under verklig körning minskat stadigt från Euro 2 till Euro 6 i takt med de skärpta utsläppskraven - utsläppsminskningen är i storleksordningen 90 % för Euro 6 jämfört med Euro 2.
- För dieseldrivna personbilar svarande mot Euro 4, 5 och 6 ökar utsläppen av både NOX och NO2 med sjunkande omgivningstemperatur. Temperaturberoendet förefallar vara starkast för Euro 5. Vid +25-30 grader är utsläppen från en genomsnittlig Euro 5 dieselbil omkring 15 g NOX/kg bränsle, och stiger till 20-25 g NOX/kg bränsle vid cirka +10 grader.
- Stora skillnader i de verkliga utsläppen av NOX från dieseldrivna personbilar svarande mot kraven för Euro 5 och Euro 6 diesel personbilar kan observeras mellan såväl olika fabrikat som olika bilmodeller av samma fabrikat samt mellan enskilda fordonsindivider.
- För första gången har remote sensing-mätningar kombinerats med luftkvalitetsmätningar och spridningsberäkningar i ett gaturum. Beräknade genomsnittliga halter av NO2, NOX och PM baserade på HBEFA 3.2 stämde relativt väl överens med motsvarande uppmätta halter, men överensstämmelsen var sämre vid högre halter, då beräknade halter var lägre än uppmätta. Remote sensing-mätningarna kan användas för att validera emissions-faktorer som används som indata till spridningsberäkningarna. Den senaste versionen av emissionsmodellen HBEFA, lanserad i maj 2017, visade en bra överensstämmelse med remote sensing-mätningarna för såväl NOX och NO2 som avgaspartiklar, men tenderade samtidigt att leda till en överskattning NOX- och NO2-halterna i spridningsberäkningarna.

7
2 Introduction The high relevance of measuring vehicle emissions where they actually occur, i.e. on the road, has been strongly highlighted in recent years, not least as a consequence of the perhaps most flagrant example known as “dieselgate”, first revealed in 2014 in the US by co-workers at the West Virginia University (Thompson et al., 2014). The disclosure of car manufacturers using defeat devices on late model diesel passenger cars (i.e. corresponding to the EU emission standard Euro 5) to escape through the official emission test with regard to the NOX emission limit, was made by means of on-board emission measurements (PEMS). However, even before that, on-road emission measurements by means of remote sensing devices (RSD), had shown that NOX emissions from both light- and heavy-duty diesel vehicles in Europe, designed to meet the more stringent standards Euro 4 and 5, were having much higher emissions than expected from the corresponding standards, whereas in the case of gasoline light-duty vehicles, the real-world emissions of all regulated pollutants have decreased steadily along with the introduction of gradually stricter standards (De la Fuente et al., 2016; Rushton et al., 2016; Bishop & Stedman, 2015; Chen & Borken-Kleefeld, 2014; Carslaw et al., 2011; Sjödin & Jerksjö, 2008).
PEMS and remote sensing are two completely different approaches to measure real driving emissions. Whereas PEMS measures emissions in large detail over a whole driving cycle or a route, remote sensing provides merely a snapshot (< 1s) of a vehicle’s emissions. The main advantage of remote sensing over PEMS is that thousands of vehicles’ emissions can be measured in one day with one instrument, whereas using a PEMS instrument restricts the number of vehicles measured in one day to only one or a few. Thus, as a screening tool for on-road/real-driving emissions, e.g. for identifying suspected high-emitters, remote sensing offers a very cost-effective approach.
Whereas remote sensing has been used quite extensively in the US during the last decade in state-operated inspection and maintenance (I/M) programs (see e.g. http://opusinspection.com/remote-sensing-device-technology/remote-sensing-programs/; www.deq.virginia.gov/programs/; http://aircarecolorado.com/index.php/rapidscreen/), it has not been used at all for such purposes in Europe. The remote sensing component in US I/M programs has served the purpose of targeting high-emitters (high-emitter screen) and/or screening out low-emitters (clean screen), and/or as an independent means of evaluating the overall efficiency of conventional I/M programs.
In Europe, emission testing in I/M programs is limited to low and high idle testing of tailpipe concentrations of CO and HC, primarily targeting gasoline cars, and an opacity smoke test for diesel cars at full throttle idling, i.e. no testing what so ever is made with the aim of controlling NOX emissions, and the tests cannot be claimed to represent emissions under real driving conditions. This can be considered a crucial limitation of the present European I/M programs, especially when considering the high fraction of diesels in the European light-duty vehicle fleet – ≈40% of the in-use fleet, ≈50% of new car sales (http://www.acea.be/statistics/), whereas in the US the fraction of diesel light-duty vehicles is very low – only around 3% (https://www.eia.gov/).
Another interesting application of remote sensing is for verification and/or for providing input to motor vehicle emission inventories and emission models, e.g. for international reporting obligations on air emissions as the UNFCCC, or as input to local and regional air quality modelling and other means of air quality assessments. For instance, data from ambient air quality measurements of NOX and NO2 at a large number of roadside and kerbside sites around London over the past 10 years were analysed together with data from a series of major remote sensing measurement campaigns covering hundreds of thousands of cars in the same area (Carslaw et al.,

8
2011; Carslaw et al., 2016). The remote sensing data for NOX and NO2 emissions from diesel light-duty vehicles in particular explains the unexpectedly slow decrease in ambient NOX and NO2 concentrations in the area over the past 10 years.
Ever since the remote sensing technology was invented by Professor Donald H. Stedman and his colleague Gary Bishop at the University of Denver (DU) in the late 1980’s (Bishop et al., 1989), it has undergone a major development, partly at DU, partly at Envirotest, the company holding the global commercial rights to manufacture and sell instruments under the brand AccuScanTM, originating from the DU remote sensing instrument (commonly known as FEAT). Envirotest was purchased in 2014 by Swedish Opus (www.opus.se/en/). Whereas the first remote sensing instrument only measured CO and CO2, the most recent version of the AccuScanTM RSD 5000 instrument, launched in 2016, is capable of measuring in addition also NOX (NO and NO2 separately), HC, NH3, smoke (opacity – a measure of particulate matter), speed and acceleration, along with a multitude of parameters that are relevant for evaluating real driving emissions.
The first remote sensing measurements in Sweden were conducted by IVL in 1991, a few years after that three-way catalysts became mandatory on all new gasoline passenger cars (Sjödin, 1994). Ever since, a large number of remote sensing studies have been carried out in Sweden (Sjödin & Lenner, 1995; Sjödin et al., 1996; Sjödin et al., 1997; Sjödin & Andreasson, 2000; Ekström et al., 2004; Ekström et al., 2005;). In the 1990’s and early 2000’s these studies were largely focussing on gasoline vehicles, since in the past the Swedish passenger car fleet was totally dominated by gasoline vehicles. However, this situation has changed drastically during the last decade, so that today the shares of gasoline and diesel passenger cars in the Swedish fleet are almost equal. As can be seen by Figure 1.1, the share of diesels is projected to continue increasing for the next two decades to come. Thus, more lately there has been an increasing interest of measuring diesel vehicle on-road emissions in general (Sjödin & Jerksjö, 2008; Hallquist et al., 2012; Jerksjö, 2016), in particular after the disclosure of “dieselgate” and due to the boost in the sales of diesel vehicles in Sweden and in other European countries exhibiting the same trends.
Figure 1.1 Fuel consumption (in ktonnes) by diesel and gasoline vehicles in Sweden 1990-2035 (Yahya, 2017). Data for 2017-2035 are projections.
0
1 000
2 000
3 000
4 000
5 000
6 000
7 000
1990 1995 2000 2005 2010 2015 2020 2025 2030 2035
All gasoline vehicles
PC diesel
LCV diesel
HCV diesel
Bus diesel

9
The overall objective of the present project was to evaluate the potential of large-scale roadside measurements of real-world emissions on an individual vehicle level by means of a new generation remote sensing instrument launched by Opus in 2016 (AccuScan RSD 5000 with NO2 capability), with a particular focus on nitrogen oxides (NO/NO2/NOX) from diesel passenger cars.
More specific objectives of the project were to:
- Derive emissions trends by Euro class for diesel and gasoline passenger cars, and for light- and heavy-duty commercial vehicles (trucks and buses), when data allows.
- Analyse and compare the on-road emissions, in particular NOX, from different makes and models of diesel cars, corresponding to emission standards Euro 5 and 6.
- Identify particularly high-emitting vehicles.
- Contribute with data, results and experiences from Sweden to the common European work on road vehicle emissions within ERMES in general, and within the newly established ERMES working group on remote sensing in particular (www.ermes-group.eu).
- Evaluate how remote sensing could be applied more broadly for effective monitoring of the regulatory environment within the field of road vehicle emissions, for providing input to emission models, and the implications for urban and street canyon air quality dispersion modelling.

10
3 Methods and scope
3.1 Remote sensing measurements The new AccuScan RSD 5000 instrument with NO2 capability, see Figure 2.1, was leased by IVL from Opus Inspection in Tuczon, AZ, during a three months period in late summer-fall 2016 (September through November).
Figure 2.1 The new Opus AccuScan RSD 5000 instrument with NO2 capability in operation in a city street in Gothenburg in September 2016. Pictures are copyright Opus.
The new instrument builds on its predecessor AccuScan RSD 5000, which measures NO but not NO2. Tailpipe concentrations of CO, HC, NO, NO2 and PM (measured by the RSD 5000 as opacity or smoke density) are derived from each pollutant’s measured ratio to CO2 and are corrected for both water vapour and any excess air in the exhaust. Two parallel beams of IR and UV light are emitted from the Source/Detector Module (SDM) at tailpipe level and traverse each passing vehicle’s exhaust plume, hitting a reflecting mirror at the opposite side of the road. The two beams are reflected back across the road - once again traversing the vehicle’s exhaust plume - to hit the detector of the SDM. The returning light is analysed spectrophotometrically by the detector unit to derive the light absorbance at various wavelengths representing the five measured gaseous pollutants. The measured light absorbances can be converted to pollutant concentrations across the light beam path, then be converted to pollutant to CO2 ratios, and finally to concentrations of each of the measured species in the undiluted exhaust. Theses conversions are feasible by calibrating the detector by means of both fixed gas cells and calibration gas cylinders, both containing known concentrations of the five measured gaseous pollutants. From the measured pollutant to CO2 ratios and the fuel combustion equation emissions in gram pollutant per kg or litre of fuel burned can be derived. The instrument measures the emissions from each passing vehicle in less than one second.
In addition to air pollutant emissions the RSD 5000 measures also parameters such as vehicle speed and acceleration and ambient air temperature. Furthermore, by means of a video camera and/or an automatic license plate recognition system, an image of the license plate of each passing vehicle is stored by the instrument (cf. Figure 2.2), enabling retrieving detailed vehicle information, such as make, model, fuel type, Euro standard, model year, etc., from national vehicle registers.

11
Figure 2.2 Image of the rear of the vehicle and the license plate as stored in the RSD 5000 instrument.
3.2 Kerbside air quality measurements The mobile air quality monitoring station was provided by the local environmental authority of the city of Gothenburg. It contained instruments for continuous monitoring of ambient air concentrations of NO/NO2/NOX, PM2.5 and black carbon (BC), and of ambient temperature, wind speed and wind direction. All parameters, except for black carbon, were measured and stored with a time resolution of 1 minute, whereas BC was measured with a time resolution of 1 hour.
For the NOx measurements an EcoPhysics CLD 700 AL chemiluminescence instrument was used. The PM2.5 fraction was measured with a Rupprecht & Pataschnik TEOM 1400a instrument. For BC an AethalometerTM Model AE33 (http://www.mageesci.com/) was used, measuring light absorption by suspended aerosol particles at seven wavelengths, from 370 nm (UV) to 950 nm (IR). This instrument can distinguish between BC of biogenic origin from that of anthropogenic origin, i.e. in diesel exhaust.
3.3 Measurement sites Two main sites were selected for the measurements – Gullbergsmotet and Gibraltargatan. Remote sensing measurements were also carried out at four additional sites1 in Gothenburg, and the data achieved from these measurements were included in the overall analysis, however, since the number of data points collected at each of these four sites was rather small, no detailed site descriptions are given here.
1 The four additional sites were Aschebergsgatan at Kapellplatsen opposite to the IVL office building (977 records), Aschebergsgatan outside the main entrance of Chalmers University of Technology (two nearby sites with 1264 and 1739 records, respectively) and Fabriksgatan close to the E6 freeway off-ramp/on-ramp in the district of Gårda (1148 records).
12
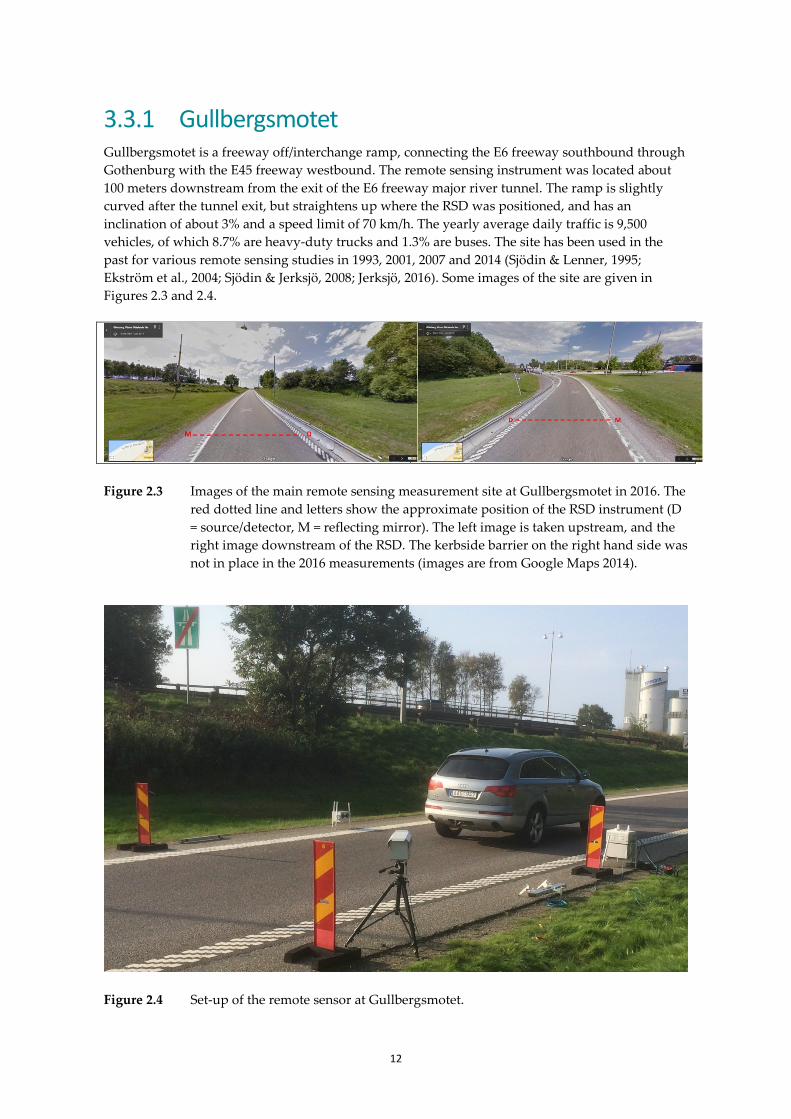
3.3.1 Gullbergsmotet Gullbergsmotet is a freeway off/interchange ramp, connecting the E6 freeway southbound through Gothenburg with the E45 freeway westbound. The remote sensing instrument was located about 100 meters downstream from the exit of the E6 freeway major river tunnel. The ramp is slightly curved after the tunnel exit, but straightens up where the RSD was positioned, and has an inclination of about 3% and a speed limit of 70 km/h. The yearly average daily traffic is 9,500 vehicles, of which 8.7% are heavy-duty trucks and 1.3% are buses. The site has been used in the past for various remote sensing studies in 1993, 2001, 2007 and 2014 (Sjödin & Lenner, 1995; Ekström et al., 2004; Sjödin & Jerksjö, 2008; Jerksjö, 2016). Some images of the site are given in Figures 2.3 and 2.4.
Figure 2.3 Images of the main remote sensing measurement site at Gullbergsmotet in 2016. The
red dotted line and letters show the approximate position of the RSD instrument (D = source/detector, M = reflecting mirror). The left image is taken upstream, and the right image downstream of the RSD. The kerbside barrier on the right hand side was not in place in the 2016 measurements (images are from Google Maps 2014).
Figure 2.4 Set-up of the remote sensor at Gullbergsmotet.
13
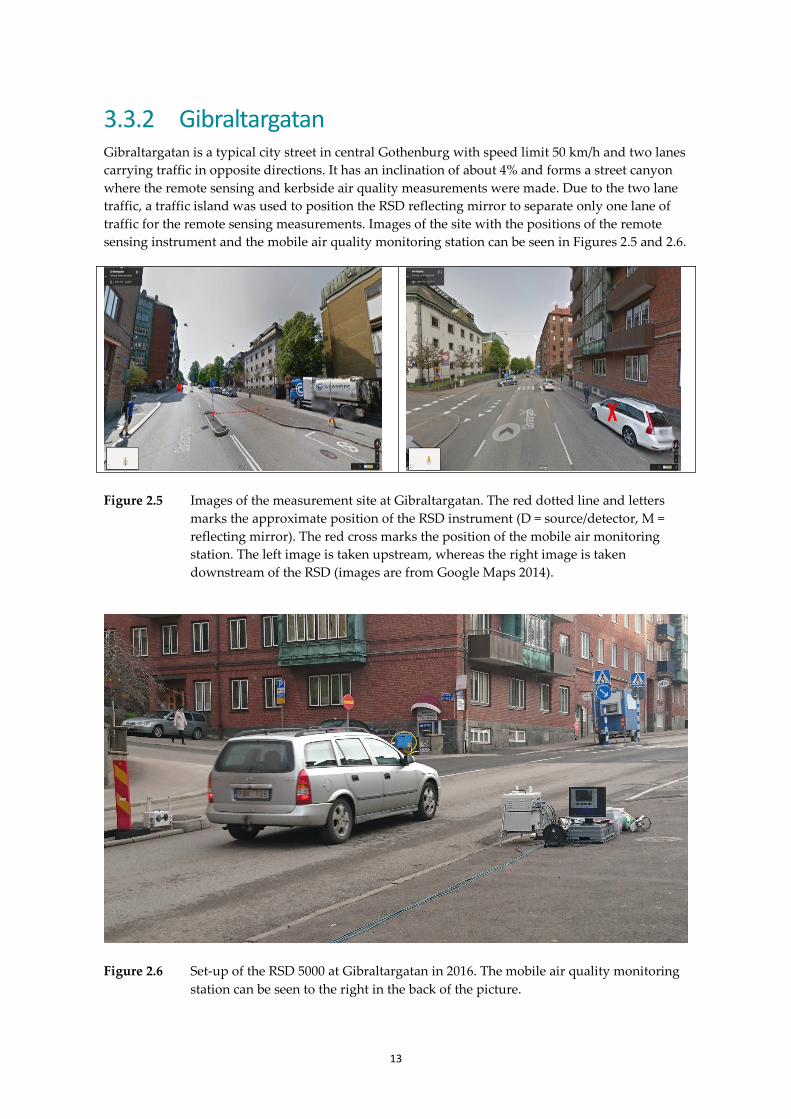
3.3.2 Gibraltargatan Gibraltargatan is a typical city street in central Gothenburg with speed limit 50 km/h and two lanes carrying traffic in opposite directions. It has an inclination of about 4% and forms a street canyon where the remote sensing and kerbside air quality measurements were made. Due to the two lane traffic, a traffic island was used to position the RSD reflecting mirror to separate only one lane of traffic for the remote sensing measurements. Images of the site with the positions of the remote sensing instrument and the mobile air quality monitoring station can be seen in Figures 2.5 and 2.6.
Figure 2.5 Images of the measurement site at Gibraltargatan. The red dotted line and letters
marks the approximate position of the RSD instrument (D = source/detector, M = reflecting mirror). The red cross marks the position of the mobile air monitoring station. The left image is taken upstream, whereas the right image is taken downstream of the RSD (images are from Google Maps 2014).
Figure 2.6 Set-up of the RSD 5000 at Gibraltargatan in 2016. The mobile air quality monitoring
station can be seen to the right in the back of the picture.

14
4 Results
4.1 Remote sensing measurements
4.1.1 Overview Remote sensing measurements were carried out during the period August 30 – November 25. In all, measurements were carried out on 19 workdays, of which ten days at Gullbergsmotet, five days at Gibraltargatan, and one day at each at the four additional sites.
A summary of the measurements is provided in Table 3.1. A total of almost 35,000 vehicle passages were registered by the remote sensing instrument during the whole measurement period. The percentage of valid readings ranged from 73% (HC) to 98% (smoke). For 78% of the passages a valid license plate number could be identified. For both NO and NO2 the fraction of valid readings was around 93%, but for deriving emission factors for NOX in g per kg fuel the share boiled down to around 50% after a thorough QA/QC review of the data. The number of NOX emission factors that could be connected to detailed vehicle information (vehicle make and model, Euro standard, model year, etc.) finally ended up in ≈15,500 records. The distribution of these data by vehicle category, fuel and Euro standard is presented in Table 3.2.
Table 3.1 Overview of the remote sensing measurements carried out in Gothenburg in 2016.
Table 3.2 Distribution by vehicle category, fuel/technology and Euro standard for the ≈15,500 remote sensing records with valid NOX emission factors in g/kg fuel.
CO2 CO HC NO NO2 Smoke S/AGullbergsmotet 24 342 23 312 17 775 17 538 22 961 22 590 24 015 21 490 11 878 18 460 10 771Gibraltargatan 5 200 4 865 3 953 3 396 4 651 4 678 4 934 4 248 2 165 4 356 2 159Additional sites 5 401 5 227 4 630 4 552 5 182 5 135 5 374 4 290 2 728 4 538 2 575Total 34 943 33 404 26 358 25 486 32 794 32 403 34 323 30 028 16 771 27 354 15 505
Site # Derived EFs for NOX in g/kg fuel
# NOX EFs with vehicle info
# Valid RSD readings # Valid license plates
# Passages
Euro 0 Euro 1 Euro 2 Euro 3 Euro 4 Euro 5 Euro 6 allgasoline 19 65 543 281 2 059 1 041 672 4 680diesel - 3 10 56 429 3 476 2 243 6 217bifuel CNG - - - - 21 73 9 103gasoline hybrid - - - 12 50 120 145 327diesel hybrid - - - - - 15 6 21flexifuel E85 - - - 3 467 162 146 778all 19 68 553 352 3 026 4 887 3 221 12 126gasoline 3 - 11 5 30 15 3 67diesel 1 19 134 427 1 965 224 2 770flexifuel E85 - - - - 35 125 44 204all 4 - 30 139 492 2 105 271 3 041diesel - - 1 12 34 85 78 210other - - - - - 3 - 3all - - 1 12 34 88 78 213
Buses diesel - - - 1 1 8 66 76
Vehicle category
Fuel/ technology
Euro standard
PC
LCV
HDV

15
4.1.2 Emissions by Euro standard Emission factors in grams of pollutant per kg fuel burned were derived from the remote sensing measurements of the concentration ratios of pollutant to CO2 and the fuel combustion equation.
4.1.2.1 Passenger cars In Figure 3.1 measured average g/kg fuel emission factors for NOX, NO and NO2 by Euro standard are presented for gasoline and diesel passenger cars. The pattern for Euro 2 through Euro 5 emissions is the same as observed in several earlier studies in Europe (e.g. De la Fuente et al., 2016; Rushton et al., 2016; Chen & Borken-Kleefeld, 2014; Carslaw et al., 2011), showing a steady decrease in NOx emissions from gasoline cars, resulting in very low emissions for Euro 5 and 6, while virtually no change between Euro 2 and Euro 5 is observed for diesel cars. The Gothenburg 2016 study is one of the first major remote sensing studies of NOX (NO and NO2) emissions from Euro 6 diesel passenger cars presented, involving measurements on more than 2,000 Euro 6 cars. There is a substantial drop in on-road NOX emissions from the pre-Euro 6 levels of 15-20 g/kg to the Euro 6 level of about 8 g/kg, i.e. a reduction of about 60%, but still well above the emission standard.
Figure 3.1 Average NOX, NO and NO2 emissions (g/kg fuel) by Euro standard for gasoline and diesel passenger cars as measured by remote sensing in Gothenburg 2016. In the top figure (i.e. NOX emissions), the EU legislative emission limits are indicated by the dotted lines (red lines = diesel legislative emission limits, green lines = gasoline legislative emission limits), based on NEDC fuel consumption data for diesel and gasoline passenger cars by Euro class according to Hausberger (2010) for conversion from g/km emissions to g/kg fuel emissions. Error bars are 95% confidence intervals.

16
It is worth noting that, although the 60% reduction in average NOX emissions from pre-Euro 6 (Euro 2 through Euro 5) to Euro 6 for diesel cars may appear large, the legislative NOX emission limit was reduced by more than 80% from Euro 2 to Euro 6.
As can be seen by Figure 3.1, the average emissions of NO2 from gasoline cars were virtually zero, i.e. below the detection limit of the remote sensing instrument, independent of Euro standard. For diesel cars the average NO2 emissions decreased from around 5 g/kg fuel for pre-Euro 6 cars to about 2 g/kg fuel for Euro 6 cars. The average NO2/NOX-ratio by Euro standard for diesel cars is shown in Figure 3.2. From a rather sharp increase from Euro 2 (15-20%) to Euro 4 (≈35%), the NO2/NOX-ratio decreases to around 25% for both Euro 5 and Euro 6.
Figure 3.2 Measured average NO2/NOX-ratios in the exhaust from diesel passenger cars by Euro standard.
Emission distributions (percentile distributions) for NOX for Euro 4 through Euro 6 diesel passenger cars are presented in Figure 3.3 (measurements on Euro 2 and Euro 3 diesel cars were too few to give meaningful distributions). The NOX emission distributions for Euro 4, 5 and 6 diesel passenger cars are typically skewed, i.e. a few high-emitting cars have very high emissions. The maximum emissions measured for each Euro class are given in Table 3.3. These are extremely high values, particularly for Euro 4 and Euro 5 cars. They appear to be associated with lower ambient temperatures (cf. chapter 3.1.3) rather than with vehicle specific power (VSP). The PC diesel NOX emission distributions and high-emitter fractions are analysed in more detail chapter 3.1.4, with regard to e.g. specific makes and models of cars, and the influence of ambient temperature and VSP. Table 3.3 Max NOX emissions (in g kg/fuel) measured for each Euro class of diesel cars.
Euro class Max NOX emission (g/kg fuel) Euro 2 47.9 Euro 3 48.4 Euro 4 135.9 Euro 5 140.5 Euro 6 90.3

17
Figure 3.3 Percentile distributions for NOX emissions (g/kg fuel) for Euro 4, 5 and 6 diesel passenger cars.
Average NOX, NO and NO2 emissions by model year were also derived for gasoline and diesel passenger cars from the remote sensing measurements. The results are presented in Figure 3.4. For diesel cars a strong decrease in emissions from model year 2013 and continuously through model years 2014, 2015 and 2016 is observed. This trend is mainly explained by the increasing share of Euro 6 and the mirrored decreasing share of Euro 5 cars from model year 2013 through model year 2016, see Table 3.4.
Table 3.4 Share of Euro 5 and Euro 6 among new diesel cars sold in Sweden of model years 2013 to 2016.
Model year 2013 2014 2015 2016 PC D Euro-5 94.8% 74.3% 18.8% 0.7% PC D Euro-6 5.2% 25.7% 81.2% 99.3%

18
Figure 3.4 Average NOX, NO and NO2 emissions (in g/kg fuel) by model year for gasoline and diesel passenger cars.
In Figures 3.5 and 3.6 average emissions of PM, HC and CO by Euro standard for gasoline and diesel passenger cars according to the remote sensing measurements in Gothenburg in 2016 are presented. The most striking observation is the strong reduction in diesel cars’ PM emissions between Euro 2 and Euro 5 - 6. For Euro 5 and 6, the PM emissions are at the same (low) level as for gasoline cars.
For both HC and CO, emissions from both gasoline and diesel cars have decreased from Euro 2 to Euro 6, and are at the same (low) level for Euro 6.

19
Figure 3.5 Average PM emissions (in g/kg fuel) by Euro standard for gasoline and diesel passenger cars as measured by means of remote sensing in Gothenburg in 2016. The EU legislative emission limits for diesel cars are indicated by the red dotted lines, based on NEDC fuel consumption data for diesel and gasoline passenger cars by Euro class according to Hausberger (2010) for conversion from g/km emissions to g/kg fuel emissions. Error bars represent 95% confidence intervals.
Figure 3.6 Average HC and CO emissions (in g/kg fuel) by Euro standard for gasoline and diesel passenger cars as measured by remote sensing in Gothenburg in 2016. Error bars represent 95% confidence intervals.
20
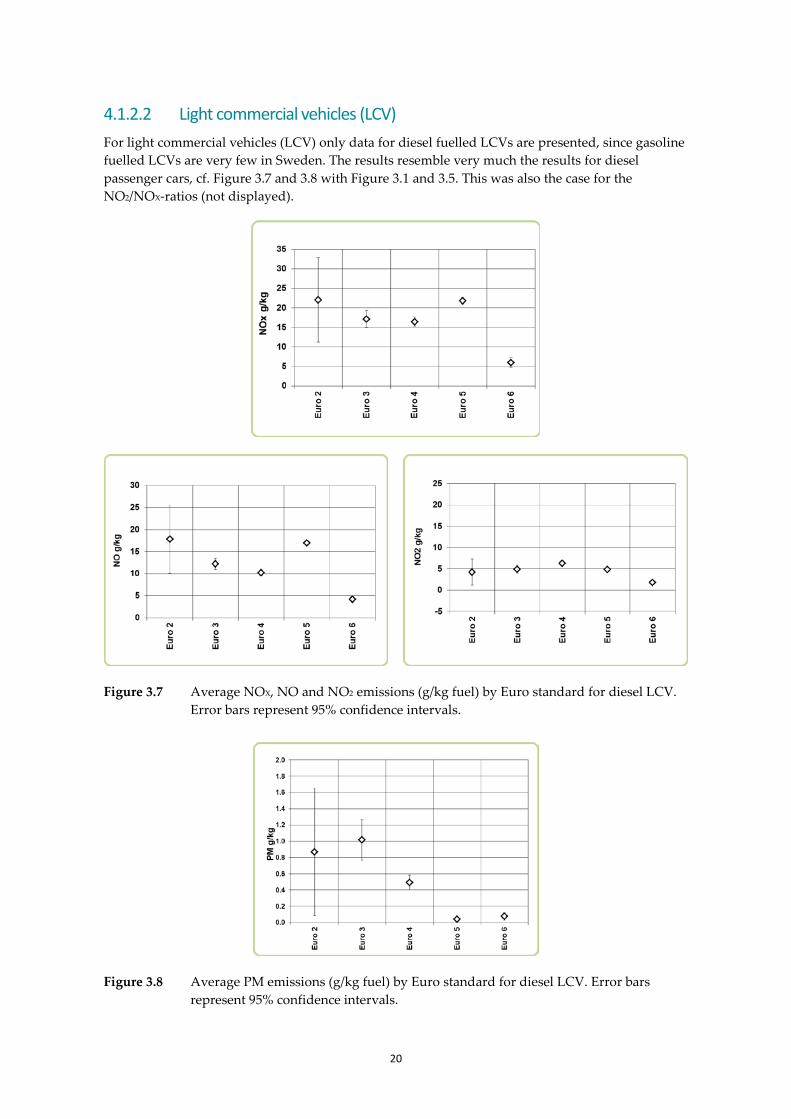
4.1.2.2 Light commercial vehicles (LCV) For light commercial vehicles (LCV) only data for diesel fuelled LCVs are presented, since gasoline fuelled LCVs are very few in Sweden. The results resemble very much the results for diesel passenger cars, cf. Figure 3.7 and 3.8 with Figure 3.1 and 3.5. This was also the case for the NO2/NOX-ratios (not displayed).
Figure 3.7 Average NOX, NO and NO2 emissions (g/kg fuel) by Euro standard for diesel LCV. Error bars represent 95% confidence intervals.
Figure 3.8 Average PM emissions (g/kg fuel) by Euro standard for diesel LCV. Error bars represent 95% confidence intervals.

21
There are three weight classes of LCV within the EU legislation: <1305 kg (N1:I), 1305-1760 kg (N1:II) and >1760 kg (N1:III), respectively. The N1:I category is very rare in Sweden. The most common category is N1:III, but N1:II vehicles are also well represented in the Swedish fleet. In Figure 3.9 the average NOX and PM emissions by Euro standard are compared for these two categories. The only significant difference between the two is for NOX Euro 6 emissions, for which the N1:II category emissions are about 40% lower than the N1:III category, while their respective emission standards in the EU regulation only differ by 16%.
Figure 3.9 Average emissions (in g/kg fuel) of NOX (left) and PM (right) by Euro standard for the two predominant weight classes of diesel LCV in the Swedish fleet (1305-1760 kg and >1760 kg, respectively). Error bars represent 95% confidence intervals.
4.1.2.3 Heavy-duty vehicles Average NOX emissions for heavy-duty vehicles, i.e. trucks with mass exceeding 3.5 tonnes, as measured by remote sensing in Gothenburg in 2016, are presented in Figure 3.10. As for light-duty diesel vehicles there is virtually no difference between pre-Euro 6 emissions, while with Euro 6 the average on-road emission level is reduced drastically, i.e. by around 80%. The NO2/NOX-fraction more than three-doubled from the Euro 4 and 5 levels to Euro 6, reaching a value of ≈35%.
Figure 3.10 Average NOX emissions (g/kg fuel) by Euro standard for diesel heavy-duty vehicles (trucks with mass exceeding 3.5 tonnes) as measured by means of remote sensing in Gothenburg in 2016. The relative evolution from Euro 3 through Euro 6 of the EU legislative emission limits for diesel heavy-duty vehicles, with Euro 3 as index, is indicated by the red dotted lines. Note: Only one Euro 2 vehicle was measured.
22
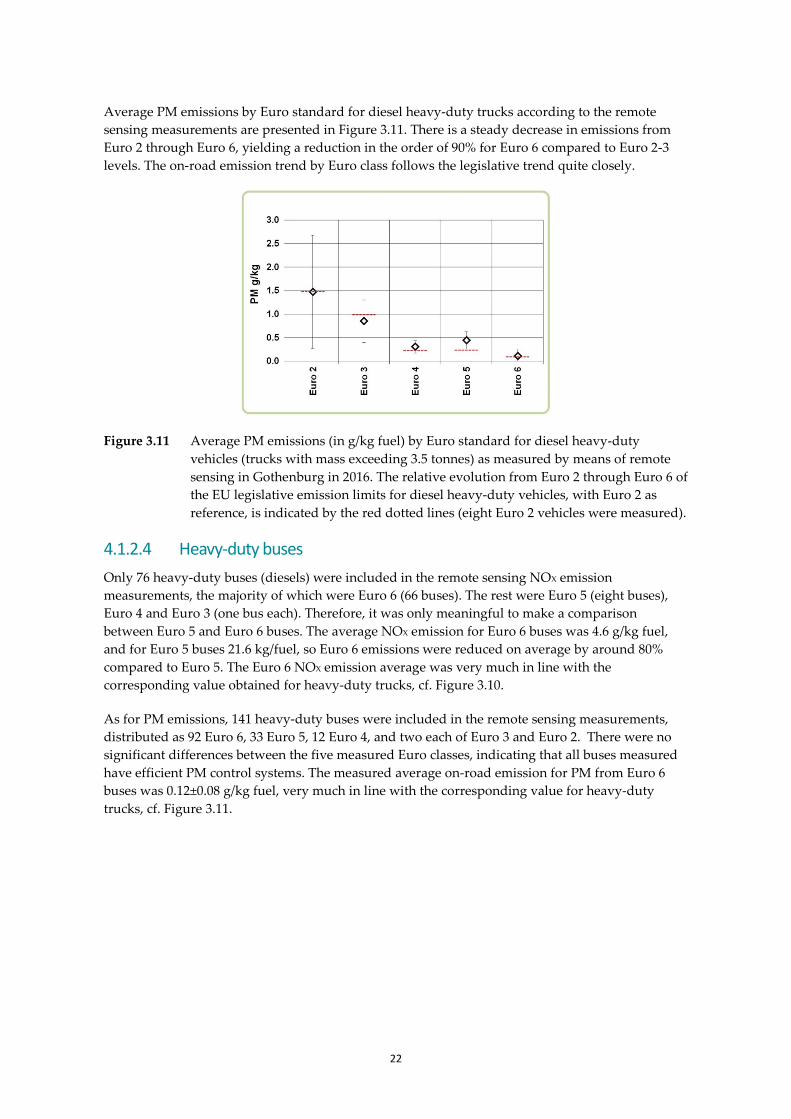
Average PM emissions by Euro standard for diesel heavy-duty trucks according to the remote sensing measurements are presented in Figure 3.11. There is a steady decrease in emissions from Euro 2 through Euro 6, yielding a reduction in the order of 90% for Euro 6 compared to Euro 2-3 levels. The on-road emission trend by Euro class follows the legislative trend quite closely.
Figure 3.11 Average PM emissions (in g/kg fuel) by Euro standard for diesel heavy-duty vehicles (trucks with mass exceeding 3.5 tonnes) as measured by means of remote sensing in Gothenburg in 2016. The relative evolution from Euro 2 through Euro 6 of the EU legislative emission limits for diesel heavy-duty vehicles, with Euro 2 as reference, is indicated by the red dotted lines (eight Euro 2 vehicles were measured).
4.1.2.4 Heavy-duty buses Only 76 heavy-duty buses (diesels) were included in the remote sensing NOX emission measurements, the majority of which were Euro 6 (66 buses). The rest were Euro 5 (eight buses), Euro 4 and Euro 3 (one bus each). Therefore, it was only meaningful to make a comparison between Euro 5 and Euro 6 buses. The average NOX emission for Euro 6 buses was 4.6 g/kg fuel, and for Euro 5 buses 21.6 kg/fuel, so Euro 6 emissions were reduced on average by around 80% compared to Euro 5. The Euro 6 NOX emission average was very much in line with the corresponding value obtained for heavy-duty trucks, cf. Figure 3.10.
As for PM emissions, 141 heavy-duty buses were included in the remote sensing measurements, distributed as 92 Euro 6, 33 Euro 5, 12 Euro 4, and two each of Euro 3 and Euro 2. There were no significant differences between the five measured Euro classes, indicating that all buses measured have efficient PM control systems. The measured average on-road emission for PM from Euro 6 buses was 0.12±0.08 g/kg fuel, very much in line with the corresponding value for heavy-duty trucks, cf. Figure 3.11.

23
4.1.3 Impact of ambient temperature on NOX emissions from Euro 4, 5 and 6 diesel cars
The remote sensing measurements in Gothenburg in 2016 covered a wide temperature range: The lowest temperature recorded during the measurements was around 7 degrees Celsius, whereas the highest was slightly above 30 degrees Celsius. Thus, this enabled an investigation of the impact of ambient temperature on the NOX emissions from diesel passenger cars equipped with more advanced emission control systems, i.e. corresponding to cars meeting Euro 4, 5 and 6 emission standards. The results are presented in Figure 3.12.
Figure 3.12 Average NOX (top) and NO2 (bottom) emissions (in g/kg fuel) for diesel passenger cars meeting Euro 4, 5 and 6 emission standards vs ambient temperature (Celcius).
0
5
10
15
20
25
30
5 10 15 20 25 30
NO
x em
issi
on (g
/kg
fuel
)
Ambient air temperature (degrees C)
Euro 4
Euro 5
Euro 6
0
2
4
6
8
10
5 10 15 20 25 30
NO
2 em
issi
on (g
/kg
fuel
)
Ambient air temperature (degrees C)
Euro 4
Euro 5
Euro 6

24
It is clear from Figure 3.12 that there is a dependence of both NOX and primary NO2 emissions with ambient temperature for all three Euro classes. The strongest dependence appears to be for Euro 5 (followed by Euro 4 and then Euro 6), ranging from the lowest value at about 15 g NOX and 4 g NO2 at 25-30 degrees C, to the highest at about 25 g NOX and 6 g NO2 per kg fuel burnt at temperatures around 10 degrees C.
Another interesting observation is that there is no clear temperature dependence of the NO2/NOx-ratio for Euro 4 and 5 diesel cars, whereas for Euro 6 the ratio clearly increases with decreasing temperature, cf. Figure 3.13.
Figure 3.13 Average NOX emissions (in g/kg fuel) for diesel passenger cars meeting the Euro 5 and Euro 6 emission standards vs ambient temperature (in degrees Celsius). The dotted lines are linear regression lines.
0%
10%
20%
30%
40%
5 10 15 20 25 30
NO
2/N
Ox-
ratio
(%)
Ambient air temperature (degrees C)
Euro 4
Euro 5
Euro 6

25
4.1.4 NOX emissions from Euro 5 and 6 diesel passenger cars by make/model
Measured average NOX emissions from Euro 5 and Euro 6 diesel passenger cars by make are presented in Figures 3.14 and 3.15, respectively.
Figure 3.14 Average NOX emissions (in g/kg fuel) for Euro 5 diesel passenger cars by make.
Error bars (in red) represent the 95% confidence interval.
Figure 3.15 Average NOX emissions (in g/kg fuel) for Euro 6 diesel passenger cars by make.
Error bars (in red) represent the 95% confidence interval.
26
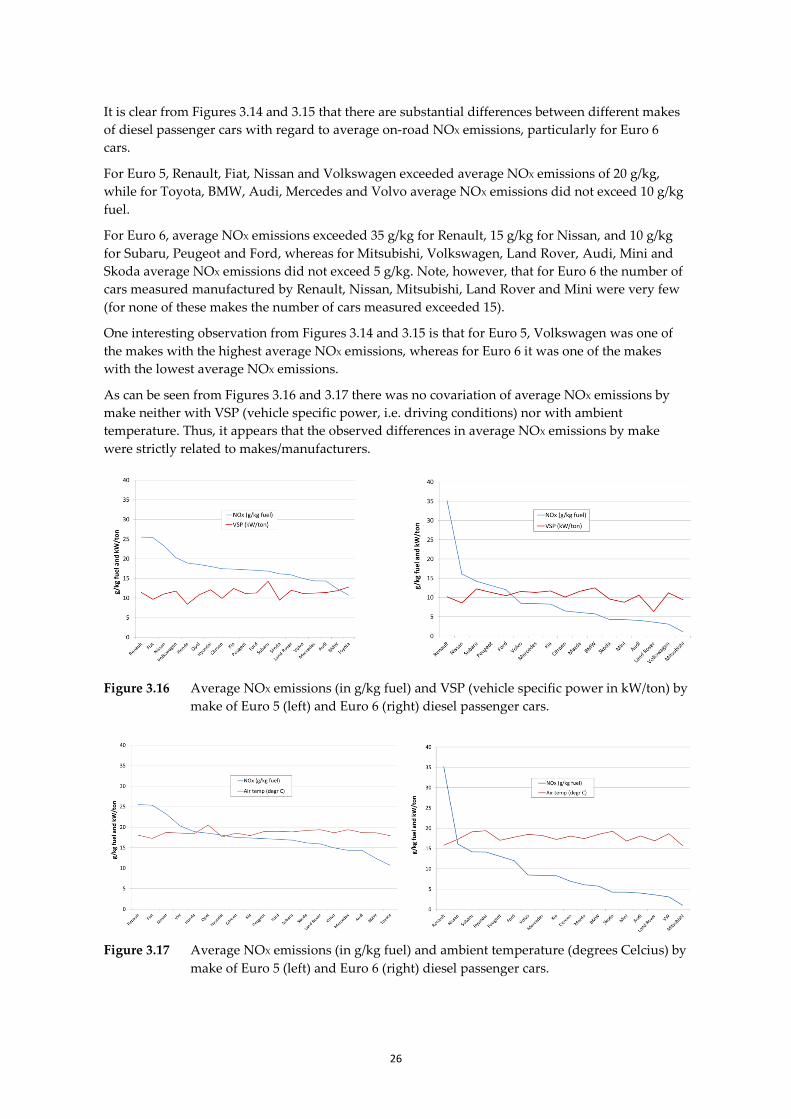
It is clear from Figures 3.14 and 3.15 that there are substantial differences between different makes of diesel passenger cars with regard to average on-road NOX emissions, particularly for Euro 6 cars.
For Euro 5, Renault, Fiat, Nissan and Volkswagen exceeded average NOX emissions of 20 g/kg, while for Toyota, BMW, Audi, Mercedes and Volvo average NOX emissions did not exceed 10 g/kg fuel.
For Euro 6, average NOX emissions exceeded 35 g/kg for Renault, 15 g/kg for Nissan, and 10 g/kg for Subaru, Peugeot and Ford, whereas for Mitsubishi, Volkswagen, Land Rover, Audi, Mini and Skoda average NOX emissions did not exceed 5 g/kg. Note, however, that for Euro 6 the number of cars measured manufactured by Renault, Nissan, Mitsubishi, Land Rover and Mini were very few (for none of these makes the number of cars measured exceeded 15).
One interesting observation from Figures 3.14 and 3.15 is that for Euro 5, Volkswagen was one of the makes with the highest average NOX emissions, whereas for Euro 6 it was one of the makes with the lowest average NOX emissions.
As can be seen from Figures 3.16 and 3.17 there was no covariation of average NOX emissions by make neither with VSP (vehicle specific power, i.e. driving conditions) nor with ambient temperature. Thus, it appears that the observed differences in average NOX emissions by make were strictly related to makes/manufacturers.
Figure 3.16 Average NOX emissions (in g/kg fuel) and VSP (vehicle specific power in kW/ton) by make of Euro 5 (left) and Euro 6 (right) diesel passenger cars.
Figure 3.17 Average NOX emissions (in g/kg fuel) and ambient temperature (degrees Celcius) by
make of Euro 5 (left) and Euro 6 (right) diesel passenger cars.

27
Figure 3.18 and 3.19 present the percentile distributions for the measured NOX emissions for the five largest makes of Euro 5 and 6 diesel passenger cars, respectively, in this study. The emission distributions are typically skewed, i.e. for both Euro 5 and Euro 6, a small share of cars have very high emissions – the higher the average emissions the more skewed are the emissions distributions.
Figure 3.18 Percentile distributions for NOX emissions (g/kg fuel) for the five largest makes of Euro 5 diesel passenger cars.
Figure 3.19 Percentile distributions for NOX emissions (g/kg fuel) for the five largest makes of Euro 6 diesel passenger cars.

28
Detailed information (i.e. make, model, model year, engine displacement volume, VSP and on-site ambient air temperature by the time of the measurement) for the top high-emitting Euro 5 and Euro 6 diesel cars are presented in Table 3.6 and 3.7, respectively. The cars displayed in the tables are those exceeding an arbitrary chosen cut-point of 50 g NOX/kg for Euro 5 and 35 g NOX/kg for Euro 6, respectively.
The worst high-emitting Euro 5 diesel cars emitted well above 100 g NOX/kg fuel, whereas the worst Euro 6 high-emitters emitted up to 90 g NOX/kg fuel.
A number of interesting observations can be made from Tables 3.6 and 3.7.
For Euro 5 diesel cars, eight out of the ten highest emitting cars (80%) and 18 out of the 50 highest emitting cars (36%) were measured at ambient air temperatures below 10 degrees C, whereas only 14% of all the measurements comprising Euro 5 and Euro 6 diesel cars were carried out at temperatures below 10 degrees. This demonstrates the strong influence of ambient air temperature on Euro 5 diesel cars’ NOX emissions, and may be the main explanation to the observations of the average diesel Euro 5 NOX emission dependence of temperature presented in chapter 3.1.3.
Similar observations, although not as pronounced as for Euro 5, can be made for high-emitting Euro 6 diesel cars: 50% of the ten highest emitting cars, and 23% of the 52 highest emitting cars were measured at ambient temperature below or just closely above 10 degrees C.
The covariation of VSP with very high NOX emissions was not as obvious as for ambient temperature. The results are summarised in Table 3.5.
The difference between the average ambient air temperature at which the high-emitting cars and at which all the cars were measured, was 4.0 degrees for Euro 5 cars and 1.7 degrees for Euro 6 cars. For both Euro 5 and Euro 6 these differences were significant on a 95% confidence level.
The difference between the average VSP at which the high-emitting cars and at which all of the cars were measured, was statistically significant for Euro 6 cars (6.4 kW/ton or 56% higher for the high-emitters), but not for Euro 5 cars (2.9 kW/ton or 26% higher for the high-emitters).
Table 3.5 Average VSP and ambient temperature for high-emitting Euro 5 and Euro 6 diesel passenger cars (from Tables 3.6 and 3.7) and for all measured cars Euro 5 and 6 diesel cars. Errors correspond to a 95% confidence interval.
Car category VSP (kW/ton)
Ambient temperature (degrees C)
Number of measurements (N)
Euro 5 high-emitters 14.2±3.7 15.0±1.4 50
Euro 5 all cars 11.3±0.3 19.0±0.2 3074
Euro 6 high-emitters 17.7±3.5 16.9±1.6 52
Euro 6 all cars 11.3±0.3 18.6±0.2 2263

29
Table 3.6 Euro 5 diesel passenger cars with measured NOX emissions exceeding 50 g/kg fuel, ranked by NOX emissions.
Make ModelModel
yearEngine displ
(cm3)NOx emission
(g/kg)VSP
(kW/t)Temp
(degr C)
Mercedes E 300 Bluetec Hybrid 2012 2143 140.5 11.4 9.60Volkswagen Caddy 2014 1598 117.7 14.1 10.12Renault Megane 2010 1461 101.2 14.0 9.94Volkswagen Caddy 2015 1598 97.9 17.6 9.59Volvo V40 2013 1560 95.6 13.1 9.90Volvo V60 2013 2400 89.4 40.9 9.74Kia Sportage 2010 1685 88.2 8.0 9.96Honda CR-V 2012 2199 87.6 2.5 9.70Skoda Superb 2013 1968 84.9 11.7 9.78Ford Transit 2016 2198 75.5 19.4 21.1Mercedes E 250 2010 2143 72.4 15.1 9.8Citroen C4 2011 1560 71.9 14.3 10.01Citroen C4 2014 1560 70.1 21.1 9.8Kia Sorento 2010 2199 69.3 8.0 19.7Volkswagen Golf 2011 1598 64.0 4.4 19.7Honda CR-V 2013 2199 63.5 21.1 20.9Volkswagen Golf 2014 1598 62.9 22.7 9.8Volvo V70 2013 1560 62.5 17.4 21.3Lancia Voyager 2011 2776 62.4 18.3 9.8Mercedes E 300 Bluetec Hybrid 2013 2143 62.2 35.9 21.7Citroen C3 2015 1560 62.0 14.4 9.8Fiat Freemont 2014 1956 61.8 2.7 9.6Volvo V40 2012 1560 59.7 29.7 20.6Renault Megane Scenic 2013 1461 59.5 1.7 19.7Renault Megane 2013 1461 57.0 20.2 20.4Volkswagen Passat 2011 1968 57.0 23.2 21.4Renault Megane 2012 1461 56.8 16.4 14.2Volkswagen CC 2014 1968 56.7 11.4 20.7Citroen C5 2011 1560 56.7 18.1 12.2Volvo S60 2010 1984 56.5 24.9 23.0Volkswagen Golf 2011 1598 55.4 7.4 21.4BMW 520 2010 1995 54.6 -43.1 9.7Hyundai i30 2012 1582 54.4 11.9 9.5Renault Megane 2011 1461 54.0 8.0 21.4Volvo V50 2011 1984 54.0 24.0 14.2Volvo V40 Cross Country 2015 1560 53.8 19.1 12.8Dacia Duster 2013 1461 53.8 19.7 10.2Volkswagen Tiguan 2013 1968 53.7 39.6 20.3Volvo V70 2014 1560 52.8 27.5 19.9Peugeot 308 2013 1560 52.6 21.2 14.3Volvo V70 2013 2400 52.3 15.9 9.8Mercedes E 300 Bluetec Hybrid 2013 2143 51.9 8.1 22.9Nissan X-Trail 2014 1598 51.8 12.4 22.6Hyundai i40 2011 1685 51.6 3.6 14.4Volvo S40 2011 1560 51.3 -26.5 19.8Renault Megane Scenic 2011 1461 51.3 14.6 13.4Renault Megane 2013 1461 51.2 4.8 15.3Mercedes 639/2 V-Klasse 2014 2143 50.5 17.8 22.2Volkswagen Passat 2013 1968 50.5 21.5 13.3Volvo V60 2013 1560 50.3 6.2 9.8

30
Table 3.7 Euro 6 diesel passenger cars with measured NOX emissions exceeding 35 g/kg fuel, ranked by NOX emissions.
Make ModelModel
yearEngine displ
(cm3)NOx emission
(g/kg)VSP
(kW/t)Temp
(degr C)
Volvo V70 2015 1969 90.3 33.1 10.1Renault Kadjar 2016 1461 84.4 18.4 10.0Volvo XC70 2015 2400 84.3 8.8 21.6Renault Trafic 2016 1598 68.4 5.5 9.7BMW 520D 2015 1995 68.2 5.3 21.7Subaru Legacy 2015 1998 66.4 18.2 21.3Peugeot Partner 2015 1560 62.5 32.3 10.1Peugeot Partner 2016 1560 60.7 2.0 10.1Mercedes A 220 D 2015 2143 58.5 24.7 13.2Volvo V60 Cross Country 2016 2400 58.4 3.5 9.0Volvo XC70 2014 1969 57.9 13.0 9.9Dacia Lodgy 2015 1461 56.0 8.2 19.9BMW 318D 2016 1995 55.6 4.2 21.8Renault Megane 2016 1461 54.3 -1.9 15.2Volvo XC60 2016 1969 53.4 12.1 23.0Volvo V70 2014 1969 52.8 26.5 9.9Volvo S80 2016 1969 52.6 19.2 22.1Nissan Qashqai 2015 1461 51.7 -7.4 14.1Ford C-Max 2016 1499 51.0 15.5 13.6Volvo V70 2016 1969 50.6 5.6 12.1Volvo XC60 2014 1969 49.7 -1.9 14.3Mercedes A 180 D 2016 1461 46.2 31.5 14.4Kia Sorento 2016 2199 44.7 30.7 15.2Volvo V60 Cross Country 2015 1969 44.2 26.7 14.5Mercedes B 180 CDI 2015 1461 44.2 12.2 23.9Volkswagen Polo 2014 1422 43.3 3.2 22.4Volvo V70 2015 2400 43.0 19.1 12.8Hyundai Santa Fe 2015 2199 42.7 0.7 20.2Volvo V70 2016 1969 42.6 6.7 10.1Volvo XC60 2015 1969 42.3 28.9 19.1Renault Master 2015 2299 41.9 15.1 26.9Volvo V70 2015 1969 41.4 45.9 21.8BMW 320D XDrive 2014 1995 41.4 26.0 10.0Volvo V70 2015 1969 41.1 52.5 9.8Mercedes B 180 CDI 2015 1461 41.0 4.5 14.5Honda CR-V 2016 1597 40.6 21.2 29.4Renault Kadjar 2015 1461 40.5 7.0 14.4Volvo V70 2015 1969 39.7 20.3 14.6Volvo V70 2014 1969 39.6 19.4 12.1Opel Insignia Sports Tourer S 2016 1956 38.5 26.7 23.6Volvo XC60 2015 2400 37.7 35.5 29.5Volvo S60 2015 1969 37.2 16.8 10.3Mercedes GLA 220 CDI 4Matic 2015 2143 37.0 30.8 20.8Mercedes GLA 220 CDI 4Matic 2015 2143 36.6 38.0 22.8Volvo V70 2015 1969 36.5 24.7 14.4Ford C-Max 2016 1499 36.5 3.2 21.5Volvo V70 2015 1969 36.4 25.6 20.4Volvo V70 2015 1969 36.2 9.7 14.9Volvo V40 2015 1969 36.1 32.2 29.6Volvo V60 2015 2400 36.0 12.6 14.1Volvo V70 2014 1969 35.2 20.2 21.6Volvo V40 Cross Country 2015 1969 35.1 26.5 14.3

31
Figure 3.20 displays the number fractions of the 20 largest makes of Euro 5 and Euro 6 diesel cars, making up about 99% of the fleet appearing in the Gothenburg 2016 remote sensing measurements. The measurements are clearly dominated by Volvo, which makes up about 40% of the fleet. Another 40-50% is made up of Volkswagen, Audi, BMW, Kia, Mercedes, Ford and the three french makes, followed by Skoda, the main japanese/korean makes, Opel, Fiat and Land Rover, making up the final 10% of the fleet.
Figure 3.20 Fractions of the 20 largest makes of Euro 5 and Euro 6 diesel cars in the Gothenburg
2016 remote sensing measurements.
In Figures 3.21 and 3.22 the shares of Euro 5 and Euro diesel 6 cars high-emitters (listed in Table 3.6 and Table 3.7, respectively) are compared with the corresponding fleet shares by make.
For Euro 5, 14 of the 20 largest makes were represented among the 50 high-emitting cars listed in Table 3.6. The six makes (of the 20 largest) that did not show up among the high-emitters were Audi, Land Rover, Mazda, Opel, Subaru and Toyota. Of these six makes only Audi had a significant share of the measured fleet (≈7%), in itself indicating that Audi Euro 5 diesels are relatively clean (see also Figure 3.13). Makes with significant fleet shares which were overrepresented among the high-emitters were (in descending order): Renault (by a factor of about 5), Mercedes, Citroen and Volkswagen. One particular observation is that the Mercedes model E300 Bluetec Hybrid, for which measurements were made on only five (5) unique vehicles, two (2) cars showed up among the high-emitters (one car appeared twice) – thus it was overrepresented by a factor of about 25 among the high-emitters. Makes with significant fleet shares which were underrepresented among the high-emitters were (in ascending order): BMW, Ford, Peugeot, Volvo, Kia and Skoda.
For Euro 6, 13 of the 20 largest makes were represented among the 50 high-emitting cars listed in Table 3.6. The seven makes (of the 20 largest) that did not show up among the high-emitters were Audi, Citroen, Fiat, Land Rover, Mazda, Skoda and Toyota, with only Audi having a significant fleet share, as for the Euro 5 diesel cars. Also for Euro 6, Renault was the make which was most overrepresented among the high-emitters. Note that Volkswagen is underrepresented for Euro 6.
0%
10%
20%
30%
40%
50%
Euro 5Euro 6

32
Figure 3.21 Share of diesel Euro 5 high-emitters (those listed in Table 3.6) compared with fleet
share by make. The number of high-emitters for each make is given within brackets.
Figure 3.22 Share of diesel Euro 6 high-emitters (those listed in Table 3.7) compared with fleet
share by make. The number of high-emitters for each make is given within brackets.
0%
10%
20%
30%
40%
Share of fleetShare of high-emitters
0%
10%
20%
30%
40%
50%
60%
Share of fleetShare of high-emitters

33
Only for Volvo - and to some extent also for Volkswagen – there were a sufficient number of cars measured to enable a more detailed analysis of differences between single models, expressed as model year and engine displacement volume.
The results presented for Volvo in Figure 3.23 show that the average NOX emissions are significantly higher (a factor of about two) for cars equipped with the Euro 5 1560 cm3 engine compared to cars equipped with the two larger Euro 5 engines (1984 and 2400 cm3, respectively) for model years 2012 through 2015. The NOX emissions of the 1560 cm3 engine increase between model year 2010 and 2012, and are unchanged after that. Only two engine sizes are available for Euro 6 (1969 and 2400 cm3), the NOX emissions of which are at the same level as the Euro 5 1984 and 2400 cm3 engines of model years 2013-2015, and lowest for model year 2016, for which the emission level is in the order of 4-8 g /kg fuel).
Figure 3.23 Average NOX emissions (in g/kg fuel) by model year for Volvo diesel cars with the three available Euro 5 (E5) engines (1560, 1984 and 2400 cm3, respectively) and the two available Euro 6 (E6) engines (1969 and 2400 cm3, respectively). Vertical lines are error bars corresponding to a confidence interval of 95%.
The two main diesel engine types in Volkswagen cars are the 1598 cm3 and the 1968 cm3 engines, respectively. The measured average NOX emissions for these two engines by Euro class (Euro 5 and Euro 6) and model year are presented in Figure 3.24. Since the data are rather scarce when they are dissolved by engine size, Euro class and model year, it’s hard to assess significant differences between e.g. engine type (size) and different model years. However, it is clear that for both engine types there is a substantial reduction in NOX emissions from Euro 5 to Euro 6 models. Actually, the real-world average NOX-emissions of the Euro 6 1968 cm3 engine are not far away from the (estimated) Euro 6 standard emission limit of about 1.1 g NOX/kg fuel.
0
5
10
15
20
25
30
35
2010 2011 2012 2013 2014 2015 2016
NO
x em
issi
on (g
/kg
fuel
)
Model year
1560 cm3 E5
1984 cm3 E5
2400 cm3 E5
1969 cm3 E6
2400 cm3 E6

34
Figure 3.24 Average NOX emissions (in g/kg fuel) by model year for Volkswagen diesel cars
with the two available Euro 5 (E5) and Euro 6 (E6) engines (1598 and 1968 cm3, respectively). Vertical lines are error bars corresponding to a confidence interval of 95%.
0
5
10
15
20
25
30
35
2010 2011 2012 2013 2014 2015 2016
NO
x em
issi
on (g
/kg
fuel
)
Model year
1598 cm3 E5
1968 cm3 E5
1598 cm3 E6
1968 cm3 E6

35
4.2 Street canyon air quality measurements combined with dispersion modelling and remote sensing measurements
4.2.1 Overview Street canyon air quality measurements at Gibraltargatan were carried out from November 9 until December 31. Remote sensing measurements near the air quality monitoring site were carried out during the period November 18 – November 25. The measured concentrations of NOX, NO2, PM2.5 and BC as hourly averages over the whole measurement period are presented in Figure 3.25, and the average diurnal variation of the air pollutant concentrations during that period in Figure 3.26.
Figure 3.25 Measured hourly average ambient air concentrations of NOX, NO2, PM2.5 and BC (in
μg/m3) the Gibraltargatan site November 9 – December 31 2016, with the period indicated during which remote sensing measurements were carried out at the site.
Figure 3.26 Average diurnal variation of air pollutant concentrations at Gibraltargatan.

36
The hourly averages of ambient air pollutants concentrations during the measurement period peaked at around 550 μg/m3 for NOX, 120 μg/m3 for NO2, and 30 μg/m3 for PM2.5. On average, the fossil fraction of BC made up about 5% of the PM2.5 concentration. The fossil fraction (i.e. from vehicle exhaust mainly) accounted on average for around 75% of the total BC measured.
The 98-percentile for the hourly NO2 concentration over the whole measurement period amounted to 87 μg/m3, which is close to the Swedish air quality guideline of 90 μg/m3.
Wind speeds during the measurement period were weak to moderate - hourly averages rarely exceeded 6 m/s. The air temperature during ranged from -4 to +8 degrees C.
The diurnal variation of NOX and NO2 concentration mirrored the diurnal variation of the traffic on Gibraltargatan, with typical peaks during morning and afternoon rush hours, as expected. This pattern was not as clear for PM2.5, which to a large extent consists of secondary formed particles, transported over longer distances. In particular the fossil fraction of BC showed a diurnal variation similar to that of NO2. The concentrations of both of these air pollutants are combinations of both, primary air pollutants emitted with vehicle exhaust (diesel) and secondary air pollutants formed in atmospheric reactions.
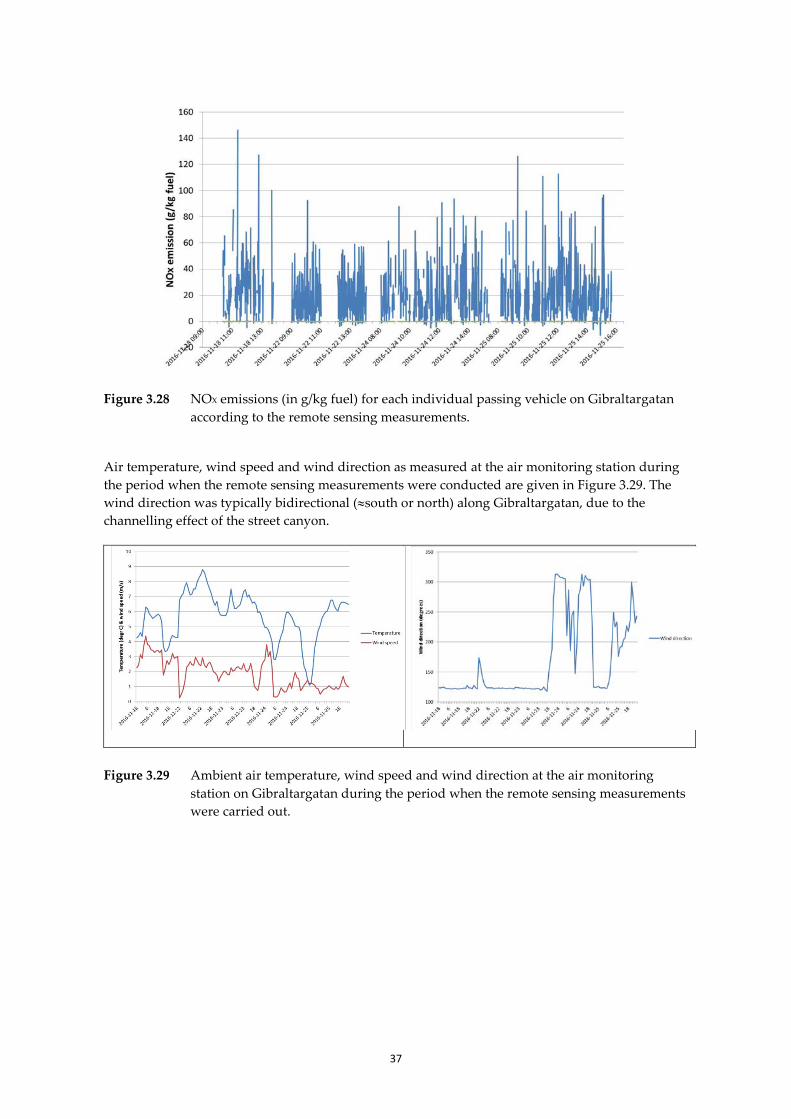
Remote sensing measurements were carried out at Gibraltargatan on five workdays: 18, 22, 23, 24 and 25 November, see Figure 3.27. The short daylight time period in this time of the year in Gothenburg enabled measurements to be conducted only from around 9 am until 4 pm. Instrumental problems shortened the measurement periods even further on particularly November 18 and 22. In all, 5 200 vehicle passages were registered with the remote sensor during the whole measurement campaign 18-25 November. Of these, 4 600 records had valid readings for NO, NO2 and PM, of which 4 000 vehicles’ license plate number were successfully identified, and thus for these detailed vehicle information such as fuel (e.g. diesel or gasoline), model year, Euro standard, make and model could be retrieved from the Swedish national vehicle register.
NOX emissions (in g/kg fuel) for each individual passing vehicle on Gibraltargatan according to the remote sensing measurements are displayed in Figure 3.28. These ranged from very low values near or around zero up to some extreme peaks exceeding 100 g NOX/kg fuel (roughly corresponding to ≈5 g NOX/km).
Figure 3.27 The discrete time periods when remote sensing measurements were carried out at
Gibraltargatan indicated in red in the NOX ambient air concentration vs time plot, retrieved from the mobile air quality monitoring station.
37
Figure 3.28 NOX emissions (in g/kg fuel) for each individual passing vehicle on Gibraltargatan
according to the remote sensing measurements.
Air temperature, wind speed and wind direction as measured at the air monitoring station during the period when the remote sensing measurements were conducted are given in Figure 3.29. The wind direction was typically bidirectional (≈south or north) along Gibraltargatan, due to the channelling effect of the street canyon.
Figure 3.29 Ambient air temperature, wind speed and wind direction at the air monitoring
station on Gibraltargatan during the period when the remote sensing measurements were carried out.

38
4.2.2 Simulated vs. measured air pollutant street canyon concentrations
The dispersion of emitted pollutants from the traffic on Gibraltargatan was simulated using the Computational Fluid Dynamic (CFD) model MISKAM (Microscale Climate and Dispersion Model, e.g. Goricsán et al., 2004, Lohmeyer et al., 2002). This three-dimensional model is at present one of the most sophisticated models available for calculation of dispersion of emitted pollutants at street level according to international standards. The model was developed at the Institute for Atmospheric Physics, Johannes-Gutenberg University in Mainz, Germany.
The model simulates a three-dimensional wind field throughout the calculation area and includes turbulence around buildings as well as traffic induced turbulence for a realistic representation of air flows in a complex urban terrain. This type of model is well suited for calculations within densely built urban areas where air pollution concentrations at ground level are of interest. Air pollution sources can be represented as point or line sources, and horizontal transport (advection), sedimentation and deposition are taken into account in the calculations.
In this study, the calculations were set up to represent an area of 220 x 350 m along the part of Gibraltargatan where both the air quality measurements and the remote sensing measurements were carried out, see Figure 3-30. Topography, buildings and roads were represented in the simulations, but vegetation was excluded.
Figure 3.30 Bird’s eye view of the Gibraltargatan section where the air quality and remote sensing measurements were carried out. The area selected for dispersion modelling is marked with a red rectangle, modelled traffic emissions are shown as line sources in black, and the monitoring locations with red crosses.

39
The simulated period was identical to the period during which air concentrations, wind and temperature were measured at the air monitoring station placed at Gibraltargatan. Data on wind speed/direction used in the simulations were collected at this station, which is optimal for simulating realistic dispersion patterns in the area. For modelling of traffic emissions in this study, emissions on Gibraltargatan were represented as two line sources in opposite directions; with a +4% and a -4% inclination, respectively. No other streets were included in the simulations, since the traffic on adjacent streets was negligible. Dispersion calculations were made for NO2 (no atmospheric formation of NO2 from NO was considered in the caclulations – only primary NO2 was considered), NOX and exhaust PM for two emission scenarios based on the HBEFA 3.2 model2:
• Scenario 1 (S1): Emission factors according to the HBEFA 3.2. standard traffic (fleet composition) scenario for Sweden for 2016 for this type of street (city street)
• Scenario 2 (S2): Emission factors according to HBEFA 3.2 for each individual vehicle identified, including measured speed, in the remote sensing measurements.
The resulting emissions of NO2, NOX and PM for Gibraltargatan are presented in Table 3.8.
Table 3.8 Emissions of NO2, NOX and PM (in g/m/day) from Gibraltargatan traffic derived from HBEFA 3.2 for the two scenarios applied in the dispersion calculations.
Uphill # +4%
S1 (g/m/day)
S2 (g/m/day)
NO2 0.79 0.80
NOX 3.76 3.64
PM 0.06 0.05
Downhill # -4%
NO2 0.33 0.31
NOX 1.80 1.59
PM 0.02 0.02
The calculated mean wind speeds and NO2, NOX and PM concentrations for the period is presented in Figure 3.31. The pollutant contribution from the traffic on Gibraltargatan to the nearest surroundings is very similar for the two scenarios and the small differences found reflect the small differences in emissions between the two scenarios presented in Table 3.8. At a height of 2 m, the contribution from traffic on Gibraltargatan to NO2 and NOX levels reaches approximately 50 m in on the side streets and vertically approximately 10 m.
In order to evaluate the accuracy of the simulations, simulated concentrations were compared with measured concentrations at the air monitoring station on Gibraltargatan. For this comparison, values from the six grid points closest to the location of the air monitoring station were considered. The overall mean, the 98th percentile for hourly means and the maximum simulated concentrations for these six grid points are presented together with the measured concentrations in Table 3.9. Note that the simulated values do not include background data, re-suspension of road dust or chemical reactions after emissions, and thus only represent the pollutant contribution from traffic emissions. This limits the possibilities for direct comparison with measured data. Data from the urban background monitoring station in the Gothenburg city center (Femman) was considered for compensation for the urban background, but concentrations at this station frequently exceeded the concentrations measured at Gibraltargatan, thus the conclusion was drawn that the Femman station was not representative as a background station for Gibraltargatan.
2 HBEFA 3.2 was used for the dispersion calculations, since the new HBEFA 3.3 was not yet launched at the time when most of the preparatory work for the dispersion calculations were carried out (early spring), see also chapter 4.2.3.

40
Figure 3.31 The average wind field (left) and contribution from traffic on Gibraltargatan to NO2, NOX and PM at a height of 2 m during the simulated period for scenario S1 and S2 (right).
Table 3.9 Simulated NO2 and NOX concentrations (μg/m3) for scenario 1 and 2 compared with measured concentrations at the Gibraltargatan mobile air quality monitoring station3 (corresponding data from the urban background monitoring station Femman located in the city center are presented as reference only, since it was not considered suitable to be used as a background station in this study).
NO2 NOX
Period mean
98th perc. 1h means
Max Period mean
98th perc. 1h means
Max
Simulated S1 5.9±0.9 17.4±2.8 20.3±3.8 29.7±4.5 86.9±14.2 101.3±19.1
Simulated S2 5.9±0.9 17.2±2.8 20.0±3.8 27.8±4.3 81.4±13.3 94.8±17.9
Measured Gibraltargatan 19.4±12.7 60.9 84.1 28.7±26.9 118.8 234.8
Measured Femman 20.0±15.1 60.5 112.6 28.1±39.7 153.8 485.3
3 Note that for the simulated data, the standard deviation represents the mean of the values achieved for the six grid points, while for the measured data the standard deviation represents all the hourly values measured included in the calculation of the means.

41
As can be seen in Table 3.9, the simulated NO2 concentrations are considerably lower than the measured concentrations, for the period mean, the 98th percentile of hourly means as well as the max concentration. This is likely caused by a combination of the exclusion of background concentration as well as the chemical conversion of NO to NO2 by the reaction with occurring background ozone, making this comparison difficult to evaluate. It can be noted that the relative increase in the 98th percentile for hourly means and the maximum value relative to the mean is similar for the simulated and measured concentrations.
In contrast, for NOX, the simulated mean concentration is very similar to the measured mean concentration. In this case, no effect of chemistry is expected, but naturally for an accurate comparison of simulated and measured concentrations the background contribution of NOX should be taken into account. This indicates that the dispersion model slightly or moderately overpredicts the mean NOX concentration at Gibraltargatan. However, it is interesting to note that for the 98th percentile for hourly means and the max hourly values, the measured concentrations are considerably higher than the simulated concentrations.
The simulated PM concentrations cannot be directly compared to the measured PM (PM2.5) concentrations, since HBEFA provides only exhaust PM, and both resuspension of road dust and contribution of background concentrations greatly exceed that of the directly emitted exhaust PM. The simulated PM concentrations were instead compared to the measured concentrations of black carbon (BC). No other sources of BC other than the local traffic were considered to contribute significantly to the measured concentrations of BC at Gibraltargatan, and it was further assumed that PM according to HBEFA comprises mainly BC, making a comparison of simulated PM with measured BC more relevant. To enable this comparison, additional simulations were set up to represent the shorter period of approximately 20 days during which BC was measured. The comparison is presented in Table 3.10, showing that, as for NOX, the simulations predicted the observed (measured) mean concentrations well, while the percentile and maximum values are greatly underestimated in the simulations.
Table 3.10 Simulated PM and measured black carbon (total BC and fossil fraction of BC, respectively) concentrations (μg/m3) at the monitoring station on Gibraltargatan.4
Mean 98th percentile for
hourly means Max
PM simulated S1 0.44±0.07 0.54±0.10 0.55±0.11
PM simulated S2 0.37±0.06 0.46±0.09 0.48±0.09
BC measured 0.48±0.43 1.9 2.4
BC fossil fraction measured 0.38±0.34 1.4 2.0
4 Note that, as in Table 3.9, for the simulated data the standard deviation represents the mean of the values achieved for the six grid points, while for the measured data the standard deviation represents all the hourly values measured included in the calculation of the means.

42
4.2.3 HBEFA emission factors vs emission factors measured by remote sensing for diesel cars
The original intention in this study was to use the emissions as measured directly by the remote sensing instrument as input to a third emission scenario for the dispersion calculations. However, it appeared that due to the occasionally rather large data loss in the remote sensing measurements at Gibraltargatan (emission and speed/acceleration data, as well as accurate identification of vehicles from license plate recognition), due to weather and light conditions as well as direct instrumental problems, this was not doable. Instead, the HBEFA emission factors for NOX, NO2 and exhaust PM used in the dispersion calculations for Scenario 2 were evaluated against the corresponding emission factors derived from the remote sensing measurements. The vehicles that were assumed to account for the predominant part of the overall NOX emissions emitted from the traffic on Gibraltargatan were assumed to be the diesel passengers driving uphill (southbound), i.e. those vehicles that were registered and measured by the remote instrument.
For each vehicle passage in the remote sensing measurements, individual vehicle specific emission factors were retrieved from HBEFA 3.2 as well as from the just recently launched (May 2017) updated version HBEFA 3.3, based on detailed vehicle information retrieved from the Swedish national vehicle register via the vehicles’ license plate numbers, and from the measurements of individual vehicle speed by the remote sensing instrument.
The comparison of emission factors derived from HBEFA and from the remote sensing measurements were made with emission factors expressed in the unit gram pollutant emitted per kg fuel burned, which is the unit provided directly from the remote sensing data. HBEFA emission factors expressed in g/kg fuel were derived by dividing HBEFA emission factors in g/km with HBEFA fuel consumption factors for each individual vehicle. The results of the comparisons are presented in Figures 3.32-3.34.
Figure 3.32 Comparison of diesel passenger cars’ (driving on Gibraltargatan) NOX emission factors derived from the remote sensing measurements and from HBEFA 3.2 and 3.3, respectively, as averages by Euro standard. Note that – as is also the case for Figures 3.33 and 3.34 – there were only one Euro 2 car and six Euro 3 cars in the measurements.
0
5
10
15
20
25
30
35
40
Euro 2(N=1)
Euro 3(N=6)
Euro 4(N=58)
Euro 5(N=492)
Euro 6(N=343)
g/kg
fuel
NOx RSD 5000
NOx HBEFA 3.2
NOx HBEFA 3.3

43
Figure 3.33 Comparison of diesel passenger cars’ (driving on Gibraltargatan) NO2 emission
factors derived from the remote sensing measurements and from HBEFA 3.2 and 3.3, respectively, as averages by Euro standard.
Figure 3.34 Comparison of diesel passenger cars’ (driving on Gibraltargatan) PM emission
factors derived from the remote sensing measurements and from HBEFA 3.2 and 3.3, respectively, as averages by Euro standard.
It can be seen from Figure 3.32 that for NOX, HBEFA 3.2 emission factors are considerably lower for Euro 4, 5 and 6 diesel cars compared to the emission factors derived from remote sensing, whereas the agreement between the recent HBEFA version 3.3 and remote sensing is good, with the exception of Euro 4, for which the HBEFA EF is rather much lower than the remote sensing EF.
The same pattern can be observed for NO2 (Figure 3.33), although the differences between HBEFA 3.2 and remote sensing are not as pronounced as for NOX. In HBEFA 3.3, NOX emissions for Euro 4, 5 and 6 diesel passenger cars have been updated to take into account the influence of low ambient temperatures on NOX emissions (c.f. chapter 3.1.3), so a better agreement is easily explainable. The increase in NOX emission factors would however likely cause an overestimation of NOX and NO2 concentrations in the street canyon dispersion calculations presented in the previous chapter.
Finally, there is a surprisingly good agreement between HBEFA and remote sensing for PM emissions, particularly for Euro 5 and 6, which both exhibit very low emissions (Figure 3.34).
0
2
4
6
8
10
12
Euro 2(N=1)
Euro 3(N=6)
Euro 4(N=58)
Euro 5(N=492)
Euro 6(N=343)
g/kg
fuel
NO2 RSD 5000
NO2 HBEFA 3.2
NO2 HBEFA 3.3
0.0
0.2
0.4
0.6
0.8
1.0
1.2
1.4
Euro 2(N=1)
Euro 3(N=6)
Euro 4(N=58)
Euro 5(N=492)
Euro 6(N=343)
g/kg
fuel
PM RSD 5000
PM HBEFA 3.2 & 3.3

44
5 Conclusions Measurements in Gothenburg, Sweden, over 19 workdays during the late summer and fall of 2016 by means of a newly released version of the Opus AccuscanTM RSD 5000 remote sensing instrument, offering NO2 and NOX measurement capability, yielded a lot of useful information on the real driving emission performances of both light-duty and heavy-duty vehicles, in particular for diesel vehicles meeting the Euro 5 and Euro 6 emission standards, since these today make up the majority of the Swedish in-use vehicle fleet. Based on the analysis of a carefully QA/QC-reviewed dataset with paired emission and detailed vehicle information of about 15,500 vehicles, the following conclusions were made:
- Measurements on more than 6,000 diesel passenger cars reveal that the real driving emissions of NOX from Euro 6 diesel cars on average have been reduced by about 60% from pre-Euro 6 levels, e.g. Euro 5. This may be considered a major breakthrough, since the on-road NOX emissions from diesel passenger cars have been virtually unchanged between Euro 2 and Euro 5, although the NOX emission standard has been lowered from about 0.5 g/km to 0.18 g/km (Euro 2 to Euro 5), i.e. a reduction of about 60%. Still, Euro 6 diesel passenger car real-world NOX emissions are roughly more than 5 times higher than the Euro 6 standard, as well as than the average NOX emissions from Euro 6 gasoline cars.
- For NOX emissions, an almost identical pattern as for diesel passenger cars can be seen for both diesel light-duty commercial vehicles and diesel heavy-duty vehicles (trucks and buses), i.e. virtually no change in real-world emissions between Euro 2 and Euro 5, and a huge drop in emissions with Euro 6.
- Primary NO2 emissions from diesel light-duty vehicles (both PC and LCV) have been reduced from Euro 4 through Euro 6, which implies that the emission ratio of NO2 to NOX has also been reduced, but the ratio is still as high as about 25% for both Euro 5 and Euro 6 (compared to about 15% for Euro 2 vehicles). The opposite pattern appears to exist for heavy-duty vehicles, for which the NO2/NOX-ratio increased from about 10% for Euro 4 and Euro 5 to 35% for Euro 6.
- For all categories of diesel vehicles, real-world PM emissions have dropped markedly from Euro 2 through Euro 6 – the reductions are around 90% for Euro 6 compared to Euro 2.
- For Euro 4, 5 and 6 diesel passenger cars, real-world emissions of both NOX and NO2 increase with decreasing ambient air temperature. The temperature dependence appears to be strongest for Euro 5 cars. At 25-30 degrees C average Euro 5 NOX emissions are around 15 g/kg fuel burned, and rise to 20-25 g/kg fuel burned at around 10 degrees C.
- Large differences in the real-world NOX emission performance of Euro 5 and Euro 6 diesel cars were observed between different makes, models and individual vehicles. It appears that remote sensing could be a viable and efficient tool to screen both high- and low-emitting diesel vehicles, particularly light-duty diesel vehicles, for further actions.
- For the first time, remote sensing measurements were combined with air quality measurements and dispersion calculations in an urban street canyon. Calculated average concentrations of NO2, NOX and PM were comparable with corresponding measured concentrations, but the discrepancy increased with increasing concentrations, with calculated concentrations being lower than measured. The latest version of the HBEFA emission model (version 3.3), launched in May 2017, provided a good match with the remote sensing measurements for both NOX and NO2 as well as exhaust PM, but - somewhat contradictory – at the same time tended to lead to an overestimation of street canyon concentrations of NO2 and NOX in dispersion calculations carried out in this study.

45
6 References Bishop, G. A. & Stedman, D. H. (2015) Reactive Nitrogen Species Emission Trends in Three Light-/Medium-Duty United States Fleets. Environ. Sci. Technol. 49, 11234−11240.
Carslaw, D. C., Murrells, T. P., Andersson, J., Keenan, M. (2016) Have vehicle emissions of primary NO2 peaked? Faraday Discuss. 189, 439-454.
Carslaw, D., Beevers, S., Tate, J., Westmoreland, E., Williams, M. (2011). Recent evidence concerning higher NOx emissions from passenger cars and light duty vehicles. Atmospheric Environment 45, 7053-7063.
Chen, Y. & Borken-Kleefeld, J. (2014). Real-driving emissions from cars and light commercial vehicles -Results from 13 years remote sensing at Zurich/CH. Atmospheric Environment 88, 157-164.
De la Fuente, J., Dominguez-Saez, A., Pujadas, M. (2016) Study of Traffic Real Driving Emissions in Madrid in 2015 and Conclusions. 21st International Symposium Transport & Air Pollution, Lyon, 24-26 May, 2016, 742-751.
Ekström, M., Sjödin, Å., Andreasson, K. (2004) Evaluation of the COPERT III emission model with on-road optical remote sensing measurements. Atm. Environ. 38, 6631-6641.
Ekström, M., Sjödin, Å., Andréasson, K. (2005) On-road optical remote sensing measurements of in-use bus emissions. 14th International Symposium Transport & Air Pollution, Graz, Austria, June 1-3, 2005.
Goricsán, I., Balczó, M., Régert, T., Suda, J. (2004) Comparison of wind tunnel measurement and numerical simulation of dispersion of pollutants in urban environment. International Conference on UrbanWind Engineering and Building Aerodynamics, von Karman Institute, Rhode-Saint-Genése, Belgium, 2004.
Hallquist, Å. M., Jerksjö, M., Fallgren, J., Westerlund, J., Sjödin, Å. (2012) Particle and gaseous emissions from individual diesel and CNG buses. Atmos. Chem. Phys. Discuss. 12, 27737-27773.
Hausberger, S. (2010) Fuel Consumption and Emissions of Modern Passenger Cars. Report Nr. I-25/10, Graz University of Technology, 29 November 2010.
Jerksjö, M. (2016) On-road emission measurements in Sweden 2007-2015. In: Proc. 21st International Symposium Transport & Air Pollution, Lyon, 24-26 May, 2016, 240-254.
Lohmeyer, A., Eichhorn, J., Flassak, T., Kunz, W. (2002) WinMISKAM 4.2, microscale flow and dispersion model for built up areas, recent developments. In: Proc. 11th International Symposium Transport & Air Pollution, Graz, June 19-21, 2002.
Pujadas, M., A. Domínguez-Sáez, A., De la Fuente, J. (2017) Real-driving emissions of circulating Spanish car fleet in 2015 using RSD Technology. Science of the Total Environment 576, 193-209.
46
Rushton, C., Tate, J., Shepherd, S. (2016) NOX Emission Performance Of Vans In Real Urban Driving and The Uptake of Euro 5 Technology Using A Remote Sensing Device. 21st International Symposium Transport & Air Pollution, Lyon, 24-26 May, 2016, 530-536.
Sjödin, Å. (1994) On-Road Emission Performance of Late-Model TWC-Cars as Measured by Remote Sensing, J. Air & Waste Managem. Assoc. 44, 397-404.
Sjödin, Å. (1994) Potential of a Remote Sensing Technique in Roadside Inspections - Experiences from a Pilot Study in Sweden. In: Proc. 27th International Symposium on Advanced Transportation Applications (ISATA), Aachen, Germany, October 31- November 4, 1994.
Sjödin, Å. & Andreasson, K. (2000) Multi-Year Remote Sensing Measurements of Gasoline Light-Duty Vehicle Emissions on a Freeway Ramp. Atm. Environ. 34, 4657-4665.
Sjödin, Å., Andréasson, K., Wallin, M. (1997) Multi-Year Repeat Remote Sensing Measurements of On-Road Emissions from Cars Subject to an Annual Centralised I/M-Program Involving an Idle Emission Test. In: Proc. 7th CRC On-Road Vehicle Emissions Workshop, San Diego, 9-11 April, 1997.
Sjödin, Å., Andréasson, K., Wallin, M., Lenner, M., Wilhemsson, H. (1997) Identification of High-Emitting Catalyst Cars on the Road by Means of Remote Sensing. Int. J. Vehicle Design 18, 326-339.
Sjödin, Å. & Jerksjö, M. (2008) Evaluation of European road transport emission models against on-road emission data as measured by optical remote sensing. 16th International Symposium on Transport & Air Pollution, Graz, 16-17 June, 2008.
Sjödin, Å. & Lenner, M. (1995) On-Road Measurements of Single Vehicle Pollutant Emissions, Speed and Acceleration for Large Fleets of Vehicles in Different Traffic Environments. Science of the Total Environment 169, 157-166.
Sjödin, Å., Borken-Kleefeld, J., Tate, J., Carslaw, D., De la Fuentes, J., Lopez de Rego Lage, M., Alt, G.-M., McClintock, P., Gentala, R., Vescio, N., Hausberger, S., Bernard, Y., Tietge, U., Jenk, H. (2017) Study on comparing NOX real driving emissions from Euro 5 and Euro 6 light-duty diesel vehicles as measured by remote sensing, PEMS and on chassis dynamometers – CONOX. Preliminary results.
Thompson, G. J., Daniel K. Carder, D. K., Marc C. Besch, M. C., Thiruvengadam, A. (2014) In-use emissions testing of light-duty diesel vehicles in the U.S. Final report prepared by Center for Alternative Fuels, Engines & Emissions (CAFEE), West Virginia University, on behalf of International Council on Clean Transportation (ICCT), May 15, 2014.
Yahya, M.-R. (2017) Traffic activity, fuel consumption and air emissions calculated for the Swedish in-use road vehicle fleet in 2016 by means of the HBEFA model. IVL Swedish Environmental Research Institute January & June 2017 on behalf of the Swedish Transport Administration.

47

IVL Swedish Environmental Research Institute Ltd. P.O. Box 210 60 // S-100 31 Stockholm // Sweden Phone +46-(0)10-7886500 // www.ivl.se