an extended asld trading system to enhance portfolio
TRANSCRIPT
IEEE TRANSACTIONS ON NEURAL NETWORKS, VOL. 14, NO. 2, MARCH 2003 413
An Extended ASLD Trading System toEnhance Portfolio Management
Kei-keung Hung, Yiu-ming Cheung, Member, IEEE, and Lei Xu, Fellow, IEEE
Abstract—An adaptive supervised learning decision (ASLD)trading system has been presented by Xu and Cheung to optimizethe expected returns of investment without considering risks. Inthis paper, we propose an extension of the ASLD system (EASLD),which combines the ASLD with a portfolio optimization schemeto take a balance between the expected returns and risks. Thisnew system not only keeps the learning adaptability of the ASLD,but also dynamically controls the risk in pursuit of great profitsby diversifying the capital to a time-varying portfolio of assets.Consequently, it is shown that 1) the EASLD system gives theinvestment risk much smaller than the ASLD one and 2) morereturns are gained through the EASLD system in comparison withthe two individual portfolio optimization schemes that staticallydetermine the portfolio weights without adaptive learning. Wehave justified these two issues by the experiments.
Index Terms—Extended adaptive supervised learning decisionsystem (EASLD), expected returns, risk, portfolio optimizationschemes.
I. INTRODUCTION
I N THE literature, various theories and methods have beendeveloped to help investors to pursue great profits in the in-
vestment. One is a computer-based trading system that producesappropriate investment decision signals (also calledtrading sig-nalshereafter) on the basis of the available information to assistan investor make a sensible investment. In the past, one kind ofwidely used trading systems consists of two modules: predic-tion module followed by trading module. However, this type oftrading system is optimized to some prediction criterion (e.g.,mean square error), which is not the ultimate goal of a financialinvestment. Therefore, it often leads to suboptimal performancein the profit-achieved sense. To solve this problem, some effortshave been made along different directions. One is to use a pre-diction criterion more correlated with common trading strate-gies such as that proposed in [2]. Another direction is the re-turn-based systems as proposed in the papers [1], [10], wherethe prediction module and the trading module are merged intoone single system that optimizes the returns instead of the pre-diction criterion.
An alternative choice is the adaptive supervised learning deci-sion (ASLD) network suggested by Xu and Cheung [16], where
Manuscript received January 22, 2000; revised October 12, 2001. This workwas supported by the Research Grant Council of the Hong Kong SAR underProject RGC Earmarked CUHK 4297/98E.
K. Hung and L. Xu are with the Department of Computer Science and En-gineering, The Chinese University of Hong Kong, Hong Kong, P. R. China(e-mail: [email protected]).
Y. Cheung is with the Department of Computer Science, Hong Kong BaptistUniversity, Hong Kong, P. R. China (e-mail: [email protected]).
Digital Object Identifier 10.1109/TNN.2003.809423
the system is built to learn the desired past investment deci-sions via a supervised learning neural network such as extendednormalized radial basis function (ENRBF) neural network [15].The desired past investment decision for a day is obtained justafter that day is past and used as a teaching signal for the net-work to adaptively learn what decision should be made uponthe corresponding inputs. The possibility of using this idea hasalso been discussed but weeded out by Moodyet al.’s two majorcomments in their papers [10]. One comment is that the formingof teaching signals and the training of network by supervisedlearning is a two-step process still, which encounters difficultiesin solving the structural and temporal credit assignment prob-lems. The second comment is that most of the existing labelingprocedures by a human expert or an automatic labeling algo-rithm ignore the input variables and do not consider the condi-tional distributions of price changes given the input variables,especially in the cases that actual transaction costs should beconsidered.
However, although the decision-based approach in [16] needsto obtain the past desired trading signals followed by learning itwith a supervised learning network, it can actually be regardedas a single-step process that a network outputs a decision signaldirectly on the basis of the current input as opposed to make adecision based on the prediction of prices as in a two-step pre-diction-based system. Also, there is no difficulty in the so-calledstructural and temporal credit assignment problems because thebest past investment decision for a day can be easily and surelyobtained after that day is past. Moreover, although the deci-sion-based ASLD system has not directly considered the con-ditional distributions of price changes given the input variables,it considers the conditional distributions of decisions given theinput variables. Thus, it has actually not ignored the inputs aswell as the previous-mentioned return-based systems. In addi-tion, the ASLD system has also considered the actual transactioncosts indeed. Therefore, we argue that the decision-based sys-tems and the return-based ones are both the interesting direc-tions for trading and portfolio management. The performanceof the ASLD system has been shown in the foreign exchangemarket [16] and stock market [6], respectively, with consider-able profits acquired. Essentially, the ASLD trading system opti-mizes the returns without considering the investment risk, whichmay result in large volatility of the returns.
To reduce the risks in pursuit of great profits, an investor usu-ally diversifies the capital to a portfolio. In the investment com-munity, Markowitz in 1952 [7] proposed a fundamental port-folio optimization scheme named standard Markowian portfoliooptimization (SMPO), which determines the portfolio weightsby maximizing the difference between theexpected returnsand
1045-9227/03$17.00 © 2003 IEEE

414 IEEE TRANSACTIONS ON NEURAL NETWORKS, VOL. 14, NO. 2, MARCH 2003
risk. Later, Sharpe [12] defined the Sharpe ratio as the ratioof expected returns to the risk of one asset, which basicallyevaluates an individual asset but not a portfolio as a whole.Consequently, an investor may empirically decide the portfolioweights of assets on the basis of their Sharpe ratios. To ourbest knowledge, such a weight assignment has not been wellstudied yet. In both the SMPO and Sharpe ratio, a risk is de-fined as the return variance, which however has been realizedthat the variance is not an appropriate measure because it countsthe positive fluctuation above the expected returns (also calledupside volatility) as the part of a risk. Hence, Markowitz [8] andFishburn [4] later defined thedownside risk, which counts thevolatility below the expected returns only. Recently, the down-side risk has been further studied, and a new Sharpe ratio re-lated portfolio optimization scheme called improved portfolioSharpe ratio maximization with diversification (IPSRM-D) hasbeen proposed [5]. By maximizing the expected returns andthe upside volatility while minimizing the downside risk, thisIPSRM-D takes a balance between the expected returns and riskto obtain the portfolio weights in batch way and then staticallydiversifies the capital to assets based on the weights duringthe whole investment period.
To combine the ASLD and a portfolio optimization schemeto get the advantages of both, this paper proposes an extendedASLD (EASLD) system that is associated with a portfolio opti-mization scheme such as SMPO or IPSRM-D to provide a bettertradeoff between the expected returns and risk. Compared to theASLD system [16], this new one has two attractive features:
1) Diversification of Investment. In pursuit of great profits,the EASLD system allows more than one asset to be in-vested simultaneously instead of investing one asset only,whereby the risk is considerably reduced.
2) Time-varying Portfolio Management. The EASLDtrading system selects a time-varying portfolio, in whichnot only the portfolio weights are changed over thetime, but also the number of assets in the portfolio istime-varied. The time-varying portfolio managementadaptively adjusts the balance point between the expectedreturns and risk such that the portfolio can follow thechange of the assets’ prices on line with more profitsobtained.
As a result, the EASLD system not only remains the learningadaptability of the ASLD but also dynamically adjusts theportfolio weights such that the risk is considerably reducedwhile great profits are gained. In the experiments, we usethe SMPO and improved portfolio Sharpe ratio maximizationwith diversification (IPSRM-D) as two examples to buildthe EASLD system, respectively. Compared with the ASLDtrading system, the EASLD system can considerably reducethe risk, while providing reasonable long-term returns aswell. Furthermore, the empirical results show that the EASLDtrading system brings more profits than a human investment byusing individual SMPO or IPSRM-D portfolio scheme.
This paper is organized as follows. Section II gives a brief re-view on SMPO and IPSRM-D portfolio schemes as well as theASLD system. Section III presents the extended ASLD systemin detail including its training and operation procedures. In Sec-
tion IV, we will conduct some experiments to compare the per-formance of this new system with the individual SMPO andIPSRM-D, respectively, as well as the ASLD system. Last, wedraw a conclusion in Section V.
II. OVERVIEWS ON SMPO, IPSRM-D PORTFOLIO SCHEMES,AND ASLD TRADING SYSTEM
Let be the returnfrom asset (the term “asset” means bonds, stock sharesetc.) at time , where , denotes themarket-value (also calledprice) of asset at time . Givenan -asset portfolio with a past data set with
, we calculate the portfolioreturns at time and its expected value, denoted as and
, respectively, by
(1)
with
(2)
where with being the weight forasset in portfolio, and . is the ex-pected returns of asset, which can be empirically calculatedby
(3)
A. SMPO
For a single asset, Markowitz [7] suggested to use its returnvariance
var (4)
as a measure of the investment risk. Also, the portfolio risk ofassets is measured by
var (5)
where the th element of matrix
(6)
is the covariance of those returns from assetand .To find out an appropriate , Markowitz [7] proposed an
objective function in terms of the expected returns and risk asfollows:
Maximize
with respect to
subject to
and (7)

HUNG et al.: AN EXTENDED ASLD TRADING SYSTEM TO ENHANCE PORTFOLIO MANAGEMENT 415
where indicates the acceptable level of risk that an in-vestor prefers. The larger the value ofis, the greater the impor-tance of the expected returns is in the objective function. Thisis well-known SMPO. The optimum solution for (7) has beengiven by Ostermark [11].
B. IPSRM-D
1) Sharpe Ratio:For ranking the goodness of an asset,Sharpe proposed the idea of Sharpe ratio [12], [13] based onMarkowitz’s mean-variance paradigm. The definition of Sharperatio for asset is as follows:
var(8)
Sharpe suggested calculating the Sharpe ratio for each asset andthen select the asset with the greatest value to invest. Althoughboth of SMPO and Sharpe ratio consider the balance betweenexpected return and risk, the latter measures the goodness of anasset generally better than the former.
2) Downside Risk and Upside Volatility:According toMarkowitz [7], the risk is taken as the variance of the return.However, more and more academics and practitioners claimthat the variance is not an appropriate measure of risks in manypractical investments. Thus, Fishburn [4] proposed a moresophisticated measure of risk associated with below-targetreturn, through which the idea of downside risk was proposedby Sortino and Meer [14]. Basically, the downside risk is thevolatility of return below the minimal acceptable return (alsocalledtarget return) .
For an single asset, the definition of downside risk,down , is given as follows:
down with (9)
where is the probability distribution function of an asset’sreturn . The is supposed to reflect a decision maker’ feel-ings about the relative consequences (personal, corporate, etc.)of falling short of the minimal acceptable returnby variousamounts. The detailed selection rules forcan be referred inFishburn [4].
Since the downside risk in (9) is for a single asset only, ourrecent paper [5] has extended it to the case for-asset portfolioas follows:
down down
where
down
down down...
...down down
(10)
Apart from considering the variance below the target return,the paper [5] also considers to measure the variance of return
above the target return by introducing a new term called “up-side volatility.” Similar to the calculation of downside risk, theupside volatility for an -asset portfolio is defined as
up up
where
up
up up...
...up
(11)
3) IPSRM-D: Since the Sharpe ratio defined in (8) is ex-clusively for evaluating a single asset without a scheme to de-cide the portfolio weights, it is actually not suitable for port-folio management. Hence, the paper [5] has extended it to theportfolio case, named improved portfolio sharpe ratio (IPSR),as follows:
IPSR (12)
which not only includes the individual Sharpe ratio value ofeach asset, but also counts both of the downside risk and up-side volatility. Based on IPSR, the paper [5] presents a portfoliooptimization scheme called IPSRM-D as follows:
Maximize
with respect to subject to
and for (13)
where is the constant vector of 1, the parameterrepre-sents the degree of importance of maximizing upside volatilityin the optimization, and is the degree of importance of regu-larization in the optimization. The optimization of (13) can beimplemented by an augmented Lagrangian algorithm as listedin Appendix-I. It has been shown [5] that the IPSRM-D can ef-fectively reduce the risk while obtaining great returns.
C. ASLD System
Suppose the nonlinear relationship between trading signalsand the assets’ prices can be described by a nonlinear function
. The ASLD system [16] trains a supervised learning neuralnetwork to approximate this before its operation. The trainingand operation of the ASLD system are summarized as follows:
• Training Stage of the ASLD System. In this stage, we use aset of past data to train the system. At each time
, the desired trading signal isfirst extracted based on a return-optimized trading strategybecause the “future” price ,can be look-ahead. Then, this available trading signal as ateaching signal is used to train a supervised learning neuralnetwork, e.g., extended normalized radial basis function

416 IEEE TRANSACTIONS ON NEURAL NETWORKS, VOL. 14, NO. 2, MARCH 2003
Fig. 1. Structure of the extended ASLD (EASLD) system in the training stage.
(ENRBF) network [15], such that it is learned what deci-sion should be made upon the corresponding inputs.
• Operation Stage of the ASLD System. In this stage, the as-sets’ daily prices are not available until that day. That is,
is available at time or after. At current time, theASLD system not only outputs an estimate of the corre-sponding desired trading signal but also adaptively adjuststhe parameters of the supervised learning neural networkafter the desired trading signal at time is extractedpresently.
The details of the ASLD system can be found in [16].It should be noted that the trading strategy used in [16]
determines the desired trading signals by optimizing the returnsone time step ahead only. Reference [6] has provided an im-proved trading strategy that considers-time step ahead whenextracting a desired trading signal. Since the ASLD system isproposed to optimize the returns only without considering therisks, it may often result in large volatility of the returns. Inthe next section, an extended ASLD system will be introduced,therefore, to take a balance between the expected returnsand risks.
III. EASLD TRADING SYSTEM
The EASLD trading system is a combination of the ASLDsystem and a portfolio optimization scheme. At each time, thesystem input is the observed prices ofassets and the output isa trading signal that not only shows the portfolio investment ona subset of assets, but also indicates the transaction instruc-tions on the assets in hand. Since the EASLD uses a supervisedlearning neural network to describe the nonlinear relationshipbetween the inputs and outputs, we need to train it such that the
net’s parameters are tuned appropriately before operation. In thefollowing, we will elaborate the system’s training and operationstages, respectively.
A. Training of the EASLD System
As shown in Fig. 1, the EASLD system consists of fourmajor components: Investment asset selector (IAS), portfoliooptimization scheme (POS), trading signal generator (TSG),and supervised learning neural network (SNN). Its trainingprocedure is as follows: At each time step, the IAS compo-nent selects a subset, written as , from assets. We callthese selected assetsinvestment assets, which are not held attime and should be invested at timeon the basis ofa pre-specified trading strategy. Also, the IAS will give thetransaction instruction for asset to decide whether tomake a transaction or not. Upon determining the investmentassets, the POS component uses a portfolio optimizationscheme, such as existing SMPO or IPSRM-D, to assign eachasset a portfolio weight, written as , which is determinedbased on the available past assets’ prices up to. Subsequently,a trading signal on asset, , is generatedby the TSG on the basis of the transaction instructionand the portfolio weight from the POS. We then use thetrading signal, as a desired teaching signal at time, to adjustthe SNN system parameters with a little small step. With theadaptive training, the SNN can gradually model the nonlinearrelationship between the desired trading signals and the assets’prices. In the following, we will show the detailed implemen-tations of IAS, TSG, and SNN, respectively. As for the POS, itcan be generally accomplished by using any existing portfoliooptimization scheme. In this paper, we just concentrate on theSMPO and IPSRM-D, whose details as well as the relevant
HUNG et al.: AN EXTENDED ASLD TRADING SYSTEM TO ENHANCE PORTFOLIO MANAGEMENT 417
literatures have been introduced in Section I. We therefore omitits details hereafter.
1) Investment Asset Selector:The EASLD system definesthe transaction instruction signal in the form
(14)
with
means to buy asset
means to sell asset
otherwise
(15)
where and are calledallocating signalandposi-tional signal, respectively, with
means to hold asset
means to sell asset
otherwise
(16)
andmeans to perform a transaction on assetat time
otherwise.
(17)
The trading strategy used in the EASLD system needs to lookahead the “future” prices such that an appropriate trading deci-sion is made. Its rules can be stated as follows:
1) Suppose assetis held at time . If asset keepsdecreasing in the next time steps with the amount ofdecrement larger thantimes of the transaction costs, wedetermine to sell it out at timeto get cash back.
2) Suppose assetis not held at time . If its prices keepincreasing in the next time steps and the amount of theincrement is larger than times of the transaction costs,we will invest on this asset at time.
Specifically, and are determined by the followingprocedure:
Step ALet and .Step BFor , , if , let
if
and
otherwise(18)
where denotes a transaction cost, andis a constant.Step CIf is not in , let
if
and
otherwise.(19)
Step DFor , let
if ( is not in ), and ( or
otherwise.(20)
Since an investment asset is the one that is not held at timeshould be invested at timeaccording to the above trading
strategy, the IAS, therefore, chooses the investment assets attime by
Asset is an investment asset if
and
It should be noted that the above trading strategy is actuallymade without considering the activities of “sell short.” If it isallowed in the portfolio investment, the situation then becomessomewhat complex. One possible way is to replace the symbol“ ” in (19) by “ ” when considering “sell short” transactionon asset. Consequently, the signal definition of in (16)and the signal assignment in (18) both need to be modified cor-respondingly. In our paper [16], a trading strategy that allowsthe “sell short” activities has been suggested. See [16] for moredetails. For simplicity, we will no longer consider “sell short”hereafter.
2) Trading Signal Generator (TSG):Given the transactioninstruction , the TSG generates the trading signal inthe form
if
otherwise,(21)
with
means to buy assetin proportion to
means to sell asset
otherwise(22)
and , , .3) SNN Learning:Suppose there exists a nonlinear functionamong , , and the past assets’ prices
with
(23)
where , ,and is the time lag. In principle, the EASLD system can useany trained supervised learning neural network to approximatethis function . Here, we prefer to use ENRBF networks be-cause of its simple architecture and learning procedures. Fur-ther, the experiments in [6] and [16] have shown their successfulperformance in modeling foreign exchange and stock markets.In this paper, we use an array of ENRBF networks trainedby the CCL learning algorithm [15] as the SNN componentto approximate the nonlinear functionin (23). As shown inFig. 2, the output of network is when
is the input at time. Theparameter set of networkis
(24)
where is the number of hidden units in the hidden layer, ,are the hidden parameters in the output layer, and, are
the centers and covariance matrices of the RBF hidden units. Inthe literature, such a network is expected to be trained by usinga least-square learning technique. However, due to the difficulty

418 IEEE TRANSACTIONS ON NEURAL NETWORKS, VOL. 14, NO. 2, MARCH 2003
Fig. 2. Structure of ENRBF-networki.
of determining the parameters and in practice, learningis usually made by an approximation method with two separatesteps. First, we use some kind of clustering analysis (e.g., thek-means algorithm) to group the net’s input set intoclus-ters with their centers characterized as, .Second, the parameters , are determined by a least-squarelearning technique. Using this two-step training approach, thecenters are obtained directly from the input data without theneed to make an improvement to the regression relation between
and .By combining the ENRBF network with an alternative to the
mixture-of-experts model [17], Xu [15] has proposed an expec-tation-maximization (EM) algorithm to learn the ENRBF’s pa-rameters with a better estimate. In Appendix-III, we give out anadaptive algorithm as well as a batch one to train the parametersin each network. For other details, the interesting readers canrefer to [15] and [16].
B. Operation of the EASLD Trading System
At each time step, determining the desired teaching signalneeds to look ahead-step the “future” assets’ prices. Hence, inthe operation stage, the desired trading signal of current timeis not available until time . As shown in Fig. 3, at each time, the EASLD trading system uses the trained SNN to give an
estimate of the corresponding desired teaching signal by
if
if
otherwise
(25)
with
(26)
where , and is a small positive thresholdvalue, which can be generally determined via a cross-valida-tion technique. In particular, when the SNN is implementedby the ENRBF network described in Section III-A3), (26) thenbecomes
(27)
With the help of s in (25), an investor can, therefore, knowhow to deal with the assets in hand, and to diversify the capital toa portfolio investment such that the risk is considerably reducedmeanwhile acquiring great profits.
When the desired teaching signal of timeis determined attime , we continually tune the SNN in the same way as thetraining stage to maintain the EASLD system adaptive-learningcapability.
IV. EXPERIMENTAL DEMONSTRATION
A. EASLD in the Stock Market
We performed the experiments by investing a portfolio of sixdifferent stock indexes:
• S&P 500 Composite Price Index (USA);• Hang Seng Index (Hong Kong);• Shanghai SE Composite - Price Index (P.R. China);• NIKKEI 255 Stock Average (Japan);• CAC 40 - Price Index (France);• Australia SE All Ordinary Price Index (Australia).
The experimental data consisted of 1365 data points fromMay 11, 1992 to August 1, 1997. The first 1000 points wereused as the past data set, whereas the remaining 365 ones wereused in the operation stage of the EASLD trading system forperformance test. Furthermore, in all of the following experi-ments, we let the rate of transaction costbe 3% of the amountin each transaction. Also, we chose SMPO and IPSRM-D astwo examples to build the EASLD system, respectively, by set-ting and in the IPSRM-D, andsetting in SMPO. In making IAS trading strategy, wesimply fixed and heuristically determinedby the paper [6] in the same experimental data set, although across-validation technique is helpful to improve the parametervalue selection.
1) Experiment 1: Comparison Between EASLD System andASLD One: To show that EASLD system has smaller invest-ment risk in comparison with the ASLD one, we let SMPO bethe POS component of the EASLD system as an example. Here-after, we denote it as EASLD-SMPO. Fig. 4 shows that the profitgain obtained by the EASLD system is more stable than theASLD. The major reason is that the target of the ASLD systemis to maximize the expected returns without considering the risk.As indicated in Table I, the ASLD system invested on at most

HUNG et al.: AN EXTENDED ASLD TRADING SYSTEM TO ENHANCE PORTFOLIO MANAGEMENT 419
Fig. 3. Structure of the EASLD system in the operation stage.
Fig. 4. Profit gain obtained by the EASLD-SMPO system and the ASLD one,respectively.
one index each day, which made the volatility of the profit gainlarge. On the other hand, instead of only maximizing the ex-pected returns, the EASLD system diversified the capital to takean appropriate balance between the expected returns and therisk. We measured the degree of diversification (dod) by
dod (28)
where is the vector of portfolio at time, and is the lengthof the operation time period. Table I shows that the EASLDsystem invested on at most three indexes in the operation periodwith dod in comparison with dod in the ASLD.Hence, the EASLD system can considerably reduce risk in con-trast to the ASLD, while bringing reasonable long-term profitsas well. We also compared the EASLD-IPSRM-D (i.e., we buildthe EASLD system with the POS component being IPSRM-D)with the ASLD, resulting in the same conclusion as shown inTable I.
2) Experiment 2: Comparison Between EASLD and Indi-vidual Portfolio Schemes:This experiment is to show that theEASLD system can bring more profits than an individual port-folio scheme. When individually using SMPO and IPSRM-D,we calculated the portfolio weights on the past data set asshown in Section II. We then fixed the and diversified thecapital to six assets in proportion to and held them duringthe whole operation period.
Fig. 5(a) shows the performance of the SMPO and theEASLD-SMPO. It can be seen that the return curve of the latteris always above the former’s one. That is, the latter can consis-tently bring more profit. The major reason is that the adaptivetrading signal provided by the EASLD system can keep trackof the dynamic financial market indexes but the individualSMPO cannot. To justify the significance of the EASLD inprofit gains, we further conducted the statistical hypothesistest. We calculated the individual average monthly returns ofEASLD-SMPO and SMPO, written as and
, respectively, where , is the monthlyindexes. We then further calculated their mean, denoted as
and , respectively. We set the null hy-pothesis be = , while the alternativehypothesis is . We performed

420 IEEE TRANSACTIONS ON NEURAL NETWORKS, VOL. 14, NO. 2, MARCH 2003
TABLE IPERFORMANCECOMPARISONAMONG THE ASLD, EASLD-SMPO,AND EASLD-IPSRM-D SYSTEMS
(a)
(b)
Fig. 5. Performance comparison. (a) Between EASLD-SMPO and SMPO.(b) Between EASLD-IPSRM-D and IPSRM-D.
the -test at the 0.05% level of significance. We obtained thevalue to be 10.0542, which is much larger than the critical
value . It is, therefore, the experimental resultsreject at the 0.05% level of significance. That is, we havethe strong confidence that the EASLD-SMPO brings the profitmore than the SMPO. In Fig. 5(b), we also compared theIPSRM-D and EASLD-IPSRM-D. We found again that theEASLD can obtain more profit gain than the corresponding
individual portfolio scheme. We further performed thetestin the same way as the previous one. We obtained thevalue to be 6.1004, which is still larger than the critical value4.14. The experimental results, therefore, support again thatEASLD-IPSRM-D outperforms IPSRM-D in the sense of profitgains.
Furthermore, from Fig. 5(a) and (b), we also found that thereturn volatility of EASLD-SMPO and EASLD-IPSRM-Dsystems were larger a little than the individual SMPO andIPSRM-D, respectively. Even so, we found that the returns fromEASLD-SMPO are always much more than SMPO during thewhole operation period. Similarly, EASLD-IPSRM-D gave fargreater returns than IPSRM-D in the most time. This impliesthat the EASLD has made an appropriate balance between thereturns and the investment risk.
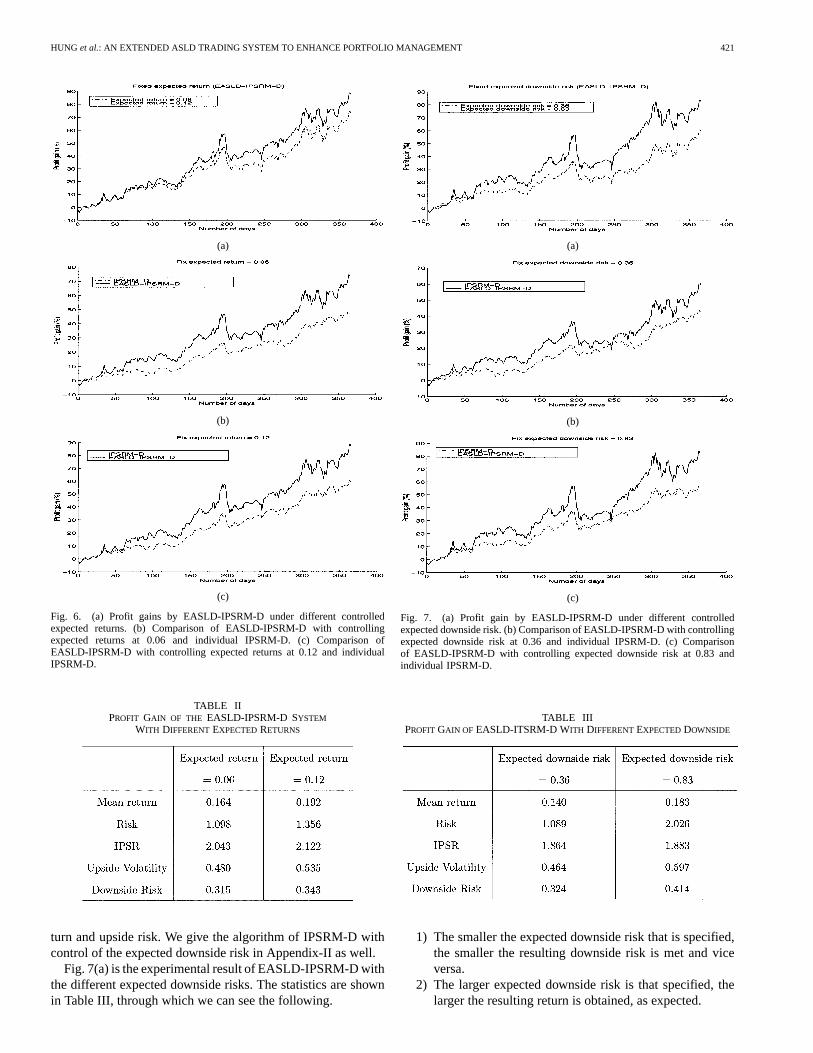
3) Cautious Investment:From the practical viewpoint, wenoticed that some conservative investors are more concernedabout risk than return. Therefore, a strategy that may satisfythem is to minimize the risk while controlling the expected re-turn. In the IPSRM-D, we fixed the expected return to be 0.06and 0.12, respectively, while minimizing the downside risk andmaximizing the upside risk. The algorithm of IPSRM-D withcontrol of expected returns is listed in Appendix-II. Fig. 6(a) isthe experimental results of EASLD-IPSRM-D with controllingexpected return at different levels. The result statistics are shownin Table II, through which we can see the following.
1) The higher the expected return that is specified, the higherthe resulting return is obtained and vice versa.
2) The smaller the expected return that is specified, thesmaller the resulting risk is met, as expected.
Under the different return control level, we again compared theprofit gain performance of the EASLD-IPSRM-D system withthe individual IPSRM-D. Fig. 6(b) and (c) showed the compar-ison results, where we can see that the EASLD-IPSRM-D canbring much more profit gain than the IPSRM-D, which is alsoconsistent with the previous findings.
In contrast, we also noticed that some aggressive investorsare more concerned about return than risk. Therefore, a strategythat may satisfy them is to maximize the expected return whilecontrolling the expected downside risk. Consequently, we fixedthe expected downside risk, which is specified by the investor,and the optimization essentially becomes a maximization of re-
HUNG et al.: AN EXTENDED ASLD TRADING SYSTEM TO ENHANCE PORTFOLIO MANAGEMENT 421
(a)
(b)
(c)
Fig. 6. (a) Profit gains by EASLD-IPSRM-D under different controlledexpected returns. (b) Comparison of EASLD-IPSRM-D with controllingexpected returns at 0.06 and individual IPSRM-D. (c) Comparison ofEASLD-IPSRM-D with controlling expected returns at 0.12 and individualIPSRM-D.
TABLE IIPROFIT GAIN OF THE EASLD-IPSRM-D SYSTEM
WITH DIFFERENTEXPECTEDRETURNS
turn and upside risk. We give the algorithm of IPSRM-D withcontrol of the expected downside risk in Appendix-II as well.
Fig. 7(a) is the experimental result of EASLD-IPSRM-D withthe different expected downside risks. The statistics are shownin Table III, through which we can see the following.
(a)
(b)
(c)
Fig. 7. (a) Profit gain by EASLD-IPSRM-D under different controlledexpected downside risk. (b) Comparison of EASLD-IPSRM-D with controllingexpected downside risk at 0.36 and individual IPSRM-D. (c) Comparisonof EASLD-IPSRM-D with controlling expected downside risk at 0.83 andindividual IPSRM-D.
TABLE IIIPROFIT GAIN OF EASLD-ITSRM-D WITH DIFFERENTEXPECTEDDOWNSIDE
1) The smaller the expected downside risk that is specified,the smaller the resulting downside risk is met and viceversa.
2) The larger expected downside risk is that specified, thelarger the resulting return is obtained, as expected.

422 IEEE TRANSACTIONS ON NEURAL NETWORKS, VOL. 14, NO. 2, MARCH 2003
Fig. 8. Profit gains from the investment in foreign exchange market by the EASLD system.
Again, under the different controls of expected downside risk,we compared the performance of EASLD-IPSRM-D with theIPSRM-D, as shown in Fig. 7(b) and (c). We found that thereturn volatility of the former is similar with the latter becauseof the risk control, but the former gives much more profits.
B. EASLD in Foreign Exchange Market
In the previous experiments, we have shown the outstandingperformance of EASLD in the stock market in comparisonwith the ASLD and the two individual portfolio managementschemes. This section will further demonstrate the performanceof EASLD in foreign exchange market. We considered aportfolio of the following six foreign exchange rates:
1) Australian Dollar (AUD);2) Canadian Dollar (CAD);3) German Deutschmark (DEM);4) French Franc (FRN);5) Japanese Yen (JAP);6) Swiss Franc (CHF).The experimental data were from November 26, 1991 to
August 30, 1995 with 1112 samples in total. In our experiment,the first 1000 data were used in the training stage, while theother 112 ones were used in the operation stage.
Fig. 8 shows the curve of profit gains from the EASLDsystem. It can be seen that the investment returns nearly158% profit gain following the trading signal generated by theEASLD system but with a small downside risk. It further againdemonstrates the capability of the EASLD in making a tradeoffbetween high returns and the investment risk.
V. CONCLUSION
In this paper, we have extended the ASLD trading system bycombining it with a portfolio optimization scheme. Since thisnew system has the advantages of both of them, it not only keeps
the learning adaptability of the ASLD but also controls the riskin pursuit of considerable profits by diversifying the capital toa time-varying portfolio of assets. The experimental resultshave shown that the EASLD system can considerably reducethe risk in comparison with the ASLD one while keeping thereasonable long-term returns. Furthermore, the EASLD bringsfar more profits than the two individual portfolio optimizationschemes with a little sacrifice of the risk, which can actuallybe further improved by controlling of the downside risk. Theproposed system has therefore provided a new way to enhancethe portfolio management by making a better balance betweenthe expected returns and the investment risk.
APPENDIX IAUGMENTED LAGRANGIAN ALGORITHM FOR
IPSRM-D IMPLEMENTATION
We show the derivation of the optimization algorithms forIPSRM-D as follows.
Let and be acolumn vector containing , . Then,we have
if
otherwiseand
if (29)
The augmented Lagrangian is given by
(30)
HUNG et al.: AN EXTENDED ASLD TRADING SYSTEM TO ENHANCE PORTFOLIO MANAGEMENT 423
and its derivative with respect to is
(31)
The first-order multiplier iteration method is used. The recur-sive algorithm for implementing IPSRM-D by the augmentedLagrangian method is to update at every iteration
by the following equations until converges:
(32)
where is a constant greater than one,is a small positivelearning rate, and is a penalty parameter which should bekept increasing during the optimization process.
APPENDIX IIALGORITHM FOR IPSRM-D WITH CONTROL OF
EXPECTEDRETURN ORDOWNSIDE RISK
For IPSRM-D with control of expected return, the augmentedLagrangian in (30) then becomes
(33)
(34)
(35)
and its derivative with respect to is
(36)
The recursive algorithm for implementing IPSRM-D with con-trol of expected return by the augmented Lagrangian method is
to update at every iteration by the followingequations until converges
(37)
For IPSRM-D with control of downside risk, the augmentedLagrangian is given by
(38)
(39)
(40)
and its derivative with respect to is
(41)
The recursive algorithm for implementing IPSRM-D with con-trol of downside risk by the augmented Lagrangian method is toupdate at every iteration by the followingequations until converges
(42)
APPENDIX IIICCL LEARNING ALGORITHM FOR ENRBF
In the following, we will give out two CCL algorithms forENRBF learning. One is for batch-way learning, and the otheris for adaptive learning.
424 IEEE TRANSACTIONS ON NEURAL NETWORKS, VOL. 14, NO. 2, MARCH 2003
a) Batch CCL-ENRBF Algorithm. Give the training set, we have the following iterative
procedure:
Step 1) Fix , get by
if
otherwise(43)
with
(44)
where is the variance of the regressionerror .
Step 2) Update by
(45)
with
(46)
where refers to the expectation of , andis the cross correlation of and .
b) Adaptive CCL-ENRBF Algorithm. Given each pair, go through the following steps once:
Step 1) Fix , get by (43) and let.
Step 2) Update by
(47)
where is a small positive learning rate, andis the number that in the past.
ACKNOWLEDGMENT
The authors would like to give many thanks to anonymousreviewers for their valuable comments and suggestions.
REFERENCES
[1] Y. Bengio, “Training a neural network with a financial criterion ratherthan a prediction criterion,” inProc. Fourth Int. Conf. Neural NetworksCapital Markets, A. S. Weigend, Y. Abu-Mostafa, and A.-P. N. Refenes,Eds., 1997, pp. 36–48.
[2] R. B. Caldwell, “Improved prediction performance metrics for neuralnetwork-based financial forecasting systems,”Neurovest J., vol. 3, no.5, pp. 22–26, 1995.
[3] F. J. Fabozzi,Investment Management. Englewood Cliffs, N.J.: Pren-tice-Hall, 1995, ch. 4, p. 75.
[4] P. C. Fishburn, “Mean-risk analysis with risk associated with belowtarget returns,”Amer. Econ. Rev., vol. 67, no. 2, pp. 116–126, March1977.
[5] K. K. Hung, C. C. Cheung, and L. Xu, “New sharpe-ratio-relatedmethods for portfolio selection,” inProc. Comput. Intell. FinancialEng., 2000, pp. 34–37.
[6] K. K. Hung and L. Xu, “Further study of adaptive supervised learningdecision (ASLD) network in stock market,” in IEEE-EURASIP Work-shop Nonlinear Signal Image Processing, 1999, Paper no. 154.
[7] H. M. Markowitz, “Portfolio selection,”J. Finance, Mar. 1952.[8] , Portfolio Selection, 1st ed. New York: Wiley, 1959.[9] J. Moody and L. Z. Wu, “Optimization of trading systems and portfo-
lios,” in Proc. IEEE / IAFE Conf. Comput. Intell. Financial Eng., NewYork, 1997, pp. 300–307.
[10] J. Moody and L. Z. Wu, “Optimization of trading systems and portfo-lios,” in Proc. Fourth Int. Conf. Neural Networks Capital Markets, A. S.Weigend, Y. Abu-Mostafa, and A.-P. Refenes, Eds., 1997, pp. 23–35.
[11] R. Ostermark, “Portfolio efficiency of univariate time series models,”OMEGA Int. J. Manag. Sci., vol. 18, no. 2, pp. 159–169, 1990.
[12] W. F. Sharpe, “Mutual fund performance,”J. Business, pp. 119–138,1966.
[13] W. F. Sharpe, “The sharpe ratio-properly used, it can improve invest-ment,”J. Portfolio Manag., pp. 49–58, 1994.
[14] F. A. Sortino and R. van der Meer, “Downside risk,”J. Portfolio Manag.,pp. 27–31, 1991.
HUNG et al.: AN EXTENDED ASLD TRADING SYSTEM TO ENHANCE PORTFOLIO MANAGEMENT 425
[15] L. Xu, “RBF nets, mixture experts, and Bayesian ying-yang learning,”Neurocomput., vol. 19, no. 1–3, pp. 223–257, 1998.
[16] L. Xu and Y. M. Cheung, “Adaptive supervised learning decision net-works for traders and portfolios,”J. Comput. Intell. Finance, vol. 5, no.6, pp. 11–16, 1997.
[17] L. Xu, M. I. Jordan, and G. E. Hinton, “An alternative model for mixtureof experts,” inAdvances in Neural Information Processing Systems, J.D. Cowan, G. Tesauro, and J. Alspector, Eds. Cambridge, MA: MITPress, 1995, pp. 633–640.
Kei-keung Hung, photograph and biography not available at the time ofpublication.
Yiu-ming Cheung (S’96–M’00) the received Ph.D.degree from the Department of Computer Scienceand Engineering, the Chinese University of HongKong, Hong Kong, in 2000.
He became a Visiting Assistant Professor with theChinese University of Hong Kong. He is currentlyan Assistant Professor with the Department ofComputer Science, Hong Kong Baptist University,Hong Kong. His research interests include machinelearning, signal processing, data mining, financialtime series and portfolio management.
Lei Xu (SM’94–F’01) received the Ph.D. degreefrom Tsinghua University, Beijing, China, in 1987.
He is a Professor with the Department of Com-puter Science and Engineering, the Chinese Univer-sity of Hong Kong (CUHK), Hong Kong. He is alsoa Full Professor at Peking University, and an adjunctProfessor at three other universities in China and theU.K. He joined Peking University, Beijing, China, in1987, where he became one of ten university-level ex-ceptionally promoted young Associate Professors in1988 and was exceptionally promoted to a Full Pro-
fessor in 1992. From 1989 to 1993, he worked at several universities in Finland,Canada, and United States, including Harvard and Massachusetts Institute ofTechnology, both in Cambridge, MA. He joined CUHK in 1993 as a SeniorLecturer and then took the current Professor position in 1996. He has publishedmore than 240 academic papers. He has given a number of keynote/plenary/invited/tutorial talks in international major neural networks (NN) conferences,such as WCNN, IEEE-ICNN, IJCNN, ICONIP, etc.
Dr. Xu is on the Governor Board of the International Neural Networks So-ciety, a Past President of Asia-Pacific NN Assembly, and an Associate Editorfor six international journals on NN, includingNeural Networksand the IEEETRANSACTIONS ONNEURAL NETWORKS. He was an ICONIP’96 Program Com-mittee Chair and a General Chair of IDEAL’98 and IDEAL’00. He has served asone of the program committee members in international major NN conferencesover the past decade, including the International Joint Conference on NeuralNetworks, the World Conference on Neural Networks, and the IEEE-Interna-tional Conference on Neural Networks. He has received several Chinese nationalprestigious academic awards, including the National Nature Science Prize, aswell as international awards, including the 1995 INNS Leadership Award. He isa Fellow of the International Association on Pattern Recognition and a Memberof the European Academy of Sciences.