an external logic architecture for .... report no. 2. government accession no. 3. recipient‟s...
TRANSCRIPT

AN EXTERNAL LOGIC ARCHITECTURE FOR IMPLEMENTING TRAFFIC SIGNAL SYSTEM
CONTROL STRATEGIES
Final Report
KLK717
N11-07
National Institute for Advanced Transportation Technology
University of Idaho
Michael P. Dixon and Mohammad Rabiul Islam
September 2011

DISCLAIMER
The contents of this report reflect the views of the authors,
who are responsible for the facts and the accuracy of the
information presented herein. This document is disseminated
under the sponsorship of the Department of Transportation,
University Transportation Centers Program, in the interest of
information exchange. The U.S. Government assumes no
liability for the contents or use thereof.
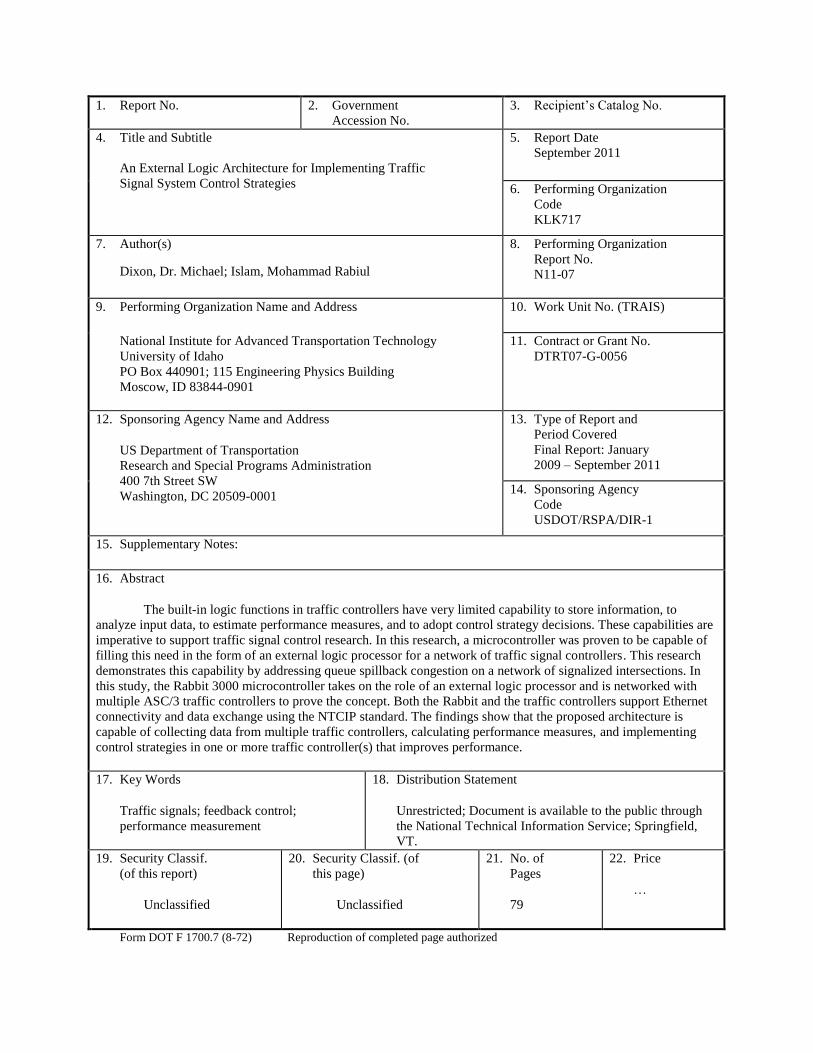
1. Report No. 2. Government
Accession No.
3. Recipient‟s Catalog No.
4. Title and Subtitle
An External Logic Architecture for Implementing Traffic
Signal System Control Strategies
5. Report Date
September 2011
6. Performing Organization
Code
KLK717
7. Author(s)
Dixon, Dr. Michael; Islam, Mohammad Rabiul
8. Performing Organization
Report No.
N11-07
9. Performing Organization Name and Address 10. Work Unit No. (TRAIS)
National Institute for Advanced Transportation Technology
University of Idaho
PO Box 440901; 115 Engineering Physics Building
Moscow, ID 83844-0901
11. Contract or Grant No.
DTRT07-G-0056
12. Sponsoring Agency Name and Address
US Department of Transportation
Research and Special Programs Administration
400 7th Street SW
Washington, DC 20509-0001
13. Type of Report and
Period Covered
Final Report: January
2009 – September 2011
14. Sponsoring Agency
Code
USDOT/RSPA/DIR-1
15. Supplementary Notes:
16. Abstract
The built-in logic functions in traffic controllers have very limited capability to store information, to
analyze input data, to estimate performance measures, and to adopt control strategy decisions. These capabilities are
imperative to support traffic signal control research. In this research, a microcontroller was proven to be capable of
filling this need in the form of an external logic processor for a network of traffic signal controllers. This research
demonstrates this capability by addressing queue spillback congestion on a network of signalized intersections. In
this study, the Rabbit 3000 microcontroller takes on the role of an external logic processor and is networked with
multiple ASC/3 traffic controllers to prove the concept. Both the Rabbit and the traffic controllers support Ethernet
connectivity and data exchange using the NTCIP standard. The findings show that the proposed architecture is
capable of collecting data from multiple traffic controllers, calculating performance measures, and implementing
control strategies in one or more traffic controller(s) that improves performance.
17. Key Words
Traffic signals; feedback control;
performance measurement
18. Distribution Statement
Unrestricted; Document is available to the public through
the National Technical Information Service; Springfield,
VT.
19. Security Classif.
(of this report)
Unclassified
20. Security Classif. (of
this page)
Unclassified
21. No. of
Pages
79
22. Price
…
Form DOT F 1700.7 (8-72) Reproduction of completed page authorized

An External Logic Architecture for Implementing Traffic Signal System Control Strategies i
Table of Contents
List of Figures .................................................................................................................... iii
List of Tables ..................................................................................................................... iv
Chapter 1: Introduction ........................................................................................................1
1.1 Research Overview ...............................................................................................1
1.2 Relevant Research .................................................................................................2
1.3 State of Queue Spillback Methods ........................................................................3
1.4 Problem Statement ................................................................................................4
1.5 Research Objectives ..............................................................................................5
Chapter 2: The Architecture Description .............................................................................6
2.1 Specifications and Constraints ..............................................................................6
2.2 Hardware Testing Environment ............................................................................9
2.3 Program Structure .................................................................................................9
2.4 User Implementation ...........................................................................................14
2.5 Architecture Assessment .....................................................................................16
2.6 Suggested Work ..................................................................................................18
Chapter 3: Test Setup and Data Collection ........................................................................22
3.1 Lab Test Setup .....................................................................................................22
3.2 Data Collection ....................................................................................................25
Chapter 4: Method Validation and System Size Limitation ..............................................27
4.1 Data Exchange Capability Test ...........................................................................27
4.2 Data Validation ...................................................................................................29
4.3 System Size .........................................................................................................35
4.4 Summary .............................................................................................................40
Chapter 5: Performance Measure and Feedback Process Evaluation ................................41
5.1 Context: Insufficient Downstream Storage .........................................................41
5.2 Queue Spillback Detection: Smaglik/Beaird Approach ......................................41
5.4 Performance Measure ..........................................................................................45
5.5 Feedback Decision Process .................................................................................48
Chapter 6: Technology Transfer ........................................................................................51
6.1 Requesting Data and Using NTCIP 1202 ...........................................................51
6.2 Interfacing with Relevant Tasks ..........................................................................54
6.3 Using Relevant Libraries and Variables..............................................................56
6.4 Using the User Interface (The Webpage) ............................................................58
Chapter 7: Conclusion and Recommendations ..................................................................61
7.1 Synthesis of the Findings ....................................................................................61
7.2 Opportunities for Microcontroller Application ...................................................62

An External Logic Architecture for Implementing Traffic Signal System Control Strategies ii
7.3 Next Steps in Research ........................................................................................63
References ..........................................................................................................................65
APPENDIX A: List of Functions in Traffic System Definition Library .......................67
APPENDIX B: Comparison of Phase Maximum Green and Phase Passage Values .....71
APPENDIX C: Signal State Comparison of I5-Off ramp Intersection ..........................72
APPENDIX D: Detector Status Comparisons ...............................................................73
APPENDIX E: Paired t-Tests for GTU Comparison .....................................................75
APPENDIX F: List of the Most Commonly Used OIDs ...............................................77

An External Logic Architecture for Implementing Traffic Signal System Control Strategies iii
List of Figures
Figure 1: Hardware testing environment: HILS and microcontroller. ............................................ 9
Figure 2: Program collaboration diagram. .................................................................................... 10
Figure 3: Web-based user interface. ............................................................................................. 16
Figure 4: Communication architecture of the proposed system. .................................................. 23
Figure 5: Traffic network applied in the simulation. .................................................................... 24
Figure 6: Comparison of signal status data for intersection 1 (Ash Way). ................................... 31
Figure 7: Comparison of detector status. ...................................................................................... 32
Figure 8: Comparison of detector occupancy from 5-second logs. .............................................. 34
Figure 9: Comparison of detector volume. ................................................................................... 35
Figure 10: Response delay in signal status display. ...................................................................... 39
Figure 11: Downstream storage queue spillback illustration. ....................................................... 41
Figure 12: VISSIM simulation model........................................................................................... 43
Figure 13: Queue spillback detection comparison. ....................................................................... 44
Figure 14: Comparison of estimated GTU for 5 seconds occupancy period. ............................... 47
Figure 15: Locating Dynamic Object Number in Dynamic Object setup file. ............................. 52
Figure 16: Defining total number of objects and listing the OIDs. .............................................. 52
Figure 17: Changing the IP address before executing the setup file............................................. 53
Figure 18: Dynamic object data structure (“DYNAMIC_SIGNAL_CONTROL.Lib"). .............. 53
Figure 19: Collaboration diagram for queue spillback detection and feedback. .......................... 54
Figure 20: Example source code illustrating interactions between tasks. .................................... 55
Figure 21: Variable type definitions in "DTC_GLOBAL_DEFS.LIB." ...................................... 57
Figure 22: Codes for displaying signal state on the webpage (main program). ........................... 59
Figure 23: Codes for inputting data to the Rabbit server from the webpage (main program). ..... 59
Figure 24: Comparison of signal status data (intersection 2). ...................................................... 72
Figure 25: Comparison of detector status (detector 5 of intersection 1)....................................... 73
Figure 26: Comparison of detector status (detector 7 of intersection 1)....................................... 73
Figure 27: Comparison of detector status (detector 4 of intersection 2)....................................... 74

An External Logic Architecture for Implementing Traffic Signal System Control Strategies iv
List of Tables
Table 1: Data Contained and Accessibility Status of the Objects ................................................ 12
Table 2: Input Variables to Define Network Topography ............................................................ 15
Table 3: Minimum Green Time Comparison for Data Reading Capability Test ......................... 28
Table 4: Phase Passage Comparison for Data Writing Capability Test........................................ 29
Table 5: Descriptive Statistics of Controller Response Time Data .............................................. 37
Table 6: Phase Max Green Comparison for Data Reading Capability Test ................................. 71
Table 7: Phase Passage Comparison for Data Reading Capability Test ....................................... 71
Table 8: Intersection 1 Phase 4 GTU Comparison (Paired t-Test) ............................................... 75
Table 9: Intersection 1 Phase 5 GTU Comparison (Paired t-Test) ............................................... 75
Table 10: Intersection 1 Phase 4 GTU Comparison (Paired t-Test with Hypothesized Mean
Difference) .................................................................................................................................... 75
Table 11: Intersection 1 Phase 5 GTU Comparison (Paired t-Test with Hypothesized Mean
Difference) .................................................................................................................................... 76
An External Logic Architecture for Implementing Traffic Signal System Control Strategies 1
Chapter 1: Introduction
This study investigates the possibility of implementing an external logic processor for real-time
signalized intersection performance measurement and control feedback of multiple intersections
in a traffic network. Using an external processor facilitates traffic control strategy research
addressing special operational circumstances such as queue spillback. Typically, newer model
traffic controllers have Ethernet connectivity and support data exchange using the National
Transportation Communications for ITS Protocol (NTCIP) 1202 communication protocol to
form an Ethernet based communication network of multiple traffic controllers. The architecture
can be implemented to resolve various operational problems; however, in this research, the focus
was to apply it in addressing the queue spillback problem. In this chapter, Section 1.1 provides a
brief overview that explains the rationale of the proposed research direction. Examples of
relevant research concepts are provided in Section 1.2, the state of current queue spillback
methods are explained in Section 1.3, and a summary of the problem statement is provided in
Section 1.4. The chapter concludes by summarizing the research objectives in Section 1.5.
1.1 Research Overview
Growing travel demand and limited capacity make efficient intersection operations difficult to
maintain. Traffic control devices are used to ensure efficient operations by allocating “green
time” (the duration of time when vehicles are allowed to move through the signalized
intersection) among different traffic movements based on their demands. However, the demand
scenario changes during the day and also during different times of the year. Therefore, an
effective traffic control system needs to be demand responsive. An actuated traffic control
system detects the traffic and responds by allocating the green accordingly so that the green
times are used effectively rather than being “unused and wasted” (the portion of green time when
there is no vehicle served). The controller, in an actuated system, serves a certain phase if it
receives a call from any of the detectors associated with that phase and terminates the service
once demand goes down, or there is a call for service at another conflicting phase. This demand
responsiveness of modern traffic controllers makes the operation more efficient. Furthermore, in
addition to the most frequently used traffic controller functions, some controllers have special
functions to add more options and flexibility in programming simple control logic, e.g., the
Econolite ASC/3 Controller has a built-in “Logic Processor.” However, this logic processor can

An External Logic Architecture for Implementing Traffic Signal System Control Strategies 2
only be programmed with very simple instructions. At this point, complex logic and program
instructions required to address special traffic scenarios, such as queue spillback, introduces the
need for using an external logic processor. While the traffic controller regulates the intersection
operation, this external processor can monitor the performance and look for operational issues by
collecting and processing data from the controller.
Additionally, for a traffic network of multiple intersections, the signal state and detector state
data from other intersections downstream or upstream to the subject intersection are necessary to
make a control algorithm for queue spillback scenarios. This data cannot be processed by the
traffic controller itself. The implementation of an external logic processor can make the data
processing and performance monitoring possible for multiple traffic controllers if these are
connected to a common network. For this research, the collected data were analyzed to make
decisions for queue spillback situations. A previously developed research methodology by
Ahmed (2009) attempted to address this problem by communicating with a controller at a single
intersection. The focus of this research is to employ a single external microcontroller to manage
operations of multiple intersections.
1.2 Relevant Research
Numerous research endeavors focused on improving the process of data collection, performance
monitoring, and control of signalized intersections. Technological advancements in this field
produced new techniques, including the application of external devices in the form of
microcontrollers. For example, Texas Transportation Institute developed a system to
automatically collect data that required additional data processing hardware to be in the cabinet
as well as count detectors placed in front of the stop bar. Smaglik (2007) developed an event-
based data collection system for generating actuated controller performance measures. They
developed an integrated general purpose data collection module that time-stamps detector and
phase state changes within a National Electrical Manufacturers Association (NEMA) traffic
controller. To facilitate this, the ASC/3 controller software was enhanced to include a data logger
to collect time-stamped controller and detector status and an ftp server to send data files hourly.
Liu (2008) built a system for high resolution traffic signal data collection and performance
measurement with support from the Minnesota Department of Transportation. The system, called

An External Logic Architecture for Implementing Traffic Signal System Control Strategies 3
SMART-SIGNAL (Systematic Monitoring of Arterial Road Traffic and Signals), was able to
simultaneously collect and archive event-based traffic signal data at multiple intersections and
automatically generates real-time performance measures including queue length, travel time, and
number of stops.
Ahmed et al. used a Rabbit microcontroller for data collection from ASC/3 traffic controllers,
performance monitoring, and control strategy implementation. Two microcontrollers on separate
networks were used to collect data from their respective traffic controllers connected to a
Hardware-in-the-Loop Simulation (HILS) network. In this research, a similar approach was
adopted, except that a single microcontroller was used to collect data from multiple traffic
controllers instead of using one for each of the traffic controllers (Ahmed, 2009).
1.3 State of Queue Spillback Methods
Addressing Queue Spillback
Previous research documents and addresses various causes of queue spillback congestion. Some
researchers addressed this at a local intersection level. Wu (2007) developed a method that
considers a queue spillback scenario stemming from having insufficient turning lane lengths.
Smaglik and Beaird worked with a method for modifying signal operations in response to
downstream intersection queue spillback (Smaglik, 2006; Beaird, 2006). Beaird mentioned
several reasons for flow restriction, including queue spillback from a downstream intersection, a
disabled or stalled vehicle in the flow, or a railroad blockage resulting from a slow moving
freight train (Beaird, 2006). Some other researchers focused on addressing queue spillback and
associated problems from a network-wide perspective. Tian developed a framework for
employing real-time adaptive diamond interchange control strategies based on two common
diamond interchange phase plans and addressed freeway on-ramp queue spillback (Tian, 2006).
Queue Spillback Detection Methods
Current queue spillback detection methods utilize two kinds of detection information: presence
and count. It is fairly common to place detectors at a distance from the stop bar to detect the
presence of a queue. Detector counts exist in research and in software proposing control
strategies to address queue spillback. A queue spillback detection method can be classified into

An External Logic Architecture for Implementing Traffic Signal System Control Strategies 4
two groups: i) responsive and ii) predictive. The first approach detects queue spillback when it
occurs, and the second approach predicts queue spillback before it occurs.
Some researchers worked on developing a responsive queue spillback detection method. Smaglik
developed an algorithm that integrates real-time stop bar presence detection with real time flow
rate information to identify a downstream flow restriction (Smaglik, 2006). The algorithm
measured headways using the detector status for the last 10 seconds of the green time. The flow
was considered to be restricted if the phase was green and the average headway for the previous
10 seconds was greater than a specified threshold value determined from historic data. Beaird
(2006) also developed an algorithm using the stop bar detection to detect queue spillback for a
phase. Conditions used to detect queue spillback were: (a) the phase is green and (b) the
detection zone is occupied for 10 seconds, and (c) the flow is zero or minimal (Beaird, 2006).
A predictive queue spillback detection method can define the position of the back of queue. The
queue length may increase even while it is being discharged until the discharge shock wave
reaches the last queued vehicle. Liu (2008) proposed a method of real time queue length
estimation to determine the position of the back of queue.
1.4 Problem Statement
Previous traffic control research has defined causes of queue spillback and its effect on approach
capacity. Some of this research goes as far as suggesting methodologies to determine control
strategies that prevent queue spillback or reduce the symptoms. However, these control strategies
were not implemented in an NTCIP compliant system. In addition, these strategies have not been
tested in real-time without requiring human intervention. Therefore, an architecture needs to be
developed that integrates NTCIP compliant traffic controllers and supports the implementation
of an automated real-time response for multiple intersection traffic control.
Previously, a system of queue spillback detection and control feedback was developed at the
National Institute of Advanced Transportation Technology (NIATT) (Ahmed, 2009). In that
system, the microcontroller used the NTCIP 1202 protocol for real-time data collection from the
ASC/3-2100 NTCIP 1202 compliant traffic controllers. Using NTCIP compliant controllers
allowed an external device to change traffic signal control parameters (such as maximum green)

An External Logic Architecture for Implementing Traffic Signal System Control Strategies 5
while operating. This opened the door for accelerated development and testing of control
strategies using HILS and a microcontroller. This capability allowed the application of a wide
range of control strategies. However, in the case of this previous work, the collection of data and
changing controller parameters was limited to the local intersection as the microcontroller could
only communicate with one traffic controller within the developed architecture. The need still
exists for improving the system architecture to enable the application of the control strategy
simultaneously and automatically over more than one intersection.
Previously developed control strategies by Ahmed (2009) were tested by a simulated real-world
network of two intersections and with actual traffic data collected from the field. The code
developed for this research was hard coded to work with the tested intersections. In order to
apply the program in other similar traffic networks, it needs to be flexible to readily
accommodate different controller settings and network configurations.
1.5 Research Objectives
In an effort to develop an improved architecture and to address queue spillback conditions, this
research achieved the following objectives:
Objective 1: Extending the current architecture developed at NIATT for the Smart
Signal System to implement proposed performance monitoring and control strategy
decisions automatically for a system of traffic controllers.
Objective 2: Incorporating performance measures, e.g., green time utilization (GTU),
into the queue spillback control decision making process.
Objective 3: Identifying potential opportunities for applying systems resembling the
proposed architecture, and transferring knowledge for future research.

An External Logic Architecture for Implementing Traffic Signal System Control Strategies 6
Chapter 2: The Architecture Description
This chapter describes the proposed architecture that was developed as part of the research with
an objective of extending a current architecture to support the application traffic control
strategies to more than one intersection. This chapter is organized into six sections. The first
section describes the specification and constraints of the hardware upon which the architecture
relies. The second section introduces the testing environment. The third section outlines the
program structure of the code used in the microcontroller. The fourth section gives an overview
of how a user would implement the architecture. The fifth section qualitatively assesses the
capabilities of the architecture. Finally, the sixth section briefly describes potential applications
of the proposed architecture.
2.1 Specifications and Constraints
The communication between the traffic controllers and the microcontroller was established in
research conducted by NIATT (Dixon, 2011). The NTCIP 1202 standard communication
protocol was used in the research to establish the communication. In this research, the same
platform was applied to establish the communication. This section describes the following: i) the
microcontroller and development environment, ii) the traffic controller communication and data
logging features, and iii) the relevant communication protocols. These three discussions describe
the hardware characteristics needed for the research and are necessary to understand the test
environment.
Microcontroller and the Development Environment
In a similar previous research endeavor of implementing external control logic by (Ahmed,
2009), the Rabbit 3000® microcontroller (Rabbit 3000A LQFP Microprocessor, manufactured
by Digi International) was chosen for the convenience of Ethernet connectivity support and
processing speed. For the same reason, this processor is used for this research. The clock speed is
55 MHz, which supports real-time data collection and control logic application. Faster products
are available, but the existing system was adopted to build on previous work.
The Rabbit 3000 processor is programmed using the Dynamic C software development system-
an integrated C compiler, editor, loader, and debugger created specifically for Rabbit-based

An External Logic Architecture for Implementing Traffic Signal System Control Strategies 7
systems. Developing software with Dynamic C enables the users to write, compile, and test both
C and assembly code without leaving the Dynamic C development environment, and no costly
in-circuit emulators are required. Full TCP/IP stack with source code is provided in Dynamic C.
In the previous research, the Dynamic Object-SMTP-UDP/IP-Ethernet protocol stack was used
to develop the libraries that facilitate the communication between the microcontroller and the
traffic controller. Selection of the same microcontroller and software development environment
provided the advantage of using the library files developed and tested in previous research (Digi
International, 2007).
The communication and data processing capability of the Rabbit microcontroller is limited by
the processing capacity of the controller, size of the dynamic data packets, number of traffic
controllers, and the physical network configuration. Chapter 4 quantifies the effects of these
limitations on the overall performance of the architecture.
Traffic Controllers
The ASC/3-2100 traffic controller was developed to comply with the NTCIP communication
protocol to achieve interoperability and interchangeability with computer and other electronic
traffic control equipments from different manufacturers. The ASC/3 traffic controller adopted the
NTCIP sub network level communication protocol, which includes all mandatory and optional
Dynamic Objects. This controller has optional Ethernet support for 10/100 Base T networks,
which enabled building the proposed network. It also allows the data exchange through the
Synchronous Data Link Control (SDLC) communication ports, which was not used in this
research.
Another very important feature of the ASC/3-2100 controller is its support for logging detector
volume and/or occupancy data. This feature is assignable by detector. Each of the detectors can
be configured for the controller to store the volume and/or occupancy data for a certain time
period, defined as “volumeOccupancyPeriod” in the NTCIP 1202 v01.07 definitions and it is
displayed as “NTCIP LOG PERIOD” in the ASC/3-2100 controller front panel.
An External Logic Architecture for Implementing Traffic Signal System Control Strategies 8
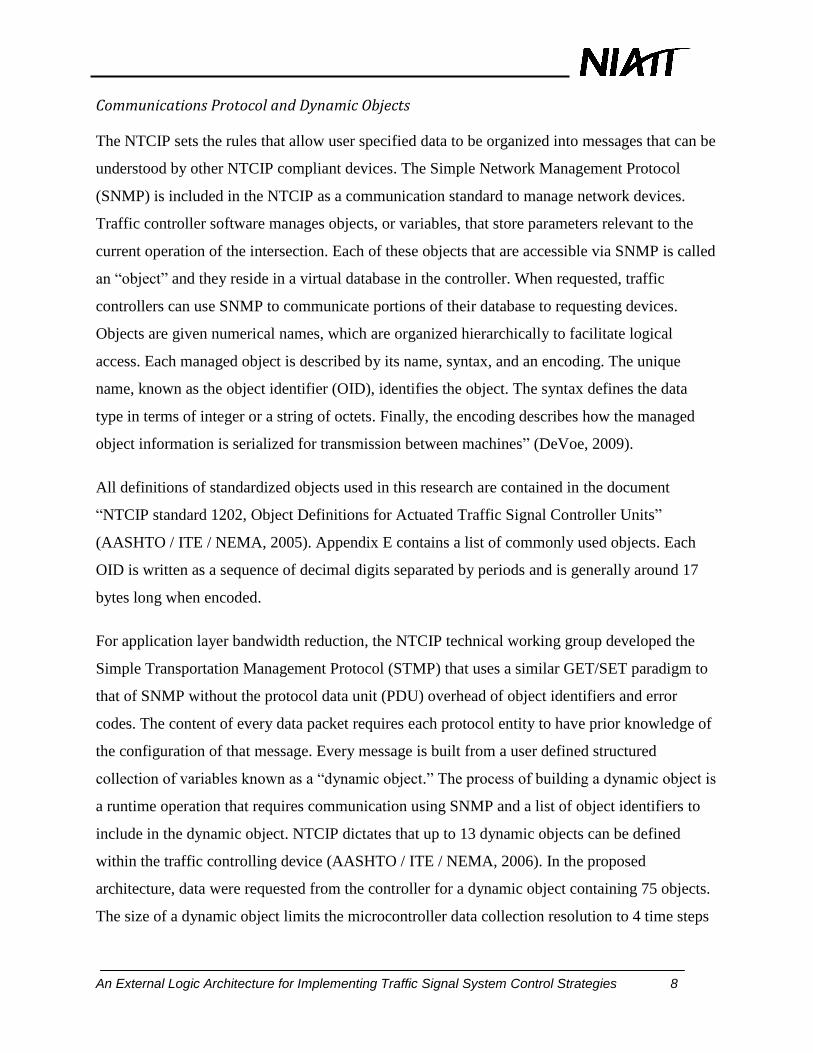
Communications Protocol and Dynamic Objects
The NTCIP sets the rules that allow user specified data to be organized into messages that can be
understood by other NTCIP compliant devices. The Simple Network Management Protocol
(SNMP) is included in the NTCIP as a communication standard to manage network devices.
Traffic controller software manages objects, or variables, that store parameters relevant to the
current operation of the intersection. Each of these objects that are accessible via SNMP is called
an “object” and they reside in a virtual database in the controller. When requested, traffic
controllers can use SNMP to communicate portions of their database to requesting devices.
Objects are given numerical names, which are organized hierarchically to facilitate logical
access. Each managed object is described by its name, syntax, and an encoding. The unique
name, known as the object identifier (OID), identifies the object. The syntax defines the data
type in terms of integer or a string of octets. Finally, the encoding describes how the managed
object information is serialized for transmission between machines” (DeVoe, 2009).
All definitions of standardized objects used in this research are contained in the document
“NTCIP standard 1202, Object Definitions for Actuated Traffic Signal Controller Units”
(AASHTO / ITE / NEMA, 2005). Appendix E contains a list of commonly used objects. Each
OID is written as a sequence of decimal digits separated by periods and is generally around 17
bytes long when encoded.
For application layer bandwidth reduction, the NTCIP technical working group developed the
Simple Transportation Management Protocol (STMP) that uses a similar GET/SET paradigm to
that of SNMP without the protocol data unit (PDU) overhead of object identifiers and error
codes. The content of every data packet requires each protocol entity to have prior knowledge of
the configuration of that message. Every message is built from a user defined structured
collection of variables known as a “dynamic object.” The process of building a dynamic object is
a runtime operation that requires communication using SNMP and a list of object identifiers to
include in the dynamic object. NTCIP dictates that up to 13 dynamic objects can be defined
within the traffic controlling device (AASHTO / ITE / NEMA, 2006). In the proposed
architecture, data were requested from the controller for a dynamic object containing 75 objects.
The size of a dynamic object limits the microcontroller data collection resolution to 4 time steps

An External Logic Architecture for Implementing Traffic Signal System Control Strategies 9
per second, i.e., the microcontroller can send and receive data at approximately every quarter of
a second.
2.2 Hardware Testing Environment
The testing environment was comprised of a traffic network developed using the VISSIM 5.30
simulation software, HILS using a NIATT controller interface device, Econolite ASC/3-2100
traffic controllers, and a microcontroller acting as an external data collection and control device.
Figure 1 shows the basic hardware elements and the connection types in the system. The
proposed architecture implements this environment in an extended form of a distributed traffic
control network with multiple traffic controllers. Chapter 3 provides a more detailed description
of the entire network and lab test-setup.
Figure 1: Hardware testing environment: HILS and microcontroller.
2.3 Program Structure
The main program and the associated libraries were developed in the Dynamic C 9.52
development environment. There are three principal libraries developed for this research that
take advantage of libraries provided by the Dynamic C software package. The first two libraries
contain the global definitions of data types for the variables used in the main program and other
libraries, and the traffic system definition inputs respectively. The third and the most important
library, which was previously developed and named as “Dynamic Signal Control Library,”
contains two basic sections: the first section establishes the communication with the controller by
sending data requests to the controller and receiving the data, while the second part processes the
data, measures performance (e.g., detects queue spillback), determines control decisions, and
sends data streams to the controller as feedback. This library was modified as part of this
research to accommodate the process of communicating with multiple traffic controllers. The
An External Logic Architecture for Implementing Traffic Signal System Control Strategies 10
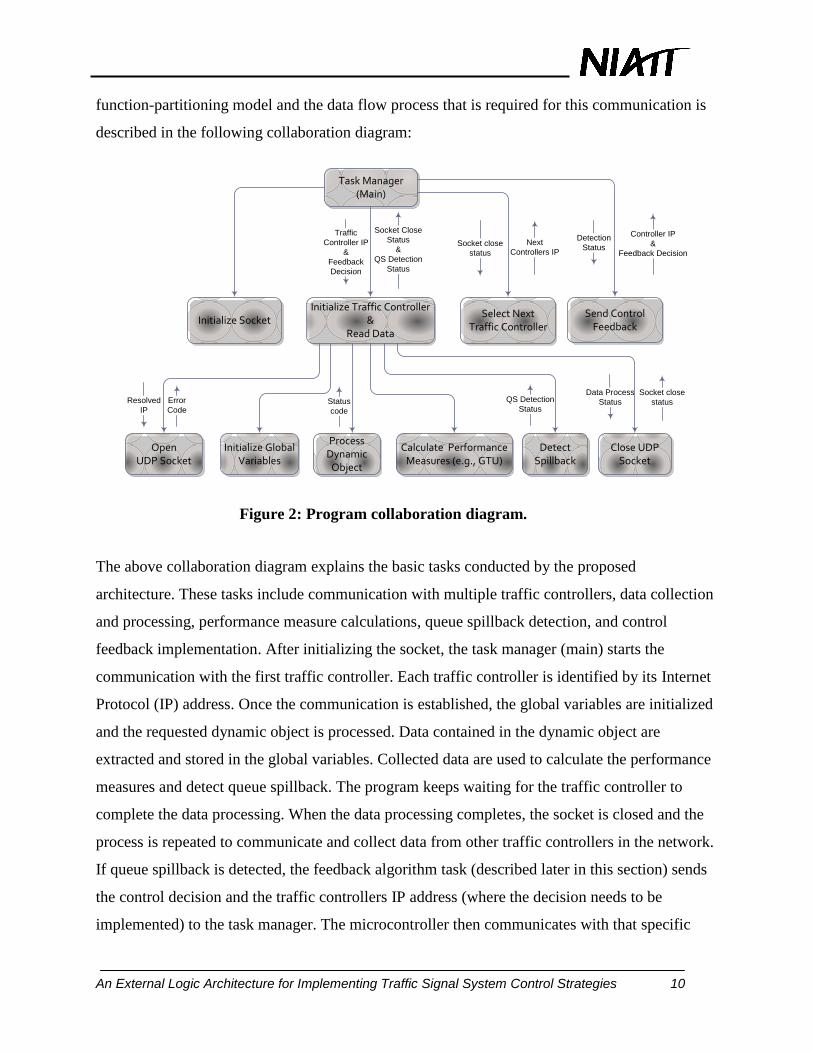
function-partitioning model and the data flow process that is required for this communication is
described in the following collaboration diagram:
Task Manager(Main)
Initialize SocketInitialize Traffic Controller
&Read Data
Traffic
Controller IP
&
Feedback
Decision
Open UDP Socket
Resolved
IP
Initialize Global Variables
Process Dynamic
Object
Error
CodeStatus
code
Socket Close
Status
&
QS Detection
Status
Select NextTraffic Controller
Calculate Performance Measures (e.g., GTU)
Data Process
Status
Close UDP Socket
Next
Controllers IP
Detect Spillback
QS Detection
Status
Send Control Feedback
Controller IP
&
Feedback Decision
Detection
Status
Socket close
status
Socket close
status
Figure 2: Program collaboration diagram.
The above collaboration diagram explains the basic tasks conducted by the proposed
architecture. These tasks include communication with multiple traffic controllers, data collection
and processing, performance measure calculations, queue spillback detection, and control
feedback implementation. After initializing the socket, the task manager (main) starts the
communication with the first traffic controller. Each traffic controller is identified by its Internet
Protocol (IP) address. Once the communication is established, the global variables are initialized
and the requested dynamic object is processed. Data contained in the dynamic object are
extracted and stored in the global variables. Collected data are used to calculate the performance
measures and detect queue spillback. The program keeps waiting for the traffic controller to
complete the data processing. When the data processing completes, the socket is closed and the
process is repeated to communicate and collect data from other traffic controllers in the network.
If queue spillback is detected, the feedback algorithm task (described later in this section) sends
the control decision and the traffic controllers IP address (where the decision needs to be
implemented) to the task manager. The microcontroller then communicates with that specific

An External Logic Architecture for Implementing Traffic Signal System Control Strategies 11
traffic controller and implements the change. The task also contains the instruction about when
to go back to the previous controller settings.
Request Data Task: Building Dynamic Object
The process of requesting data from a traffic controller using a dynamic object was explained in
section 2.1 of this chapter. However, it is necessary to explain how a dynamic object is built.
According to the definition given in this chapter, a dynamic object is a user defined structured
collection of variables, or objects, where each variable contains the data being requested. The
definition itself contains valuable information of the dynamic object building process. The first
part of this definition, “user defined collection of variables,” means that the content of the
dynamic object can vary and the user has freedom to choose different variables and to define the
size of the dynamic object for their purpose. Second, the variables have to be “structured,” which
indicates that the order of these variables inside the dynamic object must be known and given.
Therefore, the first step towards building a dynamic object is to identify which data are needed
from the traffic controller. Each of the traffic controller parameters has a unique NTCIP object
ID (OID) defined in SNMPv1202v107. The OIDs of the selected variables are collected and
ordered in proper sequence. It should be noted that the order of the OIDs is important, because
the traffic controller‟s response message packages the requested data in the same order. Table 1
shows the list of 12 objects that were used in this research to construct the dynamic object and
their data accessibility determined by the controller manufacturer. The first seven objects are
phase parameters and the following five are detector parameters.

An External Logic Architecture for Implementing Traffic Signal System Control Strategies 12
Table 1: Data Contained and Accessibility Status of the Objects
Name of the Object Data Stored Accessibility
phaseStatusGroupVehCalls Current call status of phase vehicle Read-only
phaseStatusGroupGreens Phase group green status Read-only
phaseStatusGroupYellows Phase group yellow status Read-only
phaseStatusGroupReds Phase group red status Read-only
phaseMinimumGreen Minimum green time of a phase Read-write
phaseMaximum Passage time of phase Read-write
phaseStatusGroupPhaseNexts Maximum green time of a phase Read-write
vehicleDetectorStatusGroupActive Detector status Read-only
detectorOccupancy Occupancy for a occupancy period Read-only
detectorVolume Vehicle counts for a occupancy period Read-only
volumeOccupancySequence Sequence number of occupancy period Read-only
volumeOccupancyPeriod Current occupancy period Read-write
Traffic System Definition Input
The advanced programming features of ASC3 traffic controllers allow traffic engineers to work
with various numbers of phases, different action plans, and flexible detector phase assignments.
However, it does not provide some very valuable information regarding the traffic network. As a
result, it is necessary to provide this information to the external logic processor, the Rabbit 3000.
For example, the researcher can define the network to the microcontroller in terms of how many
lanes a particular phase serves, which lane a particular detector monitors, or which upstream
phases contribute to traffic served by a downstream phase in the network. One objective of this
research is to develop the ability for researchers to define these network characteristic in order to
analyze various traffic scenarios with greater detail. A library file was developed as a first step
towards meeting this objective. The list of inputs and the added functionality of this library are
described in Section 2.4 of this chapter. A list of functions used in this library is also provided in
Appendix A.
Performance Measure Tasks
While the traffic simulation is running in the HILS environment, the microcontroller
communicates with all the traffic controllers in sequence. During this time, the microcontroller

An External Logic Architecture for Implementing Traffic Signal System Control Strategies 13
retrieves the detector occupancy and controller state information from all the traffic controllers.
Using the collected data, it calculates the performance measures for each intersection. In this
research, green time utilization was selected as the performance measure to derive a feedback
control decision. A new function was added in the “Dynamic Signal Control” library file for the
calculation of GTUs. Different sets of variables were defined to store the detector occupancy
information of different intersections. These data were used later to calculate the phase GTUs for
each intersection.
Feedback Algorithm Tasks
At times during queue spillback, the microcontroller executes decision logic to choose the
appropriate control strategy and communicate the control strategy settings to the traffic
controllers. The traffic controllers receive the decision and implement them during the
simulation in real-time. The task can be subdivided into three steps: i) detection of the queue
spillback by implementing the selected detection method, ii) derive a control decision from the
calculated performance measures, and iii) implement the control decision in one or more traffic
controller(s) by changing the desired controller parameter (e.g., phase split).
In the first step of the feedback algorithm task, queue spillback characterization logic was
programmed in the microcontroller to detect queue spillback. In this research, the detection logic
was developed based on the method proposed by Smaglik (2006). To program the logic in the
microcontroller, detector occupancy and signal status of the impeded upstream phase were
collected from the upstream intersection signal controller. When the logic detected a queue
spillback, the program moved to the second step to derive a control decision. In this step, the
performance measure task was recalled to calculate the phase GTUs at the downstream
intersection. From these calculations, some phases were identified for reducing the green splits to
give more green time to the bottleneck phase at the downstream intersection. In the final step,
new phase splits were written to the specific traffic controller for the phases identified in the
second stage.
An External Logic Architecture for Implementing Traffic Signal System Control Strategies 14
2.4 User Implementation
Implementation of the proposed architecture was facilitated in terms of inputting data and
outputting the network performance. The following sections entitled “data input” and “data
output” describe how this was accomplished.
Data Input
It is necessary for the program to support various traffic scenarios and intersection geometries
rather than being hard-coded for some specific cases. To ensure this program functionality, a
computer program was developed where the user was able to make inputs for the variables that
define the traffic network, including intersection geometry. All library functions were thoroughly
tested for desired outputs and properly documented for future application and modification. This
library, named “Network Topography.lib,” adds several functions to the program by allowing the
following network description information to be entered:
Distance between intersections
Intersection upstream/downstream relative to the traffic stream served by a phase
Upstream phases that contribute to a given phase
Traffic movements served by a phase
Lanes served by a phase
Phase served by a detector
Detector location in terms of lane and setback
Phase parameters (e.g., min green, max green, passage time, etc.)
To ensure the above mentioned functionality, user inputs were made through the “constants”
defined at the beginning of the library. These are actually variable information related to a
specific traffic network, however, in the library they were defined as constants so that they can
be modified easily. For user convenience and elimination of input errors, these constants were
listed in a text editor. After editing all the input values required to define a certain traffic
network, the section of the file that lists the constants and user defined values is copied to the
library before compiling and then executing the main program. The main input variables are
listed in Table 2. The first five variables establish the bounds to define arrays for the network.

An External Logic Architecture for Implementing Traffic Signal System Control Strategies 15
For example, “Max_nodes” defines the maximum number of intersections in a specific traffic
network that this program can handle.
Table 2: Input Variables to Define Network Topography
Name of the Variable Description
Max_nodes Maximum number of nodes allowable
Max_link Maximum number of links
Max_phase Maximum number of phases
Max_mvmnt_phase Maximum number of movements served by a phase
Max_lane_approach Maximum number of lanes in an approach
Distance[Nodes] Distance between the intersections
Number_lane[phase] Number of lanes serving a particular phase or movement
Mvmnt[phase] Movement associated with a given phase
Intx_number[Nodes] Intersection number for a network of multiple intersections
Det_number[lane] Detector numbers serving a certain lane
Det_position[lane] Detector position, i.e., distance from the stop bar
Data Output
This section describes two methods developed to monitor the traffic signal timing performance
in real-time while implementing the external microcontroller. The first method uses the software
output window, named “stdio” window for Dynamic C. Desired outputs were printed on the
“stdio” window in real-time. However, this is very problematic as the program updates and prints
the data several times in a second. To be able to monitor the performance with great ease, a web
based user interface was developed. Initially, the signal state of two intersections were displayed
and tested. However, other information that is of interest to the researchers like detector status,
performance measures data, or an error massage can be displayed as well. To accommodate this
additional information, further program instructions similar to that used for signal state display,
will be needed. The webpage can also be used to give input to the server (the Rabbit) by
applying HTML forms. To illustrate this functionality, a button (named “feedback” on the
webpage with a status display light) was provided on the webpage that can push a command (i.e.,
a control decision, like changing phase passage time) to the server, if pressed.

An External Logic Architecture for Implementing Traffic Signal System Control Strategies 16
Figure 3: Web-based user interface.
The webpage was given self updating capability that ensures the displayed information is
current. However, real-time display of the information is limited by the network speed, webpage
refresh rate, and Rabbit‟s capability to perform as a web server. It is important to remember that
the Rabbit can perform multiple tasks, but only one at a time. For example, it collects
information from multiple traffic controllers, processes those to estimate the performance
measures, and sends feedback to the controllers in sequence. Therefore, serving a webpage with
too much functionality can increase the processing burden to an extent where it might stop
running the program.
2.5 Architecture Assessment
The architecture offers an efficient method for collecting information from the traffic controllers.
The overall signal control system effectiveness was improved by implementing an Ethernet
based infrastructure and connecting multiple information sources, i.e., traffic controllers. The
system described has the capability for improved communications that can result in more reliable

An External Logic Architecture for Implementing Traffic Signal System Control Strategies 17
operations and a higher degree of functionality. The purpose of this section is to qualitatively
assess the proposed architecture in terms of performance and possible applications.
Quick Experiment Implementation
Devices like the Rabbit microcontroller and traffic controllers are readily able to communicate
using NTCIP protocols. The testing environment resembles the field conditions, which offers
increased testing accuracy and consistency. Furthermore, for small traffic networks, the test
setup and data collection process can be done in a short amount of time which makes the system
applicable for testing a wide range of traffic conditions and working out possible solutions fairly
quickly.
Low Cost Entry to Traffic Control Strategy Development
The architecture described in this research can be implemented to develop new methods for data
collection and performance evaluation. The communication with the controllers is direct and the
implementation method in the field will be simple and cost effective, given reliable Ethernet
communications and consistent NTCIP 1202 implementation. The only cost involvement for the
system is an external microcontroller (e.g., the Rabbit, that comes with its own C based software
development environment), and the hardware required for networking, e.g., switch/hub.
Therefore, the system has the potential to create research or beta product (i.e., microcontroller
and the program) that can act as a precursor for formal inclusion in traffic controllers.
Supports a Multiple-Controller System
The biggest advantage of the proposed method is that it is capable of connecting multiple traffic
controllers in a single Ethernet based distributed network. This offers the collection of traffic
state information from multiple intersections. This is a substantial improvement over the
previously developed system where a microcontroller could only communicate with one traffic
controller. In contrast, the proposed architecture connects multiple traffic controllers with a
single microcontroller. This significantly reduces the number of logic processors, making it more
cost effective and improves coordination of the monitoring and control activities.

An External Logic Architecture for Implementing Traffic Signal System Control Strategies 18
Limited Network Size
Although the proposed system has advantages for developing traffic control strategies, it has
limitations. The limitations are mainly posed by the microcontroller‟s data processing ability and
the data transferring speed through the network. These limitations become important for time
dependent data (e.g., signal and detector state information), because they need to be
communicated with very short lag time for real-time control.
For information that does not vary with time (e.g., phase minimum green, phase passage, cycle
length, or the offset settings in the controller) the time gap will not be problematic. However, the
signal and detector state data might become too old for use. Fortunately, the ASC/3 traffic
controller has an advanced feature of detector occupancy and volume data logging. This logging
feature was used in this research instead of requesting detector state in real-time. Signal state is
less sensitive to the lag time and should not be too old for situations with lags less than 1 or 2
seconds.
2.6 Suggested Work
The proposed system can be used to apply various control decisions related to a specific traffic
network. However, there is still scope for development before full scale implementation. This
section is focused on suggesting future work needed to improve the performance of the
architecture.
Alternate Traffic Controllers
Although this experiment works well with the Econolite ASC/3, in order to achieve industry
adaptation, the system should be tested on other (Ethernet enabled) traffic controllers that
conform to NTCIP 1202 standards.
Substitute with Complete Controller State Log
Recently, the ASC/3 controller software was enhanced to include a data logger to collect time-
stamped phase and detector state changes. Controller storage allows for more than 24 hours of
raw data. These raw data are stored in a binary file on the controller in the format of 100
millisecond time-stamped phase and detector state changes. Data can be retrieved from the

An External Logic Architecture for Implementing Traffic Signal System Control Strategies 19
controller by using a transmission control protocol/Internet protocol network connection, where
the controller serves as a file transfer protocol (FTP) server (Smaglik, 2007).
Once downloaded from the controller, a Windows-based wizard can be used to convert the
binary data files into comma-separated-value (CSV) files for use in producing the appropriate
reports. The maximum size of the compressed data logs for one hour is less than 100 kb, which
can be downloaded and converted into CSV files to produce performance measures such as
arrival type, delay, volume-to-capacity (v/c) ratios, or served volumes. These data files could
provide a more efficient means of gathering the detailed complete controller state data necessary
for developing and running control strategies.
Expand User I/O Interface
The web based user interface developed as part of this research has limited functionality in terms
of user data input capability and displaying performance measure data. The interface has been
introduced in a basic form to demonstrate the convenience it avails to future users. The signal
status of two intersections was displayed, although any other data, e.g., detector state, detector
count, detector occupancy, and performance measure data could be displayed as well. Expansion
of the user interface could allow the user to input the traffic network description data from a
visually appealing webpage to the microcontroller program. Thus eliminating the need to directly
edit the library file developed for this research.
Wireless Connection to Enable Vehicle-Infrastructure Prototype Work
Connected Vehicle (CV) represents a new paradigm for surface transportation (AASHTO, 2006).
It is a cooperative effort between federal and state departments of transportation (DOT's) and
automobile manufacturers. Together they are evaluating the technical, economic, and social
feasibility of deploying a communications system that will be used primarily for improving the
safety and efficiency of the nation‟s road transportation system. CV presents opportunities to
advance surface transportation safety, mobility, and productivity through cost effective wireless
communications between vehicles and the infrastructure. CV will support vehicle-to-
infrastructure communications for a variety of vehicle safety applications and transportation
operations. CV also enables the deployment of a variety of applications that support private
commercial interests, such as vehicle manufacturers. On-board and roadside equipment will

An External Logic Architecture for Implementing Traffic Signal System Control Strategies 20
provide data to the applications that will process it for different uses and then send information
back to the users.
The communication standard being used in this research, i.e., NTCIP, establishes protocols to
communicate with roadside and other traffic management devices. If a microcontroller with
wireless communication ability, e.g., Rabbit 5000 is implemented in the proposed system of
networked traffic controllers, then it might be possible to integrate the system with CV. This will
directly collect the data from the vehicles and other roadside devices and inform the drivers of
system performance updates.
Adopt a Faster Microcontroller
For this research, a Rabbit 3000 microcontroller was used with Dynamic C 9.52 development
software. However, this processor and the development environment is not the latest from
Rabbit. Moving to a faster processor (e.g., Rabbit 5000, PSoC 5, etc.), could yield better
performance in terms of code execution and data processing time in the microcontroller. This
would allow processing more complex instructions and control a larger system of traffic
controllers.
Application of the Rabbit 5000 microcontroller in the proposed network is expected to bring
significant improvement in the system performance for its faster data processing speed and better
network connectivity features. PSoC 5 might also be a viable replacement for Rabbit 3000. PSoC
5 is a powerful low cost device powered by the “PSoC Creator” Integrated Development
Environment that supports C based program instructions. PSoC Creator has a user friendly
graphical design editor to form a hardware/software co-design environment. Programming in
PSoC is also facilitated by the integrated source editors, and built-in debugger of the PSoC
Creator.
Transferring Knowledge
This research is an effort to improve the techniques previously developed to implement external
logic processors as performance monitoring and decision making devices. The previously
developed architecture was enhanced by making it possible for one microcontroller to
communicate with multiple traffic controllers, instead of a single controller. This enhanced

An External Logic Architecture for Implementing Traffic Signal System Control Strategies 21
system will offer greater flexibility to traffic engineering researchers by extending their test
ground to a network of multiple intersections. With this extension, researchers will be able to test
more comprehensive control strategies. However, any future development with the enhanced
system will require researchers to have knowledge in the following areas, in addition to traffic
signal systems operations:
Software development environment, e.g., Dynamic C development environment.
NTCIP dynamic object management (objective definition, requesting/sending, and
reading/writing).
In an effort to educate future researchers and traffic engineering students, a brief description of
the Dynamic C development environment, the NTCIP communication standard, dynamic
objects, and the data requesting tasks are presented in Chapter 6.

An External Logic Architecture for Implementing Traffic Signal System Control Strategies 22
Chapter 3: Test Setup and Data Collection
This chapter describes the detailed test setup established in the NIATT lab to test and validate the
quality of communications between the Rabbit 3000 microcontroller and a system of multiple
traffic controllers. The data collection process from multiple traffic controllers is also presented
in this chapter.
3.1 Lab Test Setup
The architecture supports an NTCIP compliant automated environment, where the basic elements
were described in Chapter 2. To the extent possible, the equipment used in this test environment
is based upon standard industry products. Figure 4 describes the actual arrangement of the
hardware devices used for the lab test.
Hardware Devices
The architecture is based on a 10 Mbps Ethernet backbone. The list of hardware, as shown in
Figure 4, includes the following elements:
Element 1: Rabbit Semiconductor RCM 3000 series microcontroller.
Element 2: Eight network accessible Econolite model ASC/3-2100 NEMA TS2 Type 2
traffic controllers.
Element 3: Eight Controller Interface Devices (CID), one for each of the traffic controllers
for HILS implementation.
Element 4: Four computers to run VISSIM simulation software.
Element 5: Two network switches/hubs to communicate Ethernet messages between the
traffic controllers and the microcontroller for data retrieval and management.
Element 6: NIATT local area network infrastructure was used for displaying information on
the webpage, where the Rabbit microcontroller functioned as the server.

An External Logic Architecture for Implementing Traffic Signal System Control Strategies 23
To load the program on the microcontroller, a computer (one of the four, shown in Figure 4) was
used. It was connected with the Rabbit through a serial connection. Once the program was
loaded to the microcontroller, the computer was no longer required to be connected.
Figure 4: Communication architecture of the proposed system.
Software
VISSIM 5.30 simulation software was used to implement HILS and the Dynamic C 9.52
development environment was used to load the C based program developed for this research into
the Rabbit. Out of eight traffic controllers, five were running on operating system version
V2.46.00, and the remaining three were running on version V2.40.00. However, no permanent
substitution for changing controller firmware and system software was needed as the Rabbit was
able to communicate with traffic controllers with different operating system and firmware
versions.

An External Logic Architecture for Implementing Traffic Signal System Control Strategies 24
Simulation Network
The simulation used for this research emulated a real-world network of two intersections along a
coordinated corridor in Lynnwood, WA. The two intersections were the I-5 south bound off-
ramp intersection and the Ash Way intersection at 164th St SW, shown in Figure . The two
intersections were 400 ft apart from each other. The major street is 164th
Street with the
eastbound and westbound movements coordinated. The intersection on Ash Way experiences
queue spillback because of heavy westbound traffic, heavy traffic coming from the I-5-off ramp,
and a short queue storage between the two intersections. This queue spillback occasionally
blocks the I-5 off ramp intersection and breaks down the normal performance, which makes it an
ideal case for applying the queue spillback control logic.
Figure 5: Traffic network applied in the simulation.
Nort
h
Ash
Way
I-5 O
ff r
amp
164th
St SW

An External Logic Architecture for Implementing Traffic Signal System Control Strategies 25
Communications
The communication and data transfer occurring in the architecture can be classified into two
main categories: i) communication between the simulation and the traffic controller that happens
in HILS and ii) communication between Rabbit and the traffic controllers. All the traffic
controllers and the Rabbit were assigned a unique IP address through which each of the devices
is identified in the network during the data transfer process. Network switches facilitated this
communication by guiding each data packet to its correct destination.
The Rabbit, given the IP address 192.168.1.10, initiates the dynamic object request to one of the
traffic controllers in the network. The first traffic controller was given an IP address of
192.168.1.4, and for remaining controllers only the last digit was changed to form a new unique
IP address. Once the Rabbit receives a response from the traffic controller, the main program
determines the next controller from which to request data and sends a request to its address. Any
number of traffic controllers can be included in this communication sequence. However, it will
take longer to complete the sequence and update data for a given controller as the number of
controllers increases.
3.2 Data Collection
To validate the proposed architecture, the data were collected from two sources. First, the signal
and detector state data and the performance measure data were collected from the text file
generated by Dynamic C for the outputs printed on the “stdio” window after each data read cycle
(about every third of a second). Second, the signal and detector state data were collected from the
simulation output (*.LDP file) printed every tenth of a second by VISSIM.
The VISSIM simulation file was run on four different computers, as shown in Figure 5. Four
computers were used to minimize communication latency problems. Ideally, for a full scale test
with eight networked traffic controllers, eight CID/controller pairs should be connected with the
computer that runs the simulation and the simulation should contain eight intersections (one for
each CID/controller pair). However, previous research found that HILS latency increases with
the number of CIDs. This is because increasing quantities of CIDs trying to communicate with
the simulation at the same time can slow down the simulation. This is undesirable for this test,
because the traffic controller processes information in real-time, so the data collected from the

An External Logic Architecture for Implementing Traffic Signal System Control Strategies 26
two sources will become unsynchronized due to this latency. As a result, each of the four
computers was connected with two traffic controllers for the HILS network, where one traffic
controller controlled the intersection on Ash Way and the other controlled the I-5-off ramp
intersection.
Data were collected in three stages:
1. To test the data exchange capability for static data (e.g., phase parameters), phase
minimum green, phase passage, and phase max green data were requested from all eight
traffic controllers. To ensure that the collected data resembled exactly what was stored in
the controllers, each controller was programmed with different parameter values.
2. To validate the proposed architecture, data were collected for phase status, detector
actuation and occupancy status and detector volume from two sources, the Rabbit and the
VISSIM output file. Information from the two files was compared to observe the
difference, if any. Data were collected from two controllers (one for Ash Way and
another for the I-5-off ramp intersection) for a 15 minute period.
3. The Response time (time required to collect data from one traffic controller) data were
collected for varying numbers of traffic controllers, e.g., 1, 2, 3…, 8 controllers. Varying
the number of traffic controllers changed the number of requests for controller data. A 15
minute period was used to collect data for each condition.
An External Logic Architecture for Implementing Traffic Signal System Control Strategies 27
Chapter 4: Method Validation and System Size Limitation
The main contribution of the proposed architecture is to demonstrate the ability of a
microcontroller external to the traffic controller to accumulate data from multiple traffic
controllers and use the data to derive control decisions. The architecture was validated by
presenting the data collected by the microcontroller and comparing it to the ground truth data
recorded by VISSIM. This comparison is the primary objective of this chapter. This chapter
contains four sections that discuss the results of different tests. The purposes of these sections are
summarized in the list below:
Section 4.1 Data Exchange Capability Test: summarizes the proposed architecture‟s capability to
read and write controller settings with a network of eight controllers.
Section 4.2 Data Validation: summarizes the proposed architecture‟s ability to acquire different
data types (phase status, detector status, five second detector occupancy logs, and five second
detector volume logs).
Section 4.3 System Size: quantifies the incremental effect of adding a controller to the
architecture in terms of controller response time and data read cycle. Response time is the time
from when the microcontroller initiates the request data task to the time it receives the data. The
data read cycle is the time transpired between two consecutive times the microcontroller receives
data from a given traffic controller.
Section 4.4 Summary: summarizes the findings of the previous three sections.
4.1 Data Exchange Capability Test
The data exchange capability of the microcontroller with a single traffic controller has already
been tested in previous research conducted by Ahmed (2009). However, a multi-controller
environment targeted by this research needs to be tested. The first step is to test the data read and
write capability of the Rabbit. It should be capable of reading any data readable through the
NTCIP from any traffic controller connected in the network. It should also be capable of
modifying a read-write accessible controller parameter of any traffic controller. The test was
conducted to prove the Rabbit possess both of these capabilities. The test was done in two

An External Logic Architecture for Implementing Traffic Signal System Control Strategies 28
phases, first with data that do not vary with time, e.g., phase parameters and then, later with the
data that vary frequently with time, e.g., signal status.
Reading Phase Parameters
To test the Rabbit‟s data reading ability, three phase parameters, namely minimum green,
maximum green, and phase passage parameters, were selected to read from all eight traffic
controllers and these values were compared to what was manually programmed in each of them.
A comparison of the actual input values to what was read by the microcontroller is shown in
Table 3. The values are listed for all eight phases and for all eight traffic controllers. From this
table it can be seen that all of the parameter values match. This shows that the Rabbit is capable
of extracting information correctly from traffic control devices connected through an Ethernet
network. A similar comparison of phase maximum green and phase passage resulted in the same
level of accuracy which is shown in Appendix B.
Table 3: Minimum Green Time Comparison for Data Reading Capability Test
Writing to Traffic Controllers
The microcontroller needs to be able to change some parameters in traffic controllers when it
changes control strategies. The microcontroller‟s feedback decisions to the traffic controllers is
usually implemented by changing values of some parameters that have write access like phase

An External Logic Architecture for Implementing Traffic Signal System Control Strategies 29
splits, phase minimum or maximum green, phase passage time, offset, and cycle length. To test
the data writing capability, the Rabbit was instructed to change the phase passage time, offset
and cycle length to some specific values. Table 4 shows the comparison between the phase
passage time values that the Rabbit wrote to the traffic controllers and the values manually read
from the traffic controllers. Similar to the previous test, the values match. This demonstrates that
the microcontroller can modify traffic control parameters in multiple traffic controllers with a
single program instruction.
Table 4: Phase Passage Comparison for Data Writing Capability Test
4.2 Data Validation
As shown earlier, the microcontroller can exchange data to and from at least eight traffic
controllers using the proposed architecture. The data exchange capability presented was only for
data that do not vary in time unless a traffic controller‟s action plan changes. However, precision
in real-time reading of time-varying data, such as signal status and detector status, is another
matter. For signal and detector status, a long time elapse between two successive data reads is a
big concern, because it inaccurately represents intersection operations. To accurately and
efficiently test the effects of network size, factors affecting the response time must be isolated
An External Logic Architecture for Implementing Traffic Signal System Control Strategies 30
from factors affecting the data read cycle. This section quantifies the effect of the response time
on data validity for a network containing two traffic controllers. Network size effects on
response time and data read cycles will be quantified later in section 4.3.
For a single controller, the response time is between 250 milliseconds to 300 milliseconds.
Unfortunately, this response time increases when cycling through communications with more
than one traffic controller. Therefore, to validate the performance of the architecture, the
microcontroller needs to cycle through data requests with more than one traffic controller and
then compare this with the simulation data. To validate the performance of the proposed
architecture with time dependent data, a network of two traffic controllers was used for data
collection and analysis. The collected data were analyzed to extract the phase status, detector
status, logged detector occupancy, and logged detector volume. Comparisons of the data were
made to analyze any inconsistencies.
Phase Signal Status Comparison
The phase status information was extracted from both the Rabbit microcontroller and the
VISSIM output files, as described in section 3.2 of the previous chapter. For both intersections,
the status of phases 2 and 4 was reported by the microcontroller and the simulation. The phase
status data are presented side by side in Figure 6 to illustrate any mismatches. In the figure,
“Intersection 1” refers to the intersection on Ash Way. Phase 2 and 4 were chosen to cover
possible variations in traffic scenarios. Phase 4 is the coordinated phase for both intersections
and it has the highest split demand. Phase 2 is the minor street phase conflicting with phase 4,
and this is the case for both intersections. The phase status was reported for a 15 minute period,
starting from 300 seconds of simulation time and ending at 1200 seconds. As shown in Figure 6,
the two data sets are in close agreement with a slight variation of the microcontroller data
lagging the simulation data. This variation is explained in more detail later in this chapter. The
signal status comparison for the I-5 Off-ramp intersection gave similar results and is given in
Appendix C.

An External Logic Architecture for Implementing Traffic Signal System Control Strategies 31
Figure 6: Comparison of signal status data for intersection 1 (Ash Way).
Detector Status Comparison
Like the signal status, detector status is also subject to change in small time steps. In fact,
detector status changes much more frequently on a sub-second scale. Furthermore, detector
status represents the vehicle at an intersection, and as such, it plays an important role in
signalized intersection operations.
To compare the detector status data, two detectors were selected from both intersections. Similar
to the phase status test, one detector serves a coordinated phase and the other serves a minor
street phase. Detectors 5 and 7 were selected for the Ash Way intersection, and detectors 3 and 1
were selected for the I-5-off ramp intersection. Detector status data were collected for a 15
minute period from both sources. This increases the sample size and the range of observed
conditions. Figure 7 shows representative results comparing detector status between
microcontroller and simulation data for detector number 1 of the I-5-off ramp intersection. The
other three detectors‟ status comparison graphs are similar and are included in Appendix D.

An External Logic Architecture for Implementing Traffic Signal System Control Strategies 32
Figure 7: Comparison of detector status.
In Figure 7, the Y-axis contains the difference in detector status. The line represents the
difference in detector status, where a positive reading indicates a portion of time in which the
simulation detector status is on, but the microcontroller detector status was off. A negative
reading represents the opposite scenario. For example, at 345 seconds, the line is positive
showing that the simulation detector was on, but it was off according to microcontroller data.
The mismatch in the data mainly happens due to the difference in resolution of the two
environments. The controller response time is about 250 - 300 ms, whereas the simulation
collects data at every 100 ms. In addition, the variation of the controller response times results in
some inconsistencies. In Figure 7, there are two noticeable areas of mismatch marked by circles,
one between 550 to 600 seconds and the other at 800 seconds. In these two areas, there are
several closely spaced mismatches, which indicate that the Rabbit is receiving calls from the
detector, whereas in truth there is no incoming call according to the simulation.
Even though the total amount of mismatched cases are significantly higher than that of a single-
traffic-controller network, all of these cannot be interpreted as losing detector calls or losing the
detection of vehicles, which is demonstrated later in this section. As explained above, most of the
mismatches happened due to the difference in reporting times of the two sources. These small
detector status time differences should not pose a problem for performance measurement
-1
-0.5
0
0.5
1
300 350 400 450 500 550 600 650 700 750 800 850 900 950 1000 1050 1100 1150 1200
Dif
fere
nce
in S
tatu
s
Time (Seconds)
Detector 1 of Intersection 2: Status Comparison Difference in Status

An External Logic Architecture for Implementing Traffic Signal System Control Strategies 33
purposes. However, increasing the number of controllers will further decrease the accuracy,
because the controller response time will accumulate to further increase the lag between the
simulation data and the microcontroller data.
Detector Occupancy Comparison Using Five Second Detector Logs
This test was conducted to demonstrate that in the proposed architecture the microcontroller is
capable of detecting vehicles using a detector occupancy log accumulated by, and received from,
eight controllers. Detector occupancy data were used in the green time utilization calculation and
in the queue spillback detection method. The microcontroller needed to collect this data fairly
accurately for the correct estimation of green time utilization and accurate detection of queue
spillback. To conduct this test, detector occupancy data for five second intervals were collected
from the traffic controllers. Then the detector state data were collected from the simulation and
the occupancies were accumulated for 5 seconds to compare with the microcontroller data.
Figure 8 shows the comparison of the occupancy data collected from the two sources for a 15
minute period. From the comparison, it can be seen that there is no significant discrepancy that
would pose a problem for performance measurements and queue spillback detections. This is
interesting to note, given the variations in the detector status data, indicating that the detector
status differences are insignificant for 5 second aggregation.

An External Logic Architecture for Implementing Traffic Signal System Control Strategies 34
Figure 8: Comparison of detector occupancy from 5-second logs.
Detector Volume Comparison Using Five Second Detector Logs
This test was conducted to demonstrate that in the proposed architecture the microcontroller is
capable of detecting vehicles using a detector volume log accumulated by, and received from,
controllers. As seen earlier from the detector status test, detector status logged by the Rabbit
microcontroller was frequently mismatched, which justifies using the detector volume log. An
explanation is necessary to further support this decision.
The response time of a traffic controller is about 300 ms, which means that for a system of two
controllers, the microcontroller will take about 600 ms between two successive data packets from
a particular traffic controller. If the intersection is on a road with a design speed equal to 30 mph,
a 20 ft vehicle will take about 590 ms to traverse a 6 ft detector. Therefore, it is likely that the
microcontroller will miss this vehicle‟s detection.
As a result of these findings, traffic controller detector volume logs were used in the remainder
of this research to improve detector reporting accuracy. Specifically, the ASC/3 detector logging
setting “volumeOccupancyPeriod” was set to 5 seconds.
0
20
40
60
80
100
300 400 500 600 700 800 900 1000 1100 1200
De
tect
or
Occ
up
ancy
(%
)
Simulation Time
Detector 5 of Intersection 1: Occupancy Comparison
Microcontroller Simulation

An External Logic Architecture for Implementing Traffic Signal System Control Strategies 35
Figure 9: Comparison of detector volume.
Vehicle counts for detector 5 of the Ash Way intersection are shown in Figure 9. The X-axis
represents the time interval and the Y-axis represents detector volume. Data presented in the
figure constitute a 15 minute period of simulation. Only in a few cases do the detector volumes
differ. Illustrative cases are circled in the graph. It was observed from the data that occasionally
the controller detector volume log did not count a vehicle in a given 5 second period, when the
simulation did count it. However, in almost all such occasions, the log does count the vehicle in
the following period. In order to quantify the vehicles that were left uncounted, the total number
of vehicles was counted for the whole duration of the data collection. For instance, the total
number of vehicles counted on detector 5 logged by the controller was 136, while the simulation
count was 138. This difference is smaller than typical detection error that could be seen in the
field (Bullock, 2004; Haoui, 2008). In addition, the detector data will only be used to estimate
aggregated performance measures, not for phase service calls or green extension. Given these
two points, the accuracy of the Rabbit‟s counts is adequate.
4.3 System Size
Although any number of traffic controllers can be connected in the proposed network, the data
validation was only completed using eight controllers for the controller setting data. Detector and
phase status data validation was performed with two controllers. However, it was an objective of
0
1
2
3
300 400 500 600 700 800 900 1000 1100 1200
De
tect
or
Vo
lum
e
Simulation Time
Detector 5 of Intersection 1: Volume Comparison Microcontroller Simulation
An External Logic Architecture for Implementing Traffic Signal System Control Strategies 36
this research to identify the problems associated with the increase in network size, i.e., the
number of traffic controllers. This section will relate the findings in the previous two sections to
variations in network size.
The size of the network is mainly restricted by two facts: i) the response time of the controllers
increases with the increase in network size, and ii) for a large network the time required for the
microcontroller to complete one data read cycle will exceed the specified detector logging period
and be too long for a reliable sampling rate. As presented earlier in this chapter, the
microcontroller can communicate with eight traffic controllers to retrieve data. However, the test
was conducted with controller setting information, which is not time sensitive. If the data
changes frequently, some data will be lost, and this data loss is a function of the network size and
controller response time. This section describes the issues regarding the system size in light of
controller response time and the duration of data read cycle.
Response Time
In this research, response time was defined as the time elapsed to complete a data read sequence
for a traffic controller that is on a network containing other traffic controllers. It can be
subdivided into three components: i) time taken by the microcontroller to process and send a
request to a specific traffic controller in the network, ii) time taken by the controller to process
the requested data and to send it back to the microcontroller, and iii) time taken by the
microcontroller to process the requested data and end the communication before starting another
data read sequence with the next traffic controller in the network. The process also includes the
latency, which is the delay incurred in communicating a message (the time the message spends
on the wire). Changes in latency are typically unavoidable through changes to the code, because
it is a resource issue, which is affected by hardware adequacy and utilization. It is also important
to notice that the microcontroller takes time to process other instructions in the program source
code to perform other tasks, like processing the control logic. For example, when the
microcontroller was asked to output the signal status data for eight phases, the response time was
about 285 ms. On the other hand, the time increased to about 295 ms to output the detector
volumes for all 20 detectors. For the first case, the microcontroller went through a task only eight
times, compared to twenty times in the second case. Therefore, the response time also varies with
the amount of C instructions used by the control logic.
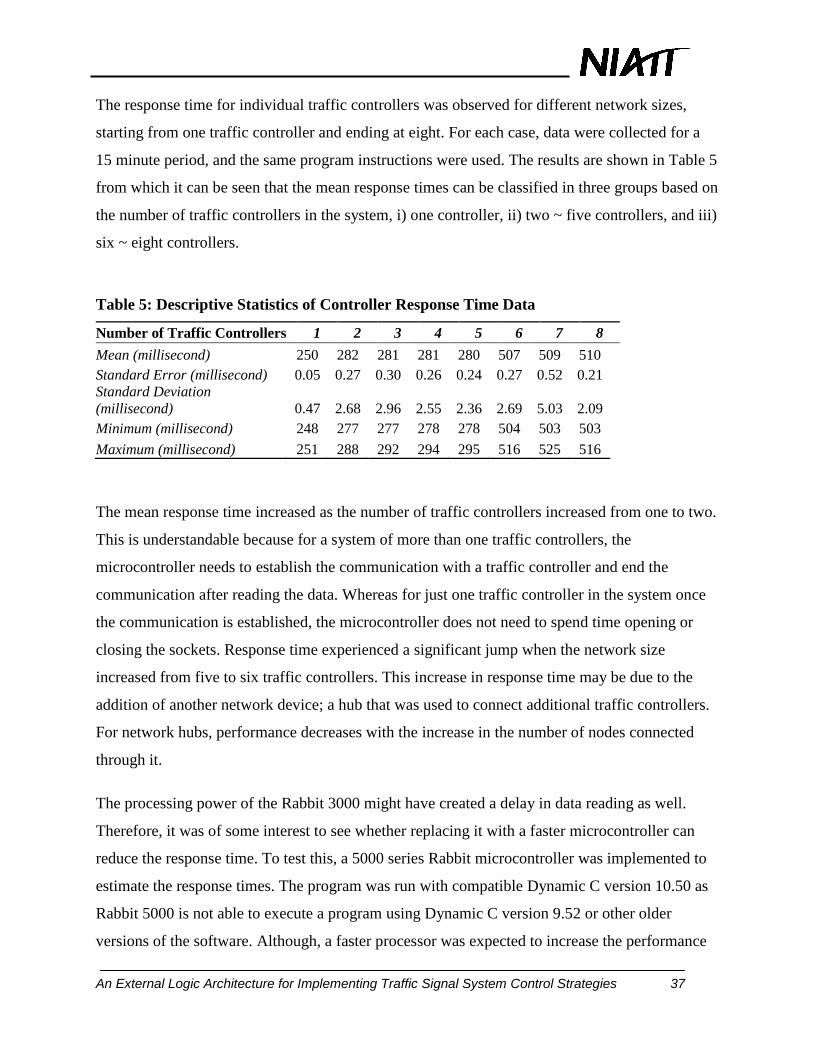
An External Logic Architecture for Implementing Traffic Signal System Control Strategies 37
The response time for individual traffic controllers was observed for different network sizes,
starting from one traffic controller and ending at eight. For each case, data were collected for a
15 minute period, and the same program instructions were used. The results are shown in Table 5
from which it can be seen that the mean response times can be classified in three groups based on
the number of traffic controllers in the system, i) one controller, ii) two ~ five controllers, and iii)
six ~ eight controllers.
Table 5: Descriptive Statistics of Controller Response Time Data
Number of Traffic Controllers 1 2 3 4 5 6 7 8
Mean (millisecond) 250 282 281 281 280 507 509 510
Standard Error (millisecond) 0.05 0.27 0.30 0.26 0.24 0.27 0.52 0.21 Standard Deviation
(millisecond) 0.47 2.68 2.96 2.55 2.36 2.69 5.03 2.09
Minimum (millisecond) 248 277 277 278 278 504 503 503
Maximum (millisecond) 251 288 292 294 295 516 525 516
The mean response time increased as the number of traffic controllers increased from one to two.
This is understandable because for a system of more than one traffic controllers, the
microcontroller needs to establish the communication with a traffic controller and end the
communication after reading the data. Whereas for just one traffic controller in the system once
the communication is established, the microcontroller does not need to spend time opening or
closing the sockets. Response time experienced a significant jump when the network size
increased from five to six traffic controllers. This increase in response time may be due to the
addition of another network device; a hub that was used to connect additional traffic controllers.
For network hubs, performance decreases with the increase in the number of nodes connected
through it.
The processing power of the Rabbit 3000 might have created a delay in data reading as well.
Therefore, it was of some interest to see whether replacing it with a faster microcontroller can
reduce the response time. To test this, a 5000 series Rabbit microcontroller was implemented to
estimate the response times. The program was run with compatible Dynamic C version 10.50 as
Rabbit 5000 is not able to execute a program using Dynamic C version 9.52 or other older
versions of the software. Although, a faster processor was expected to increase the performance

An External Logic Architecture for Implementing Traffic Signal System Control Strategies 38
by reducing the response time, the results were quite opposite. The average response time was
about 450 ms for 5 or less traffic controllers and about 700 ms for six or more. The reason was
that the Rabbit 5000 ran the program on Dynamic C 10.50, while the program was written with
an older version of the software, Dynamic C 9.52. In order to run on the Rabbit 5000, the
program had to emulate the libraries written with the older version of Dynamic C, which
eventually took longer execution time. Therefore, to benefit from using a faster microcontroller,
the program should be written on the software development environment that comes with the
microcontroller.
The effect of response delay in real-time control is further explained in Figure 10, where the
signal status of phase 2 and 4 of the Ash Way intersection is displayed in greater resolution. The
difference in reporting time of an event between the simulation and the microcontroller can be
observed from Figure 10. In Figure 10, a gap on the signal status bar represents the time taken by
the simulation or the microcontrollers to report a change in the signal indication. The graph
shows that the gaps are wider for the microcontroller than for the simulation. For the
microcontroller, this time gap varied and can be as high 0.7 seconds, whereas it was consistently
0.1 seconds for the simulation. The graph also shows the difference between true occurrence
times (simulation time) of an event and the time when it was reported by the microcontroller. For
example, in phase 2 the start of red was reported 1.2 seconds later by the microcontroller. It
should be noted that this variation in the reporting time was observed when there were only two
controllers. Table 5 shows that this variation in reporting time would gradually worsen with an
increase in the number of controllers. This gives us an indication of how the systems‟
performance will be affected if the network size increased.
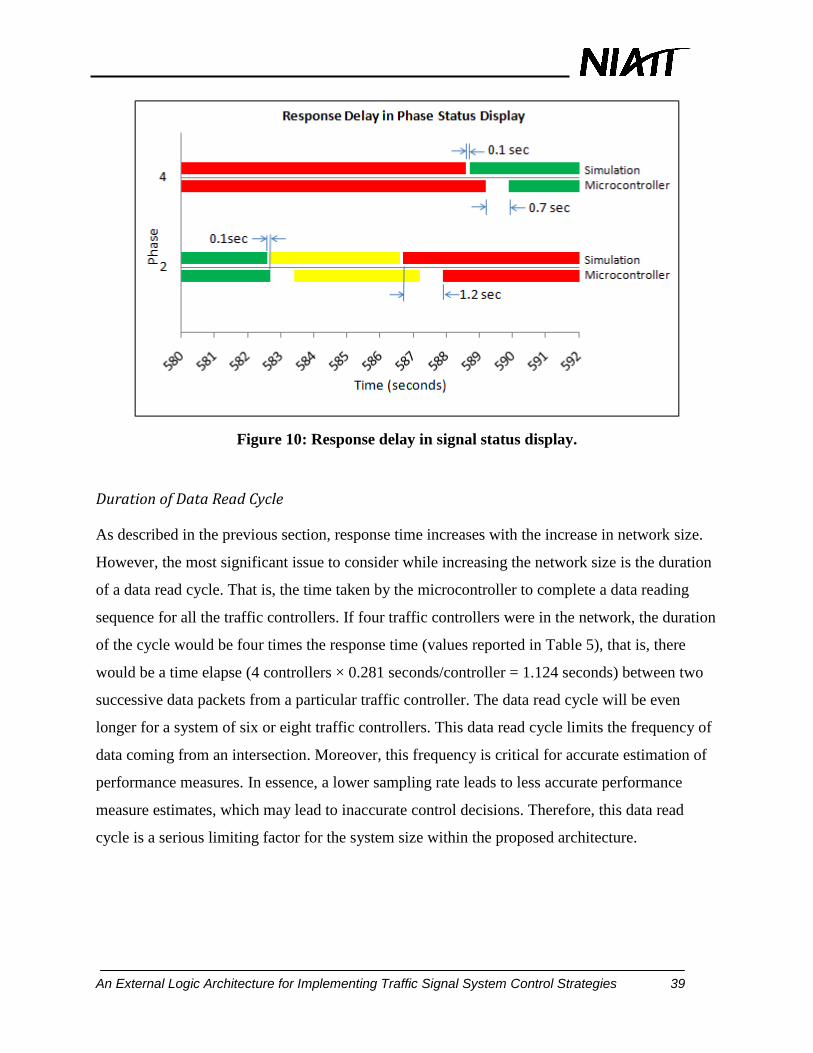
An External Logic Architecture for Implementing Traffic Signal System Control Strategies 39
Figure 10: Response delay in signal status display.
Duration of Data Read Cycle
As described in the previous section, response time increases with the increase in network size.
However, the most significant issue to consider while increasing the network size is the duration
of a data read cycle. That is, the time taken by the microcontroller to complete a data reading
sequence for all the traffic controllers. If four traffic controllers were in the network, the duration
of the cycle would be four times the response time (values reported in Table 5), that is, there
would be a time elapse (4 controllers × 0.281 seconds/controller = 1.124 seconds) between two
successive data packets from a particular traffic controller. The data read cycle will be even
longer for a system of six or eight traffic controllers. This data read cycle limits the frequency of
data coming from an intersection. Moreover, this frequency is critical for accurate estimation of
performance measures. In essence, a lower sampling rate leads to less accurate performance
measure estimates, which may lead to inaccurate control decisions. Therefore, this data read
cycle is a serious limiting factor for the system size within the proposed architecture.

An External Logic Architecture for Implementing Traffic Signal System Control Strategies 40
4.4 Summary
The system architecture was validated with both time independent and time varying data. The
system was accurate for the time independent data, and the accuracy was unaffected by system
size. For the time varying data, such as detector and signal status, the accuracy was found to be a
function of the system size. The data read cycle between successive samplings observed during
the data collection was the main limiting factor for data accuracy and system size. Due to
frequent changes in detector status, detector logs of occupancy and volume data can be used to
avoid losing vehicle detections. However, the signal status data during this data cycle read would
be increasingly obsolete. This obsolescence would eventually undermine the performance
measure and control decision accuracy, as the number of traffic controllers in the architecture
increases.
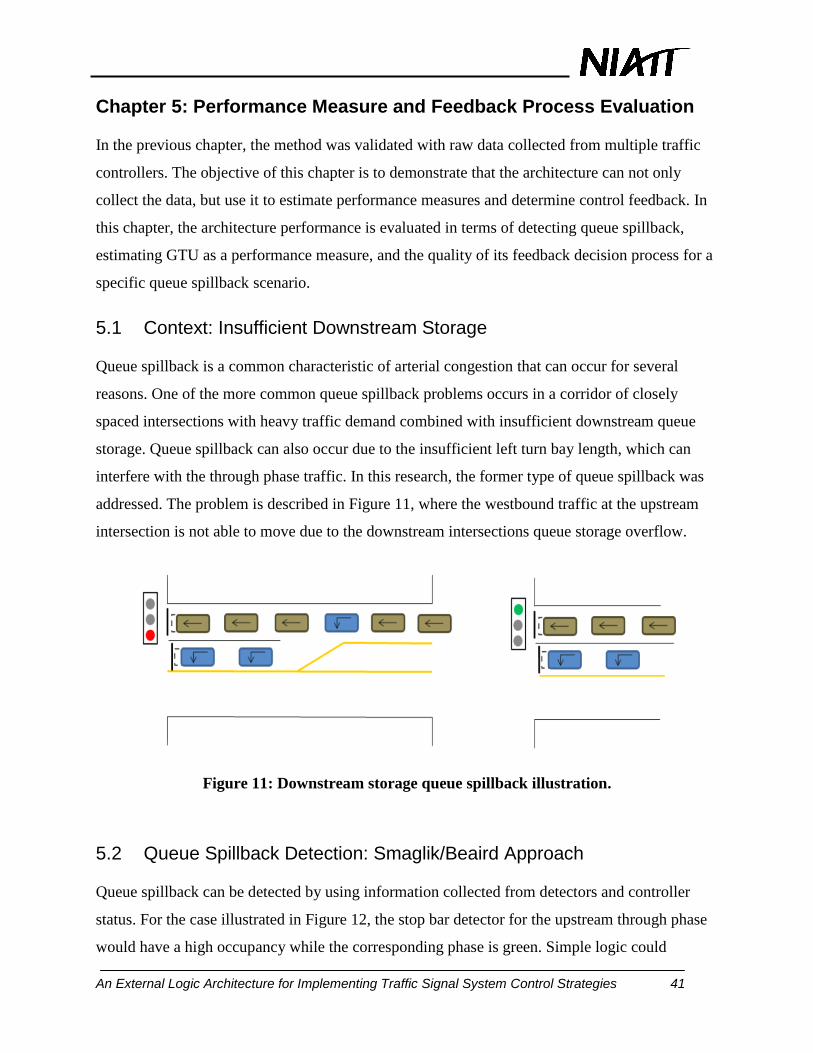
An External Logic Architecture for Implementing Traffic Signal System Control Strategies 41
Chapter 5: Performance Measure and Feedback Process Evaluation In the previous chapter, the method was validated with raw data collected from multiple traffic
controllers. The objective of this chapter is to demonstrate that the architecture can not only
collect the data, but use it to estimate performance measures and determine control feedback. In
this chapter, the architecture performance is evaluated in terms of detecting queue spillback,
estimating GTU as a performance measure, and the quality of its feedback decision process for a
specific queue spillback scenario.
5.1 Context: Insufficient Downstream Storage
Queue spillback is a common characteristic of arterial congestion that can occur for several
reasons. One of the more common queue spillback problems occurs in a corridor of closely
spaced intersections with heavy traffic demand combined with insufficient downstream queue
storage. Queue spillback can also occur due to the insufficient left turn bay length, which can
interfere with the through phase traffic. In this research, the former type of queue spillback was
addressed. The problem is described in Figure 11, where the westbound traffic at the upstream
intersection is not able to move due to the downstream intersections queue storage overflow.
Figure 11: Downstream storage queue spillback illustration.
5.2 Queue Spillback Detection: Smaglik/Beaird Approach
Queue spillback can be detected by using information collected from detectors and controller
status. For the case illustrated in Figure 12, the stop bar detector for the upstream through phase
would have a high occupancy while the corresponding phase is green. Simple logic could

An External Logic Architecture for Implementing Traffic Signal System Control Strategies 42
characterize the traffic condition as one where queue spillback occurred and conclude that the
downstream queue is interfering with the upstream intersections traffic flow.
The queue spillback detection method used in this research to test the performance of the
proposed architecture was developed by Smaglik and Beaird (Smaglik, 2006; Beaird, 2006). The
method can be referred to as responsive queue spillback detection as it only detects a queue
spillback when it occurs, and it cannot be applied to predict an upcoming queue spillback.
According to this method, a queue spillback will be detected when a vehicle at any approach
suffers delay during the green indication due to a downstream queue. In this method, a 10 second
aggregation interval was used to determine the occupancy. The algorithm measured and
averaged the headways using detector status for the latest 10 seconds of green time. From
historic data, a threshold value of headway was determined and compared with the current
cycle‟s headway. Flow was considered to be restricted if the current headway was greater than
the threshold value and the vehicle presence was detected. For this research, the method was
modified to accommodate smaller intervals, because 10 second intervals seemed too long for a 6
ft detector. For a 6 ft stop bar detector, it is very likely that there will be a un-occupancy period
between two vehicles, even during queue discharge. For normal flow during the green interval,
the occupancy during green should be less than 100 percent, unless there is a flow restriction.
Therefore, the threshold value of the occupancy used for the detection algorithm was 100
percent. The advantage of using a shorter interval over a longer one is that the queue spillback
can be detected earlier. However, the interval should not be so short that it detects a queue
spillback which does not exist. This can occur especially at the beginning of the green when a
vehicle waiting at the stop bar usually takes longer to move away from the detector.
Detection Logic
The detection logic proposed by the method was fairly simple to program in the microcontroller.
In words, if the phase is green and the detection zone is occupied for 5 seconds there is a queue
spillback from the downstream intersection, as stated below:
If (Phase state = Green & Detector occupancy for 5 seconds = 100%)
Queue Spillback Occurrence = True;

An External Logic Architecture for Implementing Traffic Signal System Control Strategies 43
Else
Queue Spillback Occurrence = False;
Simulation Model
To test whether the proposed architecture can successfully run the detection logic to detect the
queue spillback, a simulation model of the two intersections, described in Chapter 3, was used.
Two ASC/3 traffic controllers controlled the traffic at the two intersections. The model is shown
in Figure 12, where both the intersections are labeled.
Figure 12: VISSIM simulation model.
The small blue rectangles represent 6 ft detectors placed at the stop bars. The numbers shown
near the detectors are the phases that those detectors serve. The two stop bar detectors at the I-5
off ramp intersection, shown in the circle, were used to detect the queue that backed up from the
Ash Way intersection to block the intersection. Also, the signal status of phase 4 at the I-5
intersection, one that the two detectors serve, was used to implement the detection logic stated
above. There were two upstream traffic movements that contributed to the queue on westbound
approach of the Ash Way intersection, and the input volumes for these two movements in the
simulation were such that the queue spillback would occur with sufficient frequency to provide
informative test results.
Ash Way Intersection I-5 Off Ramp Intersection
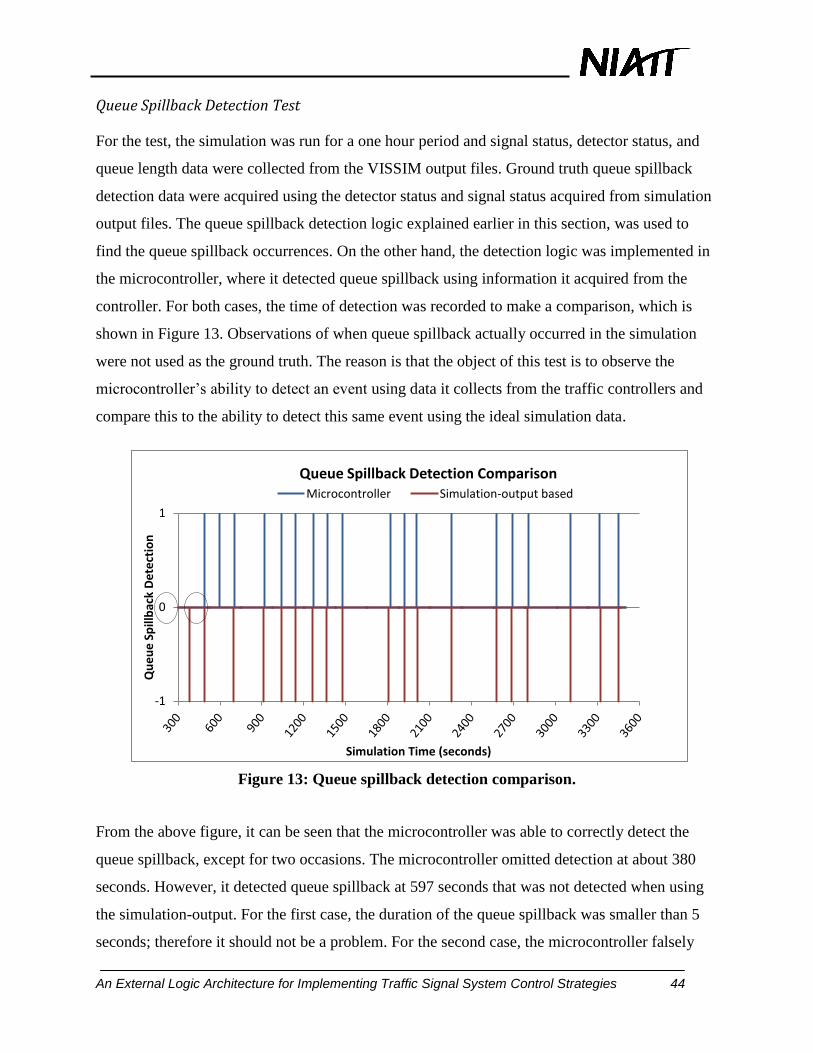
An External Logic Architecture for Implementing Traffic Signal System Control Strategies 44
Queue Spillback Detection Test
For the test, the simulation was run for a one hour period and signal status, detector status, and
queue length data were collected from the VISSIM output files. Ground truth queue spillback
detection data were acquired using the detector status and signal status acquired from simulation
output files. The queue spillback detection logic explained earlier in this section, was used to
find the queue spillback occurrences. On the other hand, the detection logic was implemented in
the microcontroller, where it detected queue spillback using information it acquired from the
controller. For both cases, the time of detection was recorded to make a comparison, which is
shown in Figure 13. Observations of when queue spillback actually occurred in the simulation
were not used as the ground truth. The reason is that the object of this test is to observe the
microcontroller‟s ability to detect an event using data it collects from the traffic controllers and
compare this to the ability to detect this same event using the ideal simulation data.
Figure 13: Queue spillback detection comparison.
From the above figure, it can be seen that the microcontroller was able to correctly detect the
queue spillback, except for two occasions. The microcontroller omitted detection at about 380
seconds. However, it detected queue spillback at 597 seconds that was not detected when using
the simulation-output. For the first case, the duration of the queue spillback was smaller than 5
seconds; therefore it should not be a problem. For the second case, the microcontroller falsely
-1
0
1
Qu
eu
e S
pill
bac
k D
ete
ctio
n
Simulation Time (seconds)
Queue Spillback Detection Comparison Microcontroller Simulation-output based

An External Logic Architecture for Implementing Traffic Signal System Control Strategies 45
detected a queue spillback, which was actually during the beginning of green where the first
vehicle waited for a little longer before starting to move. Furthermore, there tended to be small
time gaps between the detection times resulting from the two queue spillback detection processes
(one processing using the controller data and the other using the simulation data). This time gap
was not significant in terms of the responsiveness of the feedback decision process. However,
this time gap is subject to the individual controller response times and has the potential to
increase with an increasing number of controllers in the system.
5.4 Performance Measure
Green Time Utilization (GTU)
Green time utilization is an informative measure of performance for signalized intersections. It
can be defined as the percent phase green time that serves the traffic. It measures the degree to
which intersection capacity is utilized overall and can do this by individual phases. For example,
a phase may have 30 seconds of green time but, on average, its corresponding detectors are
occupied for a total of 10 seconds. For such a case, 20 seconds of green time would be better
spent serving another conflicting phase with higher green utilization.
In this research, a simple ratio of occupancy time verses total green was used. There were other
performance measures that could be considered, for example, delay, cycle failure, queue length
etc. However, green time utilization seemed to be the most relevant performance measure for
addressing the queue spillback scenario. Green time redistribution on the downstream
intersection, where the bottleneck and queue occur, was chosen as the control feedback measure,
in addition to queue spillback detection. This is because the GTU of the phases give a clear
indication of the quality of green distribution indicating which phases to cut short and which to
extend. Furthermore, Lowri (1990) showed that GTU is closely related to the v/c ratio. As such,
it can be used as an index of the unused capacity of the intersection. The relation is such that the
higher the GTU value the less spare capacity exists.
Calculation of GTU
There are two basic ways to calculate the GTU: simple aggregation, and detector occupancy
trends. In the first method, detector occupancy times are aggregated for the duration of the green.
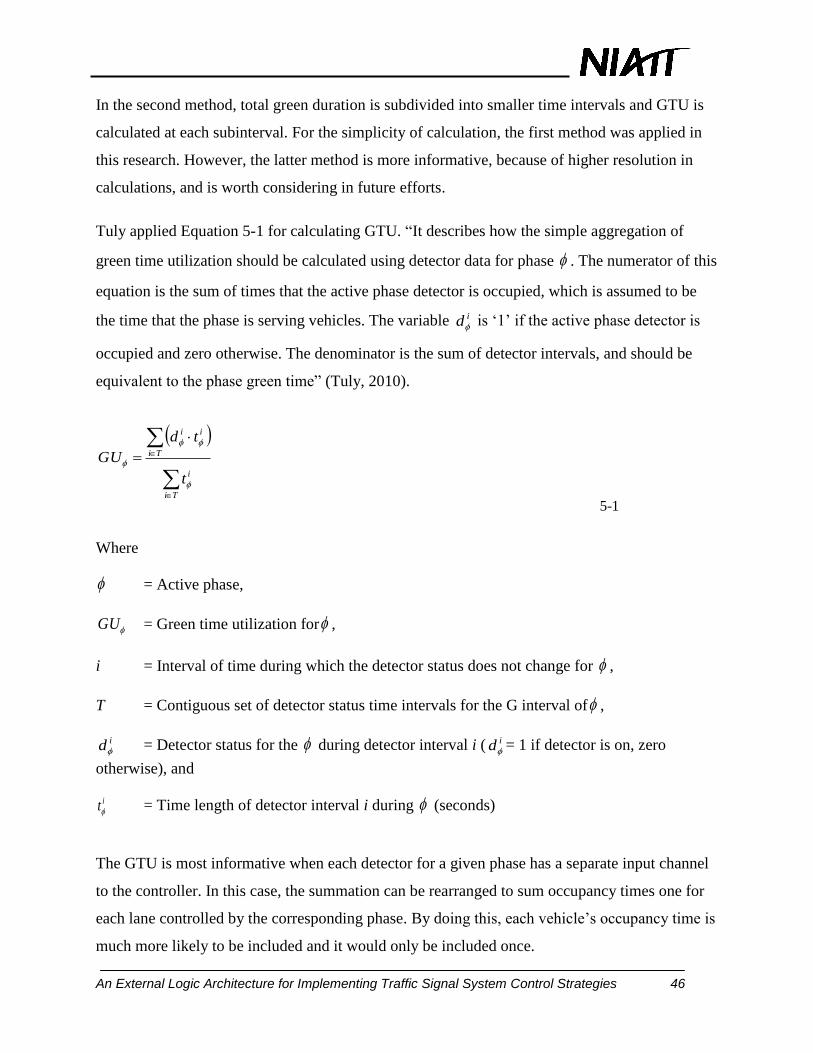
An External Logic Architecture for Implementing Traffic Signal System Control Strategies 46
In the second method, total green duration is subdivided into smaller time intervals and GTU is
calculated at each subinterval. For the simplicity of calculation, the first method was applied in
this research. However, the latter method is more informative, because of higher resolution in
calculations, and is worth considering in future efforts.
Tuly applied Equation 5-1 for calculating GTU. “It describes how the simple aggregation of
green time utilization should be calculated using detector data for phase . The numerator of this
equation is the sum of times that the active phase detector is occupied, which is assumed to be
the time that the phase is serving vehicles. The variable id is „1‟ if the active phase detector is
occupied and zero otherwise. The denominator is the sum of detector intervals, and should be
equivalent to the phase green time” (Tuly, 2010).
Ti
i
Ti
ii
t
td
GU
5-1
Where
= Active phase,
GU = Green time utilization for ,
i = Interval of time during which the detector status does not change for ,
T = Contiguous set of detector status time intervals for the G interval of ,
id = Detector status for the during detector interval i ( id = 1 if detector is on, zero
otherwise), and
it = Time length of detector interval i during (seconds)
The GTU is most informative when each detector for a given phase has a separate input channel
to the controller. In this case, the summation can be rearranged to sum occupancy times one for
each lane controlled by the corresponding phase. By doing this, each vehicle‟s occupancy time is
much more likely to be included and it would only be included once.

An External Logic Architecture for Implementing Traffic Signal System Control Strategies 47
To estimate the GTU, data were collected from both microcontroller and the simulation for 30
cycles. The calculation process was different for the two sources. In both cases, the calculations
can be described by Equation 5-1. However, the microcontroller calculated GTU based on
detector occupancy data collected from the controller using its detector logging function. In this
case, detector occupancy was logged in 5 second intervals, so it = 5 seconds. Whereas, detector
occupancy data collected from the simulation output files were available in 0.1 second intervals,
so it = 0.1 seconds. The comparison of the phase 4 calculated values from the two sources (the
bottleneck phase) and phase 5 (conflicting with phase 4) of the Ash Way intersection is shown in
Figure 14.
Figure 14: Comparison of estimated GTU for 5 seconds occupancy period.
In the above figure, two lines represent the GTU of the phase calculated by the microcontroller
and from the simulation-output based data. A vertex in a line represents the end of a 110 second
cycle. It can be visually observed from the graph that the two lines are closely spaced indicating
a small difference between the two estimates. However, there is clear bias where the
microcontroller GTUs are almost always higher than the simulation-output GTU. This is because
0.0
20.0
40.0
60.0
80.0
100.0
Esti
mat
ed
GTU
(%
)
Simulation Time (seconds)
Comparison of GTU: Intersection 1 Phase 4 and Phase 5
Microcontroller Phase 4 Simulation-output based Phase 4 Microcontroller Phase 5 Simulation-output based Phase 5

An External Logic Architecture for Implementing Traffic Signal System Control Strategies 48
the traffic controller logs the occupancy data in 0.5percent increments, which are always
reported to the nearest integer value. However, there are some larger variations near 450 and
1500 seconds, which could have resulted from a detector log at the end of a given cycle being
received at the microcontroller at the beginning of the following cycle for one or more intervals.
Two-tailed paired t-tests were conducted for both phase 4 and 5 to see whether the differences
between the values from two sources were significant or not. The detailed test results were given
in Appendix E. For both phases, p-values were less than the critical p level (0.05), which implies
that the differences were statistically significant. However, these differences are likely
insignificant in terms of engineering judgment. For example, assume the decision was to either
reduce the green time of phase X or phase Y. Then the magnitude of a wrong decision is directly
related to the GTU measurement error. In this test, the GTU measurements for phases 4 and 5
had an average error of 2.6 percent. Assuming this error is generally applicable than an incorrect
phase selection for reducing the green time would not be far off the mark. Even so, it is clear that
the architecture would incrementally benefit from a more consistent source for detector
occupancy data and the phase and detector state event log recommended in previous research
would fill this role well (Smaglik, 2007).
5.5 Feedback Decision Process
The total green time in a cycle is divided among all the phases at an intersection, and thus, each
phase competes for time to serve the corresponding traffic movements. If an adjustment is made
to one of the phases, operations of the other phases will be affected. Therefore, a feedback
decision made to solve a queue spillback problem should consider the impacts that adjustments
to one phase will have on the other phases. Incorporating green time utilization will enable an
engineer to monitor the impacts and to determine how well a phase is operating. While some
phases may not experience problems, they may be operating close to the point where problems
will result. GTU measurement for each phase will make it possible to foresee the impacts of
phase plan and timing adjustments that comprise a control strategy.
Redistribution of Green Time
In this research, the redistribution of the green times among the phases of the problem
intersection was used as a technique to mitigate queue spillback problem. The focus of this

An External Logic Architecture for Implementing Traffic Signal System Control Strategies 49
method is to add more green time to the bottleneck-phase of the downstream intersection by
taking green time away from other conflicting phases. Smaglik and Beaird‟s approach toward
solving the queue spillback issue was to truncate the upstream phase that is facing the queue
spillback problem by immediately gapping it out. This approach does not really solve the
problem; rather it is an attempt to stop the queue from building up and blocking the intersection
so that other conflicting phases can utilize the time. Therefore, in this research phase truncation
was not adopted as a feedback measure to test.
The technique applied in this research was to terminate the downstream phases conflicting the
bottleneck-phase and increase the maximum green settings for the bottleneck-phase when a
queue spillback was detected. In this way, the bottleneck-phase started earlier and lasted longer.
Terminating a phase can be done in two ways: Max-out (maximum green timer expires), or Gap-
out (phase passage timer expires). To terminate a conflicting phase, the max-out technique was
implemented. However, there is a benefit of using gap-out over max-out termination. Gap-out
terminates the phase immediately, whereas max-out takes more time, because it involves
changing a setting and waiting until a longer maximum green time expires. Typically, the benefit
of max-out starts with the next cycle. To add more green time to the bottleneck-phase (phase 4 of
the downstream intersection), other active conflicting phases were set to max-out earlier by
resetting their respective maximum green settings. To resolve the problem in the earliest possible
time, the microcontroller changed the maximum green times to the corresponding minimum
green times. After the queue was cleared (typically in the next cycle), the microcontroller
returned the maximum green to its normal setting. The benefit of maintaining the plans
maximum green setting is that this can be implemented as a short-term control measure and the
normal settings can be restored when the operations become normal.
From the previous discussion, the feedback decision process can be clearly divided into several
steps.
1. The microcontroller detects queue spillback by the method explained in Section 5.2
of this chapter.
2. Microcontroller calculates GTU values to determine the uncoordinated phases with
the most unused green that could be reallocated to the bottleneck-phase.

An External Logic Architecture for Implementing Traffic Signal System Control Strategies 50
3. Microcontroller determines the uncoordinated phase from which to reallocate unused
green. To determine the phases to terminate earlier, a threshold value of GTU was
used. A phase was considered to have unused green time if its estimated GTU was
below the specified threshold value. Tuly (2010) suggested a simple GTU threshold
of 45 percent, which was used in this research.
4. Microcontroller changes the maximum green times of the uncoordinated phases with
GTU below the threshold value to have equal values with their respective minimum
green times (for Ash Way intersection it was 5 seconds). This change goes into effect
in the next cycle. This feedback measure does not affect the cycle start time or the
coordination, and the implementation is a direct approach, because the NTCIP object
phaseMaximum1 has both read and write data accessibility.
To assess the feedback process, a simulation was run for 1 hour, and queue length data were
collected for both a base condition and after implementing the feedback. The average queue
length of the WB through movement at the Ash Way intersection reduced to 135 ft from 189 ft.
This indicates that the feedback decision employed by the microcontroller was able to improve
the situation for the WB through movement. For the conflicting movements, the queue lengths
were increased, especially for the SB left turn movement the change was noticeable. The average
queue length increased from 43 ft to 67 ft. For future research, a more balanced approach to
setting max green times should be taken to lessen the adverse effects on the uncoordinated
phases.

An External Logic Architecture for Implementing Traffic Signal System Control Strategies 51
Chapter 6: Technology Transfer
This chapter provides a brief description of the Dynamic C code setup and the NTCIP
communication implementation in terms of dynamic objects and data communications. In
addition to the broad description given in Chapter 2, this chapter accomplishes two objectives: i)
describes how these elements were implemented in the proposed architecture to increase
researcher awareness of issues associated with external logic traffic control systems monitoring
and ii) facilitates future implementation of the proposed architecture as it stands with the Rabbit
3000 microcontroller.
6.1 Requesting Data and Using NTCIP 1202
Requesting data and sending data to and from the traffic controller are a foundation for this
research and are accomplished through “dynamic objects” and the NTCIP 1202 communication
protocol. This report only describes the process followed for requesting data. Sending data uses
similar resources, but also requires a description of how to interpret the dynamic object sent from
the controller. The process followed for sending data is described elsewhere (DeVoe, 2009).
The definitions and the process of building a dynamic object, and the communication protocols
were described in Chapter 2. In this section, the data requesting process is documented by
referring to specific lines in the microcontroller code. In addition to the signal and detector state
information, detector volume and occupancy data logs were requested from the traffic controller
for this research. The data requesting task requires the following steps:
Step 1: Define a new dynamic object, by establishing a dynamic object number and then
selecting the objects corresponding to the desired controller parameters by listing their
corresponding OIDs,
Step 2: Request data by referring to the desired dynamic object‟s “Dynamic Object Number.”
The number is circled in Figure 15 (line 70), set as a constant in the dynamic object setup file, a
Dynamic C executable file.

An External Logic Architecture for Implementing Traffic Signal System Control Strategies 52
Figure 15: Locating Dynamic Object Number in Dynamic Object setup file.
Step 3: In this step, the total number of parameters or objects in the dynamic object is set. This is
the number of controller parameters that the user decides to include in the dynamic object
(circled in Figure 16).
Figure 16: Defining total number of objects and listing the OIDs.
Step 4: List each of the OIDs corresponding to the traffic controller parameters as defined in
SNMPv1202v107 (Case, 1996). The most commonly used OIDs are listed in the text file named
(see Appendix F). The process is very simple, finding the appropriate OID from the OID list and
copying it to the list, the top of which is shown in Figure 16. To add detector volume to the
existing list of objects, add the OID for detector volume (1.3.6.1.4.1.1206.4.2.1.2.5.4.1.1) to the
list (line 107 in Figure 16). The last digit represents the detector number. As a result, this OID
will be used to retrieve the volume data of detector number 1. The sequence of the OIDs in the
list is very important, because this order defines the structure of the data received from the traffic
controllers. In the case of this research, the packet size was specified by the number of objects or
parameters required to be collected from the traffic controllers.

An External Logic Architecture for Implementing Traffic Signal System Control Strategies 53
Step 5: Create the dynamic object. The dynamic object setup file is compiled and executed in the
Rabbit after specifying the desired traffic controller in the program, as shown on line 50 of
Figure 17. Both the traffic controller and the Rabbit should be connected to the same Ethernet
network while the program executes. The program must run one time for each traffic controller.
Once a dynamic object is setup, it can be used throughout the runtime of the microcontroller.
Figure 17: Changing the IP address before executing the setup file.
Step 6: Store the dynamic object data. The dynamic object data structure in the
“DYNAMIC_SIGNAL_CONTROL" library file is modified by adding a variable to store the
value of the newly added object. For example, Figure 18 shows the variable array
“detectorVolume[MAX_DETECTOR]” (line 177), which was defined to store the detector volume
data. It is also important to note that this structure must list the variables in the same order as the
corresponding OIDs given in the dynamic object (shown in Figure 16).
Figure 18: Dynamic object data structure (“DYNAMIC_SIGNAL_CONTROL.Lib").
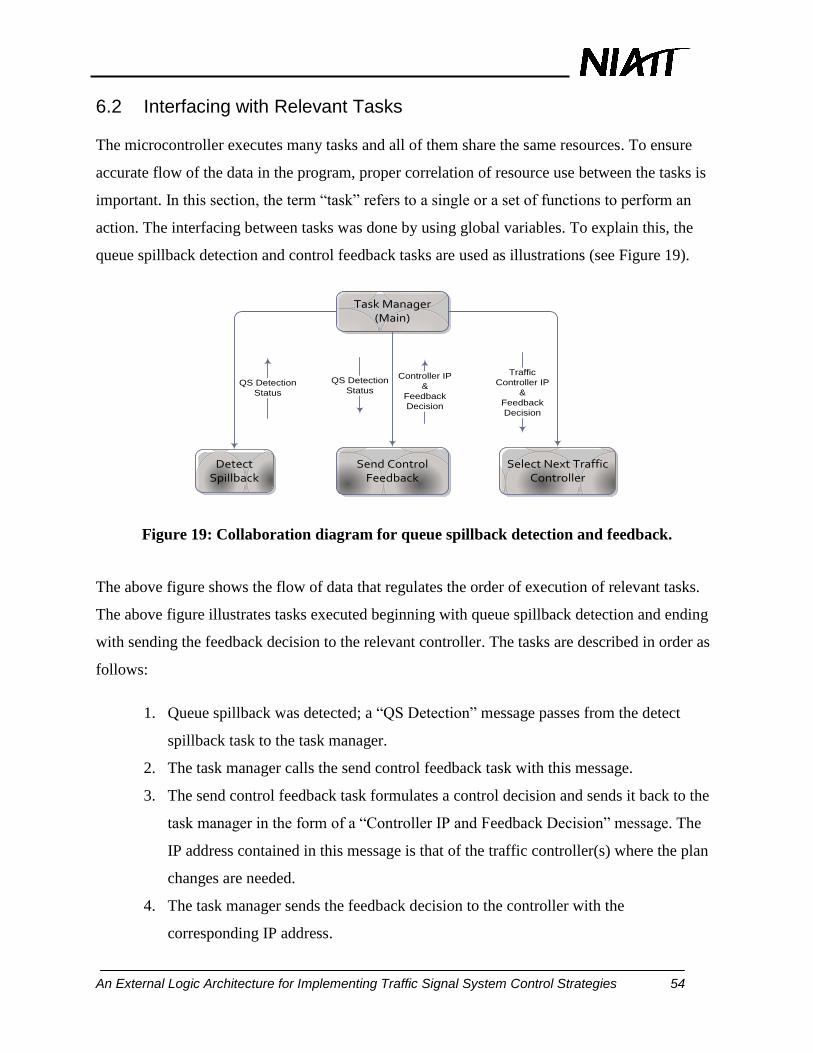
An External Logic Architecture for Implementing Traffic Signal System Control Strategies 54
6.2 Interfacing with Relevant Tasks
The microcontroller executes many tasks and all of them share the same resources. To ensure
accurate flow of the data in the program, proper correlation of resource use between the tasks is
important. In this section, the term “task” refers to a single or a set of functions to perform an
action. The interfacing between tasks was done by using global variables. To explain this, the
queue spillback detection and control feedback tasks are used as illustrations (see Figure 19).
Task Manager(Main)
Traffic
Controller IP
&
Feedback
Decision
QS Detection
Status
Select Next Traffic Controller
Detect Spillback
Send Control Feedback
Controller IP
&
Feedback
Decision
QS Detection
Status
Figure 19: Collaboration diagram for queue spillback detection and feedback.
The above figure shows the flow of data that regulates the order of execution of relevant tasks.
The above figure illustrates tasks executed beginning with queue spillback detection and ending
with sending the feedback decision to the relevant controller. The tasks are described in order as
follows:
1. Queue spillback was detected; a “QS Detection” message passes from the detect
spillback task to the task manager.
2. The task manager calls the send control feedback task with this message.
3. The send control feedback task formulates a control decision and sends it back to the
task manager in the form of a “Controller IP and Feedback Decision” message. The
IP address contained in this message is that of the traffic controller(s) where the plan
changes are needed.
4. The task manager sends the feedback decision to the controller with the
corresponding IP address.
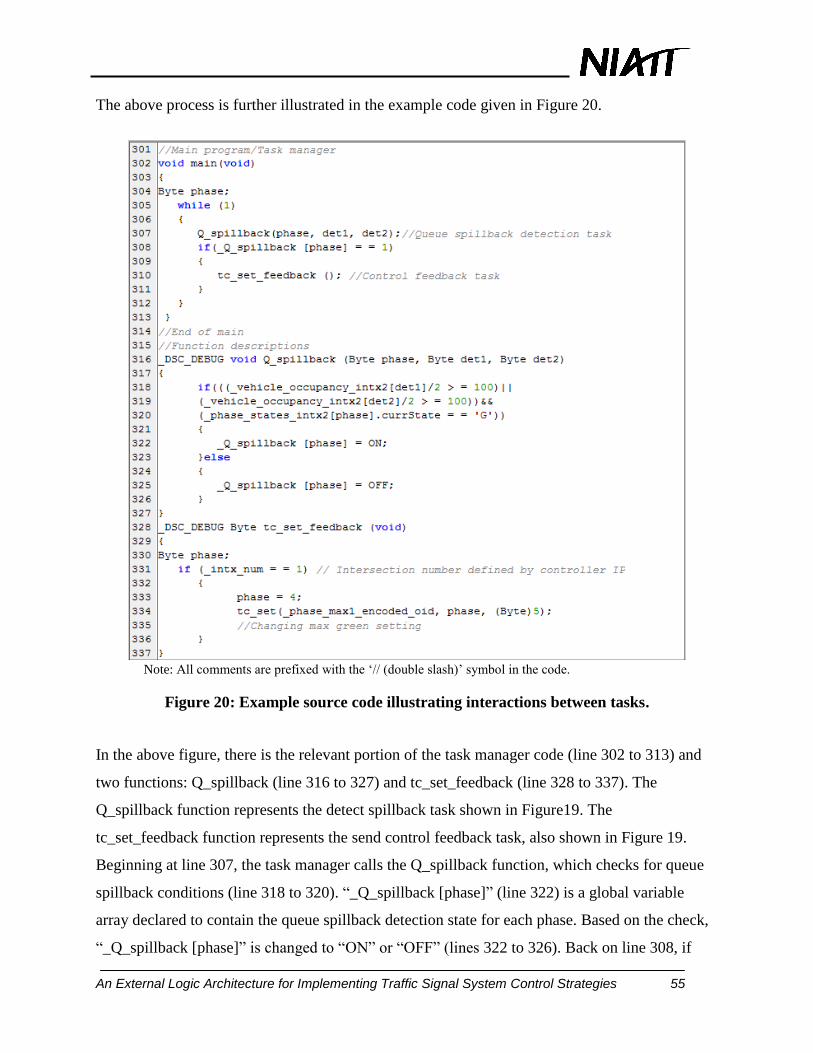
An External Logic Architecture for Implementing Traffic Signal System Control Strategies 55
The above process is further illustrated in the example code given in Figure 20.
Note: All comments are prefixed with the „// (double slash)‟ symbol in the code.
Figure 20: Example source code illustrating interactions between tasks.
In the above figure, there is the relevant portion of the task manager code (line 302 to 313) and
two functions: Q_spillback (line 316 to 327) and tc_set_feedback (line 328 to 337). The
Q_spillback function represents the detect spillback task shown in Figure19. The
tc_set_feedback function represents the send control feedback task, also shown in Figure 19.
Beginning at line 307, the task manager calls the Q_spillback function, which checks for queue
spillback conditions (line 318 to 320). “_Q_spillback [phase]” (line 322) is a global variable
array declared to contain the queue spillback detection state for each phase. Based on the check,
“_Q_spillback [phase]” is changed to “ON” or “OFF” (lines 322 to 326). Back on line 308, if

An External Logic Architecture for Implementing Traffic Signal System Control Strategies 56
“_Q_spillback [phase]” is true then the control decision is implemented by calling the
tc_set_feedback function (line 310) and changes the max green setting of phase 4 to 5 seconds
(line 334).
6.3 Using Relevant Libraries and Variables
The main program (referred to as “main”) is referred to in Figure 19 as the task manager and
contains the instructions to initialize the communication and control the relevant tasks. It uses the
following library files by using the compiler directive “#use” {library name}:
"DTC_GLOBAL_DEFS.LIB": includes global definitions of the variable types
“DYNAMIC_SIGNAL_CONTROL.LIB": includes tasks for communication and traffic
operation monitoring
“NETWORK_TOPOGRAPHY.LIB": contains user defined variables and tasks for
defining the traffic network
"dcrtcp.lib”: includes functions for networking (communication protocols)
"http.lib”: includes primary HTTP functionality, providing a website that shows the
traffic network performance
All of the library files should be located to the directory named “Lib” inside the Dynamic C
installation directory. The first three library files were developed and/or modified by this project
for research with traffic signal systems and the last two were built-in libraries that came with the
Dynamic C software. The libraries were developed to serve specific objectives. As shown in
Figure 21, the first library contains the global definitions of all data types used in other libraries.
For example, a “Byte” data type was defined as an unsigned character (line 43). All seven types
that were defined in the library are shown in the figure (line 41 to 47). To define a type, the
Dynamic C keyword “typedef” is used. It basically renames a variable type.

An External Logic Architecture for Implementing Traffic Signal System Control Strategies 57
Figure 21: Variable type definitions in "DTC_GLOBAL_DEFS.LIB."
The second library contains the instructions for communication and traffic operations
monitoring, and the third file contains the user defined variables for a traffic network. These user
defined variable act as constants and some quantify restrictions regarding array sizes and loops in
terms of the maximum number of intersections, phases, detectors, lanes, and controllers. As with
the other libraries, these libraries contain documentation in the form of “comments.” However, in
the case of the third library, the comments direct the user to make necessary modifications to
change these restrictions. For example, the maximum number of phases were defined as a
constant named “MAX_PHASE” and the value given to it was eight. If the user wants to work
with sixteen phases, then this value should be changed to sixteen, and a program instruction
checking for some conditions for all eight phases would run sixteen times instead of eight. The
last two libraries are built-in libraries and contain the functions required for displaying
information in the webpage accompanying the microcontroller.
All of the functions in the library files are available for use from the main program. Also, the
variables can be used from anywhere within the main program or inside the libraries if they are
defined as global variables. This feature of global variables simplifies the code. However, using
global variables should be avoided when unnecessary, because the code is easier to understand
when the scope of its individual elements are limited. Also, a global variable can be changed by
any part of the program, and any rules regarding its use can be easily broken or forgotten.
An External Logic Architecture for Implementing Traffic Signal System Control Strategies 58
6.4 Using the User Interface (The Webpage)
For the convenience of monitoring the network performance, a webpage was developed as part
of this research. The functionalities were scoped to demonstrate webpage applications, leaving
more detailed and rigorous development for future consideration. For only outputting
information, the signal status of two intersections was displayed. For inputting information to the
server from the webpage a link was provided to implement a control feedback decision. The task
can be subdivided into two principal steps: building the webpage by using HTML language and
linking the variables declared for displaying signal status with the microcontroller program.
For the signal status display, one variable was declared for each phase. For example, in Figure 22
“signal_11[15]” was used to display the phase one state for intersection one (see line 8). The
number “15” in the square brackets means that the variable contains 15 elements, i.e., the
variable basically represents a “string” (a Dynamic C data type) of 15 characters. The webpage
updates the values of the variables at a certain rate and displays images that represent the
appropriate signal status. The HTML and other image files were added in the main program (line
17 to 21) by using “sspec_addxmemfile()” functions, which are defined in the “http.lib” library
file. To add a signal status display of another intersection, similar variables should be added both
in the global variable section (line 8 to 12) and in the main. The compiler directive “#ximport”
(line 2 to 5) imports the HTML and other image files from the specific location on the computer
hard drive to the server while the program executes.
To learn more about exchanging information to a webpage, the user should refer to the example
problems provided with the Dynamic C software. “Post.C” is such an example that can be found
in the installation directory of the software. There are other examples in the directory that contain
source codes with documentation, and these are executable programs.

An External Logic Architecture for Implementing Traffic Signal System Control Strategies 59
Figure 22: Codes for displaying signal state on the webpage (main program).
An HTML reference (or a “link”) named “feedback,” is also given on the webpage. This link
works like a push button, and if pressed, it sends a command to the Rabbit to call the “feedback”
function shown in Figure 23.
Figure 23: Codes for inputting data to the Rabbit server from the webpage (main
program).
Simply as a demonstration, the function sets the phase 5 minimum green to 4 seconds from its
initial value of 5 seconds (line 123). Similar control decisions can be implemented by changing
the instruction on line 123. Although, the program was made self-sufficient to detect an
operational problem and implement a control decision, this webpage functionality actually

An External Logic Architecture for Implementing Traffic Signal System Control Strategies 60
facilitates human intervention, in the form of monitoring the traffic and controller operations and
changing traffic signal control plans.

An External Logic Architecture for Implementing Traffic Signal System Control Strategies 61
Chapter 7: Conclusion and Recommendations
The main purpose of this research was to develop an improved and cost effective system for
collecting data in real-time, monitoring signalized intersection performance, and facilitating the
implementation of improved control logic external to the traffic controllers. This chapter
summarizes the important achievements of this research related to the above mentioned
objective.
7.1 Synthesis of the Findings
Based on the analysis conducted in this research, the following were concluded:
The proposed architecture is capable of extracting accurate data from one or more NTCIP
compliant traffic controllers via a common Ethernet network.
The time taken by the microcontroller to read and process the information collected from
a certain traffic controller, defined as the response time, depends on the number of traffic
controllers in the system. For a system of one traffic controller, the response time is 250
ms. For a system of two or more controllers, the controller response time varies between
275-285 ms per controller.
A Dynamic C library file can help establish system definitions and network topography
information. This information formalizes some relations between control decisions
considered at different locations.
It is clear that the microcontroller‟s performance will degrade with each additional
controller and this deterioration was quantified in terms of the data read cycle, which is
the time transpired between two consecutive times the microcontroller receives data from
a given traffic controller.
Traffic performance measures can be calculated by the microcontroller with acceptable
accuracy using controller detector occupancy and volume logs. For a 5 second occupancy
interval, the GTU calculated by the microcontroller varied about 1.5 percent from the
actual measurements. Although this error can be positive or negative, the data that the
microcontrollers estimate are biased high.
The architecture implements performance measurement and control strategy decisions
effectively with multiple controllers. This was shown using a queue spillback scenario.

An External Logic Architecture for Implementing Traffic Signal System Control Strategies 62
A variety of control feedback strategies can be applied within the proposed architecture
to improve the queue spillback condition. The green redistribution, as a feedback,
improves the queue spillback scenario significantly by making acceptable performance
sacrifice for some traffic movements in order to achieve acceptable performance at other
traffic movements.
7.2 Opportunities for Microcontroller Application
Data collection and performance measurement for signalized intersections are receiving more
attention day by day with the technological advancement in the field. The application of a
microcontroller for this purpose was demonstrated in this research through the proposed
architecture. However, there are many opportunities for an application of a microcontroller in
this setting.
Dual Resolution Performance Monitoring
Typically, traffic operations and maintenance agencies do not have the resources to monitor
traffic system performance of signalized arterials in the detail consistent with what a
microcontroller can achieve. Therefore, there are very limited means to improve their operations.
In addition, the proposed architecture would still be limited by communication bandwidth. It
may be more practical to conduct performance monitoring of a signalized arterial with high
resolution monitoring surrounding the problem area and low resolution elsewhere. Doing so
would support key decisions at critical areas, while continuing basic monitoring at other
locations to maintain the ability to change focus to these areas if conditions change.
Excessive Stops Applied in Coordinated System Feedback
In many instances, the purpose of traffic signal coordination is to improve the level of service of
a road or a network of roads by minimizing overall delay or travel time and the number of stops.
In some cases, this can be achieved by implementing an adaptive traffic control system. The
principal benefit of an adaptive system is that it can be effectively used where variability and
unpredictability in traffic demand results in excessive delay and stops that cannot be reasonably
accommodated by updating coordinated signal timing parameters in a time-of-day fashion.
Modifying and testing traffic control logic to be more adaptive requires many resources. To

An External Logic Architecture for Implementing Traffic Signal System Control Strategies 63
address this, prototyping through the application of microcontrollers can streamline the
development effort. This research provides an example of adaptive control in the context of
queue spillback. When a queue spillback scenario is detected, the microcontroller determines a
control strategy and employs it to mitigate the problem. However, the number of stops was not
taken into account while implementing this strategy. Depending on the detection system, the
existing adaptive logic could be readily changed to address the number of stops and tested in the
laboratory and subsequently in the field.
7.3 Next Steps in Research
It was believed that signalized intersection systems may benefit from applying the architecture
and techniques developed in this research. However, some issues and limitations were
recognized that might be encountered while implementing this in the field. In an effort to resolve
those issues, the following topics were identified for further research:
The proposed network of microcontroller and the traffic controllers was only tested in the
lab. It needs to be tested in the field with the queue spillback detection logic and feedback
strategies in order to develop a field ready instrument. Testing in the field might expose
issues that were either overlooked or considered to have little impact in the lab. For
example, the distance between intersections and field network connections might cause
delays that could undermine the performance of the system.
Future research could improve data resolution and at the same time reduce data read
cycles. One direction to pursue for achieving this is the ftp server style communication of
data packets employed by Econolite. This introduces some security concerns and
additional questions. One question is the data packet request frequencies suitable for real-
time performance monitoring and adaptive control. Another question is the potential of
PCs to take the place of microcontrollers in the proposed architecture, at least in terms of
performance monitoring. In this sense, they would act as a research grade central control
computer.
Response time can be improved by implementing a faster microcontroller and rewriting
the program in its corresponding software development environment.

An External Logic Architecture for Implementing Traffic Signal System Control Strategies 64
There is room for refining the detection algorithm. For example, in the queue spillback
detection algorithm a 5 second occupancy interval was used. This interval is too short for
heavy vehicles, because of their large discharging detector occupancy time.
Other performance measures (e.g., delay and number of stops) and additional control
feedback should be considered (e.g., changing cycle length, or offset).
Performance measurement and control feedback should more thoroughly consider the
network topography to establish stronger and further reaching relationships and
strengthen improvement strategies.
An External Logic Architecture for Implementing Traffic Signal System Control Strategies 65
References
1. Dixon, M., A. Abdel-Rahim, Wall R., Enhancement, Deployment, and Testing of a Traffic
and Controller Data Collection System, National Institute for Advanced Transportation
Technology, Project No. KLK711 N10-05, 2011.
2. Digi International, Rabbit 3000 Microcontroller User’s Manual, 2007.
3. DeVoe, D., Giri S., Wall R. W., A Distributed Ethernet Network of Advanced Pedestrian
Signals, The Journal of the Transportation Research Board, Transportation Research Record,
2009.
4. AASHTO / ITE / NEMA, NTCIP 1202: Object Definitions for Actuated Traffic Signal
Controller Units (ASC) version 1.07b. Washington, D.C.: AASHTO / ITE / NEMA, 2005.
5. AASHTO / ITE / NEMA, NTCIP 1103: Transportation Management Protocols (TMP)
version 2.10b. Washington, D.C.: AASHTO / ITE / NEMA, 2006.
6. Case, J., K. McCloghrie, M. Rose, S. Waldbusser, Structure of Management Information for
Version 2 of the Simple Network Management Protocol (SNMPv2), ACM Digital Library,
last accessed Aug. 1, 2008,available at
http://portal.acm.org/citation.cfm?id=RFC1902&dl=ACM&coll=portal, 1996.
7. Amanna A., Overview of IntelliDrive / Vehicle Infrastructure Integration (VII), VirginiaTech
Transportation Institute, May 31, 2009.
8. Smaglik, E., Sharma A., Bullock D., Sturdevant J., Duncan G., Event-Based Data Collection
for Generating Actuated Controller Performance Measures, Transportation Research
Record: Journal of the Transportation Research Board, No 2035, pp. 97-106, 2007.
9. ASC/3 Programming Manual, 2005.
10. Ahmed, S.M., A. Abdel-Rahim, M.P. Dixon. , An external logic processor for NTCIP-based
traffic controllers: Proof of concept for data exchange capability, Intelligent Transportation
Systems, 2009. ITSC '09. 12th International IEEE Conference, 2009.
11. Smaglik, J. E., D. M. Bullock, T. Urbanik, and D. Bryant , Evaluation of Flow-Based Traffic
Signal Control Using Advanced Detection Concepts, Transportation Research Record, No.
1978, pp 25-33, TRB, Washington, D.C., 2006.
12. Liu, H., W. Ma, X. Wu, and H. Hu , Development of a Real-Time Arterial Performance
Monitoring System Using Traffic Data Available from Existing Signal Systems, Minnesota
Department of Transportation, St. Paul, MN, 2008.
An External Logic Architecture for Implementing Traffic Signal System Control Strategies 66
13. Wu, N., Total Approach Capacity at Signalized Intersections with Shared and Short Lanes,
Transportation Research Record, Journal of the Transportation Research Board, No. 2027,
TRB, Washington, D.C., 2007.
14. Beaird, S., T. Urbanik, and D. M. Bullock , “Traffic Signal Phase Truncation in Event of
Traffic Flow Restriction,” Transportation Research Record, No. 1978, pp 87-94, TRB,
Washington, D.C., 2006.
15. Tian, Z. and T. Urbanik , Green Extension and Traffic Detection Schemes at Signalized
Intersections, Transportation Research Record, Journal of the Transportation Research
Board, No. 1978, TRB, Washington, D.C., 2006.
16. Rhodes, A., J. Sturdevent, Z. Clark, D. Bullock, Evaluation of Stop Bar Video Detection
Accuracy at Signalized Intersections, Purdue University, 2004.
17. Haoui, A., R. Kaveler, P. Varaiya. , Wireless Magnetic Sensors for Traffic Surveillance.
Transportation Research Part C. No. 16, pp. 294-306, 2008.
18. Lowri, P.R., SCATS (Sydney Coordinated Adaptive Traffic Sytem) – A Traffic Responsive
Method of Controlling Urban Traffic, Roads and Traffic Authority, Sydney, NSW, Australia,
1990.
19. Tuly, A.H., M.P. Dixon, Green Time Utilization as a Performance Measure for Signalized
Intersection, National Institute for Advanced Transportation Technology, University of
Idaho, 2010.

An External Logic Architecture for Implementing Traffic Signal System Control Strategies 67
APPENDIX A: List of Functions in Traffic System Definition Library
NETWORK_TOPOGRAPHY.LIB
Function Number: 1
Syntax: Byte NT_intx_phase(Byte node)
Description: Defines the number of phases associated with each intersection, a node with a non-
zero phase is regarded as an intersection.
Parameter1: Node number
Return value: Number of phases in the given node/intersection
Function Number: 2
Syntax: Byte NT_link_from_node(Byte link)
Description: For a given link number, this function returns the node from where it originated.
Parameter1: Link number
Return value: Origin node
Function Number: 3
Syntax: Byte NT_link_to_node(Byte link)
Description: For a given link number, this function returns the destination node.
Parameter1: Link number
Return value: Destination node
Function Number: 4
Syntax: Byte NT_phase_from_link(Byte phase, Byte intx)
Description: For a given phase number of an intersection, this function returns the link number
where it comes from.
Parameter1: Phase number
Return value: Intersection number
Function Number: 5
Syntax: Byte NT_phase_to_link(char mvmnt, Byte phase, Byte intx)

An External Logic Architecture for Implementing Traffic Signal System Control Strategies 68
Description: For a given phase number of an intersection, this function returns the link number to
which the phase goes.
Parameter1: Movement, 'L'= Left-turn, 'T'= Through, 'R'=Right-turn
Parameter2: Phase number
Return value: Intersection number
Function Number: 6
Syntax: Byte NT_phase_Upstream_intx(Byte phase, Byte intx)
Description: For a given phase number of an intersection, this function returns the link number
where it comes from.
Parameter1: Phase number
Parameter2: Intersection to which the phase belongs
Return value: Origin Node
Function Number: 7
Syntax: Byte NT_phase_Downstream_intx(char mvmnt, Byte phase, Byte intx)
Description: For a given movement and phase number of an intersection, this function returns the
link number where it goes.
Parameter1: Movement, 'L'= Left-turn, 'T'= Through, 'R'=Right-turn
Parameter2: Phase number
Parameter3: Intersection to which the phase belongs
Return value: Origin Node
Function Number: 8
Syntax: Byte NT_offset_between_intx(Byte intx1, Byte intx2)
Description: For a given phase number of an intersection, this function returns the link number
where it comes from.
Parameter1: Upstream intersection from where the traffic comes
Parameter2: Downstream intersection to which the traffic moves
Return value: Offset in seconds from intersection 1 to 2
An External Logic Architecture for Implementing Traffic Signal System Control Strategies 69
Function Number: 9
Syntax: void NT_contributing_upstream_phases(Byte phase, Byte intx)
Description: For a given phase of an intersection, this function computes the upstream
contributing phases.
Parameter1: Phase number
Parameter2: Intersection to which the phase belongs
Return value: None (stores the number of u/s contributing phases in global variable
“_contributing_us_phase[3]”).
Function Number: 10
Syntax: void NT_movements_served(Byte phase, Byte intx)
Description: For a given phase number of an intersection, this function computes the movements
it serves.
Parameter1: Phase number
Parameter2: Intersection to which the phase belongs
Return value: None
Function Number: 11
Syntax: Byte NT_number_lanes_served(Byte phase, Byte intx)
Description: For a given phase number of an intersection, this function returns the number of
lanes it serves.
Parameter1: Phase number
Parameter2: Intersection to which the phase belongs
Return value: None
Function Number: 12
Syntax: void NT_lanes_served_phase(Byte phase, Byte intx)
Description: For a given phase number of an intersection, this function computes the lanes being
served by it.
Parameter1: Phase number
Parameter2: Intersection to which the phase belongs

An External Logic Architecture for Implementing Traffic Signal System Control Strategies 70
Return value: None
Function Number: 13
Syntax: Byte NT_lane_mvmnt(Byte lane, Byte phase, Byte intx)
Description: For a given lane number and phase of an intersection, this function returns a number
that represents the movements being served by the lane.
Parameter1: Lane number (starts from inside, inside most lane is number 1)
Parameter2: Phase that serves the lane, it defines the approach of intersection
Parameter3: Intersection to which the phase belongs
Return value: Number representing the movement being served according to the Lane-
Movement Assignment Table described inside the function.
Function Number: 14
Syntax: void print_lane_mvmnts(Byte intx)
Description: For a given intersection, this function prints the movements each lane serves.
Parameter1: Intersection to which the phase belongs
Return value: None.
Function Number: 15
Syntax: int NT_det_position(Byte det, Byte intx)
Description: For a given detector number at a given intersection, this function returns the
position of the detector, i.e., distance from the stop bar.
Parameter1: Detector number
Parameter2: Intersection to which the detector belongs
Return value: None.

An External Logic Architecture for Implementing Traffic Signal System Control Strategies 71
APPENDIX B: Comparison of Phase Maximum Green and Phase Passage
Values
Table 6: Phase Max Green Comparison for Data Reading Capability Test
Table 7: Phase Passage Comparison for Data Reading Capability Test

An External Logic Architecture for Implementing Traffic Signal System Control Strategies 72
APPENDIX C: Signal State Comparison of I5-Off ramp Intersection
Figure 24: Comparison of signal status data (intersection 2).
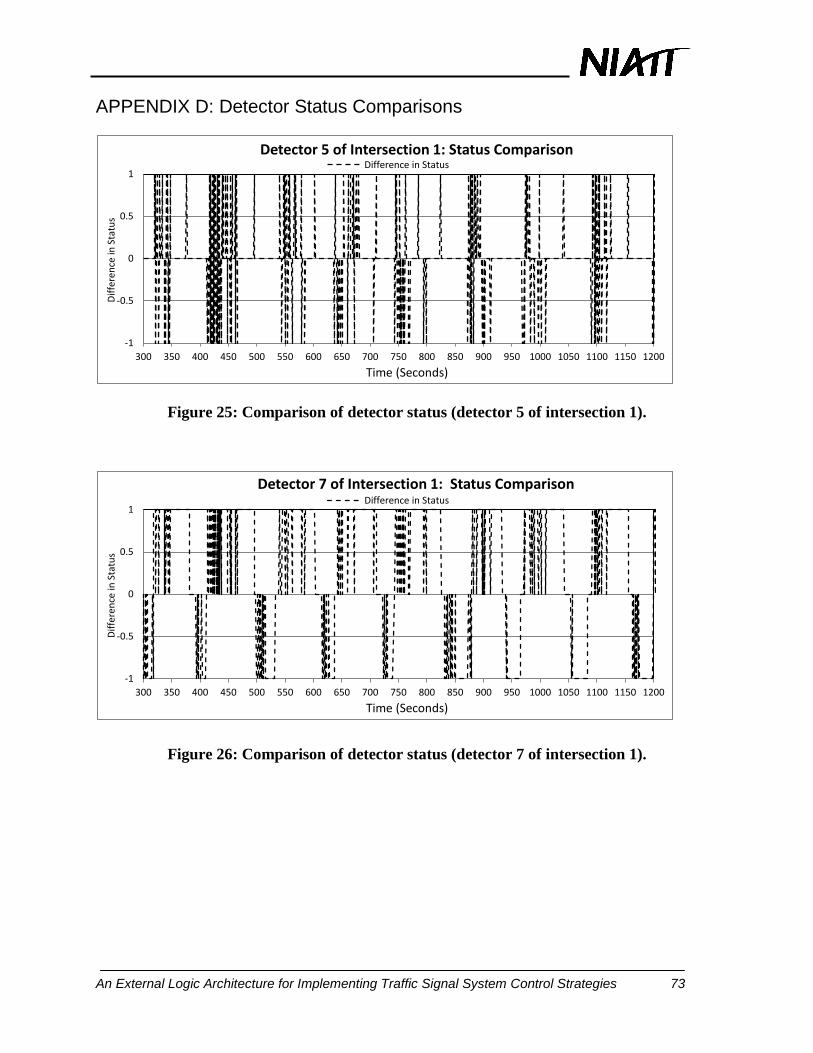
An External Logic Architecture for Implementing Traffic Signal System Control Strategies 73
APPENDIX D: Detector Status Comparisons
Figure 25: Comparison of detector status (detector 5 of intersection 1).
Figure 26: Comparison of detector status (detector 7 of intersection 1).
-1
-0.5
0
0.5
1
300 350 400 450 500 550 600 650 700 750 800 850 900 950 1000 1050 1100 1150 1200
Dif
fere
nce
in S
tatu
s
Time (Seconds)
Detector 5 of Intersection 1: Status Comparison Difference in Status
-1
-0.5
0
0.5
1
300 350 400 450 500 550 600 650 700 750 800 850 900 950 1000 1050 1100 1150 1200
Dif
fere
nce
in S
tatu
s
Time (Seconds)
Detector 7 of Intersection 1: Status Comparison Difference in Status
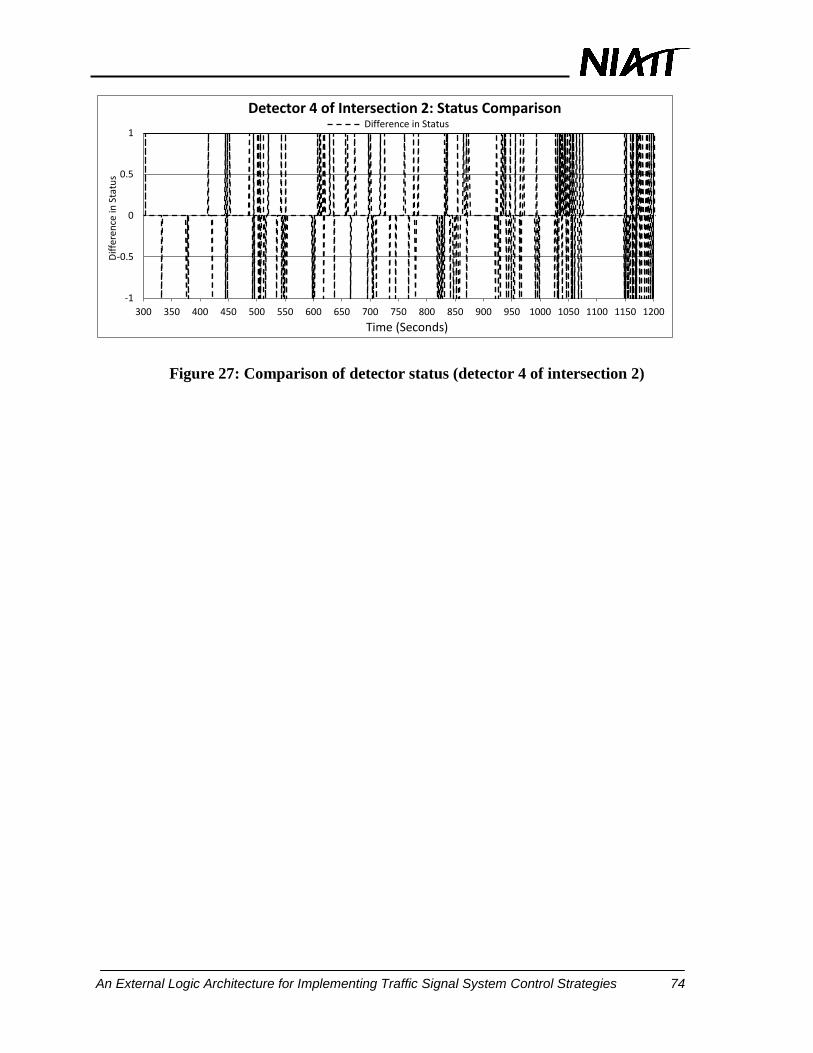
An External Logic Architecture for Implementing Traffic Signal System Control Strategies 74
Figure 27: Comparison of detector status (detector 4 of intersection 2)
-1
-0.5
0
0.5
1
300 350 400 450 500 550 600 650 700 750 800 850 900 950 1000 1050 1100 1150 1200
Dif
fere
nce
in S
tatu
s
Time (Seconds)
Detector 4 of Intersection 2: Status Comparison Difference in Status

An External Logic Architecture for Implementing Traffic Signal System Control Strategies 75
APPENDIX E: Paired t-Tests for GTU Comparison
Table 8: Intersection 1 Phase 4 GTU Comparison (Paired t-Test)
Microcontroller Simulation-based
Mean 47.40 44.73 Variance 43.89 44.74 Observations 30 30 Hypothesized Mean Difference 0
df 29 t Stat 4.22 P(T<=t) two-tail 0.0002 t Critical two-tail 2.05
Table 9: Intersection 1 Phase 5 GTU Comparison (Paired t-Test)
Microcontroller Simulation-based
Mean 35.14 32.63 Variance 68.98 58.03 Observations 30 30 Hypothesized Mean Difference 0
df 29 t Stat 8.19 P(T<=t) two-tail 5.00E-09 t Critical two-tail 2.05
Table 10: Intersection 1 Phase 4 GTU Comparison (Paired t-Test with Hypothesized Mean
Difference)
Microcontroller Simulation-based
Mean 47.65 45.04 Variance 43.53 43.35 Observations 30 30 Hypothesized Mean Difference 1.50
df 29 t Stat 1.71 P(T<=t) two-tail 0.10 t Critical two-tail 2.05

An External Logic Architecture for Implementing Traffic Signal System Control Strategies 76
Table 11: Intersection 1 Phase 5 GTU Comparison (Paired t-Test with Hypothesized Mean
Difference)
Microcontroller Simulation-based
Mean 47.65 45.04 Variance 43.53 43.35 Observations 30 30 Hypothesized Mean Difference 1.50
df 29 t Stat 1.71 P(T<=t) two-tail 0.10 t Critical two-tail 2.05

An External Logic Architecture for Implementing Traffic Signal System Control Strategies 77
APPENDIX F: List of the Most Commonly Used OIDs
1.3.6.1.4.1.1206.4.2.1.1 phase
1.3.6.1.4.1.1206.4.2.1.1.1 maxPhases
1.3.6.1.4.1.1206.4.2.1.1.2.1.1 phaseNumber
1.3.6.1.4.1.1206.4.2.1.1.2.1.2 phaseWalk
1.3.6.1.4.1.1206.4.2.1.1.2.1.3 phasePedestrianClear
1.3.6.1.4.1.1206.4.2.1.1.2.1.4 phaseMinimumGreen
1.3.6.1.4.1.1206.4.2.1.1.2.1.5 phasePassage
1.3.6.1.4.1.1206.4.2.1.1.2.1.6 phaseMaximum1
1.3.6.1.4.1.1206.4.2.1.1.2.1.7 phaseMaximum2
1.3.6.1.4.1.1206.4.2.1.1.2.1.8 phaseYellowChange
1.3.6.1.4.1.1206.4.2.1.1.2.1.9 phaseRedClear
1.3.6.1.4.1.1206.4.2.1.1.2.1.12 phaseMaximumInitial
1.3.6.1.4.1.1206.4.2.1.1.2.1.13 phaseTimeBeforeReduction
1.3.6.1.4.1.1206.4.2.1.1.2.1.15 phaseTimeToReduce
1.3.6.1.4.1.1206.4.2.1.1.2.1.17 phaseMinimumGap
1.3.6.1.4.1.1206.4.2.1.1.2.1.19 phaseDynamicMaxStep
1.3.6.1.4.1.1206.4.2.1.1.2.1.20 phaseStartup
1.3.6.1.4.1.1206.4.2.1.1.2.1.21 phaseOptions
1.3.6.1.4.1.1206.4.2.1.1.2.1.22 phaseRing
1.3.6.1.4.1.1206.4.2.1.1.3 maxPhaseGroups
1.3.6.1.4.1.1206.4.2.1.1.4 phaseStatusGroupTable
1.3.6.1.4.1.1206.4.2.1.1.4.1 phaseStatusGroupEntry
1.3.6.1.4.1.1206.4.2.1.1.4.1.1 phaseStatusGroupNumber
1.3.6.1.4.1.1206.4.2.1.1.4.1.2 phaseStatusGroupReds
1.3.6.1.4.1.1206.4.2.1.1.4.1.3 phaseStatusGroupYellows
1.3.6.1.4.1.1206.4.2.1.1.4.1.4 phaseStatusGroupGreens
1.3.6.1.4.1.1206.4.2.1.1.4.1.5 phaseStatusGroupDontWalks
1.3.6.1.4.1.1206.4.2.1.1.4.1.6 phaseStatusGroupPedClears
1.3.6.1.4.1.1206.4.2.1.1.4.1.7 phaseStatusGroupWalks
1.3.6.1.4.1.1206.4.2.1.1.4.1.8 phaseStatusGroupVehCalls
1.3.6.1.4.1.1206.4.2.1.1.4.1.9 phaseStatusGroupPedCalls
1.3.6.1.4.1.1206.4.2.1.1.4.1.10 phaseStatusGroupPhaseOns
1.3.6.1.4.1.1206.4.2.1.1.4.1.11 phaseStatusGroupPhaseNexts
1.3.6.1.4.1.1206.4.2.1.1.5 phaseControlGroupTable
1.3.6.1.4.1.1206.4.2.1.1.5.1 phaseControlGroupEntry
1.3.6.1.4.1.1206.4.2.1.1.5.1.1 phaseControlGroupNumber
1.3.6.1.4.1.1206.4.2.1.1.5.1.2 phaseControlGroupPhaseOmit
1.3.6.1.4.1.1206.4.2.1.1.5.1.3 phaseControlGroupPedOmit
1.3.6.1.4.1.1206.4.2.1.1.5.1.4 phaseControlGroupHold
1.3.6.1.4.1.1206.4.2.1.1.5.1.5 phaseControlGroupForceOff
1.3.6.1.4.1.1206.4.2.1.1.5.1.6 phaseControlGroupVehCall
1.3.6.1.4.1.1206.4.2.1.1.5.1.7 phaseControlGroupPedCall
1.3.6.1.4.1.1206.4.2.1.2 detector

An External Logic Architecture for Implementing Traffic Signal System Control Strategies 78
1.3.6.1.4.1.1206.4.2.1.2.1 maxVehicleDetectors
1.3.6.1.4.1.1206.4.2.1.2.2 vehicleDetectorTable
1.3.6.1.4.1.1206.4.2.1.2.2.1 vehicleDetectorEntry
1.3.6.1.4.1.1206.4.2.1.2.2.1.1 vehicleDetectorNumber
1.3.6.1.4.1.1206.4.2.1.2.2.1.2 vehicleDetectorOptions
1.3.6.1.4.1.1206.4.2.1.2.2.1.4 vehicleDetectorCallPhase
1.3.6.1.4.1.1206.4.2.1.2.2.1.5 vehicleDetectorSwitchPhase
1.3.6.1.4.1.1206.4.2.1.2.2.1.6 vehicleDetectorDelay
1.3.6.1.4.1.1206.4.2.1.2.2.1.7 vehicleDetectorExtend
1.3.6.1.4.1.1206.4.2.1.2.2.1.8 vehicleDetectorQueueLimit
1.3.6.1.4.1.1206.4.2.1.2.2.1.9 vehicleDetectorNoActivity
1.3.6.1.4.1.1206.4.2.1.2.2.1.10 vehicleDetectorMaxPresence
1.3.6.1.4.1.1206.4.2.1.2.2.1.11 vehicleDetectorErraticCounts
1.3.6.1.4.1.1206.4.2.1.2.2.1.12 vehicleDetectorFailTime
1.3.6.1.4.1.1206.4.2.1.2.2.1.13 vehicleDetectorAlarms
1.3.6.1.4.1.1206.4.2.1.2.2.1.14 vehicleDetectorReportedAlarms
1.3.6.1.4.1.1206.4.2.1.2.2.1.15 vehicleDetectorReset
1.3.6.1.4.1.1206.4.2.1.2.3 maxVehicleDetectorStatusGroups
1.3.6.1.4.1.1206.4.2.1.2.4 vehicleDetectorStatusGroupTable
1.3.6.1.4.1.1206.4.2.1.2.4.1 vehicleDetectorStatusGroupEntry
1.3.6.1.4.1.1206.4.2.1.2.4.1.1 vehicleDetectorStatusGroupNumber
1.3.6.1.4.1.1206.4.2.1.2.4.1.2 vehicleDetectorStatusGroupActive
1.3.6.1.4.1.1206.4.2.1.2.4.1.3 vehicleDetectorStatusGroupAlarms
1.3.6.1.4.1.1206.4.2.1.2.5 volumeOccupancyReport
1.3.6.1.4.1.1206.4.2.1.2.5.1 volumeOccupancySequence
1.3.6.1.4.1.1206.4.2.1.2.5.2 volumeOccupancyPeriod
1.3.6.1.4.1.1206.4.2.1.2.5.3 activeVolumeOccupancyDetectors
1.3.6.1.4.1.1206.4.2.1.2.5.4 volumeOccupancyTable
1.3.6.1.4.1.1206.4.2.1.2.5.4.1 volumeOccupancyEntry
1.3.6.1.4.1.1206.4.2.1.2.5.4.1.1 detectorVolume
1.3.6.1.4.1.1206.4.2.1.2.5.4.1.2 detectorOccupancy
1.3.6.1.4.1.1206.4.2.1.2.6 maxPedestrianDetectors
1.3.6.1.4.1.1206.4.2.1.2.7 pedestrianDetectorTable
1.3.6.1.4.1.1206.4.2.1.2.7.1 pedestrianDetectorEntry
1.3.6.1.4.1.1206.4.2.1.2.7.1.1 pedestrianDetectorNumber
1.3.6.1.4.1.1206.4.2.1.2.7.1.2 pedestrianDetectorCallPhase
1.3.6.1.4.1.1206.4.2.1.2.7.1.3 pedestrianDetectorNoActivity
1.3.6.1.4.1.1206.4.2.1.2.7.1.4 pedestrianDetectorMaxPresence
1.3.6.1.4.1.1206.4.2.1.2.7.1.5 pedestrianDetectorErraticCounts
1.3.6.1.4.1.1206.4.2.1.2.7.1.6 pedestrianDetectorAlarms
1.3.6.1.4.1.1206.4.2.1.3.13 maxSpecialFunctionOutputs
1.3.6.1.4.1.1206.4.2.1.3.14 specialFunctionOutputTable
1.3.6.1.4.1.1206.4.2.1.3.14.1 specialFunctionOutputEntry
1.3.6.1.4.1.1206.4.2.1.3.14.1.1 specialFunctionOutputNumber
1.3.6.1.4.1.1206.4.2.1.3.14.1.3 specialFunctionOutputControl
1.3.6.1.4.1.1206.4.2.1.3.14.1.4 specialFunctionOutputStatus
An External Logic Architecture for Implementing Traffic Signal System Control Strategies 79
1.3.6.1.4.1.1206.4.2.1.4 coord
1.3.6.1.4.1.1206.4.2.1.4.1 coordOperationalMode
1.3.6.1.4.1.1206.4.2.1.4.2 coordCorrectionMode
1.3.6.1.4.1.1206.4.2.1.4.3 coordMaximumMode
1.3.6.1.4.1.1206.4.2.1.4.4 coordForceMode
1.3.6.1.4.1.1206.4.2.1.4.5 maxPatterns
1.3.6.1.4.1.1206.4.2.1.4.6 patternTableType
1.3.6.1.4.1.1206.4.2.1.4.7 patternTable
1.3.6.1.4.1.1206.4.2.1.4.7.1 patternEntry
1.3.6.1.4.1.1206.4.2.1.4.7.1.1 patternNumber
1.3.6.1.4.1.1206.4.2.1.4.7.1.2 patternCycleTime
1.3.6.1.4.1.1206.4.2.1.4.7.1.3 patternOffsetTime
1.3.6.1.4.1.1206.4.2.1.4.7.1.4 patternSplitNumber
1.3.6.1.4.1.1206.4.2.1.4.7.1.5 patternSequenceNumber
1.3.6.1.4.1.1206.4.2.1.4.8 maxSplits
1.3.6.1.4.1.1206.4.2.1.4.9 splitTable
1.3.6.1.4.1.1206.4.2.1.4.9.1 splitEntry
1.3.6.1.4.1.1206.4.2.1.4.9.1.1 splitNumber
1.3.6.1.4.1.1206.4.2.1.4.9.1.2 splitPhase
1.3.6.1.4.1.1206.4.2.1.4.9.1.3 splitTime
1.3.6.1.4.1.1206.4.2.1.4.9.1.4 splitMode
1.3.6.1.4.1.1206.4.2.1.4.9.1.5 splitCoordPhase
1.3.6.1.4.1.1206.4.2.1.4.10 coordPatternStatus
1.3.6.1.4.1.1206.4.2.1.4.11 localFreeStatus
1.3.6.1.4.1.1206.4.2.1.4.12 coordCycleStatus
1.3.6.1.4.1.1206.4.2.1.4.13 coordSyncStatus
1.3.6.1.4.1.1206.4.2.1.4.14 systemPatternControl