an image processing tool for automatic germline tp53 r337h ... · an image processing tool for...
TRANSCRIPT
An Image Processing Tool for Automatic germlineTP53 R337H Mutation Detection through
PCR-RFLP
J. J. Dos Santosa1, E. Falcon b J. L. Vazqueza and H. Legala,1
aNational University of Asuncion, San Lorenzo, ParaguaybLittle Prince College, Curitiba, Brazil
Abstract
This article proposes an algorithm for the analysis of electrophore-sis gel images, as an auxiliary tool for the automatic identification ofthe bands that contain these images by the specific PCR-RFLP as-say. The correct identification of the bands within each lane leads tothe correct identification of positive and negative results of the TP53R337H germline mutation for each sample. The proposed methodol-ogy is composed of the following steps: (1) Separation of the red-colorchannel because it results in the best image quality. (2) gray levelpre-processing of the image using mathematical morphology. (3) au-tomatic binarization using Fuzzy C-Means thresholding technique. (4)filtering of the image using morphological binary recostruction, and (5)Detection of the bands and lanes by mask estimation.
Keywords: DNA gel image processing, thresholding, mathematical mor-
phology, DNA mutation, PCR-RFLP assay.
1. Introduction
The tumor suppressor gene TP53 is the most frequently mutated genein human cancer, and the germline TP53 R337H mutation is the most com-mon mutation reported to date [1]. Efforts to identify this mutation inBrazil and at the area around the Brazilian-Paraguayan border were moti-vated by the highest adrenocortical carcinoma (ACC) incidence worldwidein children from the Parana-State [1]. Presence of the germline mutation isperformed using the DNA PCR-restriction fragment length polymorphism(RFLP). The final step of PCR-RFLP assay leads to the interpretation ofan image captured from an electrophoresis gel illuminated by an ultravioletlight source.
The detection of bands on the DNA electrophoresis gel images is funda-mental for the diagnosis of a possible mutation of TP53 gene, but the correct
1E-mail Corresponding Author: [email protected]
identification of such bands in some cases becomes difficult for the humanvisual perception, due to artifacts in images such as noise, low contrast ornotable variations in the intensity of image gray level without correspond-ing them to the bands. Such factors could lead to erroneous or unwantedconclusions.
Ismail’s proposal [5] for segmentation and detection of the DNA gelimages contains two stages, the first one being pre-processing and the seconcone is the detection of the lanes of bands.
Jiann [6] proposes an automatic procedure for analyzing the DNA gelimages and exclusion of the unwanted background.
Skutkova et al [7], propose an algorithm for the segmentation and en-hancment of the lanes detection from the bands of DNA gel images.
Sara and Daniel [8] propose a technique for the segmentation of imagesand the automatic detection of bands on images of electrophoresis gel, basedon differents methods such as fuzzy C-means and Particle Swarm Optimiza-tion
Troy and Steven [9] proposes a tracking algorithm of lane of bands on theimages of electrophoresis gel using intensity levels of gray in local maxima.
Akbari and Albregtsen [10] propose an algorithm for the automatic seg-mentation of the bands of DNA gel, based on the variance, maximun re-stricted verisimilitude and the equivalent widht.
Leal and Leal [11] propose an algorithm for the reading automation ofelectrophoresis gel images based on artificial vision with the use of neuralnetworks.
This article proposes a method for the segmentation and automatic de-tection of the bands on images electrophoresis gel. The scheme presentedis detailed as follows. In section 2, the pre-processing of the image and itssegmentation are presented. In section 3, the proposed method that is pre-sented is that it consists on the detection of the positions of the bands. InSection 4, the results of experimental tests are detailed with the percentagesof errors and successes. Finally, in section 5, the conclusion is presented
2. Pre-processing
The first step of the proposed approach consists in the separation of thethree RGB channels and the selection of the red channel. This is done be-cause the objects in the gel electrophoresis image databes used are identifiedmore clearly and with less noise than a standard RGB to grayscale imageconversion. Images in the red channel are already considered grayscale,making it possible to process them directly.

2.1. Separation of objects and background
Notable variations in intensity of gray levels as a result of high-frequencynoise, are one of the problems in the images of electrophoresis gel. Firstly,segmentation is processed with a mathematical morphology operation onimage gray levels, specifically an erosion, where the image is eroded repeat-edly with a 6×6 mask. After a substraction operation between the image ofthe red- color channel and the result of erosion of the same image, the ob-jects that present high gray level intensity are obtained and then the imagebackground is removed.
2.2. Binarization of the image with Fuzzy C-Means threshold-ing method
The problem of the thresholding for the electrophoresis DNA gel imagesis based on the identification of an optimal threshold for the separation of theobject and the image background. After testing 20 thresholding methods,the method based on Fuzzy C-Means Clustering provided the best result forimage binarization. The Fuzzy C-means method is an algorithm of parti-tional clustering, based on objective functions, that depending on the fuzzypartition defines a clustering criterion as an objective function. The methodfinds C clusters, in which, an element may belong to more than one clusterwith a membership certain value. The membership function of an elementto the cluster is given between the range [0, 1]. In other words, an elementmay belong to all classes, to one or none [3].
In the case of thresholding of digital images through object and back-ground visualization of fuzzy sets, objects O and B, with each pixel thatshows a partial membership to each region depending on its gray level, µbeing the membership function, the value for each pixel xi,j may belong toµO(x(i,j)) ∈ [0, 1], µB(x(i,j)). ∈ [0, 1] [3].
Where µ = (µ1, µ2, · · · , µc) is the membership functionFuzzy C-Means algorithm minimizes the following objective function:
SF =∑i,j∈n
k∑c=1
µqc(i,j)||x(i, j)− vc||2 (1)
that is the Sum Square Error. Where
µc(i,j) =
[k∑
c=1
(||x(i, j)− vc||||x(i, j)− vn||
)2/(q−1)]−1
(2)
and the centroid in the c-th cluster.
vc =
∑i,j∈n
uqc(i,j)x(i, j)∑i,j∈n
uqc(i,j)(3)
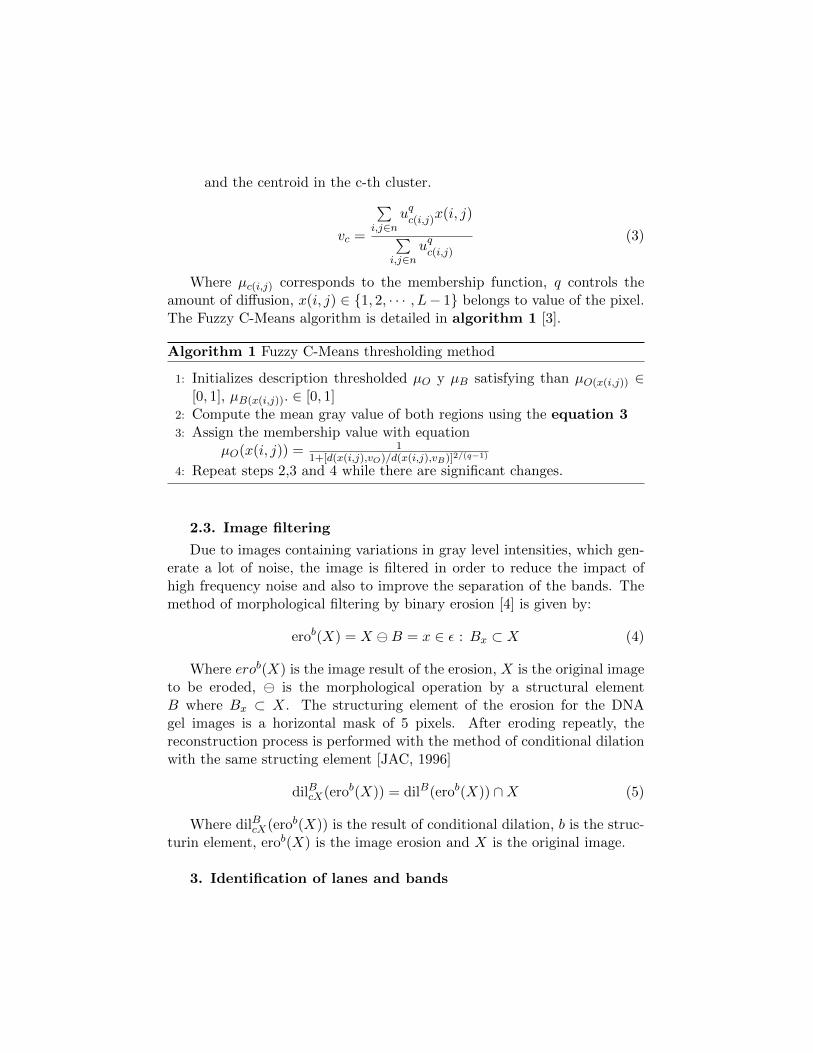
Where µc(i,j) corresponds to the membership function, q controls theamount of diffusion, x(i, j) ∈ {1, 2, · · · , L− 1} belongs to value of the pixel.The Fuzzy C-Means algorithm is detailed in algorithm 1 [3].
Algorithm 1 Fuzzy C-Means thresholding method
1: Initializes description thresholded µO y µB satisfying than µO(x(i,j)) ∈[0, 1], µB(x(i,j)). ∈ [0, 1]
2: Compute the mean gray value of both regions using the equation 33: Assign the membership value with equation
µO(x(i, j)) = 11+[d(x(i,j),vO)/d(x(i,j),vB)]2/(q−1)
4: Repeat steps 2,3 and 4 while there are significant changes.
2.3. Image filtering
Due to images containing variations in gray level intensities, which gen-erate a lot of noise, the image is filtered in order to reduce the impact ofhigh frequency noise and also to improve the separation of the bands. Themethod of morphological filtering by binary erosion [4] is given by:
erob(X) = X B = x ∈ ε : Bx ⊂ X (4)
Where erob(X) is the image result of the erosion, X is the original imageto be eroded, is the morphological operation by a structural elementB where Bx ⊂ X. The structuring element of the erosion for the DNAgel images is a horizontal mask of 5 pixels. After eroding repeatly, thereconstruction process is performed with the method of conditional dilationwith the same structing element [JAC, 1996]
dilBcX(erob(X)) = dilB(erob(X)) ∩X (5)
Where dilBcX(erob(X)) is the result of conditional dilation, b is the struc-turin element, erob(X) is the image erosion and X is the original image.
3. Identification of lanes and bands
After the morphological filtering, the number of lanes and their positionscould be determined through the detected bands. However, due to the factthat some bands may not be identified in the electrophoresis gel images,this could lead to undesirable conclusions with the diagnoses, because of themisidentification of positions of bands in the lanes. Thus, the proposed algo-rithm aims to correct the identification of each lane and positions of bandsthrough the projection of an estimated mask. The image is scanned forstorage of the coordinates of the pixels marked [M(i, j),M(x, y)], intervalscorresponding for each horinzontal lane, where M is the matrix of image seg-mented. Within the coordinates of horizontal lanes obtained, the image scanis performed in the given ranges, where the size average of the bands and thedistances between them, are calculated vertically and horizontally. Identi-fying the coordinates of the first band for each horizontal lane is carried outfor estimating the mask. The estimation mask is given by calculating posi-tions from the first lane, using the average size for bands and space betweenthem. The mask is projected onto the segmented image, where the search isperformed to pixels marked at intervals [M(i, j) + k(i, j),M(x, y) + k(x, y)]corresponding to lanes and bands. If at least one pixel is marked in theseintervals, the band is detected in its respective correct position. For thediagnosis of positive cases, the process algorithm must check whether threehorizontal lanes, are located in an average calculated interval. Detection ofone or more positive cases are identified in the specified columns. The algo-rithm for the detection of bands is detailed in algorithm 2 and in figure1.
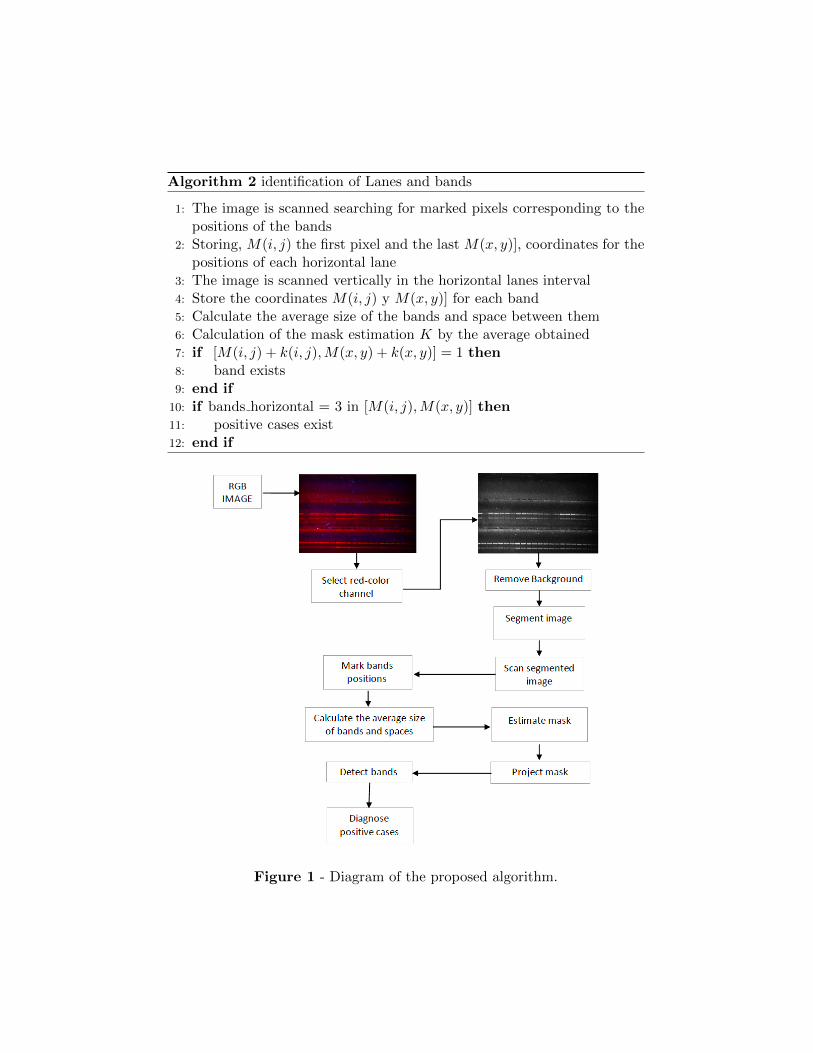
Algorithm 2 identification of Lanes and bands
1: The image is scanned searching for marked pixels corresponding to thepositions of the bands
2: Storing, M(i, j) the first pixel and the last M(x, y)], coordinates for thepositions of each horizontal lane
3: The image is scanned vertically in the horizontal lanes interval4: Store the coordinates M(i, j) y M(x, y)] for each band5: Calculate the average size of the bands and space between them6: Calculation of the mask estimation K by the average obtained7: if [M(i, j) + k(i, j),M(x, y) + k(x, y)] = 1 then8: band exists9: end if
10: if bands horizontal = 3 in [M(i, j),M(x, y)] then11: positive cases exist12: end if
Figure 1 - Diagram of the proposed algorithm.
4. Results
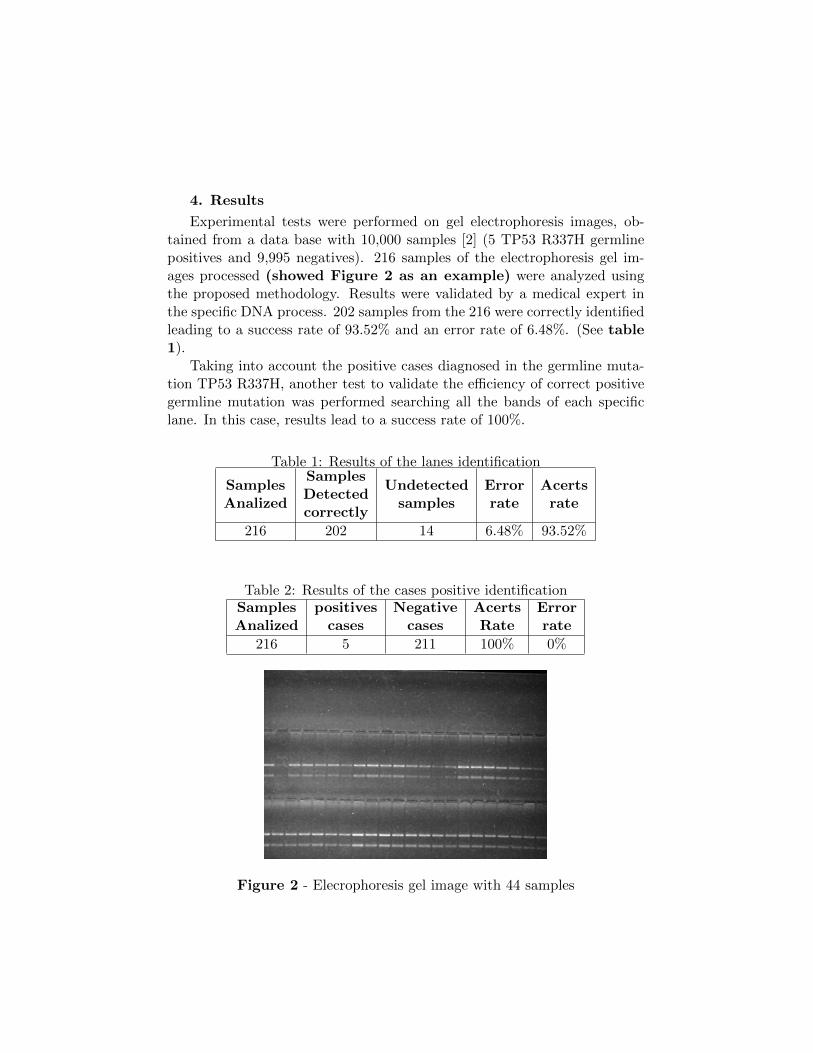
Experimental tests were performed on gel electrophoresis images, ob-tained from a data base with 10,000 samples [2] (5 TP53 R337H germlinepositives and 9,995 negatives). 216 samples of the electrophoresis gel im-ages processed (showed Figure 2 as an example) were analyzed usingthe proposed methodology. Results were validated by a medical expert inthe specific DNA process. 202 samples from the 216 were correctly identifiedleading to a success rate of 93.52% and an error rate of 6.48%. (See table1).
Taking into account the positive cases diagnosed in the germline muta-tion TP53 R337H, another test to validate the efficiency of correct positivegermline mutation was performed searching all the bands of each specificlane. In this case, results lead to a success rate of 100%.
Table 1: Results of the lanes identification
SamplesAnalized
SamplesDetectedcorrectly
Undetectedsamples
Errorrate
Acertsrate
216 202 14 6.48% 93.52%
Table 2: Results of the cases positive identificationSamplesAnalized
positivescases
Negativecases
AcertsRate
Errorrate
216 5 211 100% 0%
Figure 2 - Elecrophoresis gel image with 44 samples
5. Conclusion
This article presented a scheme for automatic identification of bands inthe electrophoresis gel images processed by the morphological filtering and abinarization method based on fuzzy C-Means algorithm. This algorithm wasproposed based on the projection of a mask estimated for the correct iden-tification of the bands and diagnostic of possible cases. Proposed approachresulted in a success rate of 93.52% and an error rate of 6.48% of samplesidentification. Efficiency of diagnosis of correcto positive germiline mutationlead to a success rate of 100%, but it may require futher validation, sincethe prevalence of the mutation is only 5/10,000 in the Paraguayan studiedpopulation.
References
[1] Ribeiro, R. C., Sandrini, F., Figueiredo, B., Zambetti, G. P.,Michalkiewicz, E., Lafferty, A. R., ... & Cat, I. (2001). An inheritedp53 mutation that contributes in a tissue-specific manner to pediatricadrenal cortical carcinoma. Proceedings of the National Academy ofSciences, 98(16), 9330-9335.
[2] Falcon-de Legal, E., Ascurra, M., Custodio, G., Ayala, H. L., Monteiro,M., Vega, C., ... & Ribeiro, E. M. (2015). Prevalence of an inheritedcancer predisposition syndrome associated with the germ line TP53R337H mutation in Paraguay. Cancer epidemiology, 39(2), 166-169. doi:10.1016/j.canep.2015.01.005.
[3] Jawahar, C. V., Biswas, P. K., & Ray, A. K. (1997). Investigationson fuzzy thresholding based on fuzzy clustering. Pattern Recognition,30(10), 1605-1613.
[4] Facon, J. (1996). Morfologıa Matematica. Teorıa y ejemplos. CuritibaBrasil, CITS.
[5] Ismail, I., Eltaweel, G. S., & Nassar, H. (2014). Bands detection andLanes segmentation in DNA Fingerprint images. J Inf Comput Sci, 9(4),243-51.
[6] Lee, J. D., Huang, C. H., Wang, N. W., & Lu, C. S. (2011). Auto-matic DNA sequencing for electrophoresis gels using image processingalgorithms. Journal of Biomedical Science and Engineering, 4(08), 523.
[7] Skutkova, H., Vitek, M., Krizkova, S., Kizek, R., & Provaznik, I. (2013).Preprocessing and classification of electrophoresis gel images using dy-namic time warping. International Journal of Electrochemical Science,8, 1609-1622.
[8] Ibrahim I.S., Allah Makhlouf, M. A., El-Tawel Ghada.S. andWahed M.E., ”Swarm Optimization Techniques for SegmentingGel Electrophoresis Images”, Department of Information Sys-tem, Suez Canal University, Ismailia, Egypt - 18-06-2016, DOI:10.3844/ajbsp.2016.18.33
[9] Zerr, T., & Henikoff, S. (2005). Automated band mapping in elec-trophoretic gel images using background information. Nucleic acids re-search, 33(9), 2806-2812.
[10] Akbari, A., & Albregtsen, F. (2004, September). Automatic segmenta-tion of DNA bands in one dimensional gel images produced by hybridiz-ing techniques. In Engineering in Medicine and Biology Society, 2004.IEMBS’04. 26th Annual International Conference of the IEEE (Vol. 2,pp. 2852-2855). IEEE.
[11] Leal, E., & Leal, N. (2010). Automatizacion de la Prueba HLA medianteanalisis de imagenes de gel de Electroforesis empleando Vision Artificial.