an innovative inroduction to engineering biotechnologyhtmls... · 4.4 factors affecting growth...
TRANSCRIPT

BIOREACTORS Engineering Biotechnology Gateway Project
Raj Mutharasan Drexel University

Foreward
The following "text" was written to provide a simple structure for discussion of issues governing manufacture of biopharmaceuticals. The manufacturing section is broken down into two main segments, namely bioreactors and bioseparations. The former deals with all issues from cell to expression of desired protein in a bioreactor while the latter is concerned with engineering issues that relate to purification of the expressed product. In this text, we discuss the bioreactor part. Bioseparations is being developed by Professor Jordan Spencer of Columbia University and will be added as soon as it is available. Most, if not all biochemical engineers employed by biotechnology companies work on problems related to bioreactors and bioseparations. Although the topic of bioreactors can be discussed in an entire course, the intent here is to provide a brief introduction to it so that the student becomes aware of issues in design of large scale systems. Many exhaustive treatments are available in the literature. To the author's knowledge, the simplified structure provided here is original for bioreactor analysis. It follows the pedagogical structure of building on the principles of stoichiometric calculations, thermodynamic and kinetic analyses an average engineering student learns in freshman courses. The "text" follows the structure: mass balance, then energy balance followed by rate analysis. Such an arrangement has been found to be successful in teaching chemical reactor design. The "text" was used in a course titled as "Engineering Biotechnology" at Drexel during Winter term of 1996. The material covered herein was discussed in 8 hours of instruction including recitation. This project, funded by the Gateway Coalition, is concerned with introducing the topic of Engineering Biotechnology to undergraduate engineering students of all majors as an elective. The idea is to provide breadth by integrating biological concepts and ideas with quantitative engineering principles. The challenge is to introduce major ideas from genetic engineering, biomanufacture, drug delivery and biosensors in a course consisting of 30 to 40 hours of instruction for a typical Junior engineering student. The author welcomes suggestions for improvement. He can be contacted at: [email protected].
Raj Mutharasan Philadelphia
March 25, 1996

Table of Contents
Chapter 1 Introduction ................................................................................................... 3 1-1 What is a Bioreactor? ........................................................................................ 3 1-2 Production and Purification ............................................................................... 5 1-3 Bioreactor Engineering Issues ........................................................................... 5 Chapter 2 Stoichiometry of Cellular Growth................................................................ 6 2.1 Cell Composition ............................................................................................... 7 2.2 Growth Reaction ................................................................................................ 8 2.3 Cell Yield and Stoichiometric Coefficents ........................................................ 9 2.4 Mathematical Definition of Yield...................................................................... 11 2.5 Measurement of Stoichiometric Coefficients ................................................... 14 Chapter 3 Thermodynamics of Cellular Growth .......................................................... 17 3-1 Heat Release due to Growth .............................................................................. 17 3-2 Heat of Combustion Data .................................................................................. 18 3-3 Experimental Observations................................................................................ 18 3-4 Heat Release when Extracellular Products are Formed..................................... 19 Chapter 4 Kinetics of Growth and Product Formation ................................................. 21 4.1 Growth Kinetics ................................................................................................. 21 4.2 What Does µ Depend on? .................................................................................. 22 4.3 Rate Expression and Metabolic Quotient .......................................................... 25 4.4 Factors Affecting Growth Rate .......................................................................... 26 4.5 Product Formation Kinetics ............................................................................... 29 Chapter 5 Oxygen Transfer in Bioreactors ................................................................... 36 5.1 Metabolic Oxygen Demand ............................................................................... 36 5.1 Volumetric Oxygen Mass Transfer Coefficient ................................................. 37 5.3 Bioreactor Oxygen Balance ............................................................................... 39 5.4 Measurement of KLa ......................................................................................... 40 5.5 Scale-up Design Considerations ........................................................................ 41 5.6 Case Studies ....................................................................................................... 41

Chapter 1 Introduction Commercial production of products produced by genetically engineered microorganisms requires two distinct body of knowledge, namely, molecular biology and process engineering. Background in molecular biology will enable us to create effectively expressed genes in microorganisms or cells of animal, insect or plant origin that can be used for industrial production. Background in process engineering principles wil enable us to design and operate large-scale plants for growing genetically-engineered organisms and for the subsequent processing of purification and formulation of product. In the early days, it was thought that scale-up was simply a matter of using larger volumes. That is, conditions that were found to be good at a small-scale would be equally effective on a larger scale and that to achieve this it was merely necessary to use a larger fermentor vessel with a larger medium volume. Such an approach resulted in not only product variability, both in terms of yield and quality, but also expensive operating costs. Hence, a systematic study of process engineering principles is needed for scaling up and operation of biotechnological processes for manufacture. 1.1 What is a Bioreactor? The heart of a bioprocess used for manufacture of biological, is a bioreactor. A commercial unit is illustrated in Fig 1-1. It is usually a large vessel ranging from 1000
QuickTime™ and aPhoto - JPEG decompressor
are needed to see this picture
Fig 1-1 Large Scale Fermentor Used for Cultivating Bacteria and Yeast.

Photo courtesy of Bioengineering, Inc. liters to 100,000 liters, made of stainless steel equipped with temperature, pH and dissolved oxygen measurement and control systems. The bioreactor is equipped with an agitation system to keep the contents uniformly mixed and to provide oxygen transfer. The design of the bioreactor should ensure sterility and provide for containment of the genetically engineered microorganism. The bioreactor includes sensors that permit monitoring of as many critical process parameters (temperature, pH, dissolved oxygen) as possible so that they can be adjusted to within allowable values. 1.2 Production and Purification Generally, large-scale microbial cultivation or cell culture, and product purification steps are carried out in a stepwise manner (Fig. 1-2).
Production
Ferm entor
Sterilize
Ferm entor &
M edium
Seed
Ferm entorStock Culture >>
Shake Flasks
Cell
Separation
Product
Purification
Figure 1-2 Steps in Large Scale Biotechnological Processes A typical procedure begins with the formulation and sterilization of growth medium and sterilization of the fermentation equipment. The cells are grown first as a stock culture (5 to 10 mL), then in a shake flask (200 to 1,000 mL), and then in a seed fermentor (10 to 100 liters). Finally, the production fermentor (1,000 to 100,000 liters) is inoculated. After the fermentation step is completed, the cells are separated from the culture fluid by either centrifugation or filtration. If the product is intracellular, the cells are disrupted, the cell debris removed, and the

product recovered from the debris-free broth. If the product is extracellular, it is purified from the cell-free culture medium. Although microorganisms can be grown in a number of different ways (batch, fed-batch, or continuous culture), it is most common to cultivate them in a batch fermentor. In batch fermentation, the sterile growth medium is inoculated with a suitable amount of microorganisms, and the fermentation, i.e cell growth, proceeds without any further addition of fresh growth medium. In some processes the cells themselves will be the product. In others the product is what the cells produce as they grow or as they are induced to produce. For example, in yeast manufacture the product is the biomass (cell) itself while in insulin manufacture, the product is formed as an intracellular product. In this case, the cells are disrupted to harvest the intracellular insulin and the cell debris is discarded. 1.3 Bioreactor Engineering Issues It is necessary to monitor and control culture parameters such as dissolved oxygen concentration, pH, temperature, and mixing regardless of the process that is used to grow cells. Changes in these parameters can significantly affect the process yield and the stability of product protein. Optimal growth of E. coli cells and many other microorganisms that are used as hosts (see section on Molecular Biology) for recombinant genes usually require large amounts of dissolved oxygen. Because oxygen is sparingly soluble in water (8.4 mg/L at 25°C), it must be supplied continuously -- generally in the form of sterilized air -- to a growing culture. The air produces bubbles and the stirrer is used to break up the bubbles and mix the content of the reactor. If air flow is inadequate or the air bubbles are too large, the rate of transfer of oxygen to the cells is low and is not sufficient to meet cellular oxygen demand. Thus the fermentors are equipped to monitor dissolved oxygen level of the medium, to transfer oxygen efficiently to the culture medium, and to mix the broth to provide a uniform culture environment. Temperature is another physiological parameter that is be monitored and controlled. Microorganisms have optimal temperature for growth. If grown at a temperature below the optimum, growth occurs slowly resulting in a reduced rate of cellular production. On the other hand, if the growth temperature is too high, not only will death occur, but in situations where the target protein may be under the control of temperature sensitive promoter, it may be expressed prematurely, lowering product yield. Most microorganisms grow optimally between pH 5 and 7. As the cells grow, metabolites are released into the medium, a process that can change medium pH. Therefore, the pH of the medium must be monitored and be adjusted by base or acid addition to maintain a constant pH.

Adequate mixing of a microbial culture is essential for ensuring adequate supply of nutrients and prevention of the accumulation of any toxic metabolites within the bioreactor. Although good mixing is easy to achieve at small scales, it is one of the major problems in increasing the scale of bioreactors. Agitation of the broth also affects the rate of transfer of oxygen and heat transfer removal via cooling coils. Excessive agitation can cause mechanical damage to microbial or mammalian cells. Hence a balance must be reached between the need to provide good mixing and the need to avoid cell damage.. The process design should also include factors that make it easy to implement Good Manufacturing Practices. Although most recombinant microorganisms are not hazardous, it is important to design processes that ensure that they are not inadvertently released into the environment. Hence, fail-safe systems should be considered in equipment design and operation to prevent accidental spills of live recombinant organisms and to contain them if a spill does occur. Furthermore, all recombinant microorganisms must be treated by a verified procedure to render them nonviable before they are discharged from the production facility, and the spent culture medium must also be treated to ensure that it does not contain viable organisms and that its disposal does not create an environmental hazard. Summary In this chapter you were introduced to main componenets of a biopharmaceutical manufacturing facility, and specifically issues concerning bioreactors. In the chapters following, we will learn how to determine material need of a bioreactor.

Chapter 2 Stoichiometry of Cellular Growth
A good starting point for discussion on cell growth is to examine what the cells are made of, that is its chemical composition. Although there are many different biological species, it turns out that a very large fraction of their mass is made of a few elements - carbon, oxygen, nitrogen and hydrogen. You will note that these are among the most abundantly found elements on earth. 2.1 Cell Composition Cells primarily contain water! Typically 70% of cell mass is water and the remaining is dry matter. Therefore it is conventional to express cell composition on a dry basis. The microorganism Eschericia coli is widely used in genetic engineering. Typical elements found in Eschericia coli are given below:
Table 1 Elemental Composition of E. coli (after Stanier et al)
Element % Dry
Weight C 50 O 20 N 14 H 8 P 3 S 1 K 1
Na 1 Ca 0.5 Mg 0.5 Cl 0.5 Fe 0.2
others 0.3 Nearly half of the dry matter in cells is carbon and the elements carbon, oxygen, nitrogen and hydrogen total up to about 92% of the total. This observation for E. coli is also found to be generally true for other cellular organisms.

Table 2 Elemental Composition of Microorganisms
Microorganism
Carbon Source
Growth Rate
Composition Empirical Formula Molecular Weight
C H N O Klibsiella aerogenes
Glycerol 0.1 50.6 7.3 13.0 29.0 CH1.74 O0.43 N0.22 23.7
Aerobacter aerogenes
Complex 48.7 7.3 13.9 21.1 CH1.78 O0.33 N0.24 22.5
Aerobacter aerogenes
Complex 0.9 50.1 7.3 14.0 28.7 CH1.73 O0.24 N0.43 24.0
Saccharomyces cerevisiae
47.0 6.5 7.5 31.0 CH1.66 O0.49 N0.13 23.5
Sachromyces cervisiae
50.3 7.4 8.8 33.5 CH1.75 O0.15 N0.5 23.9
Candida utilis Glucose 0.45 46.9 7.2 10.9 35.0 CH1.84 O0.56 N0.2 25.6 Candida utilis Ethanol 0.43 47.2 7.3 11.0 34.6 CH1.84 O0.55 N0.2 25.5 Table 2 above shows that in different microbes, the carbon content varies from 46 to 50%, hydrogen from 6 to 7%, nitrogen 8 to 14% and oxygen from 29 to 35%. These are small variations and the variations appear to depend on substrate and growth conditions. For many engineering calculations, it is reasonable to consider cell as a chemical species having the formula
This engineering approximation is a good starting point for many quantitative analysis while a more carefully formulated empirical formula based on proximate analysis may be necessary for complete material flow analysis. The cell molecular weight for the above cell formula is 12+1.8 + 0.5(16) +0.2 (14) = 24.6.
Example 2-1 Suppose we want to produce 10 g of cells using glucose as a carbon source. What is the minimum amount of glucose that would be needed? Solution Assume cell composition as CH1.8 O0.5 N0.2 Glucose is C6 H12 O6
MW of glucose is 180
Moles of cells to be grown = 10
24.6

Since glucose has 6 moles of carbon per mole of glucose,
Moles of glucos e needed = 16
• 10
24.6
Therefore, min glu cose needed = 16
• 10
24.6 • 180 ≈ 12.2 g
2.2 Growth Reaction In the above example, we have assumed that all of the carbon found in substrate (glucose) is incorporated into cell mass. This does not happen as the cell needs to “oxidize” or respire some of the carbon to produce energy for biosynthesis and maintenance of cellular metabolic machinery. In addition cells may produce extracellular products that accumulate in the broth. Hence we can represent growth as:
The medium is the “food” for the cell. It serves as a source for all elements needed by the cell to grow (or biosynthesis) and for product formation. The compounds carbon dioxide and water on the product side of the reaction above result from oxidation of glucose in the medium. Since the cellular material contains C, N, P, S, K, Na, Ca, etc, the medium must be formulated to supply these elements in the appropriate form. The above growth reaction can be re-stated as
If we neglect the “others” and assign stoichiometric coefficient for each of the species in the above equation on the basis of one mole of glucose (C-source) consumed, we re-write the above as
where ammonia represents the nitrogen source. We will refer to this reaction as growth reaction. Note that whatever nitrogen that is supplied in the medium, it is expressed as equivalent nitrogen in the form of ammonia. Cells require nitrogen in both organic and inorganic form. It is common to supply the inorganic nitrogen as salts of ammonium ( e.g. ammonium phosphate ) while the organic nitrogen is usually supplied as amino acids or proteinous extracts which are rich in nitrogen. In most production processes using recombinant cells, glucose is used as the carbon source. However, in the production of low value products, less expensive

carbon sources such as molasses ( $ 0.10 / lb) or corn meal ( about $ 0.12 / lb ) are used. Compare this against glucose at $ 1.00 /lb! The growth reaction derived above is useful in interpreting laboratory data reported in the literature. Because the early work in cell growth were reported by microbiologists, it is necessary for us to learn the terms used by microbiologists to describe growth stoichiometry. We will then relate the above reaction equation to commonly reported cell properties. 2.3 Cell Yield and Stoichiometric Coefficients Consider the experimental cell (Pseudomonas lindneri) growth data shown in Fig 2-1a, originally reported by Bauchop and Elsden. The experiment consisted of inoculating five test tubes containing growth medium with the bacterium. Each of the test tubes contained different concentrations of carbon source - in this case glucose at levels from about 4 mM to 36 mM. The cultures were incubated anaerobically (i.e. in absence of oxygen) at growth temperature ( 30 C) for two days or until growth ceases. The resulting cells were filtered, dried and weighed. This mass of bacteria obtained is plotted against the starting glucose concentration. The important observation illustrated by the data is the straight line relationship between carbon source concentration (reactant in chemical parlance) and the cell concentration ( product ).
Fig 2-1a Anaerobic growth of Pseudomonas lindneri on glucose . (Data from Bauschop et al 1960)
Glucose, mM
0
50
100
150
200
250
300
0 10 20 30 40
Slope = 7.2 µg/ml per mM
The slope of the line represents the amount of cells obtained per unit amount of glucose consumed.

If we convert the above to mass basis,
The above value is often called cell yield, growth yield, or yield. If one examines the growth reaction stated in the previous section, the slope (in mass units) we calculated above can be equated as follows.
In the above the numerator term contains the amount of cell created and the denominator contains the amount of substrate consumed. In other words, the measurements reported by Bauschop and Elsden enable us to calculate the stoichiometric coefficient, α. That is,
Let us consider another set of data shown in Figure 2-1b. The cell yield depends on growth conditions. You will note that under anaerobic conditions, slope (also yield) is 58.2 g (mol substrate)-1 ⇒ 0.32 g cell (g substrate)-1 . Similarly under anaerobic conditions, yield is 22 g (mol substrate)-1 ⇒ 0.21 g cell (g substrate)-1 . Invariably, the yield under anaerobic conditions will be smaller than at aerobic conditions because the cell derives significantly more metabolic energy under aerobic conditions. It is also important to note that not all cells can grow both aerobically and anaerobically.

Fig 2-1b Aerobic and anaerobic growth of Streptococcus faecalison glucose ( Bauschop et al 1960, also Smalley et al , 1968)
Substrate, mM
0
100
200
300
400
500
600
700
800
0 5 10 15
Yx/s = 58 g/mol
Yx/s = 22 g/mol
Aerobic
Anaerobic
From a practical viewpoint, an aerobic organism is preferred. This is because, the amount of product protein produced is proportional to cell amount. Higher biosynthesis is possible with aerobic cultures than with anaerobic ones. 2.4 Mathematical Definition of Yield Mathematically, cell yield can be defined as
where ∆X represents change in cell concentration and ∆S represents change in substrate concentration. The subscript X/S indicates the basis of yield - cell on the basis of substrate. This notation comes in handy when we need to calculate yield based on more than one substrate. Examining the above and comparing with growth reaction, one notes that the yield defined here corresponds to a mass-based stoichiometric coefficient. Taking the limit of Eq(2-2) as ∆S approaches zero,
The absolute sign is used to eliminate the negative value of the derivative. Note that dS is negative, because substrate is consumed. Yield is always reported as a positive value.

The above definition of yield can be applied to product, P on the basis of substrate consumed. Thus,
Similarly product yield based on cell will be expressed as,
In general, yield of the species, i, based on species, j, can be calculated from
From the above it is clear that we can combine two different yields which have a common species as
Example 2-2 Batley (1979) reported aerobic gowth of yeast on ethanol as: C2 H5 OH + 0.153 NH3 + 1.851 O2 → 1.03 CH1.704 O0.408 N0.149+ 0.970 CO2 + 2.346 H2O Calculate YX/E , YX/O2, YX/NH3 on mass basis. Solution MW of cell = 12 +1.704 +(14)•(0.149) + (16)•(0.408) = 22.32 MW of ethanol = (2)•(12) + 5 + 16 + 1 = 46 Y X/ E =
(1.03) • (MW of Cell)(1)• (MW of Ethanol)
= (1.03)• (22.32)
(46) ⇒ 0.5
Y X/O2 =
(1.03) • (MW of Cell)(1.851)• (MW of Oxygen)
= (1.03) • (22.32)(1.851)• (32)
⇒ 0.388
Y X/ NH3 =
(1.03) • (MW of Cell)(0.153)• (MW of Ammonia)
= (1.03) • (22.32)(0.153) • (17)
⇒ 8.839
Yield of yeast based on ethanol of about 0.5 is consistent with the observation that roughly one half of the substrate is converted to cell mass aerobically. If

yield on a carbohydrate source is significantly less than 0.5, it is likely that medium formulation is inadequate to support good growth.
Example 2-3 Yeast grown on glucose is described by C6 H12 O6 + 0.48 NH3 + 3 O2 → 0.48 C6H10 O3 N+ 3.12CO2 + 4.32 H2O Calculate the following for a design requiring 50 g/L of yeast in a batch reactor of 100,000 liters. • Nutirent media concentration for glucose and ammonium sulfate. • Calculate YX/S and YX/O2 • Calculate total oxygen required • Determine oxygen uptake rate (g O2 L-1 h-1)when cell concentration increases at a rate of 0.7 g L-1 h-1, Solution Total cell mass to be produced is = (105 L)•(50 g L-1) = 5000 kg YX / S =
(0.48)• (MW of Cell)(1) • (MW of Glucose)
= (0.48) • (144)
(180)
⇒ 0.384 g cell (g substrate)−1
YX / O2 = (0.48) • (MW of Cell)
(3)• (MW of O2 ) = (0.48) • (144)
(3) • (32)
⇒ 0.72 g cell (g O2 )−1
Glu cose needed =
(Cell Mass)(YX/ S)
= (5000)(0.384)
⇒ 13,020 kg

Ammonia needed = (Cell Mass)(Y X / NH3 )
= (5000)(8.471)
⇒ 590 kg ⇒ 130 g L−1
(NH4 )2 SO4 needed =
12
• (MW of (NH4 )2 SO4 )
MW NH3
• (Ammonia needed)
= 12
• 13217
• 590 ⇒ 2,292 kg ⇒ 22.9 g L−1
Total Oxygen Re quired = (Cell Mass)
(YX / O2)
⇒ 50000.72
= 6,944 kg
Oxygen Consumption Rate = Cell Mass Generation RateYX /O2
= 0.70.72
⇒ 0.972 g L−1 h
2.5 Measurement of Stoichiometric Coefficients For the growth reaction given in Eq(2-1), the ratio γ/b is called the respiratory quotient, often abbreviated as RQ. It is easily measured in large scale fermentors. In Eq(2-1), if the nature of extracellular product is known (i.e. x,y,z), then it is possible to calculate α,β,γ and δ from experimental measurement of RQ and one other measurement. If no significant amount of extracellular product is formed, as in simply growth processes, then only RQ or one other measurment is needed to compute stoichiometric coefficients. The example given below illustrates this idea.
Example 2-4 For the reaciton equation representing E. coli growth, RQ was measured as 0.85. Calculate α,β,γ and δ. C6 H12 O6 + a NH3 + b O2 → α CH1.8 O0.5 N0.2+ γCO2 + δH2O Solution The solution consists of carrying out elemental balances and then solving them. Here, we can write four elemental balances, C, H, O and N. We have five unknowns: α,β,γ and δ, a and b. One additional

relationship is obtained from the given RQ value, thus making the problem solvable! C balance: 6 = α+γ H balance: 12 + 3a = 1.8α + 2δ N balance: a = 0.2α O balance: 6+2b = 0.5α+ 2γ + δ
Rearranging the above system of algebraic equations:
1 1 0 0 01.8 0 2 −3 00.2 0 0 −1 00 1 0 0 −0.85
0.5 2 1 0 −2
αγδab
=
612006
Solution to the above yields
αγδab
=
612006
1 1 0 0 01.8 0 2 −3 00.2 0 0 −1 00 1 0 0 −0.85
0.5 2 1 0 −2
−1
Summary In this chapter we introduced the idea of growth reaction to characterize material balance associated with cell growth. We defined a chemical formula which represents about 95% of the dry matter of biomass. We also defined yield which enables us to derive usful engineering information from literature articles that report cell yield. To carry out material balances around a fermentor requires, in general, respiratory quotient values and one other measurement.

Chapter 3 Thermodynamics of Cellular Growth
Microbial growth consists of a complex network of metabolic reactions. Coupled catabolic and anabolic reactions take place so that energy released in the former is efficiently used to drive the latter. However, some energy is always lost as heat. The purpose of this chapter is to quantify the heat release due to growth. In large-scale processes it is necessary to remove this heat so that the culture is maintained at physiological temperature. In small reactors metabolic heat is removed quite easily, while in very large fermentors ( >10,000 liters) in which rapidly growing cells are cultivated, it is necessary to design adequate heat transfer area for heat removal. Bioreactor temperatures must be maintained within ± 0.5 C to maintain physiologic conditions conducive to optimal growth. 3-1 Heat Release due to Growth Consider the growth reaction when no significant amount of extracellular product is formed. Under these conditions Eq (2-1) simplifies to
C6 H12 O6 + a NH3 + b O2 → α CH1.8 O0.5 N0.2+ γCO2 + δH2O Since nitrogen consumption is usually small compared to the amount of carbon consumed, and that nitrogen does not go through oxidation (while C does !), we can approximate the above as,
C6 H12 O6 + b O2 → α CH1.8 O0.5 N0.2+ γCO2 + δH2O Consider heat balance of this reaction using one mole of glucose consumed as the basis. Heat released = (α) • [(MW biomass) • (-∆Hc)] - (-∆Hs) • (MW substrate) (3-1) where (-∆Hc) and (-∆Hs) are heat of combustion per gram of cell and per gram of substrate respectively. Rearranging,
Heat releasedMW substrate
= (α) • MW biomassMW substrate
• (−∆Hc) − (−∆Hs ) (3-2)
The left hand side is the amount of heat released per gram of substrate consumed and the coefficient of the first term on the right is growth yield. That is, Y∆/S = (YX/S) • (-∆Hc) - (-∆Hs) (3-3)

where Y∆/S is "heat yield" on the basis of substrate consumed. Dividing the above by YX/S gives Y∆ / x = (−∆Hc ) −
(−∆Hs )(YX / S )
(3-4)
Both Eq (3-1) and (3-2) are useful in determining heat release due to growth, Y∆/X and substrate consumption, Y∆/S . 3-2 Heat of Combustion Data Heat of combustion has been reported by a number of authors and a few are given below in Table 3-1. The heat of combustion for a variety of organism falls in a very narrow range of about 22 kJ g-1. Heat of combustion of glucose, commonly used substrate, is 15.6 kJ g-1.
Table 3-1 Heat of Combustion of Biomass Organism (-∆∆∆∆HS), kJ g-1
E. coli 23.03 E. cloacae 22.83 B. thuringiensis 22.08 Candida lipolytica 21.34 Candida boidinii 20.14 Kluyveromyces fragilis 21.66
3-3 Experimental Observations Cooney and co-workers collected heat release experimental data for a number of different organisms by making careful heat balance measurements over a fermentor. The data show a linear relationship between heat released and oxygen consumption rate (Fig 2-1).

0
1
2
3
4
5
6
7
8
0 10 20 30 40 50Oxygen Consumption, mM/L-h
Slope = 124±3 kcal/molO2
Figure 3-1 Experimental Heat Release Data (after Cooney et al ) The slope of the line above is equal to the amount of heat released per mol of oxygen consumed. That is:
Y ∆/ O2 =(124)(32)
kcal (g O2 )−1 ⇒ 3.88 kcal (g O2 )−1 ⇒ 16.21 kJ (g O2 )−1
This result enables one to calculate heat generation rate from oxygen uptake rate information. We will examine oxygen uptake rate data in Chapter 5. 3.4 Heat Release when Extracellular Products are Formed When significant amount of product is present, Eq 3.1 will be modified to Heat released = (α) * (MW biomass) * (-∆HC) + (β) * (MW product) * (-∆HP) - (-∆HS) * (MW substate) (3-5) where (-∆HP) is heat of combustion per gram of extracellular product(s). Dividing the above by MW of substate gives YD/S = (YX/S) * (-∆HC) + (YP/S) * (-∆HP) - (-∆HS) (3-6)

Dividing the above by YS/X gives Y∆/X = (-∆HC) + (YP/X) * (-∆HP) - (-∆HS) (3-7) (YX/S)

Chapter 4 Kinetics of Growth and Product Formation 4.1 Growth Kinetics If a viable inoculum is introduced into a medium that contains a carbon source, suitable nitrogen source, other nutrients necessary for growth, and physiologic temperature and pH are maintained, it will grow. The rate of biomass synthesis is proportional to biomass present. That is rx = µ X (4-1) where rx is the amount of cells synthesized in g L-1 h-1 , X is cell concentration in g L-1 . The parameter µ is called specific growth rate, analogous to the specific rate constant in chemical reaction rate expressions. Recall the treatment of chemical reactions, summarized below for ease of reference. Reaction: A → B Rate Expression: -rA = k CA
In the above CA is concentration of A ( mol A L-1 ), -rA is reaction rate ( mol A L-1 h -1 ) and k is rate constant ( h -1 ). The negative sign in front of -rA is to comply with the definition of rA, which is the rate of generation of A. In Eq(4-1), the negative sign is not necessary as X increases with time. Consider cell balance over a batch bioreactor:
Cells in - cells out + Generation of Cells = Accumulation of cells in Bioreactor
0 - 0 + (rX) * (V) = d(Vx) dt
Substituting for rx from Eq(4-1) and noting that volume of reactor is constant gives, = µ X (4-2) The above can be expressed as µ = =
dXdt
∆XX
•
1∆t
1X
dXdt
The term, ∆X/X , represents fractional increase in cell amount and ∆t is the time over which the fractional increase was accomplished. That is, µ can be interpreted as fraction of biomass formed per unit time. For example if µ is 0.3 h-1 , every hour the biomass will approximately increase by 30%. We use

the term “approximately” because we are using finite quantities to describe the rule which applied at infinitesimal scale. Treating µ as a constant for now, Eq (4-1) can be integrated to give
where X0 is the initial (inoculum) cell concentration. The time, t, refers to the time since the inoculum emerged from lag phase. Eq(4-3) can be rearranged
setting the conditions for doubling of biomass. That is XX0
= 2 and t = the
doubling times, td .
The values of doubling time and specific growth rate have been reported by many researchers. Given below is a sample of typical values.
Organism Growth Rate, µ [h-1] Doubling time, td [h]
E. coli 2.0 0.35 Yeast 0.3 2.3 Hybridoma 0.05 13.9 Insect Cells 0.06 11.6
4.2 What Does µ Depend on? Specific growth rate (µ) depends on a number of factors such as growth medium composition, temperature, pH and others. Experimental studies have shown that one cannot increase growth rate beyond a certain maximum value, µm due to inherent metabolic reaction rate limitations. In general, when substrate, S is limiting growth, Monod (1949) reported that growth rate variations can be expressed as
where KS is called Monod constant or simply the substrate saturation constant. The significance of KS is, when substrate concentration is numerically equal to KS, growth rate is exactly half of maximum growth rate. See Figure 4-1.

S, g/ L
0
0.1
0.2
0.3
0.4
0.5
0 5 10 15 20 25
Figure 4-1 Monod Kinetics. Dependence of Growth Rate on Limiting Substrate. Specific growth rate reaches a maximum value of 0.5 h-1. Value of KS here is 0.5 g L-1. Note that when S = 0.5 g L-1, µ is half of its maximum.
The form of Eq(4-5) can be used to describe dependence of µ on more than one limiting nutrient. In many practical applications availability of oxygen for respiration often limits growth. When both substrate, S, and dissolved oxygen concentration, CDO, are both limiting growth, specific growth rate can be mathematically described as
Figure 4-2 illustrates the behavior of maximum growth rate when two substrates are limiting. The parameters KS and KDO are cell specific. KS is typically in the order of 10 mg/L for glucose and KDO is less than 1 mg/L for oxygen in the case of bacteria and yeast. KDO has been reported to be higher for mammalian and insect cells.

S, g/ L
0
0.1
0.2
0.3
0.4
0.5
0 5 10 15 20 25
DO = 8 mg/L
DO = 0.2 mg/L
DO = 0.1 mg/L
Figure 4-2 Monod Kinetics when two substrates are limiting. Specific Growth Rate reaches a maximum value of 0.5 h-1. Value of Ks here is 0.5 g L-1. Value of KDO is 0.1 mg L-1 Note that when CDO = 0.1 mg L-1, µ is half of its maximum at values of S >> Ks.
Let us now consider growth under conditions of only substrate limitations in a batch bioreactor. Incorporating the substrate limited condition, bioreactor material balance equation, Eq(4-2), can be modified and we may write,
In order to integrate the above, one of the variables, S, needs to be replaced in terms of X. The yield relationship, Eq(2-3), can be integrated as
which simplifies to

where subscript, 0 refers to initial concentration. Substituting for S from Eq(4-8) in Eq(4-7) and integrating gives,
For analyzing batch systems, use the above to calculate cell concentration and then calculate substrate concentration using Eq(4-8). 4.3 Rate Expression and Metabolic Quotient We have already discussed rate expressions for cell growth, Eq (4-1). Let us now examine rate expressions for other medium components in the growth reaction, Eq (2-1). Consider the growth reaction on the basis of one g of substrate consumed. It can be written as , 1 g S + YO2/S g of O2 + YNH3/S g of NH3 = YX/S g of Biomass + YCO2/S CO2 + others The stoichiometric coefficients in growth reaction become yield coefficients on the basis of substrate. See Example 2-2. The general rate expression is then:
where ri is expressed in g of i L-1 h-1. Since rx is the most fundamental of the various rates, it is conventional to write the stoichiometric coefficient in terms of it. That is
Following the examples above, the rate expression for species i can be written as
Metabolic quotients are rate expressions on the basis of unit mass of biomass. That is

The metabolic quotient for oxygen is of special interest. This single property determines the upper limit of cell concentration that can be achieved in many bacterial fermentation systems. We will see further analysis in the next chapter. Typical values of metabolic coefficients are given below.
Organism
qglucose g g-1 h-1
qO2 g g-1 h-1
E. coli 2.5 0.3 Yeast 0.5 0.2 Hybridoma 0.2 0.02
Example 4-0 If specific growth rate of a bacteria is 0.35 h-1 and cell yield is 0.6, calculate glucose consumption rate. qG = µ
YX / G =
0.35YX / G
= 0.48 g G (g Cell)−1 h−1
4.4 Factors Affecting Growth Rate Nutrients in the medium, pH, temperature, dissolved oxygen concentration and other cultivation environmental conditions all affect growth rate. Temperature and pH dependence are illustrated in Fig 4-3 a and b. In Figure 4-3 a the maximum growth rate is observed at 39 C for E. coli. Product formation kinetics (for example insulin), product yield (YP/S), cell yield (YX/S) are also affected by temperature. In general, cell yield decreases with temperature while similar defining relationships for product has not been reported. It is important to note that the optimum temperature for growth may be different from that for product formation.

0.1
1
Gro
wth
Rat
e
3.1 3.15 3.2 3.25 3.3 3.35 3.4 3.45 3.5 3.55
1,000/T(K)
47Ο
45
42
3937
30
21
17
13.5
o
oo
o o
o
o
o
48o0.5
2
3h-1
Figure 4-3 a Effect of Temperature on Growth Rate of E. coli. Maximum growth rate is at 39 C. Plot is given as a function of inverse absolute temperature. The
declining line from 39 C to 21 and then to 13 C suggest that the growth rate constant behaves somewhat similar to chemical reaction rate constant.

0
0.1
0.2
0.3
0.4
0.5
0.6
0.7
0.8
0.9
1
1.1D
imen
tionl
ess S
peci
fic G
row
th R
ate
2 4 6 8 10
pH
WithAdaptation
WithoutAdaptation
µ/µ
m
Figure 4-3b Effect of pH on Growth rate. Typical pH ranges over which reasonable growth can be expected is about 1 to 2 units. With adaptation, broader ranges can be achieved.
Optimum pH values for growth range from 4 to 7 for bacteria, from 4 to 7 for yeast and 6.2 to 7.2 for animal cells. Optimum pH for product formation may be different from that for growth. Many bacteria produce a different mix of products when pH is altered. For example, Clostridium butylicum produces acetic and butyric acids at near neutral pH while butanol, acetone and ethanol are produced under acidic pH (biological equivalent of Le Chatelier's Principle!). However, in the case of a recombinant cell expressing a recombinant protein, pH usually affects kinetics of recombinant protein generation rather than the product mix. Hybridomas are known to produce antibodies at a higher rate at pH 6.2 than at 7.2. Because of the difference in conditions for growth and product formation, optimization is often necessary. Oxygen is an important substrate for aerobic organisms. Since metabolic energy production by cells is directly related to oxygen uptake rate (also called respiration rate), oxygen concentration is very strongly coupled to growth rate. As illustrated in Fig 4 - 4 , growth

0.7
0.75
0.8
0.85
0.9
0.95
1
Dim
ensio
nles
s Gro
wth
Rat
e
0 0.1 0.2 0.3 0.4D.O (mg/l)
o
o
oo
o
oo
o
o
o o oE-Coli
µ/µ
µ/µ
µ/µ
µ/µm
Figure 4-4 Growth Rate depends on dissolved oxygen concentration. The critical dissolved oxygen concentration refers to value of DO below which growth rate is lower than the maximum value.
rate sharply rises to its maximum value with dissolved oxygen concentration. The relationship is similar to the behavior we discussed. See also Figure 4-1. The concentration at which maximum growth rate is attained is often referred to as critical oxygen concentration, CO2
CRIT . This value is typically less than 0.5 mg L-
1 for bacteria and yeast, and about 1 to 2 mg L-1 for animal and insect cells. Note that these values are significantly lower than air saturation value of 6.7 mg L-1 at 37 C. 4.5 Product Formation Kinetics Product formation kinetics fall into one of the following three types. I. Growth Associated Product Formation II. Non-Growth Associated Product Formation III. Mixed Mode Product Formation

������������������������������������������������������������������������������������������������������������������������������������������������������������������������������������������������������������������������������������������������������������������������������������������������������������������������������������������������������������������������������������������������������������������������������������������������������������������������������������������������������������������������������������������������������������������������������������������������������������������������������������������������������������������������������������������������������������������������������������������������������������������������������������������������������������������������������������������������������������������������������������������������������������������� ����� ����� ����� ����� ����� ����� ����� ����� ����� ����� ����� ����� ����� ����� ����� ����� ����� ����� ����� ����� ����� ����� ����� ����� ����� ����� ����� ����� ����� ����� ����� ����� ����� ����� ����� ����� ����� ����� ��������
������� ����� ����� ����� ����� ����� ����� ����� ����� ����� ����� ����� ����� ����� ����� ����� ����� ����� ����� ����� ����� ����� ����� ����� ����� ����� ����� ����� ����� ����� ����� ����� ����� ����� ����� ����� ����� ����� ����� ����� ����� ����� ����� ����� ����� ����� ����� ����� ����� ����� ����� ����� ����� ����� ����� ����� ����� ����� ����� ����� ����� ����� ����� ����� ����� ����� ����� ����� ����� ����� ����� ����� ����� ����� ����� ����� ����� ����� ����� ����� ����� ����� ����� ����� ����� ����� ����� ����� ����� ����� ����� ����� ����� ����� ����� �����
���������� ����� ����� ����� ����� ����� ����� ����� ����� ����� ����� ����� ����� ����� ����� ����� ����� ����� ����� ����� ����� ����� ����� ����� ����� ����� ����� ����� ����� ����� ����� ����� ����� ����� ����� ����� ����� ����� ����� ����� ����� ����� ����� ����� ����� ����� ����� ����� ����� ����� ����� ����� ����� ����� ����� ����� ����� ����� ����� ����� ����� ����� ����� ����� ����� ����� ����� ����� ����� ����� ����� ����� ����� ����� ����� ����� ����� ����� ����� ����� ����� ����� ����� ����� ����� ����� ����� ����� ����� ����� ����� ����� ����� ����� ����� �����
���������� ����� ����� ����� ����� ����� ����� ����� ����� ����� ����� ����� ����� ����� ����� ����� ����� ����� ����� ����� ����� ����� ����� ����� ����� ����� ����� ����� ����� ����� ����� ����� ����� ����� ����� ����� ����� ����� ����� ����� ����� ����� ����� ����� ����� ����� ����� ����� ����� ����� ����� ����� ����� ����� ����� ����� ����� ����� ����� ����� ����� ����� ����� ����� ����� ����� ����� ����� ����� ����� ����� ����� ����� ����� ����� ����� ����� ����� ����� ����� ����� ����� ����� ����� ����� ����� ����� ����� ����� ����� ����� ����� ����� ����� ����� �����
���������� ����� ����� ����� ����� ����� ����� ����� ����� ����� ����� ����� ����� ����� ����� ����� ����� ����� ����� ����� ����� ����� ����� ����� ����� ����� ����� ����� ����� ����� ����� ����� ����� ����� ����� ����� ����� ����� ����� ����� ����� ����� ����� ����� ����� ����� ����� ����� ����� ����� ����� ����� ����� ����� ����� ����� ����� ����� ����� ����� ����� ����� ����� ����� ����� ����� ����� ����� ����� ����� ����� ����� ����� ����� ����� ����� ����� ����� ����� ����� ����� ����� ����� ����� ����� ����� ����� ����� ����� ����� ����� ����� ����� ����� ����� �����
���������� ����� ����� ����� ����� ����� ����� ����� ����� ����� ����� ����� ����� ����� ����� ����� ����� ����� ����� ����� ����� ����� ����� ����� ����� ����� ����� ����� ����� ����� ����� ����� ����� ����� ����� ����� ����� ����� ����� ����� ����� ����� ����� ����� ����� ����� ����� ����� ����� ����� ����� ����� ����� ����� ����� ����� ����� ����� ����� ����� ����� ����� ����� ����� ����� ����� ����� ����� ����� ����� ����� ����� ����� ����� ����� ����� ����� ����� ����� ����� ����� ����� ����� ����� ����� ����� ����� ����� ����� ����� ����� ����� ����� ����� ����� �����
���������� ����� ����� ����� ����� ����� ����� ����� ����� ����� ����� ����� ����� ����� ����� ����� ����� ����� ����� ����� ����� ����� ����� ����� ����� ����� ����� ����� ����� ����� ����� ����� ����� ����� ����� ����� ����� ����� ����� ����� ����� ����� ����� ����� ����� ����� ����� ����� ����� ����� ����� ����� ����� ����� ����� ����� ����� ����� ����� ����� ����� ����� ����� ����� ����� ����� ����� ����� ����� ����� ����� ����� ����� ����� ����� ����� ����� ����� ����� ����� ����� ����� ����� ����� ����� ����� ����� ����� ����� ����� ����� ����� ����� ����� ����� �����
���������� ����� ����� ����� ����� ����� ����� ����� ����� ����� ����� ����� ����� ����� ����� ����� ����� ����� ����� ����� ����� ����� ����� ����� ����� ����� ����� ����� ����� ����� ����� ����� ����� ����� ����� ����� ����� ����� ����� ����� ����� ����� ����� ����� ����� ����� ����� ����� ����� ����� ����� ����� ����� ����� ����� ����� ����� ����� ����� ����� ����� ����� ����� ����� ����� ����� ����� ����� ����� ����� ����� ����� ����� ����� ����� ����� ����� ����� ����� ����� ����� ����� ����� ����� ����� ����� ����� ����� ����� ����� ����� ����� ����� ����� ����� �����
���������� ����� ����� ����� ����� ����� ����� ����� ����� ����� ����� ����� ����� ����� ����� ����� ����� ����� ����� ����� ����� ����� ����� ����� ����� ����� ����� ����� ����� ����� ����� ����� ����� ����� ����� ����� ����� ����� ����� ����� ����� ����� ����� ����� ����� ����� ����� ����� ����� ����� ����� ����� ����� ����� ����� ����� ����� ����� ����� ����� ����� ����� ����� ����� ����� ����� ����� ����� ����� ����� ����� ����� ����� ����� ����� ����� ����� ����� ����� ����� ����� ����� ����� ����� ����� ����� ����� ����� ����� ����� ����� ����� ����� ����� ����� �����
���������� ����� ����� ����� ����� ����� ����� ����� ����� ����� ����� ����� ����� ����� ����� ����� ����� ����� ����� ����� ����� ����� ����� ����� ����� ����� ����� ����� ����� ����� ����� ����� ����� ����� ����� ����� ����� ����� ����� ����� ����� ����� ����� ����� ����� ����� ����� ����� ����� ����� ����� ����� ����� ����� ����� ����� ����� ����� ����� ����� ����� ����� ����� ����� ����� ����� ����� ����� ����� ����� ����� ����� ����� ����� ����� ����� ����� ����� ����� ����� ����� ����� ����� ����� ����� ����� ����� ����� ����� ����� ����� ����� ����� ����� ����� �����
���������� ����� ����� ����� ����� ����� ����� ����� ����� ����� ����� ����� ����� ����� ����� ����� ����� ����� ����� ����� ����� ����� ����� ����� ����� ����� ����� ����� ����� ����� ����� ����� ����� ����� ����� ����� ����� ����� ����� ����� ����� ����� ����� ����� ����� ����� ����� ����� ����� ����� ����� ����� ����� ����� ����� ����� ����� ����� ����� ����� ����� ����� ����� ����� ����� ����� ����� ����� ����� ����� ����� ����� ����� ����� ����� ����� ����� ����� ����� ����� ����� ����� ����� ����� ����� ����� ����� ����� ����� ����� ����� ����� ����� ����� ����� �����
���������� ����� ����� ����� ����� ����� ����� ����� ����� ����� ����� ����� ����� ����� ����� ����� ����� ����� ����� ����� ����� ����� ����� ����� ����� ����� ����� ����� ����� ����� ����� ����� ����� ����� ����� ����� ����� ����� ����� ����� ����� ����� ����� ����� ����� ����� ����� ����� ����� ����� ����� ����� ����� ����� ����� ����� ����� ����� ����� ����� ����� ����� ����� ����� ����� ����� ����� ����� ����� ����� ����� ����� ����� ����� ����� ����� ����� ����� ����� ����� ����� ����� ����� ����� ����� ����� ����� ����� ����� ����� ����� ����� ����� ����� ����� �����
���������� ����� ����� ����� ����� ����� ����� ����� ����� ����� ����� ����� ����� ����� ����� ����� ����� ����� ����� ����� ����� ����� ����� ����� ����� ����� ����� ����� ����� ����� ����� ����� ����� ����� ����� ����� ����� ����� ����� ����� ����� ����� ����� ����� ����� ����� ����� ����� ����� ����� ����� ����� ����� ����� ����� ����� ����� ����� ����� ����� ����� ����� ����� ����� ����� ����� ����� ����� ����� ����� ����� ����� ����� ����� ����� ����� ����� ����� ����� ����� ����� ����� ����� ����� ����� ����� ����� ����� ����� ����� ����� ����� ����� ����� ����� �����
���������� ����� ����� ����� ����� ����� ����� ����� ����� ����� ����� ����� ����� ����� ����� ����� ����� ����� ����� ����� ����� ����� ����� ����� ����� ����� ����� ����� ����� ����� ����� ����� ����� ����� ����� ����� ����� ����� ����� ����� ����� ����� ����� ����� ����� ����� ����� ����� ����� ����� ����� ����� ����� ����� ����� ����� ����� ����� ����� ����� ����� ����� ����� ����� ����� ����� ����� ����� ����� ����� ����� ����� ����� ����� ����� ����� ����� ����� ����� ����� ����� ����� ����� ����� ����� ����� ����� ����� ����� ����� ����� ����� ����� ����� ����� �����
���������� ����� ����� ����� ����� ����� ����� ����� ����� ����� ����� ����� ����� ����� ����� ����� ����� ����� ����� ����� ����� ����� ����� ����� ����� ����� ����� ����� ����� ����� ����� ����� ����� ����� ����� ����� ����� ����� ����� ����� ����� ����� ����� ����� ����� ����� ����� ����� ����� ����� ����� ����� ����� ����� ����� ����� ����� ����� ����� ����� ����� ����� ����� ����� ����� ����� ����� ����� ����� ����� ����� ����� ����� ����� ����� ����� ����� ����� ����� ����� ����� ����� ����� ����� ����� ����� ����� ����� ����� ����� ����� ����� ����� ����� ����� �����
���������� ����� ����� ����� ����� ����� ����� ����� ����� ����� ����� ����� ����� ����� ����� ����� ����� ����� ����� ����� ����� ����� ����� ����� ����� ����� ����� ����� ����� ����� ����� ����� ����� ����� ����� ����� ����� ����� ����� ����� ����� ����� ����� ����� ����� ����� ����� ����� ����� ����� ����� ����� ����� ����� ����� ����� ����� ����� ����� ����� ����� ����� ����� ����� ����� ����� ����� ����� ����� ����� ����� ����� ����� ����� ����� ����� ����� ����� ����� ����� ����� ����� ����� ����� ����� ����� ����� ����� ����� ����� ����� ����� ����� ����� ����� �����
���������� ����� ����� ����� ����� ����� ����� ����� ����� ����� ����� ����� ����� ����� ����� ����� ����� ����� ����� ����� ����� ����� ����� ����� ����� ����� ����� ����� ����� ����� ����� ����� ����� ����� ����� ����� ����� ����� ����� ����� ����� ����� ����� ����� ����� ����� ����� ����� ����� ����� ����� ����� ����� ����� ����� ����� ����� ����� ����� ����� ����� ����� ����� ����� ����� ����� ����� ����� ����� ����� ����� ����� ����� ����� ����� ����� ����� ����� ����� ����� ����� ����� ����� ����� ����� ����� ����� ��������������������������������������������������������������������������������������������������������������������������������������������������������������������������������������������������������������������������������������������������������������������������������������������������������������������������������������������������������������������������������������������������������������������������������������������������������������������������������������������������������������������������������������������������������������������������������������������������������������������������������������������������������������������������������������������������������������������������������������������������������������������������������������������������������������������������������������������������������������������������������������������������������������������������������������������������������������������������������������������������������������������������������
��������������������������������������������������������������������������������������������������������������
Time
PRODUCT, P
CELL, X
Cel
l or P
rodu
ct C
once
ntra
tion
Figure 4-5a Growth Associated Product Formation
Time
CELL, X
PRODUCT, P
Cel
l or P
rodu
ct C
once
ntra
tion
Figure 4-5b Non-Growth Associated Product Formation

Time
CELL, X
PRODUCT, P
Cel
l or P
rodu
ct C
once
ntra
tion
Figure 4-5c Mixed Mode Product Formation
Typical time-profiles of these three cases are illustrated above. In Type I shown in Fig 4-5a, product is formed simultaneously with growth of cells. That is product concentration increases with cell concentration. The metabolic quotient for P can be expressed as a function of µ,
It is clear from the above, the proportionality constant, α is the yield coefficient, YP/X. Anaerobic fermentation of sugars by Saccharomyces cerevisae is an example of Type I. Illustrated below are actual data for this bioprocess.

0
10
20
30
40
50
60
70
0 2 4 6 8 10 12 14Time (hrs)
Mycelial dry wt. g/l
Alcohol
Sugar UsedSu
gar U
sed
0
20
30
10
Alc
ohol
0
2
4
6
Myc
elia
l dry
wt.
g/l
Figure 4-5 Ethanol Fermentation data for yeast illustrates Type I product formation kinetics. Note that formation of alcohol is proportional to cell concentration. In Type II, product formation is unrelated to growth rate, but is a function of cell concentration. This is expressed as
Antibody formation by hybridoma, and some antibiotic fermentation exhibit this type of behavior. In the third category, product formation is a combination of growth rate and cell concentration. That is,
Many biochemical processes fall into this category. Note that if β is zero and α is YP/X, this case reduces to Type I. If α = 0, it reduces to non-growth associated case. Therefore let us consider this more general case for further analysis. In a batch reactor, product accumulation can be obtained by carrying out mass balance on the product. Rate of Product Formation = Accumulation of Product

For constant V,
If we consider exponential phase only, X = X0 Exp(µmt). That is, substituting in the above gives
Integrating from t = 0, P = P0 we get
The above expression can be used to calculate the amount of product concentration at the end of a growth cycle.
Example 4-1 McCallion reported growth of Thermoanaerobacter ethanolicus under controlled pH of 7.0. Using appropriate graphs calculate YX/G and YLA/G, where G and LA refer to glucose and lactate. Is lactic acid formation growth associated ? Can you estimate an approximate value for qglucose?
Time Glucose Lactate (LA) Cell (X) [h] [g/L] g/L g/L
0 19.50 0.45 0.01 13 16.88 3.88 0.41 14 14.85 4.94 0.54 16 13.11 6.98 0.92 18 10.40 8.98 0.99 19 8.91 10.30 1.05 20 7.75 10.83 1.15 22 5.18 12.57 1.30 24 3.64 14.58 1.35 37 0.25 16.03 0.69
Solution

First plot cell concentration versus time. The slope in the exponential growth phase is approximately 0.24 h-1. Notice that the culture growth slows down shortly after 15 h. One could also analyze the information numerically. Such an approach unfortunately will lack a good overview of the phases of growth. Now plot LA vs X and S vs X.
Time, h
0.10
1.00
10.00
0 20 40
Plot above shows that the exponential behavior deviates at t = 16 h. A straight line drawn during the exponential phase gives growth rate.
Cell Conc., g/L
0.00
2.50
5.007.50
10.00
12.50
15.00
17.50
20.00
0.00 0.50 1.00 1.50
Slope=Yield=10

Except for one point, all others lie nearly on a straight line. The data at 0.7 g/L of cell corresponds to the declining phase of growth, which may be ignored for current analysis. The line has a negative slope because glucose decreases as cell concentration increases.
Cell Conc., g/L
0.00
2.50
5.00
7.50
10.00
12.50
15.00
17.50
0.00 0.50 1.00 1.50
Slope = Yield =
Yields from the above graphs:

Chapter 5 Oxygen Transfer in Bioreactors
Oxygen is needed by cells for respiration. Oxygen used by cells in suspension must be available as dissolved oxygen. Since oxygen solubility is quite small, about 6 to 7 mg/L under normal cultivation conditions, metabolic oxygen requirement is supplied on a as needed basis by continuous aeration of culture medium. Actively respiring yeast requires about 0.15 g O2 (g cell)-1 h. At a cell concentration of 10 gL-1, medium saturated with air can support less than 30 seconds worth of metabolic oxygen. That is, a continuous supply of oxygen must be maintained in any viable aerobic manufacturing process. In this Chapter, we will first get a quantitative appreciation for metabolic oxygen demand, followed by methods used in calculating rates at which oxygen is transfered from sparged air. We will then examine methods useful in characterizing oxygen mass transfer coefficient. Finally we will evaluate bioreactor operation and design based on oxygen transfer capability. 5.1 Metabolic Oxygen Demand Metabolic oxygen demand of an organism depends on the biochemical nature of the cell and cultivation conditions. Oxygen need is usually satisfied in most cells if the dissolved oxygen concentraiton in the medium is kept at about 1 mg/L. If the oxygen level is allowed to fall far below this value, oxygen consumption rate decreases with concomitant decrease in biochemical energy production, and as a result cell growth rate also decreases. We described this behavior in Section 4-4. The value of oxygen concentration above which growth rate is at the
maximum was described as the critical oxygen concentration, . Characteristic values are summarized in Table 5-1.
Table 5-1 Critical Oxygen Concentration
Organism CO2CRIT in mg L-1
E. coli at 37 C 0.26 S. cerevisiae at 30 C 0.13 Penicillium sp at 24 C 0.78
The oxygen requirement for growth is expressed best in the the parameter, yield coefficient, YX/O2. It represents the amount of oxygen required to grow one gram of cells. Typical values summarized in Table 5-2, show that approximately 0.7 to 1 g of oxygen is needed to produce 1 g of cells. In the same table respiration quotient is also included. Table 5-2 Stoichiometric Oxygen Demand &Respiration Rate

Organism Substrate YX/O2 g (g cell)-1 h
qO2 g O2 (g cell)-1 h
E. coli Glucose 1.1 0.20 S.cerevisae Glucose 0.98 0.30 Candida utilis Glucose 1.32 Pennicillium sp. Glucose 1.35 0.18 Hybridoma CHO cell line
5.2 Volumetric Oxygen Mass Transfer Coefficient In a typical aeration system, oxygen from the air bubble is transferred through the gas-liquid interface followed by liquid phase diffusion/bulk transport to the cells. Although this is a multi-step serial transport, in a well dispersed systems, the major resistance to oxygen transfer is in the liquid film surrounding the gas bubble. Consider the oxygen concentration profiles in the region near the interface illustrated in Figure 5-1.
Liquid Gas
C DOG
C DOGi
C DOLi
C DOL
Figure 5-1 Oxygen Concentration Profile at Air Bubble-Medium Interface
The transport of oxygen through the gas and liquid films are equal at steady state. They can be expressed by

where subscript G and L refer to gas and liquid phases respectively. The terms, NO2G and NO2L are oxygen transfer expressed in g O2 h-1, A is interfacial area and CDO is oxygen concentration expressed in g O2 per unit volume. At the interface, equilibrium between the liquid and gas phase oxygen is reached. That is
Because of low oxygen solubility and the fact that kG is much higher than kL,
Hence, Eq (5-1a) can be written as
The subscript L in NO2 has been dropped to note that the above represents overall transfer of oxygen. The driving force in the above consists of the difference between bulk oxygen concentrations in the two phases; the first term represents the concentration of oxygen in the liquid which is in equilibrium with the bulk gas phase oxygen. If air is the gas medium, this term will equal to 7 mg/L at 35 C. When the above oxygen transfer is applied to an entire volume of a bioreactor, A will represent the total interfacial area and kL will represent an average mass transfer coefficient. The concentrations will be bulk gas and liquid phase oxygen concentrations. If we divide the above equation by volume of liquid phase, V, the resulting term will represent the amount of oxygen transfered per unit volume per unit time --- which is in the same units as the rate expressions we saw in last chapter. Since the rate is due to a physical phenomena, let us distinguish it by the symbol, RO2. That is,
The term, kL A represents the product of mass transfer coefficient and interfacial area available for mass treansfer. In a bioreactor, air is sparged and the liquid is agitated to break up the bubbles so that interfacial area can be kept high to enhance rate of oxygen transfer. In such systems, the area, A, is not easily measured or estimated. But, the term consisting of the product - mass transfer coefficient and interfacial area - is more readily measured. Further more, it is convenient to use interfacial area per unit volume, a, rather than total area, A because rate of oxygen transfer is expressed per unit volume of bioreactor, similar to rate of cell growth, which is reported on a volumetric basis. Hence, area per unit volume, a, is combined with the mass transfer coefficient, kL and is

given by the term, kLa. In Eq(5-5) the term, CDOGm
can be replaced by oxygen
solubility at bioreactor conditions, CDOL* .
The above will be our working equation for describing transfer of oxygen from gas phase to growth medium. In order for us to calculate oxygen transfer rate (OTR), we need the mass transfer coefficient, kLa , solubility of oxygen in the medium, CDOL
* and the dissolved oxygen concentration in the medium, CDOL. In the last chapter we had used the notation, CDO to describe dissolved oxygen concentration. In the discussion above, there was a need to make a distinction between gas and liquid phase concentration. In Eq (5-5), one notes that both concentrations are expressed on the basis of liquid phase. Hence, from here on we will drop the subscript L. In situations where we need to make a distinction between the two phases, we will re-introduce the subscript L and G. 5.3 Bioreactor Oxygen Balance Let us now consider the case of oxygen balance within a bioreactor in which cells are growing and in the process consuming oxygen. There is a continuous inflow of air at a constant volumetric flow rate. The liquid broth is agitated by a Rushton agitator (flat blade stirrer ). Le the metabolic oxygen uptake rate be qO2 and cell concentration is X. Let us examine the reactor system over a sufficiently short period that we can treat X as a constant. Consider oxygen balance over the liquid phase of the bioreactor. O2 transfered from Gas Phase - O2 consumed by Cells = Accumulation
For constant liquid phase volume, the above can be simplified to
The concentration, CDO is readily measured using an dissolved oxygen electrode. A later segment of the course on Biosensors, will deal with principle of measurement and construction of DO electrodes. If oxygen being supplied is in exact balance with the oxygen consumed by the cells, we expect the dissolved oxygen concentration to remain constant; that is, the derivative in Eq(5-7) will vanish. That is,

One useful application of the above is in estimating the maximum cell concentration a particular bioreactor is capable of supporting in terms of oxygen supply. See the example below.
Example 5-1. A bioreactor has an oxygen mass transfer coefficient capability of 400 h-
1. What is the maximum concentration of E. coli that can be grown aerobically in this reactor. Respiration rate of E. coli is 0.35 g O2 (g Cell)-1 h-1. Critical oxygen concentration is 0.2 mg/L. Assume oxygen saturation with air to be 6.7 mg/L. Solution From Eq(5-8), we have
X =kLa CDO
* − CDO( )qO2
The maximum oxygen concentration driving force that can be expected is = ( 6.7 - 0.2) = 6.5 mg/L. Therefore, maximum cell concentration that can be grown at maximum growth rate is
X max =kLa CDO
* − CDO( )max
qO2 ⇒ (400 h−1) • (6.5 mgO2 L−1)
0.35 gO2 (gCell)−1 h−1 ⇒ 7.4 gCell L−1
5.4 Factors Affecting Kla The mass transfer coefficient is strongly affected by agitation speed and air flow rate. In general, kLa. = k (Pg/VR)0.4 (VS)0.5 (N)0.5
where k is a constant Pg is power required for aerated bioreactor

VR is bioreactor volume VS is air flow rate N is agitator speed
5.5 Measurement of KLa Most common method of measuring kLa is to conduct experiments in the bioreactor when cells are absent, or cell concentration is low so that consumption by cells can be neglected. The latter condition is present immediately after inoculating the bioreactor. Consider Eq (5-7) under these conditions:
If we allow steady state to occur, the dissolved oxygen concentration will reach saturation value, CDO
* and the concentration-time profile will be flat, as shown in the diagram.
CL
time
O2 onO2 Off
Fig 5-2 Oxygen Profile During a Transient. The responses will be exponential, rather than straight lines.
If the oxygen source (air) is replaced by nitrogen, the resulting response of the system is described by the above equation with the term, CDO
* set to zero. That is,
The solution to the above is

If one plots the response on a semi-log plot, the slope will equal to the negative of mass transfer coefficient. It is relatively a simple experiment and the data analysis is also easy to do. When other type of transient mass transfer experiments are conducted, the above equations should be suitably modified. For example for the case of nitrogen to air switch, we should suitably modify the solution because the initial condition is now different. 5.6 Case Studies
Example 5.2 You are part of a tech service team asked to evaluate if the available 10,000 liter fermentor is adequate to produce 10 kg/day of a recombinant protein using a strain of E. coli that expresses the protein as 20 % of cellular protein. In order to enhance plasmid stability, the nutrients are manipulated to give a low specific growth rate is 0.2 h-1. The oxygen demand is 0.15 g O2/g cell - h. Assume that the r-protein formation is cell growth associated. Data: The lag phase is 4 hours. Typical clean-up time following a fermentation batch and preparation for the next batch is 8 hours. The plant runs three shifts. Cell yield on substrate is 0.55 g cell/g substrate. Available support services can supply inoculum of a maximum of 6 kg of cells every 24 hour period. Maximum KLa for the available fermentor is 500 h-1. Fermentor accessories are capable of handling cell concentrations of 60 g/L. Assume any other parameters you need to complete the calculation. Assumption: Critical oxygen conc. is 0.2 mg/L and DO at air saturation is 6.4 mg/L
Solution A: Lag phase and clean-up/ prep time is given as 12 h. If a batch is to completed within each 24 h period, production is limited to 12 h per day. If this is not a limitation, one can optimize production by varying batch time. Let us first evaluate assuming 12 h batch times. If max. cell concentration of 20.6 g/L is obtained, amount of r-protein produced is = (0.2) (0.5) (20.6) = 2.06 g/L. 50% of cell dry matter was assumed to be protein. Hence in 10,000 liters, we will produce 20.6 kg.
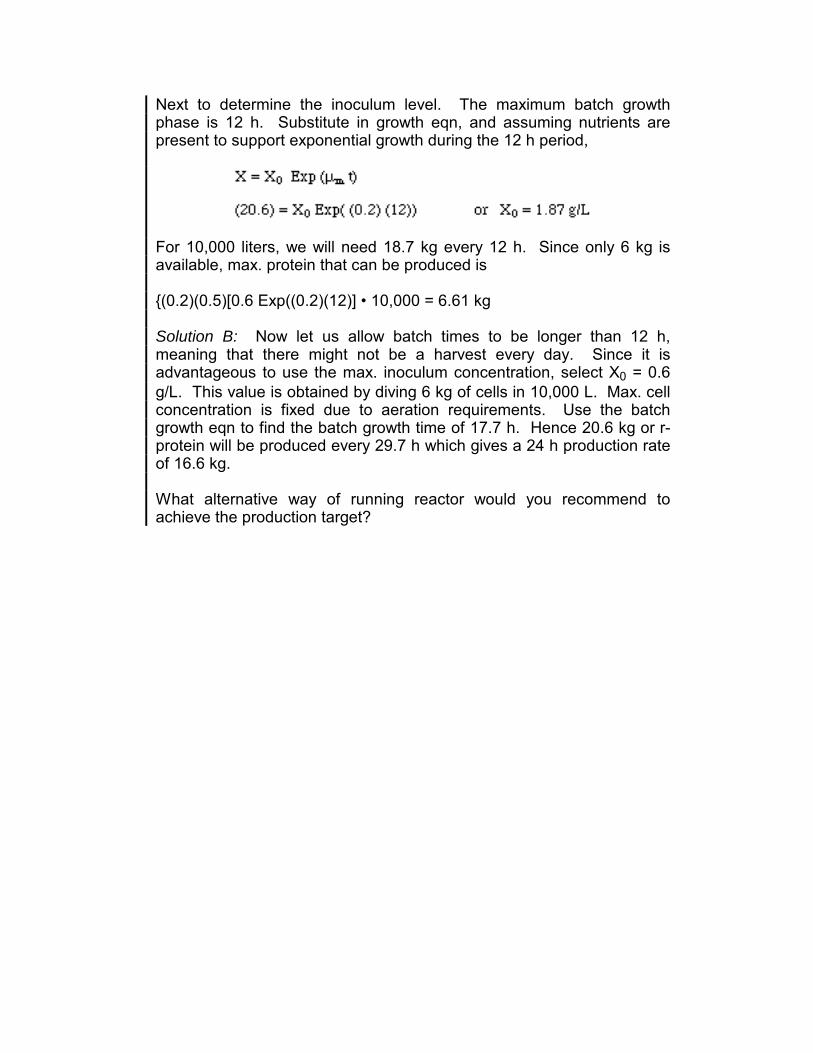
Next to determine the inoculum level. The maximum batch growth phase is 12 h. Substitute in growth eqn, and assuming nutrients are present to support exponential growth during the 12 h period,
For 10,000 liters, we will need 18.7 kg every 12 h. Since only 6 kg is available, max. protein that can be produced is {(0.2)(0.5)[0.6 Exp((0.2)(12)] • 10,000 = 6.61 kg Solution B: Now let us allow batch times to be longer than 12 h, meaning that there might not be a harvest every day. Since it is advantageous to use the max. inoculum concentration, select X0 = 0.6 g/L. This value is obtained by diving 6 kg of cells in 10,000 L. Max. cell concentration is fixed due to aeration requirements. Use the batch growth eqn to find the batch growth time of 17.7 h. Hence 20.6 kg or r-protein will be produced every 29.7 h which gives a 24 h production rate of 16.6 kg. What alternative way of running reactor would you recommend to achieve the production target?