an integral abutment bridge with precast concrete piles · an integral abutment bridge with precast...
TRANSCRIPT

An Integral Abutment Bridge with Precast Concrete Piles
Final Report May 2007
Sponsored by the Iowa Highway Research Board (IHRB Project TR-438) and the Iowa Department of Transportation (CTRE Project 99-48)
Iowa State University’s Center for Transportation Research and Education is the umbrella organization for the following centers and programs: Bridge Engineering Center • Center for Weather Impacts on Mobility
and Safety • Construction Management & Technology • Iowa Local Technical Assistance Program • Iowa Traffic Safety Data Service • Midwest Transportation Consortium • National Concrete Pavement
Technology Center • Partnership for Geotechnical Advancement • Roadway Infrastructure Management and Operations Systems • Statewide Urban Design and Specifications • Traffic Safety and Operations

About CTRE/ISU
The mission of the Center for Transportation Research and Education (CTRE) at Iowa State University is to develop and implement innovative methods, materials, and technologies for improving transportation efficiency, safety, and reliability while improving the learning environment of students, faculty, and staff in transportation-related fields.
Disclaimer Notice
The contents of this report reflect the views of the authors, who are responsible for the facts and the accuracy of the information presented herein. The opinions, findings and conclusions expressed in this publication are those of the authors and not necessarily those of the sponsors.
The sponsors assume no liability for the contents or use of the information contained in this document. This report does not constitute a standard, specification, or regulation.
The sponsors do not endorse products or manufacturers. Trademarks or manufacturers’ names appear in this report only because they are considered essential to the objective of the document.
Non-discrimination Statement
Iowa State University does not discriminate on the basis of race, color, age, religion, national origin, sexual orientation, gender identity, sex, marital status, disability, or status as a U.S. veteran. Inquiries can be directed to the Director of Equal Opportunity and Diversity, (515) 294-7612.

Technical Report Documentation Page
1. Report No. IHRB Project TR-438
2. Government Accession No. 3. Recipient’s Catalog No.
4. Title and Subtitle An Integral Abutment Bridge with Precast Concrete Piles
5. Report Date May 2007
6. Performing Organization Code
7. Author(s) Robert E. Abendroth, Lowell F. Greimann, and Michael D. LaViolette.
8. Performing Organization Report No. CTRE Project 99-48
9. Performing Organization Name and Address Center for Transportation Research and Education
Iowa State University
2711 South Loop Drive, Suite 4700
Ames, IA 50010-8664
10. Work Unit No. (TRAIS)
11. Contract or Grant No. C
12. Sponsoring Organization Name and Address Iowa Highway Research Board
Iowa Department of Transportation
800 Lincoln Way
Ames, IA 50010
13. Type of Report and Period Covered Final Report
14. Sponsoring Agency Code
15. Supplementary Notes Visit www.ctre.iastate.edu for color PDF files of this and other research reports.
16. Abstract
The use of precast, prestressed concrete piles in the foundation of bridge piers has long been recognized as a valuable option for bridge owners and designers. However, the use of these precast, prestressed concrete piles in integral abutment bridges has not been widespread because of concerns over pile flexibility and the potential for concrete cracking and deterioration of the prestressing strands due to long-term exposure to moisture.
This report presents the details of the first integral abutment bridge in the state of Iowa that utilized precast, prestressed concrete piles in the abutment. The bridge, which was constructed in Tama County in 2000, consists of a 110 ft. long, 30 ft. wide, single-span PC girder superstructure with a left-side-ahead 20º skew angle. The bridge was instrumented with a variety of strain gages, displacement sensors, and thermocouples to monitor and help in the assessment of structural behavior. The results of this monitoring are presented, and recommendations are made for future application of precast, prestressed concrete piles in integral abutment bridges.
In addition to the structural monitoring data, this report presents the results of a survey questionnaire that had been mailed to each of the 50 state DOT chief bridge engineers to ascertain their current practices for precast, prestressed concrete piles and especially the application of these piles in integral abutment bridges.
17. Key Words
Bridge—integral abutment—precast, prestressed concrete pile—structural monitoring
18. Distribution Statement
No restrictions.
19. Security Classification (of this report) Unclassified.
20. Security Classification (of this page)
Unclassified.
21. No. of Pages
72
22. Price
NA
Form DOT F 1700.7 (8-72) Reproduction of completed page authorized


AN INTEGRAL ABUTMENT BRIDGE WITH
PRECAST CONCRETE PILES
Final ReportMay 2007
Co-Principal Investigators Robert E. Abendroth
Associate Professor of Civil Engineering, Iowa State University
Lowell F. Greimann Professor of Civil Engineering, Iowa State University
Investigator Michael D. LaViolette
Bridge Engineer, center for Transportation Research and Education
Authors Robert E. Abendroth, Lowell F. Greimann, and Michael D. LaViolette
Sponsored bythe Iowa Highway Research Board
(IHRB Project TR-438)
Preparation of this report was financed in part through funds provided by the Iowa Department of Transportation
through its research management agreement with theCenter for Transportation Research and Education,
CTRE Project 99-48.
A report from Center for Transportation Research and Education
Iowa State University 2711 South Loop Drive, Suite 4700
Ames, IA 50010-8664 Phone: 515-294-8103 Fax: 515-294-0467
www.ctre.iastate.edu


TABLE OF CONTENTS
ACKNOWLEDGMENTS ............................................................................................................ IX
EXECUTIVE SUMMARY........................................................................................................... XI
1. INTRODUCTION........................................................................................................................1
1.1. Background ...................................................................................................................1 1.2. Research Scope, Objectives, and Tasks ........................................................................1 1.3. Report organization.......................................................................................................2
2. LITERATURE REVIEW AND CURRENT PRACTICE...........................................................3
2.1. Integral Abutment Bridges............................................................................................3 2.2. Prestressed Concrete Piles ............................................................................................4 2.3. PC Piles for Integral Abutments ...................................................................................5 2.4. Lateral Load Tests on PC Piles in Integral Abutments .................................................6 2.5. PC Pile-to-Pile-Cap Connection ...................................................................................7 2.6. Survey of PC Pile Use for Integral Abutment Bridges .................................................8
3. EXPERIMENTAL MONITORING PROGRAM......................................................................15
3.1. Overview.....................................................................................................................15 3.2. Displacement Transducers ..........................................................................................20 3.3. Vibrating Wire Strain Gages.......................................................................................22 3.4. Thermocouples............................................................................................................25 3.5. Data Acquisition .........................................................................................................28 3.6. Temperature Corrections for the Instrumentation Devices .........................................29
4. EXPERIMENTAL RESULTS AND THEIR INTERPRETATION..........................................31
4.1. Data Filters and Interpretation Problems ....................................................................31 4.2. Bridge Temperatures...................................................................................................36 4.3. Bridge Displacements .................................................................................................42 4.4. PC Pile Behavior.........................................................................................................46
5. SUMMARY AND CONCLUSIONS ........................................................................................59
6. REFERENCES ..........................................................................................................................60
v


LIST OF FIGURES
Figure 2.1. PC pile reinforcement (courtesy of Kentucky DOT)...Error! Bookmark not defined.Figure 2.1. PC pile reinforcement, cont’d. (courtesy of Kentucky DOT)......................................12 Figure 2.2. Pile splice detail (courtesy of Kentucky DOT)
Figure 3.9. Thermocouples locations inside wooden boxes to monitor the steel wire of the
............................................................13 Figure 3.1. Isometric and plan views of the Tama County Bridge ................................................16 Figure 3.2. Design drawing for the Tama County Bridge (courtesy of Iowa DOT) ......................17 Figure 3.2. Design drawing for the Tama County Bridge (courtesy of Iowa DOT) ......................18 Figure 3.3. Location of transducers on the Tama County Bridge ..................................................21 Figure 3.4. Instrumentation at mid-width of east abutment for the Tama County Bridge.............22 Figure 3.5. Vibrating wire strain gage locations for the Tama County Bridge ..............................23 Figure 3.6. PC pile with vibrating wire strain gages......................................................................24 Figure 3.7. Thermocouples locations for the bridge superstructure...............................................27 Figure 3.8. Thermocouples locations within a PC girder ..............................................................27
displacement transducers ...................................................................................................28 Figure 4.1. Pile strain record for gage VW-E-NWT......................................................................35 Figure 4.2. Pile strain record for gage VW-E-SWT.......................................................................35 Figure 4.3. Temperature regions for a partial cross section of a bridge (not to scale)...................37 Figure 4.4. Average superstructure temperature for the Tama County Bridge ..............................38 Figure 4.5. Transverse slab temperature distribution at times of maximum and
minimum average bridge temperature ...............................................................................39 Figure 4.6. Thermal gradient through depth of bridge superstructure (adapted from AASHTO
LRFD 2004) .......................................................................................................................40 Figure 4.7. Difference between average temperature in the RC bridge deck and in
the PC girder bottom flange...............................................................................................41 Figure 4.8. Vertical temperature distribution of the superstructure at times of minimum and
maximum average bridge temperature...............................................................................42 Figure 4.9. Average east abutment displacement...........................................................................43 Figure 4.10. Change in bridge length versus average superstructure temperature.........................44 Figure 4.11. Differential longitudinal displacement, top and bottom of west abutment ...............45 Figure 4.12. Measured transverse displacement, center of the east abutment ...............................46 Figure 4.13. Strain record for gage VW-E-NWT ..........................................................................47 Figure 4.14. Strain record for gage VW-E-NWB ..........................................................................48 Figure 4.15. Strain gage VW-E-NWB vs. longitudinal displacement SP-E-SL............................49 Figure 4.16. Flexural strain for gages VW-E-SET minus VW-E-NWT versus longitudinal
displacement for SP-E-SL..................................................................................................50 Figure 4.17. Flexural strain for gages VW-E-SEB minus VW-E-NWB versus longitudinal
displacement for SP-E-SL..................................................................................................50 Figure 4.18. Excerpt from bridge contract plans showing pile wrapping detail ............................51 Figure 4.19. Deflected shape and moment diagram for theoretical pile top conditions, east pile .53 Figure 4.20. Pile crack locations observed following monitoring period ......................................54 Figure 4.21. East abutment center pile excavated for crack exploration .......................................55 Figure 4.22. East abutment center pile cracking ............................................................................56 Figure 4.23. Flexural strain for VW-E-SET minus VW-E-NWT versus flexural strain
for VW-E-SEB minus VW-E-NWB..................................................................................57 Figure 4.24. Deflected shape and curvature diagram for partially restrained pile head.................58
vii

LIST OF TABLES
Table 2.1. Reasons for not using PC piles in integral abutments.....................................................9 Table 2.2. PC pile design criteria for design agencies ...................................................................11 Table 3.1. Geometric characteristics of the Tama County Bridge .................................................19 Table 3.2. Experimental measurements collected at the Tama County Bridge .............................20 Table 3.3. Displacement transducer locations ...............................................................................21 Table 3.4. Abutment pile strain gage locations..............................................................................24 Table 3.5. Thermocouple locations................................................................................................26 Table 4.1. Reliability of the thermocouple data for the Tama County Bridge...............................32 Table 4.2. Reliability of the displacement-transducer data for the Tama County Bridge..............33 Table 4.3. Reliability of the pile strain gage data for the Tama County Bridge ............................36
viii

ACKNOWLEDGMENTS
This research project (Project No. TR-438) was sponsored by the Iowa Highway Research Board of the Iowa Department of Transportation (Iowa DOT). The members of the research advisory board included the following:
• Norm McDonald, Bridge Engineer with the Iowa DOT
• Ahmad Abu-Hawash, Chief Structural Engineer with the Iowa DOT
• Robert Gumbert, Tama County Engineer
• Ray Andrews, Andrews Prestressed Concrete
• Dennis Herberger, Herberger Construction Company
The authors wish to acknowledge the helpful input and guidance that these individuals provided, particularly at the beginning of the project. The authors acknowledge the very cooperative support from staff members of the Tama County Engineering Office. These representatives from the county engineering office were very accommodating in making the arrangements to provide traffic control for the installation of the instrumentation devices on the bridge, to provide soil to refill the trenches that were dug in the abutment berms and around abutment piles at the bridge site, and to complete the restoration of the berms at each abutment after the completion of the research.
The authors also want to acknowledge the work performed by Kuok-Hung Lim, research assistant for the project. He was responsible for the daily activities that were associated with the entire bridge monitoring program. Thanks and appreciation are extended to many graduate and undergraduate students from Iowa State University for their help with the excavation of the abutment berms, installation of the instrumentation devices, and the erection of the security system for the monitored bridge. The authors also wish to thank Douglas L. Wood, Structures Laboratory manager, for his efforts and assistance with the data acquisition system, and Denise K. Wood, Structures secretary, for her assistance in typing the final report.
ix


EXECUTIVE SUMMARY
The use of precast, prestressed concrete (PC) piles in the foundation of bridge piers has long been recognized as a valuable option for bridge owners and designers. However, the use of PC piles for integral abutments has not been widely publicized in the literature. A survey of state DOT bridge owners conducted as part of the present study found that the use of these precast, prestressed concrete piles in integral abutment bridges has not been widespread because of concerns over pile flexibility and the potential for concrete cracking and deterioration of the prestressing strands due to long-term exposure to moisture.
This report presents the construction details and documents the long-term behavior of the first integral abutment bridge in the state of Iowa that utilized precast, prestressed concrete piles in the abutment. The bridge, which was constructed in Tama County in 2000, consists of a 110 ft. long, 30 ft. wide, single-span PC girder superstructure with a left-side-ahead 20º skew angle. In order to provide some degree of rotational freedom, the top of each PC pile was wrapped with a double layer of carpet prior to placing the abutment concrete.
The bridge was instrumented with a variety of strain gages, displacement sensors, and thermocouples to monitor and help in the assessment of structural behavior. This report presents the results of this monitoring and offers recommendations for future application of precast, prestressed concrete piles in integral abutment bridges.
The results of this study indicate that the recorded thermal gradients present in the deck and girders are within reasonable conformance to the published AASHTO guidelines. The most significant conclusion reached in the study indicates that the effectiveness of the carpet wrap at the top of the pile is debatable. The intent of this wrap, installed before the abutment footing concrete is cast, is to reduce the rotational restraint of the abutment concrete and consequently create a pinned type of connection. However, it is unclear from the pile strain data how much freedom of rotation is available for this type of connection with a PC pile.
xi


1. INTRODUCTION
1.1. Background
Previous integral abutment bridge research that was sponsored by the Iowa Department of Transportation (Iowa DOT) and that was conducted by researchers at Iowa State University (ISU) was confined to bridges that are supported by structural steel, HP-shaped abutment piles. In 1999, the Tama County Engineering Office in the State of Iowa constructed a single-span, prestressed concrete (PC) girder, integral abutment bridge that was supported by PC piles. The bridge, which was designed by the consulting firm of Calhoun Burns and Associates, replaced an existing structure over Otter Creek on County Road E43 in Tama County, Iowa. This bridge, which will be referred to as the Tama County Bridge, was the first integral abutment bridge with PC piles that was constructed in the State of Iowa.
1.2. Research Scope, Objectives, and Tasks
Engineers with the Iowa DOT’s Office of Bridges and Structures expressed concerns regarding the performance of PC piles that support integral abutments. Therefore, the primary purpose of the research project summarized in this report was to investigate the performance of the PC piles in Tama County Bridge. To provide direction for the research, the ISU researchers formulated the following three objectives:
1. Determine which state departments of transportation permit the use of PC piles in integral abutment bridges, summarize the design practices for these agencies, and obtain the abutment-to-pile connection details that are used by those agencies.
2. Evaluate the performance of selected PC piles in the Tama County Bridge. 3. Establish the displacement versus temperature behavior of the abutments for the Tama
County Bridge.
To accomplish these objectives, the ISU research team organized the research efforts into the following five tasks:
1. Conduct a literature review that focuses on the use of PC piles to support integral abutment bridges.
2. Develop a bridge monitoring program to measure long-time air and concrete temperatures, longitudinal strains in two abutment piles, longitudinal and transverse displacements for the abutments, pile-head rotations relative to an abutment pile cap, and abutment rotations in a vertical plane that is parallel to the length of the bridge.
3. Monitor an integral abutment bridge that has PC piles to establish its response to thermal loading.
4. Evaluate and interpret the field monitoring records. 5. Present these results in a final report.
1

1.3. Report organization
This chapter has described the scope, objectives, and tasks of the research. Chapter 2 presents the findings of a review of the published literature that focused on the use of PC piles for integral abutment bridges. Chapter 2 also presents the results from a survey sent to the bridge engineers of the 50 state departments of transportation to determine their policies and practices regarding their use of PC piles for integral abutment bridges. The field monitoring program for the Tama County Bridge is described in Chapter 3, the experimental results and their interpretation for this bridge are given in Chapter 4, and the conclusions that the ISU researchers developed from this research pertaining to integral abutment bridges are discussed in Chapter 5. The references used to develop this report are presented in Chapter 6.
2

2. LITERATURE REVIEW AND CURRENT PRACTICE
2.1. Integral Abutment Bridges
An extensive literature review that focused on integral abutment bridges was presented in a recently completed report by Abendroth and Greimann (2005). However, for the convenience of the reader of this final report, some of the more recent publications that presented analytical and experimental investigations of integral abutment bridges and that presented research on the use of PC piles to support integral abutments are discussed again.
The comprehensive report by Abendroth and Greimann (2005) presented results that address finite element modeling for analytical studies and long-time monitoring for experimental studies of two PC girder, three-span continuous, skewed integral abutment bridges with steel piles; analytical evaluations and experimental measurements of the coefficient of thermal expansion and contraction for concrete core samples that were obtained from reinforced concrete decks for many bridges and from the webs of PC girders at two precast concrete manufacturers in the State of Iowa; and numerous recommendations and examples for the design of a pile cap, composite backwall and pile cap, HP-shaped piles, wingwalls, and sidewalls for integral abutments. The finite element studies investigated the influence of the horizontal stiffness of the backfill behind the abutments and along the length of the abutment piles on (1) the induced longitudinal strains in selected abutment piles and PC girders and (2) the abutment displacements along and transverse to the length of integral abutment bridges in Guthrie County and Story County, Iowa. The bridge monitoring program involved measuring longitudinal strains in several HP-shaped abutment piles and I-shaped PC girders; displacements and rotations of the integral abutments; relative displacements and rotations between an abutment pile and pile cap and between an interior PC girder and an abutment backwall; relative displacements between an interior PC girder and a pier cap; and concrete temperatures within the bridge deck and within the top flange, web, and bottom flange of selected PC girders for the two integral abutment bridges analyzed using the finite element models.
Thippeswamy and Gangarao (1995) analyzed five in-service jointless bridges for both primary and secondary loads. One of these bridges is located in Black Hawk County, Iowa. These loads included gravity loads, concrete creep and shrinkage, temperature gradients, soil settlements, and earth pressures. These researchers concluded that the concrete stresses induced at the point where steel piles are embedded into the abutment are very small and that thermal movements are the major contributor to total stresses in a jointless bridge. Also, Thippeswamy and Gangarao (1995) noted that concrete shrinkage and earth pressure loads cause negligible stresses in both the piles and the pile-to-abutment connection.
An extensive study was also performed by Huang et al. (2004) at the University of Minnesota to document the behavior of an integral abutment bridge with steel piles located near Rochester, Minnesota. The bridge was instrumented with over 150 sensors, which were installed during the construction of the bridge. Data were collected for over a seven-year monitoring period that ended in November of 2004. For this bridge, these researchers noted that (1) the effects of temperature changes and solar radiation on the design requirements for this integral abutment
3

bridge were at least as large as the effects of the applied live load and (2) that the observed temperature range was greater than the 80ºF temperature range specified in the AASHTO-LRFD Bridge Design Specifications (AASHTO 2002). Huang et al. (2004) recommended a 130ºF temperature range.
Contrary to one of the recommendations by Thippeswamy and Gangarao (1995), Huang et al. (2004) recommended that concrete creep and shrinkage should be considered in the design of integral abutment bridges. To establish the effects of concrete creep and shrinkage on the displacements of an integral abutment, Huang et al. (2004) presented a simplified analysis procedure that can be used instead of a detailed, time-dependent analysis of a bridge.
At Ain Shans University in Egypt, Mourad and Tabsh (1998) performed a three-dimensional, finite element analysis of an integral abutment bridge to study the truck load effects on integral abutment piling. The finite element program “ALGOR” was used to determine the effects of one or more HS20 trucks positioned side-by-side on an integral abutment. These researchers concluded that the abutment-and-wingwall structure does not behave as a rigid block. Mourad and Tabsh (198) noted that modeling the connection between the top of the abutment piles and the abutment as either a rigid joint or a hinged joint has a negligible effect on axial stresses that are induced in the piles.
Long-time observations of an integral abutment had also been performed by Jorgensen (1983). He concluded that changes in the bridge length do not necessarily occur equally at each end of a bridge and that the maximum flexural stresses in an abutment pile are affected by the movement of an abutment and by the magnitude of the modulus of subgrade reaction for the soil that is less than approximately 20 ft. below the abutment. Jorgensen’s (1983) observations revealed that a reversal of bending moments in an abutment pile occurred at a depth of approximately 3.5 ft. below the bottom of the abutment. The magnitude of these moment reversals was approximately 23% of the maximum induced bending moments in a pile that occurred at a depth of approximately 7 to 10 ft. below the top of the pile.
2.2. Prestressed Concrete Piles
Concrete piles have been used in Europe since the beginning of the 20th century. An early use for this type of foundation was found in a railway station in Metz, Germany, which was constructed in 1905. These piles have either five or six sides with lengths up to 52 ft. After about 1950, the development of pretensioning strands for the longitudinal reinforcement in a PC pile permitted an increase in the length of a pile and produced a decrease in a pile’s concrete cracking (FIP 1986).
Prestressed concrete piles typically utilize both skin friction and end bearing conditions to support vertical loads. The relatively large cross section for a PC pile increases the density of the soil as the pile is driven into the soil. In locations where sand and gravel soils are prevalent, the use of PC piles rather than steel HP-shaped piles may be more economical.
4

A recent publication by the Precast/Prestressed Concrete Institute (PCI 2004) provides a very thorough presentation regarding the use of PC piles. Specific considerations are presented for both geotechnical and structural design by both the working stress and strength design methods. This publication provides information for steel bar reinforcing details and pile-cap connections. The manufacturing, shipping, and installation of PC piles are also discussed in detail, and three design examples that include a comparison of alternative design specifications are presented. Even though this document does not specifically address the use of PC piles for integral abutments, references are given in this document to other publications written by Kamel et al. (1996), PCI (2001), and Burdette et al. (2004b) that discuss the use of PC piles for integral abutment bridges.
Much of the current use of PC piles is for building applications, rather than for integral abutment bridges. In fact, a review of the published literature does not provide a large amount of information regarding the use of PC piles for integral abutment bridges. The available literature presents divergent conclusions regarding the suitability of PC piles for this application.
2.3. PC Piles for Integral Abutments
To simulate 75 years of service life for a pile in an integral abutment bridge, Arsoy et al. (2002) performed laboratory tests of an HP10x42 pile, a 14 in. diameter steel pipe, and a 12 in. square prestressed concrete pile. The details of pile embedment into a reinforced concrete (RC) block were modeled after the construction details for this type of a bridge, which are used by the Virginia DOT. For the HP-shaped pile and the pipe pile, the steel grade was A572 Gr. 50 and A252 Gr. 3, respectively. The PC pile was the standard Virginia DOT pile that had five 1/2 in. diameter, 270 ksi, low-relaxation steel strands. The amount of prestress in the pile was equivalent to an axial compressive stress of 920 psi. Small- and large-amplitude displacement cycles were applied to the test pile to represent the daily and seasonal, respectively, temperature changes of a bridge superstructure. A total of about 27,000 horizontal displacement control cycles were applied to one end of a test pile. The HP-shaped pile was oriented for weak-axis bending and was stressed up to 50% of the nominal yield stress for the pile. Axial loads were simultaneously applied with the horizontal displacements for only the HP-shaped pile. Testing limitations prevented simultaneously applying an axial load to the laterally displaced pipe and PC piles. Based on the test results, Arsoy et al. (2002) concluded that the HP-shaped pile was the best choice of the three types of piles for an integral abutment. Since the steel pipe pile was substantially stiffer than the HP-shaped pile, an abutment would be subjected to larger stresses that could damage an abutment if the pipe pile were used rather than an HP-shaped pile. Since the tested PC pile developed tension cracks that were spaced along the length of the pile, these authors did not recommend using PC piles for integral abutment bridges. Arsoy et al. (2002) noted that this type of a pile may experience progressive concrete cracking and damage when cyclic horizontal displacements occur at the pile head.
The Tennessee DOT permits one in. horizontal movement of either steel or concrete piles at the ground surface and in either direction along the length of a bridge due to thermal expansion and contraction of a bridge superstructure. This criterion limits the maximum jointless bridge length to 500 ft. for steel bridges and 800 ft. for concrete bridges. Due to different soil conditions, the Tennessee DOT designs integral abutment bridges with steel HP-piles in eastern and central
5

Tennessee and with PC piles in the western part of the state (Burdett et al. 2004a). Section 2.5.6 presents more information related to the Tennessee DOT experience with prestressed concrete piles.
The use of PC piles in integral abutment bridges was also investigated by Kamel et al. (1996). These researchers studied the lateral load versus lateral displacement relationships for both PC piles and steel HP-shaped piles. The steel piles experienced greater lateral displacements than that of the PC piles before the allowable moment strength was developed for a cross section of the pile. Laboratory tests of piles in loose sand, which is sometimes placed in prebored holes for integral abutment piles, revealed that the density of the sand had a significant effect on the lateral displacements of both types of piles. The lateral displacements of a pile head were dependent on the lateral stiffness of the soil against the upper 10 ft. of the pile length. The lateral stiffness of the soil below this depth had a negligible effect on the lateral displacement at the pile head. This behavior was observed for both the PC piles and the steel HP-shaped piles.
Kamel et al. (1996) also investigated the feasibility of a sliding joint for the pile-to-abutment connection consisting of a bearing pad at the top of the pile and a compressible wrap around the top of the pile. The bearing pad consists of randomly oriented, reinforced fiber neoprene that is coated with a Teflon layer. The compressible material permits longitudinal movement of the abutment and breaks the bond between the abutment and the pile head. Laboratory tests of the proposed joint revealed that a vertical load on a pile was sustained when the modeled abutment was displaced about one inch to either side of the vertical position for the pile. The research did not discuss whether this sliding joint connection was tested in the field.
The Indiana DOT (PCI 2001) has used a 1.5 in. thick layer of a sprayed-on expanded polystyrene coating on the top of concrete piles to form an essentially pinned connection to an integral abutment. The decision to pin the tops of the piles at the end bents was due to the shortening that would result for the longitudinal post-tensioning of the superstructure and the fact that the concrete for the end bent had been cast prior to the casting of the bridge deck.
2.4. Lateral Load Tests on PC Piles in Integral Abutments
At the University of Nebraska, Kamel et al. (1999) performed laboratory tests on three pile-topile-cap specimens. One specimen had a steel H-pile, and two specimens had PC piles. The results of this testing indicated that the steel pile had a greater capacity to accommodate lateral deflection than the concrete piles, but the difference in this response was not significant when stresses are limited to the piles’ allowable stress design values. Kamel et al. (1999) also concluded that predrilled holes that are filled with loose sand have a significant effect on the behavior of laterally loaded piles. The researchers determined that, since most of the horizontal deflections and the largest bending moments occur within the top 10 ft. of the pile length, the surrounding soil in this region will always control the behavior of the pile, regardless of the type of soil present below this depth or the type of pile used.
Burdette et al. (2004a) performed a series of lateral load tests on a set of four 14 in. square PC piles that were driven 36 ft. into undisturbed clay soil at the University of Tennessee. The
6
concrete compressive strength of the PC piles was approximately 6,500 psi, and each pile was prestressed with six 1/2 in. diameter strands. The tops of the piles were restrained by a 36 in. wide concrete abutment, which was designed to prevent rotation of the pile top. As a horizontal load was applied to the abutment, rotation at the top of the pile was restrained by holddown beams. The protocol for a test pile involved four load sequences. The first load sequence consisted of three separate applications and the removal of horizontal loads, each of which induced a horizontal displacement of 0.5 in. at the ground surface. The second load sequence consisted of three separate applications and the removal of larger horizontal loads, each of which induced a horizontal displacement of 1.0 in. in the same direction as that for the first load sequence. The third and fourth load sequences were similar to the first and second load sequences, respectively, except that that load direction was reversed. The test results revealed that, as the horizontal displacement approaches 1 in., the pile cracked just below the pile-toabutment interface. This concrete cracking had only a minor effect on the overall load deflection behavior for the pile. The minor concrete cracking in the abutment was considered by Burdette et al. (2004a) to be insignificant. The authors stated that “the limiting element in the lateral tests was the prestressed pile itself.” Burdette et al. (2004b) noted that the prestressing force in a pile effectively closed the concrete cracks when the induced horizontal displacement at the pile head was reduced to near zero. The test piles experienced only a small reduction in their lateral stiffness with repeated load cycles. The results of these tests (Burdette et al. 2004a) provide strong evidence that PC piles are appropriate for use with integral abutment bridges. Those researchers concluded that the Tennessee DOT’s current lateral displacement limit of one inch is somewhat conservative. Although the authors did not specify a revised pile displacement criterion, a pile displacement of as much as 1.5 in. would appear to be a reasonable displacement limit.
2.5. PC Pile-to-Pile-Cap Connection
At the University of South Carolina, Harries and Petrou (2001) investigated a variety of connections that would transmit the full moment capacity of a PC pile to a concrete pile cap. These connections include features such as roughing or grooving the concrete surfaces of a pile, drilling or embedding dowels in the driving head of a pile, confining the embedded region of a pile in a pile cap with spiral reinforcing, and extending the strands at the pile head and casting these strands into the concrete for the pile cap. The various connections were subjected to flexural and pullout tests to simulate tensile loads that may occur during a seismic event.
Harries and Petrou (2001) noted that their experimental results indicated that a pile embedment length, which was equal to the width of the pile, will conservatively result in a connection having sufficient capacity to develop the full moment resistance of the pile. Although this testing was performed on square piles, Harries and Petrou (2001) believed that their conclusion on strand embedment length can be extended to other typical pile cross sectional shapes if a horizontally projected pile width is used to represent the width of an equivalent square pile. These researchers also noted that round or octagonal piles will develop concrete bearing forces that act in a radial direction to the pile and along the pile embedment length. These bearing forces may cause greater deterioration of the pile cap along the embedment portion of the pile within the pile cap. Harries and Petrou (2001) commented that if the prestressing strands for a PC pile are not fully
7

developed at the pile-to-pile-cap interface, the full moment capacity of the pile will not be available at this location.
At the University of Tennessee, Deatherage et al. (2003) investigated the effects of casting the exposed ends of the prestressing strands for the abutment piles into the abutment. These researchers commented that the test assembly, which was used in this investigation, was designed with a rotational stiffness that was approximately comparable to the rotational stiffness of an actual bridge deck (Lowe 2002).
At the University of Canterbury in New Zealand, Joen and Park (1990) performed a number of simulated seismic load tests to investigate the ductile behavior of spirally reinforced PC piles. The authors developed and tested several different details for the connection between a PC pile with an octagonal-shaped cross section and a cast-in-place concrete pile cap. Each face of these piles had a width of 6.5 in. The results of their research indicated that PC piles exhibit ductile behavior when cast with properly designed spiral reinforcing. Joen and Park (1990) noted that the spiral reinforcing, which is within the region of the pile embedment length, should be similar to that used in a plastic hinge region for a reinforced concrete structure.
2.6. Survey of PC Pile Use for Integral Abutment Bridges
To better understand nationwide utilization and practice standards for PC piles in integral abutments, the research team developed a questionnaire. This survey requested information from state department of transportation bridge engineers about the following aspects of PC piles and integral abutment bridges:
• Usage of integral abutment bridges • Usage of PC piles to support integral abutments • Reasoning for and duration of usage of PC piles in integral abutments • Bridge length and skew angle limitations when PC piles are used in integral abutments • Written documentation or standards regarding PC piles for integral abutment bridges • Design considerations for PC piles in integral abutments • Connection of PC piles to a pile cap in integral abutments • Splice details for PC piles in integral abutments • Problems, and likely causes for the problems, in a PC pile-supported integral abutment • Other related research regarding PC piles for integral abutment bridges
On July 18, 2002, a total of 52 surveys were mailed, one to each of the chief bridge engineers of the state departments of transportation, along with representatives for the District of Columbia and the Puerto Rico Highway and Transportation Authority.
2.6.1. Response Rate
A total of 34 responses to the survey were returned to the ISU research team. Of these survey forms, 33 were completed by the bridge design agencies. One state DOT responded to the survey
8

by e-mail and noted that it does not use PC piles and has no plans to do so in the future. The following sections of this chapter discuss the survey results with respect to the completed survey forms.
2.6.2. Utilization of PC Piles for Integral Abutments
Twenty-nine agencies (88% of the respondents) indicated that they either currently design or had previously designed integral abutment bridges. Agencies that do not use (or have not used) integral abutment bridges were not asked to provide reasons for this decision. A total of 7 agencies (23% of the respondents) indicated that they currently allow the use of PC piles with integral abutment bridges, while a total of 21 agencies (70% of the respondents) design integral abutment bridges but do not permit the use of PC piles. Agencies that do not allow the use of PC piles for integral abutment bridges were not asked to indicate the types of pile they do permit. One agency indicated that it had previously permitted the use of PC piles with integral abutments. However, this agency indicated that PC piles do not provide enough ductility and that the agency will probably not allow PC piles to support integral abutments in the future. This agency indicated that PC piles are no longer used for any bridges within its jurisdiction.
Agencies that do not use PC piles to support integral abutments were asked to provide the reason(s) they stopped permitting or have never permitted this practice. The responses to this question are listed in Table 2.1. Since the respondents were permitted to list more than one of the provided reasons listed in Table 2.1, the total for the listed percentages exceeds 100%. Seven agencies (33% of those responding) indicated their reason for not permitting the use of PC piles includes both a lack of ductility and a lack of research. A total of three states (14% of those responding) indicated they do not use PC piles for all of the following reasons: PC piles are not readily available, PC piles are not economical, and bridge contractors do not like to use PC piles. In addition, five states (23% of those responding) noted two of these same three reasons for not using PC piles. Two agencies indicated that the difficulty in predetermining the final length of PC piles and the potential difficulty of splicing the piles in the field were considerations in not using PC piles for integral abutment bridges.
Table 2.1. Reasons for not using PC piles in integral abutments
Reasons for not permitting PC pile usage for integral abutments Respondents (%) PC piles do not provide enough ductility 48 Insufficient research 52 PC piles are not readily available 33 PC piles are not economical 24 Bridge contractors do not like to use PC piles 19 Other 29
A total of 14 agencies (58% of the respondents) noted that they are unlikely to permit the use of PC piles for future integral abutment bridge. Only those states that responded that they currently permit or have previously permitted the use of PC piles for integral abutments were asked to respond to the remaining questions in the survey.
9

Agencies permitting the use of PC piles were asked to specify their reasons for doing so. As expected, a large number of responses (44% of the agencies) indicate that PC piles provide more skin friction than steel piles. Agencies also noted that PC piles are used in particular areas of their state when bedrock exists at extreme depths, when contractors are permitted to select from one of four standard pile types (but PC piles are limited to bridges with spans that are less than 150 ft.), and when the contractors’ preference for PC piles is based on the corrosive nature of the soil surrounding the piles.
Eight agencies indicated that they have been permitting the use of PC piles for integral abutments for a number of years. Five of these eight agencies have allowed this practice for more than ten years, and two of these eight agencies have allowed this practice for at least five years.
2.6.3. Bridge Length and Skew Angle Limitations
The respondents were asked to provide the maximum total bridge length that they permit when PC piles support integral abutments, considering both skewed and non-skewed bridge alignments and both steel and concrete superstructures. The maximum bridge lengths were very similar for both bridge alignments and bridge types: 62% of the respondents limit the total length of steel bridges to less than 200 ft., while 55% of the respondents permit a 200 ft maximum length for concrete bridges. Two states permit a maximum bridge length of 250 ft. for both steel and concrete bridges.
Also, the respondents were asked to provide the maximum skew angle for integral abutment bridges that are supported by PC piles, considering both steel and concrete superstructures. The maximum skew angles were similar for both steel and concrete bridges. Two states permit this type of abutment construction for bridges with less than a 5 º skew, two states permit this type of abutment construction for bridges with skew angles between 5 º and 15 º, and two states permit this type of abutment construction for bridges with skew angles between 15 º and 25 º. Another two responding agencies permit the use of PC piles in integral abutments that have skew angles greater than 35 º. No specific reasons for these limitations were provided by the respondents.
2.6.4. Design Considerations for PC Piles that Support Integral Abutments
The vast majority of responding agencies (88%) do not have any type of written documentation or design criteria for the use of PC piles that support integral abutments. In addition, 86% of the respondents indicated they essentially use the same PC piles (including the cross sectional shape and dimensions, concrete and reinforcing steel strengths, and number and size of vertical and tie/spiral reinforcements for the piles) for both integral abutments and other applications. Regarding design criteria, respondents were asked to select, from the items listed in Table 2.2, the criteria that they frequently consider in the design of PC piles for use in integral abutment bridges. Since each of the seven responding agencies could select more than one item from the list, the total for the listed percentages exceeds 100%. Four of these seven agencies indicated that they use a combination of axial load and bending moment interaction, thermal-induced bending of the pile, and the moment-curvature relationship to address pile ductility in their design procedure. In contrast, two agencies indicated that they use a combination of axial load criteria
10

and state standards; however, these states do not have specific PC pile design criteria when this type of pile supports an integral abutment. One state indicated that it also considers pile bending and shear due to seismic loads in the design of PC piles for integral abutments.
Table 2.2. PC pile design criteria for design agencies
Design criteria Respondents (%) Axial load criteria only 43 Axial load and bending moment interaction 57 Thermal-induced bending of pile 57 Moment versus curvature relationship to address ductility 57 Equivalent column length 14 State/Agency standards – no specific design 29 Other 14
2.6.5. Connection Details and Predrilled Holes
The responding agencies prefer either a partial-moment or full-moment connection to a simple connection between the top of a PC pile and an abutment pile cap. Only 20% of the design agencies use a simple connection that does not transfer bending moments between a pile and a pile cap. However, 40% of the design agencies utilize a partial-moment connection and 30% of the design agencies prefer a full-moment connection. A respondent from the Kentucky DOT provided PC pile details (see Figure 2.1) for the agency’s partial-moment connection between a PC pile and a pile cap. Its preferred partial-moment connection is developed by placing eight #6 bars with a development length of 1 ft. 10 in. into the top of the pile and into the bottom of the abutment cap.
Seventy-five percent of the responding agencies indicated a preference against using a full cross sectional splice between two PC pile sections when that type of a pile is used to support integral abutment bridges. Specific explanations for not splicing PC piles were not given by these design agencies. The respondent from the Kentucky DOT provided a detail (see Figure 2.2) of the agency’s full cross sectional pile splice. This full-section pile splice has a layer of epoxy cement between the ends of the pile sections and four #9 dowel bars that extended 3 ft. into each pile section. The two states that use a full-section pile splice were asked whether they specify a minimum distance between the bottom of an abutment and the pile splice. One state noted that it specifies a minimum distance of 10 ft.
The design agencies were nearly unanimous in their response regarding the use of predrilled holes for the PC piles that support integral abutments. Most of these design agencies do not explicitly specify in their states’ respective bridge design manuals that a predrilled pile hole or any other type of detail is required to reduce soil pressures that act against the upper length of a PC pile. However, one respondent indicated that for span lengths greater than 100 ft. the state bridge design manual requires the use of prebored holes, which extend to a depth of 8 ft. below the bottom of the pile cap.
11

Figure 2.1. PC pile reinforcement (courtesy of Kentucky DOT)
12

Figure 2.2. Pile splice detail (courtesy of Kentucky DOT)
2.6.6. Cracking of PC Piles
Only one of the eight responding states that have used PC piles to support an integral abutment has observed cracking in some of those PC piles. The representative who completed the survey for this state indicated that the most likely cause of this concrete cracking was due to the driving of the pile and by the bending moments in the piles that were induced by thermal expansion and contraction of the bridge.
2.6.7. Problems and Overall Performance
Eight agencies responded when asked to rate the overall performance of PC piles that support integral abutments. Of these respondents, three agencies indicated that the use of PC piles met their expectations, while one state indicated that the use of PC piles exceeded their expectations. The remaining four agencies did not express an opinion regarding the overall performance of PC piles. The survey requested the respondents to rate any problems associated with the use of PC piles that support integral abutments. Three of the eight respondents indicated either no or minor problems were encountered with the use of PC piles in integral abutment bridges. The remaining five agencies did not express an opinion regarding problems associated with the use of PC piles.
2.6.8. Current and Future Research
Thirty-two state agencies replied to the survey question that asked whether they have sponsored, are currently sponsoring, or are planning to sponsor research related to the use of PC piles to support integral abutments. Of these respondents, five agencies (16% of those 32 state agencies) indicated “yes.” A respondent from one state noted that the agency is also requesting its researchers to investigate the use of drilled shaft foundations to support integral abutments. At the time of the survey, limited funding for that research had prevented progress on the research. Two other states replied that researchers were in the final stages of report preparation for their
13

research. As of July 2002, a limited amount of research has been conducted regarding the use of PC piles in integral abutment bridges.
2.6.9. Design Criteria and Details
Four agencies provided standard details or design manual provisions for integral abutment bridges. However, most of the submitted material did not specifically address PC piles. One respondent provided an excerpt from the agency’s Bridge Design Manual, which specifies the following:
• “Design of skewed integral abutment bridges must account for the transverse horizontal earth pressure applied along the skew.”
• “Backfill shall be placed simultaneously at both abutments after the deck concrete is placed. This detail shall be included by a note in the plans.”
• “A minimum lateral design force of 20 kips per pile is to be used for determining the flexural reinforcing in the abutment backwall.”
An excerpt from another state’s Design Manual for Bridges and Structures states the following:
• “PC piles may be used for bridges with span lengths < 150 ft. For span lengths > 100 ft., prebored holes extending 8 ft. below the footing elevation shall be used.”
• “Splices are not permitted within the top or bottom 10 ft. of pile length.” • “Skewed integral abutments shall be placed parallel to each other and ideally be of equal
height.”
A third state agency provided an excerpt from its Standard Bridge Plans, which states, “Build-up details may be used to provide additional length to a previously driven pile. These built-up piles may not be driven without the approval of the engineer.”
14

3. EXPERIMENTAL MONITORING PROGRAM
3.1. Overview
The primary objective of the research component of this project was to measure the long-term temperature-induced displacements of the abutments and longitudinal strains in selected PC piles that support the abutment backwalls of an integral abutment bridge. The observations were conducted on the Tama County Bridge in Tama County, Iowa, and the instrumentation consisted of displacement transducers, strain gages, and thermocouples.
3.1.1. Bridge Description
The bridge, the only integral abutment bridge with PC piles for the abutments constructed to date in the State of Iowa, is a 110 ft. long, 30 ft. wide, single-span PC girder bridge with a left-sideahead, 20º skew angle. The bridge was built in Tama County, Iowa, about four miles northeast of Tama, where Route E43 crosses Otter Creek. Specific design information for this bridge is shown on the design drawings for the Iowa DOT Project BRS-86(30)—60-86 as Design No. 5198, File No. 5526, and Sheet Nos. 1 through 15.An isometric view and a plan view of the bridge are shown in Figures 3.1 (a) and 3.1 (b), respectively. Figures 3.2 (a) and (b) present Iowa DOT drawings that illustrate the longitudinal and transverse cross sections of the bridge, respectively. The bridge, which in this report is referred to as the Tama County Bridge, has U-shaped abutments. Each RC abutment backwall is supported by a single row of seven 12 in. by 12 in. PC piles, and each RC abutment wingwall is supported by a single 12 in. by 12 in. PC pile. These backwall and wingwall piles are oriented with a pile face parallel to the length of the backwall and wingwall, respectively.
The Tama County Bridge, which had a December 1, 1998, letting date, replaced an existing bridge on the farm-to-market system. Design drawings for this bridge do not specify the use of prebored holes for the abutment piles. When HP-shaped steel piles support the abutments for an integral abutment bridge, the Iowa DOT specifies the use of prebored holes at each abutment pile. After the steel piles are driven, these holes are filled with a non-stiff material, such as bentonite, which provides flexibility for the abutment piles along the upper portion of their lengths when the bridge superstructure experiences thermal expansion and contraction. For the Tama County Bridge, Sheet No. 6 of 15 states that the top 3 ft. of the pile lengths were to be wrapped with a double thickness of rug padding that was to be attached to the piles using galvanized roofing nails and #14 gage galvanized wire that was wrapped at a 4 in. pitch around the piles. This rug padding was to be either a hair and jute padding rubberized on both sides and weighing not less than 47 oz./yd.2 or a bonded urethane or bonded poly-foam padding with a density of at least 5 lb./ft.3 and a thickness of at least 1/2 in. This padding was used to minimize bending moment continuity between the PC piles and the RC abutment. After the padding was attached to the abutment piles, the top two ft. of the piles were encased by the abutment concrete.
15

Concrete deck
Wingwall
Backwall piles
Girder
Backwall Pile cap
Wingwall pile
(a) Isometric view
(b) Plan view
Figure 3.1. Isometric and plan views of the Tama County Bridge
16

(a) Longitudinal section along roadway
Figure 3.2. Design drawing for the Tama County Bridge (courtesy of Iowa DOT)
17

Half-section near midspan
(b) Transverse cross sections
Half-section near abutment
Figure 3.2. Design drawing for the Tama County Bridge (courtesy of Iowa DOT)
18

The 50 ft. deep, soil boring logs for the Tama County Bridge were photocopied onto Sheet No. 3 of 15. The test holes E43-1 and E43-2, drilled adjacent to the west abutment and east abutment, respectively, revealed that a similar soil profile exists at each abutment. The upper 3 ft. of fill at the west abutment and east abutment consists of brown, poorly graded, moist, fine sand and crushed limestone, respectively. The next 9 ft. of the boring lengths contained a moist, brown, lean clay-soil fill at each abutment. The lower 37 ft. of the boring lengths revealed a moist-tosaturated, brown and gray clay alluvium soil. A 21.5 ft. and 23.5 ft. depth to the water table was observed in the test holes at the west abutment and east abutment, respectively. The soil boring logs listed the standard blow count per foot at three depths along the upper 15 ft. for the test hole of the west abutment and at ten depths along the entire length for the test hole of the east abutment. Within the upper 15 ft. of the lengths for the test holes, the penetration tests produced 9, 6, and 25 blows/ft., and the corresponding penetration tests at the east abutment produced 7, 4, and 16 blows/ft. These penetration tests suggest that, for the upper 15 ft. of the depth for the test holes, the density of the soil at the west abutment was slightly higher than that at the east abutment. The construction drawings for the Tama County Bridge also specify that the backfill behind the abutments and between the abutment wingwalls was to be a granular and porous backfill.
The use of PC piles is rather common for pier foundations of bridges on the secondary roads system in the State of Iowa. However, the use of PC piles for integral abutments is not common, primarily due to concerns over the piles’ ductility during continued thermal expansion and contraction cycles of the bridge superstructure. A summary of the geometric characteristics of the Tama County Bridge is provided in Table 3.1.
Table 3.1. Geometric characteristics of the Tama County Bridge
Total bridge length 110 ft., 0 in.
Skew 30°
Abutment pile arrangement U-shaped
Number of piles per abutment Seven
Bridge orientation East-West
Number of PC girders Five
Type of PC girders LDX
Bridge width 30 ft., 0 in.
3.1.2. Instrumentation Package
To quantify the thermally induced displacements of the abutments and strains in selected bridge elements, an instrumentation package was developed for long-term field monitoring of the Tama County Bridge. Table 3.2 presents the behavioral responses that were measured for the bridge and gives the number of each type of instrumentation device that was installed on the bridge. The instrumentation devices are described in Sections 3.2 through 3.4. Each individual device was assigned an initial-based code name. The first part of the name, which consists of two letters,
19

refers to the instrument type (SP = string-type potentiometer, VW = vibrating wire strain gage, and TC = thermocouple), while the remaining letters and numbers indicate the location and orientation of the instrumentation device on the bridge. For example, the name SP-E-NL describes the string-type potentiometer that was installed at the east abutment under the north girder to measure the longitudinal displacements of the pile cap.
Table 3.2. Experimental measurements collected at the Tama County Bridge
Behavioral measurement Location Device Number
Abutment longitudinal displacements
Each abutment Direct current displacement transducer (DCDT)
4
Abutment transverse displacements Each abutment Direct current displacement transducer (DCDT)
3
Strains in PC concrete pile Two piles Vibrating wire strain gage
16
Vertical temperature gradient through superstructure
Three locations Thermocouple 9
Average concrete temperature of the bridge
Twelve locations Thermocouple 12
3.2. Displacement Transducers
Table 3.3 presents the instrumentation code, location, and measurement for the transducers that were installed on the Tama County Bridge, and Figure 3.3 shows the location of these devices on this bridge. Longitudinal displacements (translations parallel to the longitudinal axis of the bridge) of the east abutment were measured at three locations across the width of the RC backwall using a string-type potentiometer or displacement transducer, denoted as SP-E-NL, SPE-CL, and SP-E-SL. Also, transverse displacements (translations perpendicular to the longitudinal axis of the bridge) of the east abutment were measured at the sides of the RC abutment backwall. These devices at the north side and south side of the east abutment backwall were denoted as SP-E-NT and SP-E-ST, respectively. The displacements at these transducer locations were measured at a point on the abutment that was approximately three in. above the bottom of the pile cap. Longitudinal displacements of the west abutment were measured at two elevations and at the mid-width of the abutment by displacement transducers SP-W-CLT and SPW-CLB. The sensor wire for the transducers SP-W-CLT and SP-W-CLB were attached at a point that was approximately 3 in. below the top and 3 in. above the bottom, respectively, of the pile cap. The letters, C, L, T, and B in the initial-based code names for these devices represent the following: center of the abutment width (C); displacement along the longitudinal direction of the bridge (L); near the top of the pile cap (T), and near the bottom of the pile cap (B), respectively. Transducer SP-W-NT was installed at the north side of the west abutment to measure the transverse movement of the west pile cap. The sensor wire for this transducer was attached at a point that was approximately 3 in. above the bottom of the pile cap.
20

Table 3.3. Displacement transducer locations
Instrument code Location Measurement
SP-E-NL East abutment at north end Longitudinal movement of pile cap
SP-E-CL East abutment at center of width Longitudinal movement of pile cap
SP-E-SL East abutment at south end Longitudinal movement of pile cap
SP-E-NT East abutment at north edge Transverse movement of pile cap
SP-E-ST East abutment at south edge Transverse movement of pile cap
SP-W-CLT West abutment at center of width Longitudinal movement at top of pile cap
SP-W-CLB West abutment at center of width Longitudinal movement at bottom of pile cap
SP-W-NT West abutment at the north edge Transverse movement of pile cap
Figure 3.3. Location of transducers on the Tama County Bridge
All displacement transducers were mounted on benchmark posts installed approximately 10 ft. from the face of a bridge abutment, as shown in Figure 3.4. Each post-mounted transducer was firmly bolted to a benchmark post, and its sensor cable was attached to the monitored abutment utilizing a steel wire with a known coefficient of thermal expansion and contraction. The thermally induced expansion and contraction of the bridge superstructure produced movements of the abutments that were measured relative to a benchmark post.
21
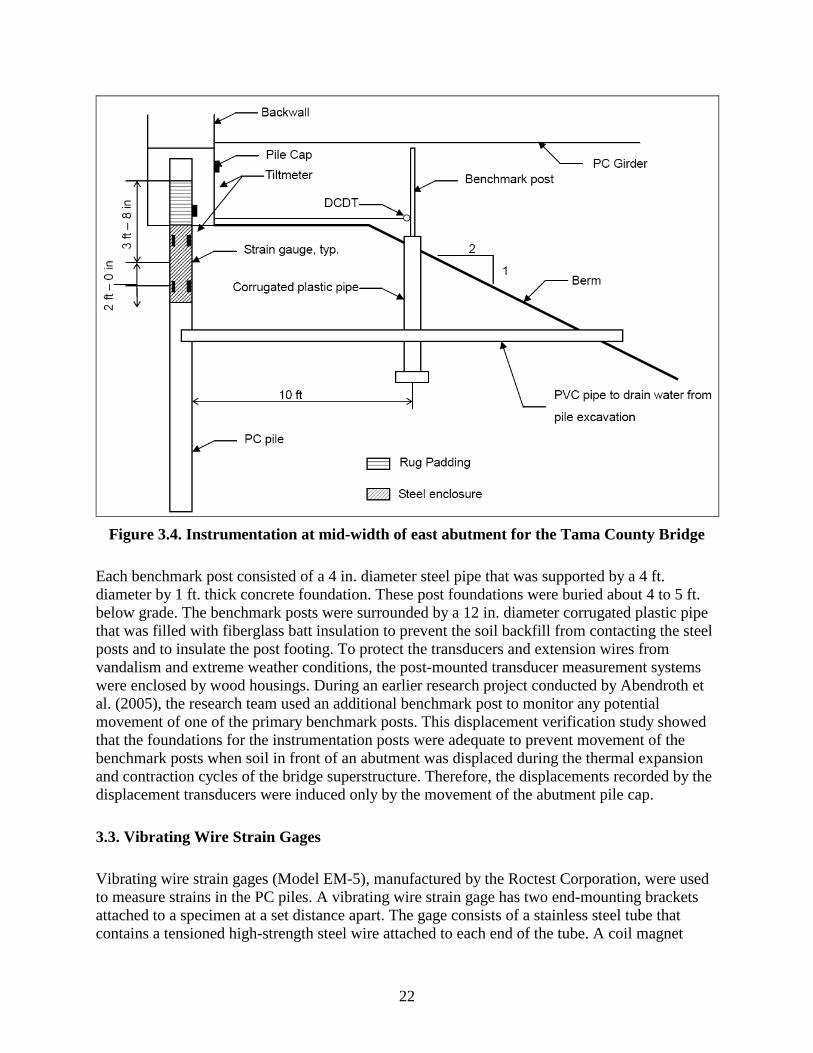
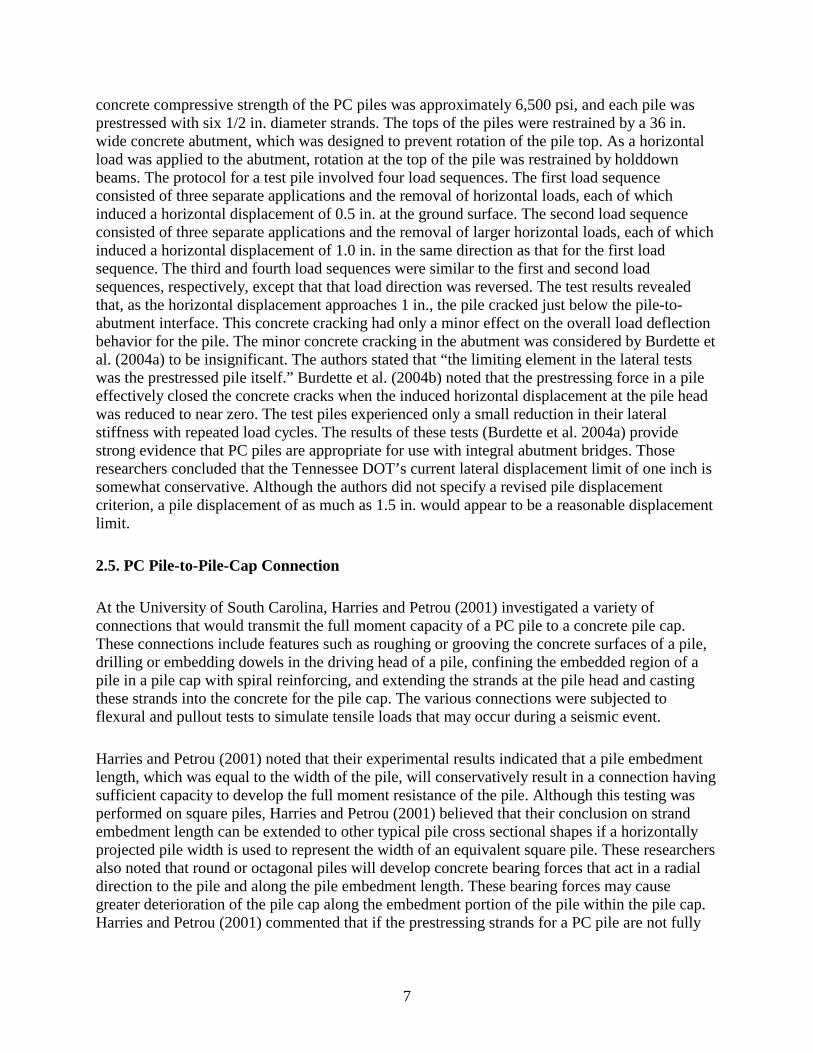
Figure 3.4. Instrumentation at mid-width of east abutment for the Tama County Bridge
Each benchmark post consisted of a 4 in. diameter steel pipe that was supported by a 4 ft. diameter by 1 ft. thick concrete foundation. These post foundations were buried about 4 to 5 ft. below grade. The benchmark posts were surrounded by a 12 in. diameter corrugated plastic pipe that was filled with fiberglass batt insulation to prevent the soil backfill from contacting the steel posts and to insulate the post footing. To protect the transducers and extension wires from vandalism and extreme weather conditions, the post-mounted transducer measurement systems were enclosed by wood housings. During an earlier research project conducted by Abendroth et al. (2005), the research team used an additional benchmark post to monitor any potential movement of one of the primary benchmark posts. This displacement verification study showed that the foundations for the instrumentation posts were adequate to prevent movement of the benchmark posts when soil in front of an abutment was displaced during the thermal expansion and contraction cycles of the bridge superstructure. Therefore, the displacements recorded by the displacement transducers were induced only by the movement of the abutment pile cap.
3.3. Vibrating Wire Strain Gages
Vibrating wire strain gages (Model EM-5), manufactured by the Roctest Corporation, were used to measure strains in the PC piles. A vibrating wire strain gage has two end-mounting brackets attached to a specimen at a set distance apart. The gage consists of a stainless steel tube that contains a tensioned high-strength steel wire attached to each end of the tube. A coil magnet
22

assembly is used to vibrate this wire and to measure its vibration frequency. When the distance changes between the mounting brackets, a corresponding change in the length of the stainless steel tube occurs, and a mechanical strain is induced in the steel wire located within the tube, which changes the tension in the wire. The change in the wire strain is established from the change in the vibration frequency for the wire. The change in frequency for a particular gage was calibrated with its mechanical strain by the manufacturer for the strain gage. The strain range for a Model EM-5 strain gage is approximately 3,300 microstrains. This strain range corresponds to a deformation of approximately 0.02 in. between the mounting brackets.
As shown in Figure 3.5, the strain in the center pile was monitored at each abutment. Each of these piles was instrumented with eight vibrating wire strain gages that were mounted to the exterior surface of the pile on the bridge. Table 3.4 lists the instrumentation code, member, and location for each of the vibrating strain gages. As shown in Figure 3.6, an array of four strain gages was installed to measure the longitudinal strains at a cross section for a pile. Each of the monitored piles was instrumented at two cross sections. The upper and the lower cross sections were located at 8 in. and at 32 in., respectively, below the bottom of the pile cap. If four longitudinal strains at a specific cross section for a pile are known, the x-axis bending, y-axis bending, axial, and torsional warpage strains can be calculated for that monitored cross section. Strain gages were used at two pile cross sections in an attempt to determine strain gradients along the pile length.
Figure 3.5. Vibrating wire strain gage locations for the Tama County Bridge
23

Table 3.4. Abutment pile strain gage locations
Instrument code Member Gage location
VW-E-NET East abutment, center pile Northeast corner, top cross section
VW-E-SET East abutment, center pile Southeast corner, top cross section
VW-E-NWT East abutment, center pile Northwest corner, top cross section
VW-E-SWT East abutment, center pile Southwest corner, top cross section
VW-E-NEB East abutment, center pile Northeast corner, bottom cross section
VW-E-SEB East abutment, center pile Southeast corner, bottom cross section
VW-E-NWB East abutment, center pile Northwest corner, bottom cross section
VW-E-SWB East abutment, center pile Southwest corner, bottom cross section
VW-W-NET West abutment, center pile Northeast corner, top cross section
VW-W-SET West abutment, center pile Southeast corner, top cross section
VW-W-NWT West abutment, center pile Northwest corner, top cross section
VW-W-SWT West abutment, center pile Southwest corner, top cross section
VW-W-NEB West abutment, center pile Northeast corner, bottom cross section
VW-W-SEB West abutment, center pile Southeast corner, bottom cross section
VW-W-NWB West abutment, center pile Northwest corner, bottom cross section
VW-W-SWB West abutment, center pile Southwest corner, bottom cross section
Figure 3.6. PC pile with vibrating wire strain gages
Strain Gage, typ.
12 in. by 12 in. PC pile 2 in., typ.
To install the pile strain gages, the 18 in. thick revetment rip-rap with engineered fabric and the soil for the berm were removed from around the upper portions of the selected piles to expose the upper 4 ft. of length for a monitored pile. At each gage location, the concrete surfaces of the monitored pile were scraped to remove any remaining soil. The concrete surface at a gage location was sanded to produce a flat and smooth surface to accommodate the installation of the strain gage. The pile surface at a gage location was rinsed with water and dried using an electric hair dryer. The mounting brackets for the vibrating strain gages were installed according to the manufacturer’s instructions. A heater was used to keep the concrete surface for a PC pile at a sufficient temperature to facilitate the curing of the epoxy that was used to bond the gage’s
24

mounting brackets to the concrete surface. A high-strength epoxy adhesive, which was purchased from Measurements Group, Inc., had a low setting temperature and a short curing time.
To protect the gages against damage that could result from contact with soil and water, a steel box was assembled to enclose the four gages on each face of a pile. The wire leads for the strain gages passed through a small opening at one of the upper corners of each steel box. An electrically shielded extension wire was spliced to the lead wires for each strain gage, and the other end of the extension wire was connected to a data acquisition system. All of the electrical wire splices were sealed for moisture infiltration. Shrink wrap tubing was installed around each of the five conductor wires for each strain gage. These spliced connections were covered with a waterproof tape. Prior to wrapping the splices with duct tape, the waterproof tape was covered with a silicone caulk.
Following the completion of the electrical connections, the opening for the strain gage lead wires at one of the upper corners of each of the steel boxes was sealed with caulk. Water infiltration into the steel box was restricted by a waterproof silicone caulk that was applied all around the joint between the steel box and the pile face. A small-diameter PVC pipe was installed beneath each steel box to drain any groundwater away from the location of the strain gages. After all of the electrical connections were tested, the excavation around an instrumental pile was backfilled with soil.
3.4. Thermocouples
At selected locations in the bridge, thermocouples were installed along the length, across the width, and through the depth of the bridge superstructure to measure the temperature of the concrete and to establish thermal gradients. Thermocouples were embedded in the RC bridge deck and the PC girders at several locations by drilling a small-diameter hole, placing a thermocouple into the hole, and filling the hole with a cement grout. Deck temperatures were measured at a depth of approximately 4 in. from the bottom of the slab, and girder temperatures were measured at about a 3/4 in. depth into those members.
Twenty-eight thermocouples, listed in Table 3.5, were used to measure concrete and air temperatures at the Tama County Bridge. Twenty-one of these thermocouples were installed in the bridge superstructure at the locations shown in Figure 3.7. The concrete deck temperatures were measured near the east abutment using gages TC-E-S1, TC-E-S2, TC-E-S3, and TC-E-S4; at the mid-span of the bridge using gages TC-M-S1, TC-M-S2, TC-M-S3, and TC-M-S4; and near the west abutment using gages TC-W-S1, TC-W-S2, C-W-S3, and TC-W-S4. The remaining thermocouples in the bridge superstructure monitored concrete temperatures at the mid-span of three PC girders. These thermocouples for the north exterior, center, and south exterior PC girder were gages TC-C-CGT, TC-C-CGC, and TC-C-CGB (north exterior girder); TC-C-NGT, TC-C-NGC, and TC-C-NGB (center girder); and TC-C-SGT, TC-C-SGC, and TCC-SGB (south exterior girder). At each of the instrumented PC girder cross sections, thermocouples were embedded into the top flange, web, and bottom flanges of the girders, as shown in Figure 3.8.
25

Table 3.5. Thermocouple locations
Instrument code Member Location
TC-E-S1 East end of the slab See Fig. 3.7 TC-E-S2 East end of the slab See Fig. 3.7 TC-E-S3 East end of the slab See Fig. 3.7 TC-E-S4 East end of the slab See Fig. 3.7 TC-E-SPNL East abutment Same location as SP-E-NL TC-E-SPCL East abutment Same location as SP-E-CL TC-E-SPSL East abutment Same location as SP-E-SL TC-E-SPNT East abutment Same location as SP-E-NT TC-E-SPST East abutment Same location as SP-E-ST TC-M-S1 Mid-span of the slab See Fig. 3.7 TC-M-S2 Mid-span of the slab See Fig. 3.7 TC-M-S3 Mid-span of the slab See Fig. 3.7 TC-M-S4 Mid-span of the slab See Fig. 3.7 TC-C-NGT North girder Top flange TC-C-NGC North girder Mid-height TC-C-NGB North girder Bottom flange TC-C-CGT Center girder Top flange TC-C-CGC Center girder Mid-height TC-C-CGB Center girder Bottom flange TC-C-SGT South girder Top flange TC-C-SGC South girder Mid-height TC-C-SGB South girder Bottom flange TC-W-S1 West end of the slab See Fig. 3.7 TC-W-S2 West end of the slab See Fig. 3.7 TC-W-S3 West end of the slab See Fig. 3.7 TC-W-S4 West end of the slab See Fig. 3.7 TC-W-SPCL West abutment Same location as SP-W-CLT TC-W-SPNT West abutment Same location as SP-W-NT
26

Figure 3.7. Thermocouples locations for the bridge superstructure
7.5 in. (nom.)
20 in.
6 in. 1 in.
31.5 in.
RC deck
7 in.
7.5 in.
8 in.
22 in.
Figure 3.8. Thermocouples locations within a PC girder
27

To monitor the air temperatures adjacent to and at the mid-length of the displacement transducers’ steel extension wires, 8 of the 28 thermocouples (gages TC-E-SPNL, TC-E-SPCL, TC-E-SPSL, TCE-SPNT, TC-E-SPST, TC-W-SPCLT, TC-W-SPCLB, and TC-W-SPNT), whose locations are shown in Figure 3.9, were installed within the wooden boxes that enclosed the displacement transducers. The temperature changes for these extension wires were used to correct the abutment displacements for temperature effects, as described in Section 3.6.
Figure 3.9. Thermocouples locations inside wooden boxes to monitor the steel wire of the displacement transducers
3.5. Data Acquisition
Data were acquired using data loggers and peripherals that were manufactured by Campbell Scientific, Inc. A CR10X data logger provided the excitation voltage for the instrumentation devices and recorded the voltage output from each of the devices for the bridge. The data were initially stored in the memory of the data logger until the data were downloaded to a laptop computer. A modem (Model COM 200) was used to communicate with the data logger at the bridge site from an office in the Town Engineering Building on the ISU campus. Additionally, data were directly downloaded to a laptop computer when the ISU researchers were at the bridge site. Multiplexers (Model AM416) were used to increase the number of instrumentation devices that were interfaced with the CR10X data logger.
3.5.1. Equipment
Three multiplexers were bolted into one electrical box that was attached to the west face of the east abutment backwall near the north face of the center PC girder. The data logger and another three multiplexers were bolted into another electrical box that was attached to the east face of the
28

west abutment backwall near the north face of the center PC girder. A vibrating wire sensor interface (Model AVW1) provided excitation voltage and measured frequency changes and, hence, strain changes in the vibrating wire strain gages.
3.5.2. Data Collection Interval and Initial Data Reduction
Since daily temperature variations occur more quickly than seasonal temperature variations, temperature measurements were frequently recorded. For the Tama County Bridge, all instrumentation readings were recorded at 30-minute intervals between August 31, 2000, and May 14, 2001, and at two-hour intervals between May 15, 2001, and November 30, 2001. To facilitate the analysis and graphical presentation of the measured data, the volume of data was reduced by reporting data at two-hour-time intervals.
Each time data were collected, the data logger recorded six readings for each instrumentation device. Rather than computing a simple average of the six recorded data values for each instrumentation device, an algorithm was developed to retain the most reliable data and eliminate data that may have been recorded when vehicles were on the bridge. The algorithm used two criteria for determining an acceptable range of data values. For the first criterion, an outlying value for the data was defined as a data point that was greater than one standard deviation away from the mean value of the six measured values. For a normal distribution of data, this criterion would imply that 32% of the six measured values (i.e., two values) should be discarded. The second criterion was based on the median of the six measured values. If the standard deviation of a set of six data values was small and the first criterion would eliminate good data, the putative outliers (data more than one standard deviation away from the mean value) were not eliminated unless the magnitude of the suspected outlying data was more than a fixed amount away from the median value. The limits of acceptable deviations from the median value were different for each type of instrumentation device: 0.0015 in. for the displacement transducers, 7.5 microstrains for the strain gages, and 0.36ºF for the thermocouples. These deviation values were based on the expected repeatability of the instrumentation measurements. After the filtering algorithm had discarded the unreliable data, the mean value of the remaining data values was selected as the representative instrumentation reading.
3.6. Temperature Corrections for the Instrumentation Devices
Since the instrumentation devices were subjected to the same temperatures as the bridge component to which they were attached, temperature corrections were made for the strain and displacement data.
3.6.1. Corrections for the Displacement Transducers
Laboratory tests by Kirkpatrick (1997) showed that a displacement transducer is essentially insensitive to temperature changes. However, the steel extension wire used to connect the wire for the displacement transducer to the bridge experiences a change in its length, Lwire, when a
29

change occurrs in the temperature of that wire. The change in the length, ΔLwire, of an extension wire due to a change in the temperature, ΔTwire, of the wire is given by equation 3.1:
ΔLwire = αwire(ΔTwire)Lwire (3.1)
where, αwire is the coefficient of thermal expansion and contraction of the wire (αwire = 6.33x10⁻⁶ in./in./ºF, as specified by the wire manufacturer). The ISU researchers included the change in the wire length in the displacement transducer measurement to obtain the temperature-corrected displacement.
3.6.2. Corrections for the Vibrating Wire Strain Gages
Each vibrating wire strain gage has a built-in thermistor to measure the temperature of the vibrating wire within the strain gage. The specified coefficient of thermal expansion and contraction (α coefficient) for the strain gage is 6.4x10⁻⁶ in./in./ºF. Since this magnitude for the α coefficient for the strain gage is approximately the same as that for the concrete in the PC piles, correction factors for temperature effects that are caused by differential expansion and contraction between the gage and the structural member were considered negligible. Therefore, the ISU researchers did not apply any strain corrections for the small differences in the α coefficients for a PC pile and a strain gage.
If a vibrating wire gage is subject to a change in temperature, the length of the vibrating wire and hence the natural frequency of vibration for the wire will change without necessarily causing a directly associated expansion or contraction between the mounting blocks for the gage. To compensate for temperature effects on the frequency of vibration for a vibrating wire strain gage, a fourth-order polynomial expression provided by the gage manufacturer was used in the program software that was written by the ISU research team for the CR10X data logger. Therefore, the strains measured by this type of a strain gage were corrected for the effects of temperature changes of the gage.
30

4. EXPERIMENTAL RESULTS AND THEIR INTERPRETATION
4.1. Data Filters and Interpretation Problems
The Tama County Bridge was monitored from August 31, 2000, to November 30, 2001. During the 15 months of data collection, there were brief periods of time when data were not recorded. The ISU researchers suspect that an electrical failure occurred during those times. The ISU research team also experienced some problems with the data file storage for some of the experimental data from the Tama County Bridge. A malfunction of the computer hard drive that was used to store the experimental data caused a loss of some of the recorded data. Even though a considerable amount of time and effort was expended by the ISU research team in an attempt to recover the original data, some of the computer files could not be restored.
Occasionally, some of the collected data had magnitudes that were well beyond the trend for other data points that were recorded immediately prior to or after the questionable data points. The initial data reduction process presented in Chapter 3 was used to eliminate many of these outlying data points. Suspected problems encountered with some of the instrumentation devices included water and moisture infiltration. All of the collected displacement and strain data are presented with respect to a relative zero value that was set on April 19, 2001.
4.1.1. Thermocouples
Since thermocouples measure absolute temperatures, the raw data were presented with only limited modifications. For a few isolated cases, the ISU researchers suspected that some of the electrical connections may have been compromised by moisture penetration that produced obviously inaccurate data records. Each thermocouple reading was plotted versus time to determine whether the thermocouple was properly functioning. Obvious outlying data points were eliminated from these records. These outlying points occurred only very sporadically, and discrete jumps were not encountered within the temperature data. The recorded thermocouple data was relatively easy to filter. Either the sensor worked and produced reliable temperatures over time (within an expected temperature range and fluctuating pattern) or did not work and produced temperature readings outside of the expected range. The dark and light shaded cells shown in Table 4.1 indicate the months during which all (dark shading) and some (light shading) of the data were considered to be reliable for each of the thermocouple transducers for the Tama County Bridge. The unshaded cells shown in Table 4.1 indicate the months during which all of the data were considered to be unreliable for each of the thermocouple transducers.
31

Table 4.1. Reliability of the thermocouple data for the Tama County Bridge
Location Instrument 2000 2001
Code S O N D J F M A M J J A S O N D TC-E-S1
TC-E-S2
TC-E-S3
TC-E-S4
TC-C-S1
TC-C-S2
TC-C-S3
TC-C-S4
TC-W-S1
TC-W-S2
TC-W-S3
Sla
b T
herm
ocou
ples
TC-W-S4
TC-E-SPNL
TC-E-SPCL
TC-E-SPSL
TC-E-SPNT
TC-E-SPST
TC-W-SPCLT
TC-W-SPCLB DC
DT
The
rmoc
oupl
es
TC-W-SPNT
TC-C-NGT
TC-C-NGC
TC-C-NGB
TC-C-CGT
TC-C-CGC
TC-C-CGB
TC-C-SGT
TC-C-SGC Gir
der
The
rmoc
oupl
es
TC-C-SGB
denotes that all data were considered reliable for the month
denotes that some data were considered reliable for the month
denotes that none of the data were considered reliable for the month
4.1.2. Displacement Transducers
During the interpretation of the data for the displacement transducers, the ISU researchers discovered that three of these instrumentation devices had been incorrectly labeled for recording the field data at the Tama County Bridge. The errors in the labeling for the displacement transducer data were resolved by comparative studies between these mislabeled displacement records and properly labeled and reliable displacement data records for some of the other
32

instrumentation devices, as well as by recognizing that the displacements for an abutment in the longitudinal direction of a 110 ft. long, single-span, integral abutment bridge with a 20° skew will be significantly larger than the displacements for that same abutment in the transverse direction of the bridge. The corrected transducer data are presented in this report.
Data from each of the displacement transducers were plotted versus time to determine whether these gages were properly functioning. These displacement plots were compared to the plots of the average temperature for the bridge superstructure to verify that the recorded displacements correlated with temperature changes. Faulty displacement measurements included a sudden change in the magnitude of a displacement or a noticeable drifting over time of a displacement measurement that did not correlate with changes in the average temperature for the bridge superstructure. After an apparent shift in a monitored displacement, the displacement data were considered to be reliable if the displacements that were measured by the affected transducer correlated with the change in the average bridge temperature. A new temperature cycle was started for that monitored displacement, since the absolute displacement was not continuous across a shift in the displacement. An experimental displacement range was determined for each time period over which a displacement transducer was continuously producing reliable data.
Displacements that continuously increased or decreased with time and did not correlate with changes in temperature indicated a drift in the measured displacement. A displacement drift occurred if a transducer malfunctioned or if a component of the movement for a benchmark post that supported that transducer occurred in a direction that was parallel to the direction of the monitored displacement. The dark and light shaded cells shown in Table 4.2 indicate the months during which all (dark shading) and some (light shading) of the data were considered to be reliable for each of the displacement transducers for the Tama County Bridge. The unshaded cells shown in Table 4.2 indicate the months during which all of the data were considered to be unreliable for each of the displacement transducers.
Table 4.2. Reliability of the displacement transducer data for the Tama County Bridge
Location Instrument 2000 2001
Code S O N D J F M A M J J A S O N D
SP-E-NL
SP-E-CL
SP-E-SL
SP-E-NT
Eas
t Abu
tmen
t
SP-E-ST
SP-W-CLT
SP-W-CLB
Wes
tA
butm
ent
SP-W-NT
denotes that all data were considered reliable for the month
denotes that some data were considered reliable for the month
denotes that none of the data were considered reliable for the month
33

4.1.3. Pile Strain Gages
While interpreting the data for the strain gages, the ISU researchers discovered that two of these instrumentation devices had been incorrectly labeled for recording the field data at the Tama County Bridge. The errors in the labeling of the strain gages were resolved by comparative studies between these mislabeled strain records and properly labeled and reliable data records for some of the other instrumentation devices.
The strain gages on the abutment piles required a more in-depth filtering process to determine their reliability than the other instrumentation devices because the vibrating wire strain gages had a higher rate of failure than the other instrumentation devices. For each strain gage, the recorded strain measurements at a particular location on a monitored pile were plotted versus time. For each strain gage, the reliability of the strain data was qualitatively evaluated by visual observation of the strain history graphs. The ISU researchers compared these strain history graphs to the displacement history graphs for the abutment that was supported by the associated pile to determine whether the monitored pile strains correlated with the abutment displacement along the longitudinal direction of the bridge.
Problems that were encountered with a significant number of the strain gages for the piles included abrupt changes in the strain magnitudes and gradual changes in strain magnitude over time that were not attributed to any behavioral response from the bridge. The ISU researchers were unable to determine the cause of the compromised or corrupted strain measurements. An example of one of the reliable strain data records was for gage VW-E-NWT, which is shown in Figure 4.1. For this gage, the measured strain data exhibits nearly a continuous trace from September 2000 to October 2001. Only a slight offset in the strain data occurred in June 2001 and in July 2001. In contrast, an example of one of the unreliable strain gage records was for gage VW-E-SWT, which is shown in Figure 4.2. The data record for this gage is not reliable for even a brief period of time. When the ISU researchers determined that a particular strain gage record was not accurate, that particular data were not used in evaluating the performance of the abutment piles. However, in a few cases where a pile strain record was not reliable for the entire monitoring period, some conclusions regarding the performance of an abutment pile were made for those isolated periods of time when the strain data appeared to be reasonable. The dark and light shaded cells shown in Table 4.3 indicate the months during which all (dark shading) and some (light shading) of the data were considered to be reliable for each of the strain gages that were used to measure pile strains for the Tama County Bridge. The unshaded cells shown in Table 4.3 indicate the months during which all of the data were considered to be unreliable for each of the pile strain gages.
34
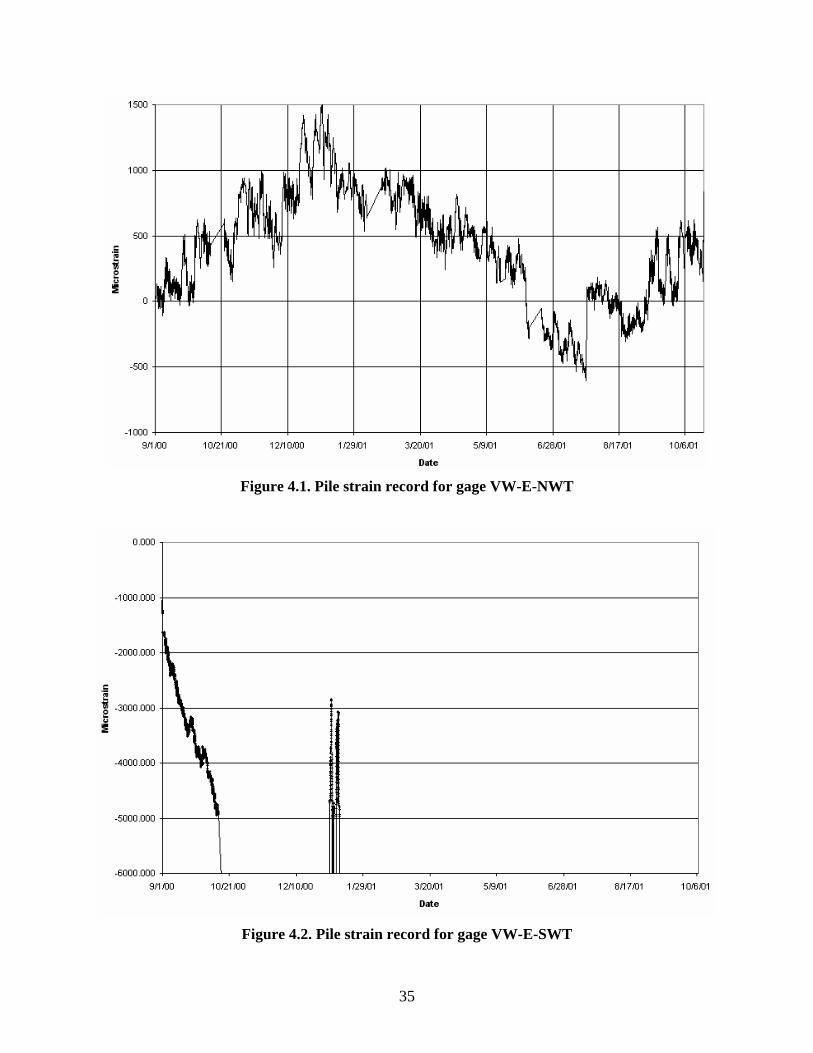
Figure 4.1. Pile strain record for gage VW-E-NWT
Figure 4.2. Pile strain record for gage VW-E-SWT
35

Table 4.3. Reliability of the pile strain gage data for the Tama County Bridge
Location Instrument
Code
2000 2001
S O N D J F M A M J J A S O N D
Eas
t Abu
tmen
t Sen
sors
VW-E-NET
VW-E-SET
VW-E-SWT
VW-E-NWT
VW-E-NEB
VW-E-SEB
VW-E-SWB
VW-E-NWB
Wes
t Abu
tmen
t Sen
sors
VW-W-NET
VW-W-SET
VW-W-SWT
VW-W-NWT
VW-W-NEB
VW-W-SEB
VW-W-SWB
VW-W-NWB
denotes that all data were considered reliable for the month
denotes that some data were considered reliable for the month
denotes that none of the data were considered reliable for the month
4.2. Bridge Temperatures
Bridge superstructure temperatures were measured using 21 thermocouples that were installed in the RC deck and PC girders. The data collected from these thermocouples were analyzed and used to establish an average temperature for the bridge superstructure, as well as the thermal gradients within the superstructure.
4.2.1. Average Bridge Temperatures
An average temperature for the superstructure of the Tama County Bridge was calculated as a weighted average of the temperatures that were measured by the embedded thermocouples located at the mid-span of the bridge. Figure 4.3 shows a partial cross section of a bridge superstructure that has one bridge girder and a portion of the bridge slab. Each of the three temperature-monitored PC girders was divided into three regions that included the top flange, web, and bottom flange. The width of the RC deck was divided into four regions. Each of the exterior deck regions were monitored by thermocouples TC-M-S1 and TC-M-S4, and each of the interior deck regions were monitored by thermocouples TC-M-S2 and TC-M-S3. A uniform temperature was assumed to exist within each of the temperature-monitored regions at the mid-span of the superstructure.
36
Figure 4.3. Temperature regions for a partial cross section of a bridge (not to scale)
The average mid-span bridge temperature, Tave, was calculated as follows:
∑ nT A
Tave = j=1
n
j j
(4.1) ∑ A jj=1
where, Tj is the temperature that was measured by a thermocouple in the jth region of the mid-span cross section for the bridge superstructure, Aj is the area of that particular region, and n is the number of regions in the mid-span cross section for the bridge superstructure. (For the Tama County Bridge, n was equal to 13.) A plot of the average bridge temperature versus time for the Tama County Bridge is presented in Figure 4.4. An absolute maximum and minimum bridge temperature of about -10°F and 89°F, respectively, were recorded during the monitoring period. The maximum average bridge temperature of about 89°F occurred in the early evening hours of July 22, 2001. The minimum average bridge temperature of about -10°F occurred at 2:30 a.m. on January 8, 2001.
37

Tem
per
ature
(D
egre
es F
) 100.0
80.0
60.0
40.0
20.0
0.0
-20.0 08/22/00 10/21/00 12/20/00 02/18/01 04/19/01 06/18/01 08/17/01 10/16/01 12/15/01
Figure 4.4. Average superstructure temperature for the Tama County Bridge
4.2.2. Transverse and Longitudinal Temperature Gradients for the Slab
Figure 4.5 presents the transverse slab temperature distribution at the times of both the maximum and minimum average bridge temperatures. Temperatures varied by as much as about 20°F across the transverse bridge cross section. The thermocouples located near the west end of the bridge and at the mid-span recorded nearly the same temperatures during both hot and cold ambient temperature conditions. However, the thermocouples near the east end of the bridge recorded temperatures about 10°F to 12°F warmer at the time of the minimum average bridge temperature and 18°F to 20°F cooler during the time of the maximum average bridge temperature. A few possible explanations can be offered for this temperature differential. The most likely explanation for this condition is the method of installation used for the thermocouples. Each thermocouple was installed by drilling a small-diameter hole from the bottom of the deck, inserting the thermocouple, and filling the hole with grout. A slight difference in the depth of the thermocouple within the deck can have a significant impact on the recorded temperature. A second possible explanation for this temperature difference is the presence of an undocumented source of groundwater near the east abutment. Groundwater, which remains near 60°F year-round, would tend to reduce bridge temperature extremes during both hot and cold weather conditions.
38

Figure 4.5. Transverse slab temperature distribution at times of maximum and minimum average bridge temperature
4.2.3. Vertical Temperature Gradients of the Slab/Girder
Article 3.12.3 in the AASHTO LRFD Specifications (2004) provides a method for establishing the temperature gradients through the depth of a PC-girder bridge superstructure, as shown in Figure 4.6. This process defines relative temperatures, T1, T2, and T3 at three points within the depth of the superstructure. These values have been established for four solar radiation zones in the United States; however, only those values applicable to Iowa bridges are presented herein. For warm weather conditions, temperature T1, which occurs at the top of the slab, shall be taken as 46°F and temperature T2, which occurs 4 in. below the top surface of the slab, shall be taken as 12°F. Temperature T3, which occurs at the bottom surface of the PC bridge girders, shall be equal to zero, unless a site-specific study is performed, and in any case shall not exceed not exceed 5°F. In accordance with the AASHTO specifications, dimension A may be set equal to 12 in. for typical PC girder bridges similar to the Tama County Bridge. For cold weather conditions, the AASHTO specification states that the temperatures for T1 and T2 shall be taken as -14°F and -4°F, respectively. These temperatures given by the AASHTO specifications are not absolute temperatures, but rather differential temperatures between elements of the bridge superstructure.
39
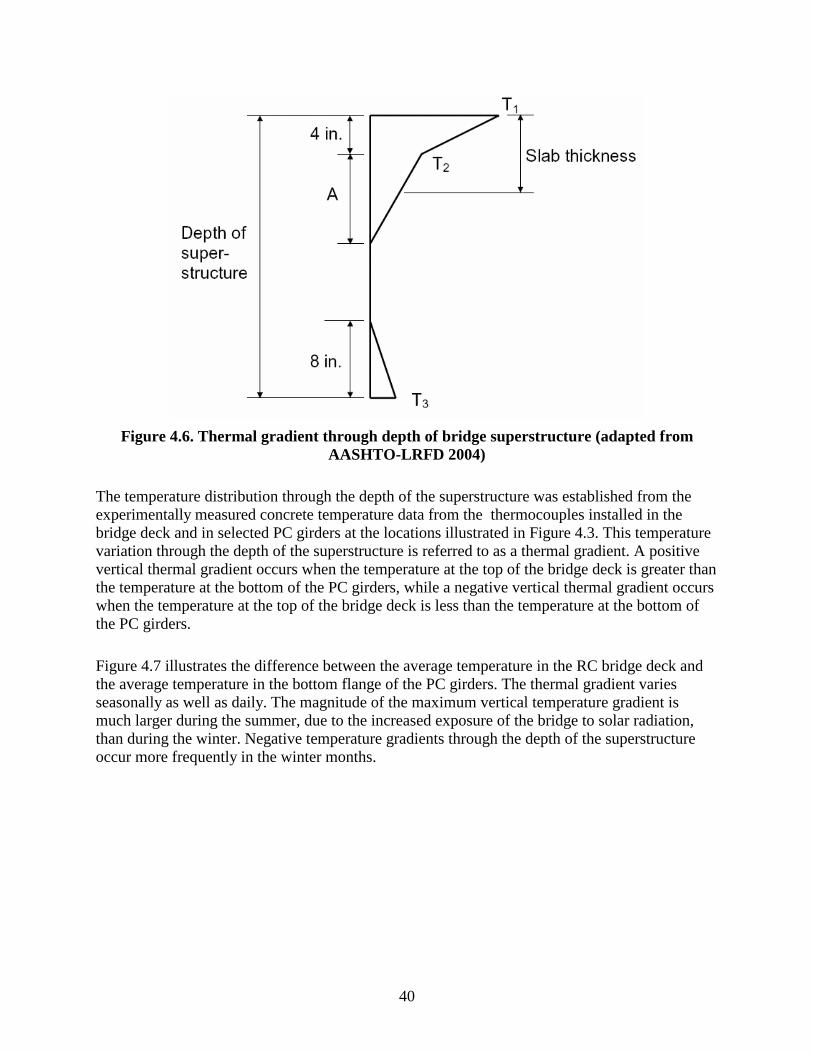
Figure 4.6. Thermal gradient through depth of bridge superstructure (adapted fromAASHTO-LRFD 2004)
The temperature distribution through the depth of the superstructure was established from the experimentally measured concrete temperature data from the thermocouples installed in the bridge deck and in selected PC girders at the locations illustrated in Figure 4.3. This temperature variation through the depth of the superstructure is referred to as a thermal gradient. A positive vertical thermal gradient occurs when the temperature at the top of the bridge deck is greater than the temperature at the bottom of the PC girders, while a negative vertical thermal gradient occurs when the temperature at the top of the bridge deck is less than the temperature at the bottom of the PC girders.
Figure 4.7 illustrates the difference between the average temperature in the RC bridge deck and the average temperature in the bottom flange of the PC girders. The thermal gradient varies seasonally as well as daily. The magnitude of the maximum vertical temperature gradient is much larger during the summer, due to the increased exposure of the bridge to solar radiation, than during the winter. Negative temperature gradients through the depth of the superstructure occur more frequently in the winter months.
40

20.0
30.0
40.0 T
emp
erat
ure
(D
egre
es F
)
10.0
0.0
-10.0
-20.0 08/22/00 10/21/00 12/20/00 02/18/01 04/19/01 06/18/01 08/17/01 10/16/01 12/15/01
Figure 4.7. Difference between average temperature in the RC bridge deck and in the PC girder bottom flange
Using the temperature measurements recorded in the top flange, web, and bottom flange of the PC girders, best-fit linear thermal gradients for the girders were established for each of the instrumented cross sections. The temperature at the top and bottom of the PC girders was calculated using a linear extrapolation of the temperature gradient in the girder. The temperature at the bottom of the slab was assumed to be the same as the extrapolated temperature at the top of the PC girder. The temperature at the top of the deck was established by a linear extrapolation of the calculated temperature at the bottom of the deck and the temperature at the mid-thickness of the deck. The resulting linear temperature gradients for the RC bridge deck and PC girders produced bi-linear vertical temperature gradients for the depth of the bridge superstructure.
Figure 4.8 presents the experimentally based vertical temperature gradients for both the coldest day and hottest day at the Tama County Bridge, as well as those temperature gradients given in the AASHTO Specifications (2004). The AASHTO temperature gradients are shown as the dotted tri-linear lines in the figure. The experimentally based vertical temperature gradient recorded for the coldest day is similar to that recommended by the AASHTO Specifications (2004).
41

Figure 4.8. Vertical temperature distribution of the superstructure at times of minimum and maximum average bridge temperature
For the hottest day at the Tama County Bridge, a wide variability occurred in the recorded temperatures. Therefore, an experimentally based vertical temperature gradient was not established for the hottest day. Based on the data presented in Figure 4.8, the ISU researchers expected that a conservative design would result from the use of the AASHTO recommended thermal gradients for both hot-weather and cold-weather conditions.
4.3. Bridge Displacements
Longitudinal and transverse displacements of the east and west abutments and the rotations in a horizontal plane for the east abutment were established from the measured displacements at several locations on the pile caps for the abutments of the Tama County Bridge.
4.3.1. Abutment Longitudinal Displacements and Changes in Bridge Length
As discussed in Chapter 3, longitudinal displacements measured parallel to the longitudinal axis of the bridge were monitored at the east and west abutments of the Tama County Bridge. At the east abutment, these displacements were measured at each end and at the mid-width of this abutment. At the west abutment, these displacements were measured only at the mid-width of this abutment. At the east abutment, the longitudinal displacements measured at the three
42
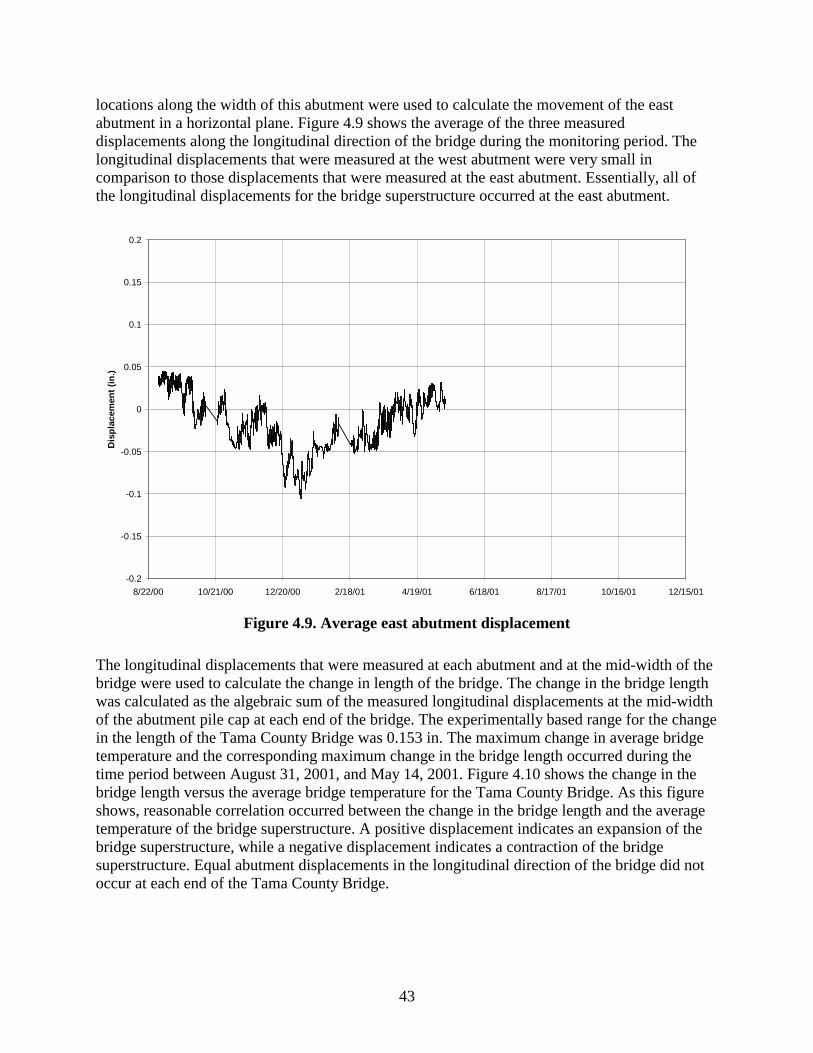
Dis
pla
cem
ent
(in
.)
locations along the width of this abutment were used to calculate the movement of the east abutment in a horizontal plane. Figure 4.9 shows the average of the three measured displacements along the longitudinal direction of the bridge during the monitoring period. The longitudinal displacements that were measured at the west abutment were very small in comparison to those displacements that were measured at the east abutment. Essentially, all of the longitudinal displacements for the bridge superstructure occurred at the east abutment.
0.2
0.15
0.1
0.05
0
-0.05
-0.1
-0.15
-0.2
8/22/00 10/21/00 12/20/00 2/18/01 4/19/01 6/18/01 8/17/01 10/16/01 12/15/01
Figure 4.9. Average east abutment displacement
The longitudinal displacements that were measured at each abutment and at the mid-width of the bridge were used to calculate the change in length of the bridge. The change in the bridge length was calculated as the algebraic sum of the measured longitudinal displacements at the mid-width of the abutment pile cap at each end of the bridge. The experimentally based range for the change in the length of the Tama County Bridge was 0.153 in. The maximum change in average bridge temperature and the corresponding maximum change in the bridge length occurred during the time period between August 31, 2001, and May 14, 2001. Figure 4.10 shows the change in the bridge length versus the average bridge temperature for the Tama County Bridge. As this figure shows, reasonable correlation occurred between the change in the bridge length and the average temperature of the bridge superstructure. A positive displacement indicates an expansion of the bridge superstructure, while a negative displacement indicates a contraction of the bridge superstructure. Equal abutment displacements in the longitudinal direction of the bridge did not occur at each end of the Tama County Bridge.
43

Ch
ang
e in
Bri
dg
e L
eng
th (
in.)
0.060
0.040
0.020
0.000
-0.020
-0.040
-0.060
-0.080
-0.100
-0.120 -20.0 0.0 20.0 40.0 60.0 80.0 100.0
Average Superstructure Temperature (Degrees F)
Figure 4.10. Change in bridge length versus average superstructure temperature
Since the bridge is a single-span bridge and the soil backfill behind each abutment appeared to be the same, other factors must account for the difference in the movements for each of the bridge abutments. Factors that may affect the stiffness of the soil backfill include the soil type, compaction, and moisture content. Additionally, the geometric configuration of a bridge can affect the longitudinal displacements that occur at each of the bridge abutments. The vertical alignment of the roadway at the Tama County Bridge placed the bridge on a concave-downward vertical curve with the tie-in elevations at the west and east abutment of 339.16 ft. and 333.81 ft., respectively. A vertical drop of 4.25 in. exists between the west and east abutments for this 110 ft. long bridge; therefore, the bridge is pitched towards the east abutment, where essentially all of the longitudinal displacements occurred for this bridge. Even though the difference in the end elevations for the bridge was not very large, this elevation difference can have an effect on the location where the majority of the longitudinal expansion and contraction occurs for the bridge superstructure.
4.3.2. West Abutment Rotation through Differential Displacements
A pair of post-mounted transducers was used to measure the longitudinal displacement and rotation during thermal expansion and contraction cycles of the Tama County Bridge. Transducers SP-W-CLT and SP-W-CLB were mounted on the east face of the west abutment, at points that were near the center pile and at 3 in. below the top and 3 in. above the bottom of the pile cap, respectively. The relative difference between these measured longitudinal displacements was used to indicate whether the abutment cap was experiencing a rotation in a vertical plane that
44

Dis
pla
cem
ent
(in
.)
was parallel to the longitudinal axis of the bridge. A measured displacement at the top transducer that is greater than that recorded by the bottom transducer at the same instant indicates an abutment rotation “away” from the bridge span. If the measured displacements are equal, the abutment is horizontally translating, without any rotation in a vertical plane. Figure 4.11 presents the differential longitudinal displacement (the top transducer displacement [SP-W-CLT] minus the bottom transducer displacement [SP-W-CLB]) for the west abutment of the Tama County Bridge.
0.01
0.005
0
-0.005
-0.01 8/22/00 10/21/00 12/20/00 2/18/01 4/19/01 6/18/01 8/17/01 10/16/01 12/15/01
Figure 4.11. Differential longitudinal displacement, top and bottom of west abutment
4.3.3. Abutment Transverse Displacements
Post-mounted transducers were used to measure the transverse displacement at each end of the east abutment pile cap and at the north end of the west abutment cap. Records for these displacement transducers appear accurate through July 23, 2001, so conclusions will be based strictly on this time period. Displacement measurements at each end of an abutment were necessary because the change in position of the ends of an abutment is a combination of two effects: (1) the temperature-dependant volumetric expansion or contraction of concrete in the pile cap and abutment, and (2) the rigid-body translation and rotation of the abutment due to the longitudinal expansion or contraction of the superstructure for a skewed integral abutment bridge.
To determine the magnitude for the transverse expansion or contraction of an abutment, the ISU researchers assumed that a uniform thermal expansion or contraction of an abutment occurred along the width of the abutment. The change in the length of an abutment was equal to the
45

Dis
pla
cem
ent
(in
)algebraic sum of the horizontal displacements measured at each end of the abutment. The horizontal displacement in the transverse direction of the bridge for the center of gravity of the east abutment pile cap was calculated as one-half of the algebraic difference in these measured horizontal displacements at each end of the abutment. Figure 4.12 shows the transverse displacements over time for the center of gravity for the east abutment pile cap for the Tama County Bridge. Positive displacements are directed towards the north, and negative displacements are directed towards the south. Between the end of August 2000 and the middle of May 2001, the range in the transverse displacement for this abutment was only about 0.04 in.
0.05
0.04
0.03
0.02
0.01
0
-0.01
-0.02
-0.03
-0.04
-0.05 8/22/00 10/21/00 12/20/00 2/18/01 4/19/01 6/18/01 8/17/01 10/16/01 12/15/01
Figure 4.12. Measured transverse displacement, center of the east abutment
4.4. PC Pile Behavior
4.4.1. Reliability of Strain Data
The reliability of strain data recorded at the Tama County Bridge varied widely throughout the monitoring period, as described in Section 4.1.3. In some cases, the strain data appears very consistent over the duration of the monitoring period. Figure 4.13 plots the strain data for gage WV-E-NWT, which functioned properly throughout the monitoring period. Although pile strain magnitudes appear larger than anticipated, due to the problems described in Chapter 3, the qualitative results were still considered useful.
46

1500
1000
500
Mic
rost
rain
0
-500
-1000 9/1/00 10/21/00 12/10/00 1/29/01 3/20/01 5/9/01 6/28/01 8/17/01 10/6/01
Figure 4.13. Strain record for gage VW-E-NWT
Additionally, a number of strain gages functioned properly over only some portion of the monitoring period. For these types of pile strain records, some insight into the behavior of the pile was established by investigating the regions of the pile strain record that have continuous and reliable strain data. Figure 4.14 shows the strain record for gage VW-E-NWB, which was considered to be reliable for some portion of the monitoring period. Although there are large discontinuities in the strain record, there are regions that are piecewise continuous and offer some very useful information.
47

Figure 4.14. Strain record for gage VW-E-NWB
4.4.2. Pile Strain Records
The strain record for gage VW-E-NWB can be divided into two discrete time periods: region A, which occurred from September 1 to October 21, 2000, and region B, which occurred from October 29 to December 12, 2000. Each of these periods is shown in Figure 4.14 by the dimensions A and B, respectively. During each of these time periods, the strain record was considered to be reliable.
Similar piecewise continuity can be observed when the same strain record is plotted with respect to the east abutment longitudinal displacement, as in Figure 4.15. For this figure, the pile strain at gage VW-E-NWB is plotted versus the longitudinal displacement that was measured by the transducer SP-E-SL. During the time periods from September 1 to October 12, 2000, and from October 29 to December 12, 2000, the pile strain versus the displacement record can be plotted in very regular bands that occur along the regions labeled by the dimensions A and B in the figure. Clearly, during the region A and B time periods, the pile strain is linearly related to longitudinal displacement.
48

Figure 4.15. Strain gage VW-E-NWB vs. longitudinal displacement SP-E-SL
The source of the discontinuity in the pile strain data that occurred between October 12 and October 29, 2000, is not clear, but it may have been caused by cracking of the PC pile or an instrument malfunction. The offset in the longitudinal displacement during this intervening period is most likely caused by a decrease in overall bridge temperature, which caused bridge shortening.
Further evidence of the discontinuity between the region A and B time periods is illustrated in Figures 4.16 and 4.17, in which the bending strains in the east abutment center pile are plotted for the top and bottom set of gages, respectively (i.e., the strain in gage VW-E-SET minus the strain in gage VW-E-NWT, and the strain in gage VW-E-SEB minus the strain in gage VW-ENWB, respectively). Both figures clearly show the discontinuity. Arguably, Figure 4.17 could indicate that region B could be further divided into time regions. Again, the discontinuity between the strain regions is probably caused by cracking of the PC pile or an instrument malfunction.
49

Figure 4.16. Flexural strain for gages VW-E-SET minus VW-E-NWT versus longitudinal displacement for SP-E-SL
Figure 4.17. Flexural strain for gages VW-E-SEB minus VW-E-NWB versus longitudinal displacement for SP-E-SL
50

As indicated in Figures 4.16 and 4.17, there is a positive slope relationship between the pile bending strain and the longitudinal displacement at both the top and bottom gage locations. A positive slope for the pile bending strain indicates that the gages VW-E-SET and VW-E-SEB measured tension strains as the bridge expanded. In other words, the east side of the east center pile experiences tension strains as the bridge expands toward the east.
4.4.3. Pile End Condition
To permit rotation to occur in a vertical plane between the top of the abutment piles and the abutment pile cap that would produce a pinned-end condition at the top of the abutment piles, the designer for the Tama County Bridge specified in the bridge contract drawings that the tops of the abutment piles be wrapped with “a double thickness of rug padding.” An excerpt from the bridge plan drawings that presented this detail is shown in Figure 4.18.
Figure 4.18. Excerpt from bridge contract plans showing pile wrapping detail
This type of pile wrapping has been used in the past by a variety of bridge owners across the nation, but its effectiveness in creating a pinned end is debatable. To illustrate what happens when an expansion of the superstructure for the Tama County Bridge causes a displacement at the top of a PC pile for the east abutment, Figure 4.19 (a) presents sketches of the displaced shape and the shape of the bending moment diagram when the pile is modeled as a pinned-end
51

pile. The bending moment diagram is plotted on the compression side of the pile. For the upper portion of the pile length, the bridge expansion induces tensile strains on the western part of the pile cross section and compressive strains on the eastern part of the pile cross section. However, as illustrated in Figures 4.16 and 4.17, this type of a distribution for the flexural bending strains did not occur in the piles for the east abutment of the Tama County Bridge.
To illustrate what happens when an expansion of the superstructure for the Tama County Bridge causes a displacement at the top of a PC pile for the east abutment, Figure 4.19 (b) presents sketches of the displaced shape and the shape of the bending moment diagram when the pile is modeled as a fixed-head pile. Again, the bending moment diagram is plotted on the compression side of the pile. For the upper portion of the pile length, the bridge expansion induces compressive strains on the western part of the pile cross section and tensile strains on the eastern part of the pile cross section. This type of distribution for the flexural bending strains is consistent with the established bending strains shown in Figures 4.16 and 4.17.
Although definitive conclusions were not formulated from the pile strain plots described by the ISU researchers, they recommend that the tops of piles with carpet wrapping should not be assumed to be at a fully pinned-end condition in future design applications. As in most idealizations of structural behavior, the actual rotational restraint condition for the connection between an abutment pile and an abutment pile cap is somewhere between a fixed condition and a pinned condition.
52

Figure 4.19. Deflected shape and moment diagram for theoretical pile top conditions, east pile
4.4.4. Pile Cracking Investigation
The soil surrounding the instrumented east abutment pile was excavated after the monitoring period to document the condition of the pile and to locate any concrete cracks in the exposed face of the PC pile. Because the bridge was in service at the time of the investigation, only the front face of the pile could be exposed for observation. This excavation was performed in the fall season, when the average bridge temperature was not near its highest or lowest temperature.
53

After excavating the soil in front of the pile, the pile was carefully cleaned. Two significant horizontal cracks were observed in the front face of the pile. These cracks, which are described as upper and lower cracks, were located at 2 ft. 10 in. and 4 ft. 8 in., respectively, below the bottom of the pile cap for the east abutment. The location of these cracks are shown in Figure 4.20. The upper crack is located very near the bottom strain gages on the pile. Since these vibrating wire strain gages have a 6 in. long gage length between the monitoring brackets for the gages, the bottom strain gages may have straddled the crack.
Figure 4.20. Pile crack locations observed following monitoring period
The concrete cracks in the front face of the center pile for the east abutment of the Tama County Bridge were photographed. Figure 4.21 shows this face of the pile with the upper and lower concrete cracks highlighted by a black marking pen. Figures 4.22 (a) and 4.22 (b) show a close-up view of these upper and lower concrete cracks, respectively. These cracks were documented on October 23, 2004. Although the other faces of the pile were not exposed during the investigation, repeated cycles of expansion and contraction of the bridge superstructure has probably caused both of these concrete cracks to extend across all four face of the pile.
These photographs of the cracks are documented evidence of the cracking of this pile. This cracking is most likely the cause of the discontinuity between time regions A and B in the pile strain plots, which were illustrated in previous figures in this report.
54

Figure 4.21. East abutment center pile excavated for crack exploration
55

(a) Upper crack, located 2 ft. 10 in. below abutment
(b) Lower crack, located 4 ft. 8 in. below abutment
Figure 4.22. East abutment center pile cracking
56

Figure 4.23 graphs the bending strains at the top set of gages (from Figure 4.16) versus the bending strains at the bottom set of gages (from Figure 4.17). The abscission scale for the graph is strain measured by gage VW-E-SEB minus the strain measured by gage VW-E-NWB. The ordinate for the graph is the strain measured by gage VW-E-SET minus the strain measured by gage VW-E-NWT. Again, two time period regions of pile strain, indicated by dimensions A and B in Figure 4.23, are clearly evident. Further, one could identify two trend lines for the differences in the measured strains within both Regions A and B. These trend lines are labeled A1 and A2 and then B1 and B2, respectively. For trend line A1, the pile may be uncracked and the bending strain range at the top set of strain gages exceeds that at the bottom set of strain gages, which would be consistent with a rotationally restrained head, as shown in Figure 4.19(b). As the pile progresses through the various stages of cracking to result in the strain differences indicated by the trend in B2, the strain range at the bottom set of strain gages exceeds that at the top set of strain gages. An appropriate deflected shape and the shape of the curvature diagram (not moment) that corresponds with this observation are sketched in Figure 4.24. The curvature (and, hence, bending strains) would be higher in the cracked region.
A1
A2
B1
B2
Figure 4.23. Flexural strain for VW-E-SET minus VW-E-NWT versus flexural strain for VW-E-SEB minus VW-E-NWB
57

Cracked region
Figure 4.24. Deflected shape and curvature diagram for partially restrained pile head
58

5. SUMMARY AND CONCLUSIONS
The application of precast, prestressed concrete piles for the abutment piles of integral abutment bridges has not been widely publicized in the literature. There have been a few investigations, most notably by the University of Tennessee, but no widespread consensus on the behavior and long-term durability of these PC piles has been published in the reviewed literature. Moreover, the results of a survey of bridge owner agencies conducted as part of this study do not indicate a strong preference for this type of abutment construction.
The research presented in this report documents the first use of PC piles to support integral abutments in the State of Iowa. The subject bridge, located in Tama County, was constructed and opened to traffic in 2000. Following the bridge construction, a number of displacement sensors, strain gages, and thermocouples were installed on the bridge to monitor its behavior and help assess its long-term performance. The results of the instrumentation and monitoring of the subject bridge in Tama County are summarized as follows:
• The overall bridge movement occurred primarily at the east abutment. The magnitude of these longitudinal movements fell into the low end of the expected range of movements for a bridge of this length. The recorded longitudinal movement at the west abutment was negligible. The bridge rotates in plan view due to the effects of the abutment skew, as predicted in previous integral abutment monitoring projects.
• The recorded thermal gradients in the bridge deck and girders are in reasonable agreement with the published AASHTO guidelines. There were some interesting, and somewhat unexplainable, differences in the thermal data recorded at the east and west ends of the bridge. The installation techniques used for this network of thermocouple sensors may account for some of these differences.
• The effectiveness of the carpet wrap at the top of the abutment pile is debatable. The intent of this wrap, installed before the concrete is cast, is to reduce the rotational restraint at the tops of the abutment piles and consequently create a pinned type of connection between the piles and the pile cap. However, a review of the pile strain data did not reveal how much freedom of rotation is available for this type of connection with a PC pile. Therefore, the researchers recommend that the pile tops with carpet wrapping should not be assumed to be in a pinned-end condition for future design applications.
• The pile strain records for the center pile of the east abutment appear to indicate the formation of a crack in the PC pile sometime between October 12 and October 23, 2000. The strain records for gages located at two different locations along the pile length indicate a distinct change in behavior during this time period.
• Subsequent excavation of the center pile of the east abutment provided photographic evidence of the pile cracking. Because pile cracking may allow moisture penetration and subject the uncoated prestressing strands to long-term corrosion, the ISU researchers recommend periodic inspection of the abutment piles to detect any additional concrete cracking or deterioration.
59

6. REFERENCES
Abendroth, R. E. and L.F. Greimann, L. F. 2005. Field Testing of Integral Abutments. Iowa DOT Project HR-399. Ames, Iowa: Highway Division, Iowa Department of Transportation. CD-ROM.
AASHTO. 2004. LRFD Bridge Design Specifications. Washington, DC: American Association of State Highway and Transportation Officials.
Arsoy, S. and J.M. Duncan. 2002. Lateral Load Behavior of Piles Supporting Integral Bridges. Paper presented at the 81st Annual Meeting of the Transportation Research Board, Washington, DC. CD-ROM.
Arsoy, S., Ducan, J. M., and Barker, R. M. 2002. Performance of Piles Supporting Integral Bridges. Transportation Research Record, 1808, 162–167.
Burdette, E.G., S.C. Howard, E.E. Ingram, D.W. Goodpasture, and J.H. Deatherage. 2004a. Behavior of Prestressed Concrete Piles Supporting Integral Abutments. Proceedings of the 2004 Structures Congress: Building on the Past, Securing the Future. Washington, DC: American Society of Civil Engineers, 213–218.
Burdette, E.G., S.C. Howard, J.B. Tidwell, E.P. Wasserman, E.E. Ingram, J.H. Deatherage, and D.W. Goodpasture. 2004b. Lateral Load Tests on Prestressed Concrete Piles Supporting Integral Abutments. PCI Journal, 49(5), 70–77.
Deatherage, J.H., A.W. Eichelman, E.G. Burdette, and D.W. Goodpasture. 2003. The Effects of Integrated Exposed Prestressing Strands on the Behavior of Prestressed Concrete Piles in Integral Abutments. Paper presented at the 82nd Annual Meeting of the Transportation Research Board, Washington, DC.
FIP. 1986. Precast Concrete Piles. FIP Technical Report. Paris, France: Federation Internationale de la Precontrainte.
Harries, K.A. and M.F. Petrou. 2001. Behavior of Precast, Prestressed Concrete Pile to Cast-In-Place Pile Cap Connections. PCI Journal, 46(4), 82–92.
Huang, J., C.E. French, and C.K. Shield. 2004. Behavior of Concrete Integral Abutment Bridges. St. Paul, Minnesota: Minnesota Department of Transportation.
Joen, P.H. and R. Park. 1990. Simulated Seismic Load Tests on Prestressed Concrete Piles and Pile-Pile Cap Connections. PCI Journal, 35(6), 42–61.
Jorgenson, J.L. 1983. Behavior of Abutment Piles in an Integral Abutment in Response to Bridge Movement. Transportation Research Record, 903, 72–79.
Kamel, M.R., J.V. Benak, M.K. Tadros, and M. Jamshidi. 1996. Prestressed Concrete Piles in Jointless Bridges. PCI Journal, 41(2), 56–67.
Kirkpatrick, C. 1997. Instrumentation for Field Testing of Integral Abutment Bridges. M.S. Creative Component Report, Iowa State University, Ames, Iowa.
Lowe, D.L. 2002. Effect of Rotational Stiffness on the Behavior of Integral Abutments on Prestressed Concrete Piles. Knoxville, Tennessee: The University of Tennessee.
Mourad, S. and S.W. Tabsh. 1998. Pile Forces in Integral Abutment Bridges Subjected to Truck Loads. Transportation Research Record, 1633, 77–83.
PCI. 2001. The State of the Art of Precast/Prestressed Integral Bridges. Chicago, Illinois: Precast/Prestressed Concrete Institute.
PCI. 2004. Precast Prestressed Concrete Piles. Chicago, Illinois: Precast/Prestressed Concrete Institute.
Thippeswamy, H.K. and H.V.S. Gangarao. 1995. Analysis of In-Service Jointless Bridges. Transportation Research Record, 1476, 162–170.
60