an integrated perspective of the continuum between
TRANSCRIPT

nature geoscience | VOL 3 | SEPTEMBER 2010 | www.nature.com/naturegeoscience 599
Slow-slip phenomena refer to specific deformation modes that are observed seismically or geodetically. The variabil-ity of slow-slip phenomena reflects a suite of unique fault-
slip characteristics (Fig. 1). When faults slip at sufficiently fast velocities, dynamic forces become significant and seismic waves radiate. The energy carried at wavefronts can overcome frictional forces on locked sections of the fault, resulting in large displace-ments and ‘fast’ earthquakes1. Under some conditions the slip may not reach dynamic velocities, but low-amplitude, low-frequency seismic waves still radiate. These seismic slow signals have only recently been identified, facilitated by networks of high-sensitiv-ity surface and borehole seismometers that record continuously in the frequency band of ~0.001–100 Hz. Among these signals, the most commonly observed are weak continuous vibrations having no clear impulsive phases, known as deep ‘non-volcanic’ tremor2. Tremor often accompanies the aseismic events, with the coupled phenomena named ‘episodic tremor and slip’ (ETS)3.
A range of other seismic signals indicative of a spectrum of slow source durations and rupture speeds, and limited slip (rela-tive to earthquakes), have been classified as low-frequency earth-quakes (LFEs)4,5 and very low-frequency earthquakes (VLFs)6,7, with source durations of less than one second and a few tens of seconds, respectively (Figs 1 and 2). These weak seismic events have been observed in Japan2, Cascadia3, Central California8, Mexico9 and Costa Rica10 (Fig. 3). In several regions where tremor signals are well recorded, a significant fraction of the tremor signal seems to comprise superposed LFE waveforms10,11. This implies that tremor represents the chatter from tiny, distributed sources that radiate randomly. VLFs are found buried in tremor signals, further suggesting that occasionally LFEs coalesce into an organ-ized rupture that radiates seismic waves at a lower frequency12,13.
Aseismic signals reflect fault slip so slow that inertial forces and seismic radiation are negligible. The occurrence of such ‘quasi-static’ slow slip has been known for many years (for example, ref. 14), but its significance along plate boundaries was not recognized until
an integrated perspective of the continuum between earthquakes and slow-slip phenomenaZhigang Peng1* and Joan gomberg2
The discovery of slow-slip phenomena has revolutionized our understanding of how faults accommodate relative plate motions. Faults were previously thought to relieve stress either through continuous aseismic sliding, or as earthquakes resulting from instantaneous failure of locked faults. In contrast, slow-slip events proceed so slowly that slip is limited and only low-frequency (or no) seismic waves radiate. We find that slow-slip phenomena are not unique to the depths (tens of kilometres) of subduc-tion zone plate interfaces. They occur on faults in many settings, at numerous scales and owing to various loading processes, including landslides and glaciers. Taken together, the observations indicate that slowly slipping fault surfaces relax most of the accrued stresses through aseismic slip. Aseismic motion can trigger more rapid slip elsewhere on the fault that is sufficiently fast to generate seismic waves. The resulting radiation has characteristics ranging from those indicative of slow but seismic slip, to those typical of earthquakes. The mode of seismic slip depends on the inherent characteristics of the fault, such as the frictional properties. Slow-slip events have previously been classified as a distinct mode of fault slip compared with that seen in earthquakes. We conclude that instead, slip modes span a continuum and are of common occurrence.
plate-boundary-scale GPS networks became operational in continuous mode ~15 years ago15–17. Less abundant strainmeters and tiltmeters also measure aseismic transients, and with much greater resolution than GPS18.
The pervasiveness of slow-slip phenomena in plate boundary regions, the spontaneity and regularity with which they some-times occur, and some of the seismic signals they emit are new and exciting. However, some of the phenomena have been docu-mented for decades. Early seismological studies have shown that some earthquakes are relatively depleted of high frequencies19, reflecting source durations longer than expected from standard relationships20. These include slow, mostly shallow earthquakes on oceanic transform faults19,21 and in shallow sediments22, tsu-nami earthquakes23 and glacial earthquakes24.
Slow-slip phenomena have also been documented in the context of other, more familiar types of fault slip. Examples include after-shocks and afterslip, repeating earthquakes and creep, swarms and various types of aseismic deformation. Although driven by gravity instead of stresses resulting from relative plate motions, glaciers and landslides also share many commonalities with slow slip of tectonic origins.
slow-slip phenomena along tectonic plate boundary faults
When and where. The sources of the slow geodetic signals are gen-erally consistent with shear slip on the plate interface16,25 (Fig. 2). The locations of the slipping surface and the interface generally have uncertainties of several kilometres or more. Plate interfaces have been mapped using seismic imaging techniques, potential field methods, and high-resolution locations of earthquakes26,27.
The most well-constrained sources of seismic slow slip (LFEs) and plate boundary locations come from the Nankai subduction zone in southwest Japan. Here, the slow-slip sources coincide with the plate boundary26. LFE sources in the Cascadia sub-duction zone28 and along the San Andreas fault (SAF)29 system
1School of Earth and Atmospheric Sciences, Georgia Institute of Technology, 311 Ferst Drive, Atlanta, Georgia 30332, USA, 2Earthquake Hazards Program, US Geological Survey, Department of Earth and Space Sciences, University of Washington, Seattle, Washington DC 98195-1310, USA. *e-mail: [email protected]
review articlePublished online: 22 august 2010 | doi: 10.1038/ngeo940
ngeo_940_SEP10.indd 599 19/8/10 11:37:33
© 20 Macmillan Publishers Limited. All rights reserved10

600 nature geoscience | VOL 3 | SEPTEMBER 2010 | www.nature.com/naturegeoscience
transform boundary locate on the respective plate interfaces. A geographically broader study of LFEs in the subduction zones of Japan, Costa Rica and Cascadia also places sources on the plate interface, but samples only three-hour time windows10. Slip vec-tors estimated from LFEs and VLFs in Japan indicate slip along the plate interface in the convergence direction13,30.
In Cascadia, quasi-static slip of several centimetres on the plate interface has been inferred directly downdip from the locked zone of the plate interface, between the 25- and 45-km-depth contours16.
However, the non-uniqueness of the modelled solutions also permits slip zones at different depths or shear distributed over a depth range of more than 10 km (ref. 31). In much of Cascadia, tremor sources are consistent with origins on the plate interface10,28, but their distri-bution beneath Vancouver Island extends from the plate interface to near the surface with the densest concentration being well above the interface31,32.
The durations of aseismic-slip events in numerous subduction zones range from days to years, with magnitudes of displacement
200 seconds
200 seconds
5 seconds
10 seconds
600 nm s –1
400 nm s –1
600 nm s –1
50 nm s –1
Tremor
VLF event
LFE
Earthquake
Seismic signals Geodetic signals
Slow–slip event
20 mm
5 mm
200
200 250 300
400 600
Days since 1/1/99
0.1 µ strain
Slow–slip event
Trem
or o
nset
5/12/08 5/20/08Date
0
–400 4000
Days from mainshock
a
b
c
d
e
f
g Earthquake coseismic slip and afterslip
50 cm
Figure 1 | illustrative examples of slow-slip signals. a, Tremor and b, VLF from Japan, filtered between 2–8 and 0.005–0.05 Hz, respectively. c, LFE from Japan. d, M1.9 earthquake in western Washington. e, Top: daily GPS E–W displacements measured on Vancouver Island. Bottom: averaged and detrended GPS data (pink lines show the fit trend) reveal a slow-slip event (shaded). f, Slow slip in differential shear strain measured in western Washington. Strain transient onset coincides with increased tremor activity. g, GPS N 55° displacement ~100 km from the 2001 M8.4 Peru earthquake. The large offset reflects the coseismic slip and the subsequent decaying deformation may be afterslip99. Figures reproduced with permission from: a,b ref. 77, © 2008 GRL; c, ref. 5, © 2006 NPG; e, ref. 16, © 2001 AAAS; f, ref. 98, © 2008 AGU; g, ref. 99, © 2005 JGR.
review article NATure geoScIeNce doi: 10.1038/ngeo940
ngeo_940_SEP10.indd 600 19/8/10 11:37:34
© 20 Macmillan Publishers Limited. All rights reserved10

nature geoscience | VOL 3 | SEPTEMBER 2010 | www.nature.com/naturegeoscience 601
of up to several tens of centimetres31,33. In Japan and Cascadia these events occur quasi-periodically, with periods of ~3 to ~19 months that vary along each subduction zone3,25,34,35. Elsewhere, for exam-ple Alaska, Mexico, New Zealand and Costa Rica, slow-slip events sometimes recur but with no apparent regularity17,36,37.
Quasi-static-slip events are accompanied by a variety of seismic phenomena. In many regions where aseismic slip occurs beneath the locked zone, for example Cascadia and southwest Japan, tremor always accompanies quasi-static slip. However, the converse is not true, for the reasons noted below3,25,38. A few studies in Japan note that aseismic slip begins before the onset of tremor activity and, in some places, occurs without any detectable seismic signals39,40.
Aseismic slip at shallow depths has correlative seismic signals that have spectral and scaling characteristics more typical of ordi-nary ‘fast’ earthquakes. Examples include regions just downdip of the shallow slow-slipping zones of the subduction zones of northern New Zealand41 and the Boso peninsula, Japan42. Shallow quasi-static slip accompanied by increased rates of regular earthquakes has also been observed along the creeping section of the SAF14 and the south flank of the Kilauea volcano, Hawaii43. The coupled earthquakes locate where ambient seismicity occurs, beneath the zone of quasi-static slip.
Seismic slow-slip signals observed without geodetic counter-parts, such as along the SAF29,44,45 and in the subduction zones noted above, plausibly can be attributed to detection differences between geodetic and seismic instrumentation. Such differences between regions may explain some apparent regional variations in slow-slip phenomena. Surface GPS instruments are sensitive only to quasi-static-slip events below ~25 km depth with magnitude (M) > 6, whereas small M5–6 events can be detected only by borehole tilt-meters in Japan25. Even with borehole strainmeters, M~5 slow-slip events could go undetected if at depths below ~15 km45. The obser-vation of tremor both during ETS events and between them sug-gests that quasi-static slip may often occur between such events but go undetected40,46. On the other hand, deep ETS events have been measured in southwest Japan47, but have not been observed directly in northeast Japan, yet both regions contain equally dense seismic and geodetic instrumentation.
Shear slip on frictional, pressurized, near-failure faults. Numerous lines of evidence strongly suggest that slow-slip phenomena result from shear slip on faults near failure with low effective confining pres-sure, most probably owing to near-lithostatic fluid pressures. Tremor in a wide range of tectonic environments can be instantaneously trig-gered by transient stresses on the order of a few to tens of kilopascals, imparted by surface waves of regional and teleseismic events44,48–51 (Fig. 4). Static-stress changes on the order of a few kilopascals from neighbouring earthquakes also trigger changes in rates of tremor52 and LFEs29 along the SAF. Furthermore, tremor activity seems to be modulated by the Earth’s tidal deformation53–55, with tidally induced fault-parallel shear stresses correlating best with the tremor activity56. Correlations between slow-slip phenomena and stress perturba-tions on the order of a few kilopascals from atmospheric57 and other climatic-driven events58,59 also indicate that participating faults are critically stressed.
It is generally agreed that near-lithostatic fluid pressure reduces the effective stresses and makes slow-slip events highly sensitive to external stress perturbations. Evidence of elevated fluid pressures comes from tomographic imaging of elastic properties around the source region of the slow-slip phenomena5,27,60–62. These studies show that tremor and aseismic slip occur preferentially in regions with high ratios of compressional- to shear-wave seismic velocity, anomalously high Poisson’s ratios, or ultralow shear-velocity layers. These all indicate that fluids are widely present, with pore pressures near lithostatic values (Fig. 2). Fluids may come from dehydration of hydrous minerals in the subducting sediments and oceanic crust63,
becoming sealed in and pressurized where the plate boundary has low permeability27,61. The presence and source of fluids in the lower crust near strike-slip faults such as the SAF are still speculative, although recent seismic imaging studies have revealed conductive properties at the base of the crust64.
Physical models of slow-slip phenomena. The macroscopic behav-iours of plate boundary faults under the stresses caused by relative plate motions are typically described in terms of frictional prop-erties65. Thus, most models of aseismic slow-slip events appeal to shear slip on frictional faults5,30,50. Figure 2 illustrates the broad vari-ation in frictional properties that are ascribed to subduction zones, but applicable to several plate boundary zones. The same picture can be drawn for transform boundaries by simply plotting the inter-face vertically66. Frictional models explain the occurrence of quasi-static-slip events with rates and displacement values consistent with observations67–71, although the physics assumed in these models may differ. Moreover, they seem to require low confining stresses and, in some models, significant involvement of fluid-pressure processes71, consistent with the aforementioned inferences.
Other explanatory models involve fluids, either exclusively through mechanisms such as hydraulic fracturing or permeability pumping2,32, or in combination with frictional processes49,70,71. An intriguing example of the latter involves dilatant strengthening. Here, frictional faults dilate as they accelerate towards dynamic failure at rates that prohibit draining, such that pore pressures drop. This raises the effective normal stress and thus limits or quenches dynamic rupture70,71. The lack of phase lag between seis-mic waves and tidal forces, the tremor and slip rates they modu-late, and high tremor-migration rates (as high as 5–45 km hr−1 (ref. 11), in excess of plausible fluid-diffusion rates) imply that changing fluid pressures cannot involve diffusion or flow72.
A primary role for quasi-static slip. The earliest ETS observations clearly demonstrated the coupled nature of seismic and aseismic slow-slip events3. Corroborative subsequent studies have led to
Stable slipLocked Slow transient slip
Oceanic crustOceanic mantle High fluid pressure
Stable slip
Continental moho
Arc volcano
40 km
~100 km
VLFs
Slow earthquakes
AfterslipSlow–slip (creep) events
VLFs
LFEs
Tremor
AfterslipSlow–slip events
Earthquakes
Seismic
phenomena
Geodetic
phenomena
Figure 2 | schematic cross-section of the cascadia subduction zone. The various slip modes believed to occur along the plate interface are noted (red lines) with the corresponding observed phenomena indicative of each listed below. In Cascadia and elsewhere much evidence suggests that high fluid pressures exist in the region where slow-slip phenomena occur. Modified from ref. 61, © 2009 NPG, ref. 5, © 2006 NPG and ref. 62, © 2009 AAAS.
review articleNATure geoScIeNce doi: 10.1038/ngeo940
ngeo_940_SEP10.indd 601 19/8/10 11:37:35
© 20 Macmillan Publishers Limited. All rights reserved10
602 nature geoscience | VOL 3 | SEPTEMBER 2010 | www.nature.com/naturegeoscience
proposals that tremor could be used as a proxy to monitor aseismic slip29,38,73. As well as the broadscale temporal and spatial coincidence of seismic (tremor, LFE and VLF) and quasi-static-slip sources within tens of kilometres and days, in Cascadia and Japan both also show clear along-strike migrations that track each other, at speeds on the order of a few tens of kilometres per day12,46. These correla-tions warrant exploration of a causal connection between the seis-mic and aseismic phenomena. ‘Causal’ in this context refers both to the processes that load or supply the strain energy fuelling the eventual fault slip, and those that may initiate (trigger) a slip event early. The relative timing and moments of seismic and aseismic slow slip provide key constraints on the driving and triggering processes. The moment measures the potency of a slip episode to relax accrued stresses, and is proportional to the product of the slipping area and the distance slipped74.
Although resolvable in only a few cases, the fact that the onset of aseismic slip precedes the start of the seismic activity in Hawaii43 and Japan39,40 means the seismic slip does not trigger the quasi-static slip. However, the reverse may be inferred. We also conclude that the seismic slip is not causal in the sense of provid-ing the energy that drives the aseismic slip, because when meas-urable, the relative moment of the cumulative seismic activity is orders of magnitude smaller than that of the aseismic slip (Fig. 5). In Japan, aseismic-slip events near the Boso peninsula region have moments that significantly exceed those of the earthquakes that accompany them42. In the Nankai region the rate of seismic moment released from detectable VLF sources was 0.1% of the rates from adjacent, contemporary slow-slip events13. In Cascadia, for each of eight ETS episodes the moment of the aseismic slip exceeds that of the cumulative tremor by more than a factor of a million75. Tremor represents only the energy radiated above ~1 Hz, thus the latter probably underestimates the total seismic moment. Indeed, coherent seismic waveforms with energy at frequencies as low as 0.002 Hz have been observed in association with aseismic-slip events, but always in the tremor signals12,76. This demonstrates the detectability of such low-frequency radiation and shows that biases in band-limited estimates of seismic moment are probably too small to account for their much smaller values relative to aseis-mic moments.
Thus, we conclude that quasi-static slip is the primary mode in which the accrued tectonic stresses are relieved. The observations
do not distinguish between the seismic slip also being tectonically driven or relaxing stresses redistributed as a result of the aseismic slip. Although uncertain, the possible balance between the cumu-lative aseismic slip over complete ETS cycles and that accrued owing to plate motion in Cascadia would argue in favour of the first proposition46,77.
Slip-mode stationarity. We suggest that the specific slip mode at a particular location is an inherent property of the fault, rather than being determined by transient conditions (for example, the causative load itself, or fluid flow). The observation of only a single mode of slip at a given locale for the duration of our observational window of several decades supports this inference, and further implies that the properties governing the slip mode are station-ary on this timescale. Corroborative observations include spatially anticorrelated distributions of earthquakes and slow-slip sources, observed for both large and small earthquakes. Sources of slow quasi-static slip in Alaska abut the rupture zone of the great M9.2 Alaska earthquake78 of 1964. In Japan, slow-slip sources occur on the edges of the rupture planes of the M7.9 Kanto earthquake42 of 1923 and just below the M7.9 Tonankai 1944 and M8.0 Nankai 1946 earthquakes79. In Cascadia, the locations of tremor sources are anticorrelated with the section of the plate interface inferred from palaeoseismic data to have slipped during past megathrust earthquakes76 and, curiously, also with earthquakes in the crust of the overriding plate31.
The maxima of seismic and aseismic slow-slip source distribu-tions also seem to locate in spatially adjacent, but not coincident, regions. The most recent estimates of tremor and quasi-static slow slip from Japan show the two migrating in temporal sync with one another, but with a bimodal tremor distribution that has peaks out-lining the slower slip rather than being coincident with it80. Tremor source distributions mapped in the subduction zone regions of Mexico, Alaska and Cascadia all peak downdip of the greatest quasi-static slip31,36,62.
Conditions for slow-slip phenomena. Although the mode of slip seems to be stationary, the requirements for triggering slip vary temporally and are not easily satisfied. Recent systematic surveys of tremor in California44,48 and Taiwan51, triggered by the seismic waves from distant earthquakes, revealed that triggered tremor occurs in only a few isolated regions, the locations of which varied for differ-ent triggering earthquakes.
The particular conditions required for slow slip have become apparent as more regions have been studied. Thermal controls were initially thought to be key47 because ETS was first identified in the relatively young and warm subducted crusts of Cascadia and southwest Japan, and were absent in northeast Japan where the predicted pressure–temperature paths are much cooler63. However, detailed finite-element thermal modelling of the Cascadia and southwest Japan subduction zones now shows quite different pressure–temperature paths in each region at depths where ETS is observed, suggesting that ETS does not require a specific temperature or metamorphic reaction81. Furthermore, tremor and slow-slip events have been recently observed in rela-tively old and cold subducting crust in Costa Rica10 and Alaska36. Hence new hypotheses invoking differences in frictional or perme-ability properties have been proposed to explain the lack of ETS in northeast Japan47,63. However, more work is required to fully test these hypotheses.
slow-slip phenomena in a larger contextCoupled seismic- and aseismic-slip events on natural sur-faces have been observed in many contexts, some fairly famil-iar and well studied. As just noted in the context of the newly discovered plate boundary phenomena, investigations in many
0 30 60
60
30
0
–30
–60
90 120 150 180 –150 –120 –90 –60 –30
Alaska
CascadiaParkfield
GuerreroHawaii
Costa Rica
New Zealand
JapanTaiwan
DeepShallowAfterslipGlacier
‘Slow’ eventsSwarmsLandslideGlacierTriggered tremor
Geodetic Seismic
Longitude (° E)
Latit
ude
(° N
)
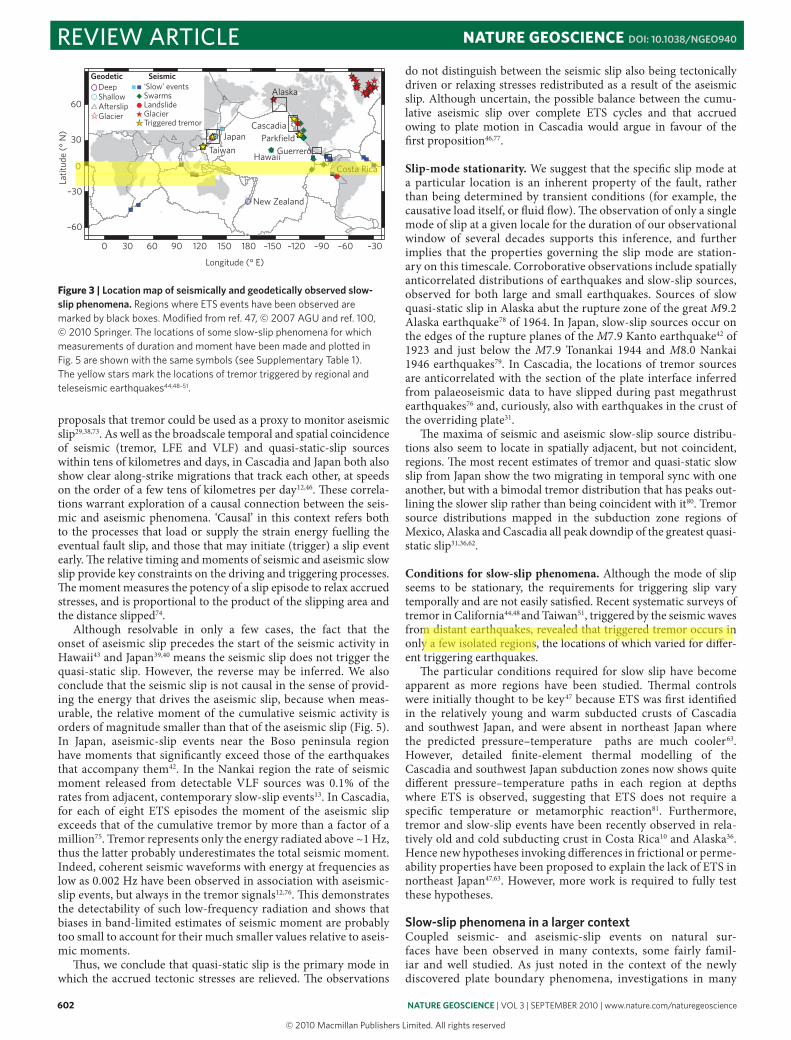
Figure 3 | location map of seismically and geodetically observed slow-slip phenomena. Regions where ETS events have been observed are marked by black boxes. Modified from ref. 47, © 2007 AGU and ref. 100, © 2010 Springer. The locations of some slow-slip phenomena for which measurements of duration and moment have been made and plotted in Fig. 5 are shown with the same symbols (see Supplementary Table 1). The yellow stars mark the locations of tremor triggered by regional and teleseismic earthquakes44,48–51.
review article NATure geoScIeNce doi: 10.1038/ngeo940
ngeo_940_SEP10.indd 602 19/8/10 11:37:36
© 20 Macmillan Publishers Limited. All rights reserved10
nature geoscience | VOL 3 | SEPTEMBER 2010 | www.nature.com/naturegeoscience 603
settings are required to learn which factors are most relevant and provide opportunities to fill in observational gaps that arise from instrumental limitations in individual settings. We identify at least five hallmark characteristics of slow-slip phenomena: (1) the ratios of slip to slipped area are low and durations are long, relative to ‘fast’ earthquakes; (2) accrued stresses are relaxed dominantly through quasi-static slip that triggers a seismic response, evident in aseismic slip that precedes the seismic activity and has greater moment. The seismic response is sometimes quenched before reaching fully dynamic speeds, as in tremor, LFEs and VLFs; (3) explanatory models invoke shear slip on faults with frictional properties transitional between those that result in continu-ous creep and those that are fully locked, punctuated by nearly instantaneous slip (stick–slip); (4) near-failure conditions prob-ably reflect low confining stresses. Fluids at high pressure remain the most viable way to achieve these conditions, and may play important roles in quenching slip and in the recurrence of slow-slip events; (5) local, stationary properties determine the domi-nant slip mode.
Afterslip and aftershocks. Afterslip represents transient quasi-static slip triggered by the rapid stress release in a mainshock, which is typically followed by increased seismic activity known as ‘after-shocks’. The underlying mechanism of aftershock generation is
still debated82. A linear relationship between postseismic geodetic deformation, modelled as slow slip on the mainshock fault, and the cumulative number of aftershocks has led to suggestions that aftershocks may be driven primarily by afterslip83–85. These coupled seismic and aseismic processes exhibit almost all of the aforemen-tioned hallmark characteristics of slow-slip phenomena: (1) the durations of the aseismic slip and aftershock sequences may last for days to months; (2) the afterslip moment exceeds the aggre-gate moment of aftershocks by more than two orders of magnitude (Fig. 5)85,86; (3) frictional models akin to those applied to tectoni-cally driven plate boundary slow slip explain not only the temporal decay of aftershocks and afterslip, but also their spatial migration87,88; (4) anti-correlated coseismic- and postseismic-slip distribu-tions suggest that afterslip fills in gaps in slip remaining after a mainshock84.
Aseismic deformation and earthquake swarms. Sometimes sequences of clustered earthquakes strike in a short period of time with no obvious mainshock. The driving forces for these ‘earth-quake swarms’ may be aseismic slip (measured in just a few cases), fluid, or magma migrations43,72,89,90. Swarms share several key fea-tures with plate boundary slow-slip phenomena72: (1) durations of swarm activity and aseismic slip last days to months; (2) the aggre-gate seismic moment is only a small fraction of the cumulative
Vancouver Island
Central California Southwest Japan
Central Range
BPBC 5–15 Hz
PBS 2–8 Hz KWBH 5–15 Hz
STY 2–8 Hz
Transverse
Transverse Transverse
Transverse
PHC
PKD TSA
TPUB
Radial
Radial
Radial
Vertical
Vertical
Radial
Vertical
Vertical
5 cm 2 cm
2 cm
400 450 500 550 600 650 700 700 800 900 1,000 1,100
2 mm s–1
800 600 700 800 900 1,000 1,100900 1,000 1,100 1,200 1,300
Time (s) Time (s)
a b
c d
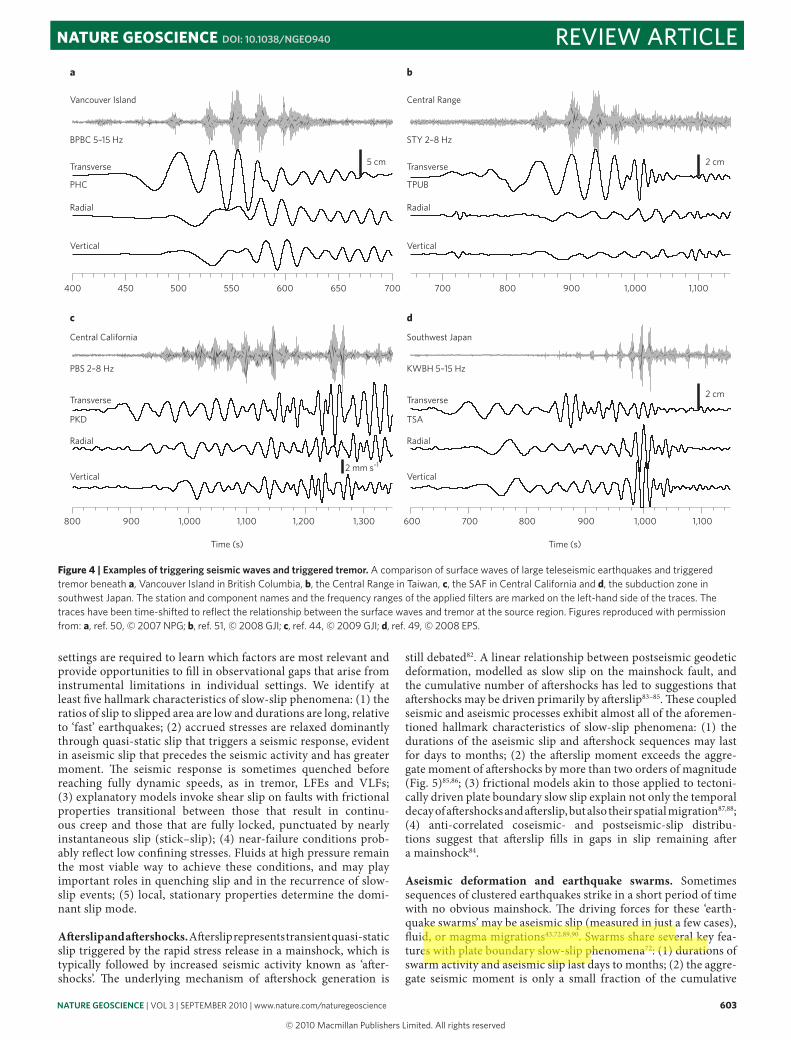
Figure 4 | examples of triggering seismic waves and triggered tremor. A comparison of surface waves of large teleseismic earthquakes and triggered tremor beneath a, Vancouver Island in British Columbia, b, the Central Range in Taiwan, c, the SAF in Central California and d, the subduction zone in southwest Japan. The station and component names and the frequency ranges of the applied filters are marked on the left-hand side of the traces. The traces have been time-shifted to reflect the relationship between the surface waves and tremor at the source region. Figures reproduced with permission from: a, ref. 50, © 2007 NPG; b, ref. 51, © 2008 GJI; c, ref. 44, © 2009 GJI; d, ref. 49, © 2008 EPS.
review articleNATure geoScIeNce doi: 10.1038/ngeo940
ngeo_940_SEP10.indd 603 19/8/10 11:37:38
© 20 Macmillan Publishers Limited. All rights reserved10

604 nature geoscience | VOL 3 | SEPTEMBER 2010 | www.nature.com/naturegeoscience
aseismic moment90 (Fig. 5) and some swarm events migrate at rates of kilometres per hour, consistent with the propagation of slow-slip events72; (3) the magnitudes of swarm earthquakes tend to be small and irregularly distributed in a sequence, reminiscent of tremor activity; (4) pressurized fluids are often invoked in expla-nations of swarms in magmatic and geothermal environments; (5) in the case of Hawaiian swarms, the earthquakes occurred in the same region as background seismicity43.
Steady and transient fault creep and repeating earthquakes. Sections of the SAF91 and other principal plate boundary faults around the globe42 are known to creep steadily or exhibit tran-sient aseismic slip. These often have associated seismic activity. ‘Repeating earthquakes’ are one example and probably represent repeated seismic failure of a single strongly coupled spot loaded by aseismic creep on the surrounding fault plane91. Other sections of the SAF are characterized by occasional transient aseismic-slip events, some of which are accompanied by increased seismicity rates14, and others without any seismic response92. These coupled aseismic and seismic phenomena share the aforementioned dis-tinguishing characteristics: (1) the transient aseismic slip lasts days to weeks14,92; (2) the aggregate moment release from the triggered earthquakes is negligible compared with that from the slow-slip events14; (3) although the materials and conditions may differ, the same frictional models and input parameters invoked to explain deeper plate boundary slow slip have been applied to explain shallow, steady and transient slip87; (4) high pore pres-sures are inferred to be responsible for the creep and transient
slip92; (5) triggered earthquakes occur in the same regions as ambient seismicity14.
Gravity-driven aseismic and seismic slip. Landslides and gla-ciers occur on natural surfaces that move and exhibit many of the same behaviours as tectonic faults, including coupled seismic and aseismic slip: (1) slip is sufficiently slow that even the seismic radiation may have characteristics typical of slow tectonic events; (2) although simultaneous geodetic and seismic measurements have been made in only a few glacier studies, results indicate that the aseismic slip triggers the seismic motion and is the primary mode of relaxing the stored gravitational energy. A slip event on an Antarctic glacier has a geodetic moment that exceeds the seismic moment by orders of magnitude (Fig. 5), and the arrival time of the first seismic energy, corrected for the source-receiver travel time, lags the onset of geodetically estimated slip by 20–150 seconds93; (3) glacial quakes in Antarctica, Alaska and Greenland have been interpreted as frictional stick–slip behaviour at the base of ice masses24. A more detailed geodetic and seismic study of an Antarctic glacier infers dynamic slip on frictionally strong spots that radiate on an otherwise quasi-statically sliding basal surface93; (4) pore-pres-sure evolution plays a significant role both in landslide and glacier movements. Theoretical models of landslide movement by stable and stick–slip sliding involve coupled frictional and pore-pressure diffusion processes94. Correlations between landslide velocities and diurnal changes in atmospheric pressure have been attributed to pore-pressure-diffusion processes that modulate basal pore pres-sure and thus the shear strength and velocity95. Weakening resulting
Figure 5 | seismic moment versus source duration for a variety of fault-slip observations. Augmented version from ref. 96, © 2007 NPG, which infers two distinct scalings between moment and duration (diagonal bands). Open and filled symbols denote geodetic and seismic measurements, respectively. Measurements from ref. 96 have plus signs on the symbols, and all others are cross-referenced to sources listed in Supplementary Table S1. ‘Fast earthquakes’ and ‘shallow subduction earthquakes’ are too numerous to list but are listed in Supplementary Table S1. Data from the former come from only two sources. Dashed horizontal lines connect related geodetic and seismic data. Solid horizontal lines highlight the gap between seismic and geodetic durations.
108
1010 1011 1012 1013 1014 1015 1016 1017 1018 1019 1020 1021
107
106
105
104
103
102
101
100
10–1
10–2
Dur
atio
n (s
)
Aseismic
Seismic
Slow slip
Regular earthquakes
Seismic moment (Nm)
San Andreas
earthquakes (9)
Shallow subduction
earthquakes (21)
Earthquakes (10–14)
Glacier (18)
Kii peninsula, Japan (3)
Shikoku, Japan (2)Hydrofractureearthquake (20)
Slow shallow earthquakes (1)
Kalpana, Hawaiiearthquake (17)
Landslide (26)
Landslide (25)
Glacier (24) Glacier (24)
Tsunami earthquakes (19)
Hawaii (7)
Superstition Hills, CA (5)
Transform swarms (8)
Shikoku, Japan (4)
Wooded Island, Washingtonswarm and aseismic slip (6) After sequences, afterslip
(15, 16, 23)
New Zealand (22)
Slow events (19)
Geodetic
Deep
Shallow
Silent earthquakes
Shallow slow slip
Afterslip
Glacier
Seismic
‘Slow’ events
‘Fast’ earthquakes
Swarms
Aftershocks
Glacier
Landslide
Measurements
review article NATure geoScIeNce doi: 10.1038/ngeo940
ngeo_940_SEP10.indd 604 19/8/10 11:37:39
© 20 Macmillan Publishers Limited. All rights reserved10

nature geoscience | VOL 3 | SEPTEMBER 2010 | www.nature.com/naturegeoscience 605
from pore-pressure changes associated with seasonal variations in water availability has been postulated to be responsible for a greater rate of glacial quakes during the summer months in Greenland24.
a continuum of slip modes?The fault surface we propose primarily slips quasi-statically, such that the amplitude and rate of slip are limited, perhaps because the fault surfaces are inherently weak or the failure process becomes quenched. This slow slip probably involves intermediate fric-tional processes between stick–slip behaviour and steady creep that result in the nucleation of failure or slip, and other processes involving fluid pressures that may quench the acceleration of slip (for example, dilatant hardening). Scattered on or near this fault surface are tiny fault patches that may accelerate to dynamic or near-dynamic rupture velocities and radiate seismic waves.
The time required for slip events of particular efficacy to com-pletely release accrued stresses can be quantified in terms of the scaling between duration and moment. This scaling is diagnos-tic of the underlying mechanics. We hypothesize that slip modes observed in nature should span a continuum, given the heteroge-neity and complexity of natural systems, rather than separating neatly into distinct fast or slow groups, as has been suggested96. We test this hypothesis by augmenting the plot of moment ver-sus duration observations that led to the latter conclusion, with measurements from the broader range of sources described herein (Fig. 5). We plot the aggregate durations and moments for after-shock and swarm sequences as proxies for aseismic slip, noting that the aseismic moments are likely to be much larger and thus would be within the distribution of the other slow geodetic meas-urements. The few swarms and aftershock sequences for which both seismic and geodetic observations (connected by dashed lines) exist support this assumption.
The augmented scaling data suggest a more careful considera-tion of the existence of two distinct failure modes — fast and slow. Two distributions clearly exist in the data, but we suggest that they are observational, comprising either geodetic or seismic meas-urements. These are separated by a gap in duration of more than two orders of magnitude (Fig. 5, horizontal lines). This gap may be attributed partly to instrumental limitations18. It is reasonable to question whether the slow-scaling relation originally inferred even fits this larger dataset, as well as the validity of fitting a single line to widely separated clusters of data. We suggest that as more data are added, the lines separating slow- and fast-slip events will blur even more, indicating a continuum of slip modes.
Measurements of earthquakes and slow-slip events from a broad range of global settings are found to overlap with measure-ments of slow-slip events at plate boundary settings (Fig. 5). This overlap implies that the recently discovered slow-slip phenomena, generated at plate boundaries as a result of tectonic processes, are not so extraordinary. Furthermore, we suggest that a continuum of slip modes exists, rather than the distinct separation between slow slip and earthquakes. The mode of slip is determined by the inherent properties of the fault surface. Studies of slow-slip phenomena, viewed from a global, integrated perspective, are leading to a more complete picture of how faults slip and release tectonic stresses. Such an integrated perspective is critical for evaluating the hazards posed by earthquakes and other natural systems involving catastrophic slip. For example, it has been sug-gested that slow-slip phenomena could be used to delineate the updip and downdip limits of the seismogenic zone that ruptures in megathrust earthquakes76. Slow slip also imparts stress changes on nearby locked faults and may act as a trigger for large earth-quakes, although robust observations of this process are rare97. The strong sensitivity of slow-slip phenomena to stress perturba-tions suggests that they could serve as natural ‘stress meters’ to monitor fault zones during large earthquake cycles.
references1. Brodsky, E. E. & Mori, J. Creep events slip less than ordinary earthquakes.
Geophys. Res. Lett. 34, L16309 (2007).2. Obara, K. Nonvolcanic deep tremor associated with subduction in southwest
Japan. Science 296, 1679–1681 (2002).3. Rogers, G. & Dragert, H. Episodic tremor and slip on the Cascadia subduction
zone: The chatter of silent slip. Science 300, 1942–1943 (2003).4. Katsumata, A. & Kamaya, N. Low-frequency continuous tremor around the
Moho discontinuity away from volcanoes in the southwest Japan. Geophys. Res. Lett. 30, 1020 (2003).
5. Shelly, D. R., Beroza, G. C. & Ide, S. Low-frequency earthquakes in Shikoku, Japan, and their relationship to episodic tremor and slip. Nature 442, 188–191 (2006).
6. Obara, K. & Ito, Y. Very low frequency earthquakes excited by the 2004 off the Kii peninsula earthquakes: A dynamic deformation process in the large accretionary prism. Earth Planets Space 57, 321–326 (2005).
7. Ito, Y., Asano, Y. & Obara, K. Very low-frequency earthquakes indicate a transpressional stress regime in the Nankai accretionary prism. Geophys. Res. Lett. 36, L20309 (2009).
8. Nadeau, R. M. & Dolenc, D. Nonvolcanic tremors deep beneath the San Andreas Fault. Science 307, 389 (2005).
9. Payero, J. S. et al. Nonvolcanic tremor observed in the Mexican subduction zone. Geophys. Res. Lett. 35, L07305 (2008).
10. Brown, J. R. et al. Deep low-frequency earthquakes in tremor localize to the plate interface in multiple subduction zones. Geophys. Res. Lett. 36, L19306 (2009).
11. Shelly, D. R, Beroza, G. C. & Ide, S. Non-volcanic tremor and low-frequency earthquake swarms. Nature 446, 305–307 (2007).
12. Ito, Y., Obara, K., Shiomi, K., Sekine, S. & Hirose, H. Slow earthquakes coincident with episodic tremors and slow slip events. Science 315, 503–506 (2007).
13. Ito, Y., Obara, K., Matsuzawa, T. & Maeda, T. Very low frequency earthquakes related to small asperities on the plate boundary interface at the locked to aseismic transition. J. Geophys. Res. 114, B00A13 (2009).
14. Linde, A. T., Gladwin, M., Johnston, M., Gwyther, R. & Bilham, R. A slow earthquake sequence on the San Andreas Fault. Nature 383, 65–68 (1996).
15. Hirose, H., Hirahara, K., Kimata, F., Fujii, N. & Miyazaki, S. A slow thrust slip event following the two 1996 Hyuganada earthquakes beneath the Bungo Channel, southwest Japan. Geophys. Res. Lett. 26, 3237–3240 (1999).
16. Dragert, H., Wang, K. & James, T. S. A silent slip event on the deeper Cascadia subduction interface. Science 292, 1525–1528 (2001).
17. Lowry, A. R., Larson, K. M., Kostoglodov, V. & Bilham, R. Transient fault slip in Guerrero, southern Mexico. Geophys. Res. Lett. 28, 3753–3756 (2001).
18. Agnew, D. Instrumental, theoretical, temporal, and statistical challenges in the search for transient deformations. Eos 90 (suppl.), G32A-01 (2009).
19. Beroza, G. & Jordan, T. Searching for slow and silent earthquakes using free oscillations. J. Geophys. Res. 95, 2485–2510 (1990).
20. Kanamori, H. & Anderson, D. L. Theoretical basis of some empirical relations in seismology. Bull. Seismol. Soc. Am. 65, 1073–1095 (1975).
21. Shearer, P. M. Global seismic event detection using a matched filter on long-period seismograms. J. Geophys. Res. 99, 13713–13725 (1994).
22. Kanamori, H. & Hauksson, E. A slow earthquake in the Santa Maria Basin, California. Bull. Seismol. Soc. Am. 82, 2087–2096 (1992).
23. Kanamori, H. & Kikuchi, M. The 1992 Nicaragua Earthquake - a slow tsunami earthquake associated with subducted sediments. Nature 361, 714–716 (1993).
24. Ekström, G., Nettles, M. & Abers, G. A. Glacial earthquakes. Science 302, 622–624 (2003).
25. Obara, K., Hirose, H., Yamamizu, F. & Kasahara, K. Episodic slow slip events accompanied by non-volcanic tremors in southwest Japan subduction zone. Geophys. Res. Lett. 31, L23602 (2004).
26. Shelly, D. R., Beroza, G. C., Zhang, H., Thurber, C. H. & Ide, S. High-resolution subduction zone seismicity and velocity structure beneath Ibaraki Prefecture, Japan. J. Geophys. Res. 111, B06311 (2006).
27. Audet, P., Bostock, M. G., Boyarko, D. C., Brudzinski, M. R. & Allen, R. M. Slab morphology in the Cascadia forearc and its relation to episodic tremor and slip. J. Geophys. Res. 115, B00A16 (2010).
28. LaRocca, M. et al. Cascadia tremor located near the plate interface constrained by S minus P wave times. Science 323, 620–623 (2009).
29. Shelly, D. R. Migrating tremors illuminate complex deformation beneath the seismogenic San Andreas Fault. Nature 463, 648–653 (2010).
30. Ide, S., Shelly, D. R. & Beroza, G. C. Mechanism of deep low frequency earthquakes: Further evidence that deep non-volcanic tremor is generated by shear slip on the plate interface. Geophys. Res. Lett. 34, L03308 (2007).
31. Kao, H., Shan, S-J., Dragert, H. & Rogers, G. Northern Cascadia episodic tremor and slip: A decade of tremor observations from 1997 to 2007. J. Geophys. Res. 114, B00A12 (2009).
32. Kao, H. et al. A wide depth distribution of seismic tremors along the northern Cascadia margin. Nature 436, 841–844 (2005).
review articleNATure geoScIeNce doi: 10.1038/ngeo940
ngeo_940_SEP10.indd 605 19/8/10 11:37:40
© 20 Macmillan Publishers Limited. All rights reserved10

606 nature geoscience | VOL 3 | SEPTEMBER 2010 | www.nature.com/naturegeoscience
33. Miyazaki, S., Segall, P., McGuire, J. J., Kato, T. & Hatanaka, Y. Spatial and temporal evolution of stress and slip rate during the 2000 Tokai slow
earthquake. J. Geophys. Res. 111, B03409 (2006).34. Miller, M. M., Melbourne, T., Johnson, D. J. & Sumner, W. Q. Periodic slow
earthquakes from the Cascadia subduction zone. Science 295, 2423 (2002).35. Brudzinski, M. R. & Allen, R. M. Segmentation in episodic tremor and slip all
along Cascadia. Geology 35, 907–910 (2007).36. Peterson, C. L. & Christensen, D. H. Possible relationship between
nonvolcanic tremor and the 1998–2001 slow-slip event, south central Alaska. J. Geophys. Res. 114, B06302 (2009).
37. Douglas, A., Beavan, J., Wallace, L. & Townend, J. Slow slip on the northern Hikurangi subduction interface, New Zealand. Geophys. Res. Lett. 32, 1–4 (2005).
38. Aguiar, A. C., Melbourne, T. I. & Scrivner, C. W. Moment release rate of Cascadia tremor constrained by GPS. J. Geophys. Res. 114, B00A05 (2009).
39. Fukuda, M., Sagiya, T. & Asai, Y. A causal relationship between the slow slip event and deep low frequency tremor indicated by strain data recorded at Shingu borehole station. Eos 89 (suppl.), U33A-0033 (2008).
40. Obara, K. Phenomenology of deep slow earthquake family in southwest Japan: Spatiotemporal characteristics and segmentation. J. Geophys. Res. doi:10.1029/2008JB006048 (2010).
41. Delahaye, E. J., Townend, J., Reyners, M. E. & Rogers, G. Microseismicity but no tremor accompanying slow slip in the Hikurangi subduction zone, New Zealand. Earth Planet. Sci. Lett. 277, 21–28 (2009).
42. Kimura, H., Kasahara, K. & Takeda, T. Subduction process of the Philippine Sea Plate off the Kanto district, central Japan, as revealed by plate structure and repeating earthquakes. Tectonophysics 472, 18–27 (2009).
43. Segall, P., Desmarais, E., Shelly, D., Miklius, A. & Cervelli, P. Earthquakes triggered by silent slip events on Kilauea volcano, Hawaii. Nature 442, 71–74 (2006).
44. Peng, Z., Vidale, J. E., Wech, A. G., Nadeau, R. M. & Creager, K. C. Remote triggering of tremor along the San Andreas Fault in central California. J. Geophys. Res. 114, B00A06 (2009).
45. Smith, E. F. & Gomberg, J. A search in strainmeter data for slow slip associated with triggered and ambient tremor near Parkfield, California. J. Geophys. Res. 114, B00A14 (2009).
46. Wech, A. G., Creager, K. C. & Melbourne, T. I. Seismic and geodetic constraints on Cascadia slow slip. J. Geophys. Res. 114, B10316 (2009).
47. Schwartz, S. Y. & Rokosky, J. M. Slow slip events and seismic tremor at circum-pacific subduction zones. Rev. Geophys. 45, RG3004 (2007).
48. Gomberg, J., Rubinstein, J. L., Peng, Z., Creager, K. C. & Vidale, J. E. Widespread triggering of non-volcanic tremor in California. Science 319, 173 (2008).
49. Miyazawa, M. & Brodsky, E. E. Deep low-frequency tremor that correlates with the passing surface waves. J. Geophys. Res. 113, B01307 (2008).
50. Rubinstein, J. L. et al. Non-volcanic tremor driven by large transient shear stresses. Nature 448, 579–582 (2007).
51. Peng, Z. & Chao, K. Non-volcanic tremor beneath the Central Range in Taiwan triggered by the 2001 Mw7.8 Kunlun earthquake. Geophys. J. Int. 175, 825–829 (2008).
52. Nadeau, R. M. & Guilhem, A. Nonvolcanic tremor evolution and the San Simeon and Parkfield, California, earthquakes. Science 325, 191–193 (2009).
53. Rubinstein, J. L., La Rocca, M., Vidale, J. E., Creager, K. C. & Wech, A. G. Tidal modulation of nonvolcanic tremor. Science 319, 186–189 (2008).
54. Nakata, R., Suda, N. & Tsuruoka, H. Non-volcanic tremor resulting from the combined effect of Earth tides and slow slip events. Nature Geosci. 1, 676–678 (2008).
55. Lambert, A., Kao, H., Rogers, G. & Courtier, N. Correlation of tremor activity with tidal stress in the northern Cascadia subduction zone. J. Geophys. Res. 114, B00A08 (2009).
56. Thomas, A. M., Nadeau, R. M. & Bürgmann, R. Tremor-tide correlations and near-lithostatic pore pressure on the deep San Andreas fault. Nature 462, 1048–1051 (2009).
57. Liu, C-C., Linde, A. T. & Sacks, I. S. Slow earthquakes triggered by typhoons. Nature 459, 833–836 (2009).
58. Shen, Z. K., Wang, Q., Bürgmann, R. & Wan, Y. Pole-tide modulation of slow slip events at circum-Pacific subduction zones. Bull. Seismol. Soc. Am. 95, 2009–2015 (2005).
59. Lowry, A. R. Resonant slow fault slip in subduction zones forced by climatic load stress. Nature 442, 802–805 (2006).
60. Matsubara, M., Obara, K. & Kasahara, K. High-VP/VS zone accompanying non-volcanic tremors and slow-slip events beneath southwestern Japan. Tectonophysics 472, 6–17 (2009).
61. Audet, P., Bostock, M. G., Christensen, N. I. & Peacock, S. M. Seismic evidence for overpressured subducted oceanic crust and megathrust fault sealing. Nature 457, 76–78 (2009).
62. Song, T. A. et al. Subducting slab ultra-slow velocity layer coincident with silent earthquakes in southern Mexico. Science 324, 502–506 (2009).
63. Peacock, S. M. Thermal and metamorphic environment of subduction-zone episodic tremor and slip. J. Geophys. Res. 114, B00A07 (2009).64. Ozacar, A. A. & Zandt, G. Crustal structure and seismic anisotropy near the
San Andreas Fault at Parkfield, California. Geophys. J. Int. 178, 1098–1104 (2009).
65. Scholz, C. H. The Mechanics of Earthquakes and Faulting 2nd edn (Cambridge Univ. Press, 2003).
66. Kanamori, H. Earthquake physics and real-time seismology. Nature 451, 271–273 (2008).
67. Shibazaki, B. & Iio, Y. On the physical mechanism of silent slip events along the deeper part of the seismogenic zone. Geophys. Res. Lett. 30, 1489 (2003).
68. Liu, Y. & Rice, J. R. Spontaneous and triggered aseismic deformation transients in a subduction fault model. J. Geophys. Res. 112, B09404 (2007).
69. Liu, Y. & Rice, J. R. Slow slip predictions based on granite and gabbro friction data compared to GPS measurements in northern Cascadia. J. Geophys. Res. 114, B09407 (2009).
70. Rubin, A. M. Episodic slow slip events and rate-and-state friction. J. Geophys. Res. 113, B11414 (2008).
71. Segall, P. & Bradley, A. M. Numerical models of slow slip and dynamic rupture including dilatant stabilization and thermal pressurization. Eos 90 (suppl.), T22B-08 (2009).
72. Roland, E. & McGuire, J. J. Earthquake swarms on transform faults. Geophys. J. Int. 178, 1677–1690 (2009).
73. Hiramatsu, Y., Watanabe, T. & Obara, K. Deep low-frequency tremors as a proxy for slip monitoring at plate interface. Geophys. Res. Lett. 35, L13304 (2008).
74. Aki, K. Generation and propagation of G waves from the Niigata earthquake of June 16, 1964, 2, Estimation of earthquake moment, released energy, and stress-strain drop from G wave spectrum. Bull. Earthq. Res. I. Tokyo 44, 73–88 (1966).
75. Kao, H., Wang, K., Dragert, H., Rogers, G. C. & Kao, J. Y. Large contrast between the moment magnitude of tremor and the moment magnitude of slip in ETS events. Eos 90 (suppl.), T22B-04 (2009).
76. Chapman, J. S. & Melbourne, T. I. Future Cascadia megathrust rupture delineated by episodic tremor and slip. Geophys. Res. Lett. 36, L22301 (2009).
77. Ide, S., Imanishi, K., Yoshida, Y., Beroza, G. C. & Shelly, D. R. Bridging the gap between seismically and geodetically detected slow earthquakes. Geophys. Res. Lett. 35, L10305 (2008).
78. Ohta, Y., Freymueller, J. T., Hreinsdóttir, S. & Suito, H. A large slow slip event and the depth of the seismogenic zone in the south central Alaska subduction zone. Earth Planet. Sci. Lett. 247, 108–116 (2006).
79. Obara, K. & Hirose, H. Non-volcanic deep low-frequency tremors accompanying slow slips in southwest Japan subduction zone. Tectonophysics 417, 33–51 (2006).
80. Obara, K., Tanaka, S. & Maeda, T. Reevaluation of nonvolcanic tremor activity based on the hybrid method. Eos 90 (suppl.), T11C-1835 (2009).
81. Peacock, S. M. & Wang, K. Seismic consequences of warm versus cool subduction metamorphism: Examples from Southwest and Northeast Japan. Science 286, 937–939 (1999).
82. Freed, A. M. Earthquake triggering by static, dynamic, and postseismic stress transfer. Annu. Rev. Earth Pl. Sc. 33, 335–367 (2005).
83. Perfettini, H. & Avouac, J. P. Postseismic relaxation driven by brittle creep: A possible mechanism to reconcile geodetic measurements and the decay rate of aftershocks, application to the Chi-Chi earthquake, Taiwan. J. Geophys. Res. 109, B02304 (2004).
84. Hsu, Y. J. et al. Frictional afterslip following the 2005 Nias-Simeulue earthquake, Sumatra. Science 312, 1921–1926 (2006).
85. Savage, J. C. & Yu, S. B. Postearthquake relaxation and aftershock accumulation linearly related after 2003 Chengkung (M6.5, Taiwan) and 2004 Parkfield (M6.0, California) earthquakes. Bull. Seismol. Soc. Am. 97, 1632–1645 (2007).
86. Barbot, S., Fialko, Y. & Bock, Y. Postseismic deformation due to the Mw 6.0 2004 Parkfield earthquake: Stress-driven creep on a fault with spatially variable rate-and-state friction parameters. J. Geophys. Res. 114, B07405 (2009).
87. Marone, C. J. Laboratory-derived friction laws and their application to seismic faulting. Annu. Rev. Earth Pl. Sc. 26, 643–696 (1998).
88. Peng, Z. & Zhao, P. Migration of early aftershocks following the 2004 Parkfield earthquake. Nature Geosci. 2, 877–881 (2009).
89. Vidale, J. E. & Shearer, P. M. A survey of 71 earthquake bursts across southern California: Exploring the role of pore fluid pressure fluctuations and aseismic slip as drivers. J. Geophys. Res. 111, B05312 (2006).
90. Lohman, R. B. & McGuire, J. J. Earthquake swarms driven by aseismic creep in the Salton Trough, California. J. Geophys. Res. 112, B04405 (2007).
review article NATure geoScIeNce doi: 10.1038/ngeo940
ngeo_940_SEP10.indd 606 19/8/10 11:37:40
© 20 Macmillan Publishers Limited. All rights reserved10

nature geoscience | VOL 3 | SEPTEMBER 2010 | www.nature.com/naturegeoscience 607
91. Nadeau, R. M., Foxall, W. & McEvilly, T. V. Clustering and periodic recurrence of microearthquakes on the San Andreas fault at Parkfield, California. Science
267, 503–507 (1995).92. Wei, M., Sandwell, D. & Fialko, Y. A silent Mw 4.7 slip event of October
2006 on the Superstition Hills fault, southern California. J. Geophys. Res. 114, B07402 (2009).
93. Wiens, D. A., Anandakrishnan, S., Winberry, J. P. & King, M. A. Simultaneous teleseismic and geodetic observations of the stick–slip motion of an Antarctic ice stream. Nature 453, 770–775 (2008).
94. Schaeffer, D. G. & Iverson, R. M. Steady and intermittent slipping in a model of landslide motion regulated by pore-pressure feedback. SIAM J. Appl. Math. 69, 769–786 (2008).
95. Schulz, W. H., Kean, J. W. & Wang, G. Landslide movement in southwest Colorado triggered by atmospheric tides. Nature Geosci. 2, 863–866 (2009).
96. Ide, S., Beroza, G. C., Shelly, D. R. & Uchide, T. A scaling law for slow earthquakes. Nature 447, 76–79 (2007).
97. Roeloffs, E. A. Evidence for aseismic deformation rate changes prior to earthquakes. Annu. Rev. Earth Pl. Sc. 34, 591–627 (2006).
98. McCausland, W. A., Roeloffs, E. & Silver, P. New insights into Cascadia slow slip events using Plate Boundary Observatory borehole strainmeters. Eos 89 (suppl.), G21B-0691 (2008).
99. Perfettini, H., Avouac, J. P. & Ruegg, J. C. Geodetic displacements and aftershocks following the 2001 Mw = 8.4 Peru earthquake: Implications for the
mechanics of the earthquake cycle along the subduction zones. J. Geophys. Res. 109, B09404 (2005).
100. Rubinstein, J. L., Shelly, D. R. & Ellsworth, W. L. in Non-volcanic Tremor: A Window into the Roots of Fault Zones, in New Frontiers in Integrated Solid Earth Sciences (eds Cloetingh, S. & Negendank, J.) 287–314 (Springer, 2010).
acknowledgementsWe thank E. Brodsky, R. McCaffrey, S. Bilek and many others for sharing their measurements of moments and durations of regular earthquakes and slow-slip events. The manuscript benefits from comments by D. Shelly, J. McGuire, K. Obara, T. Melbourne and P. Segall. This work is supported by National Science Foundation (EAR-0809834 and EAR-0956051) and the US Geological Survey.
author contributionsBoth authors have contributed equally to the manuscript.
additional informationThe authors declare no competing financial interests. Supplementary information accompanies this paper on www.nature.com/naturegeoscience.
review articleNATure geoScIeNce doi: 10.1038/ngeo940
ngeo_940_SEP10.indd 607 19/8/10 11:37:41
© 20 Macmillan Publishers Limited. All rights reserved10

SUPPLEMENTARY INFORMATIONdoi: 10.1038/ngeo940
nature geoscience | www.nature.com/naturegeoscience 1
Supplementary Information
The Supplementary Information includes the following document:
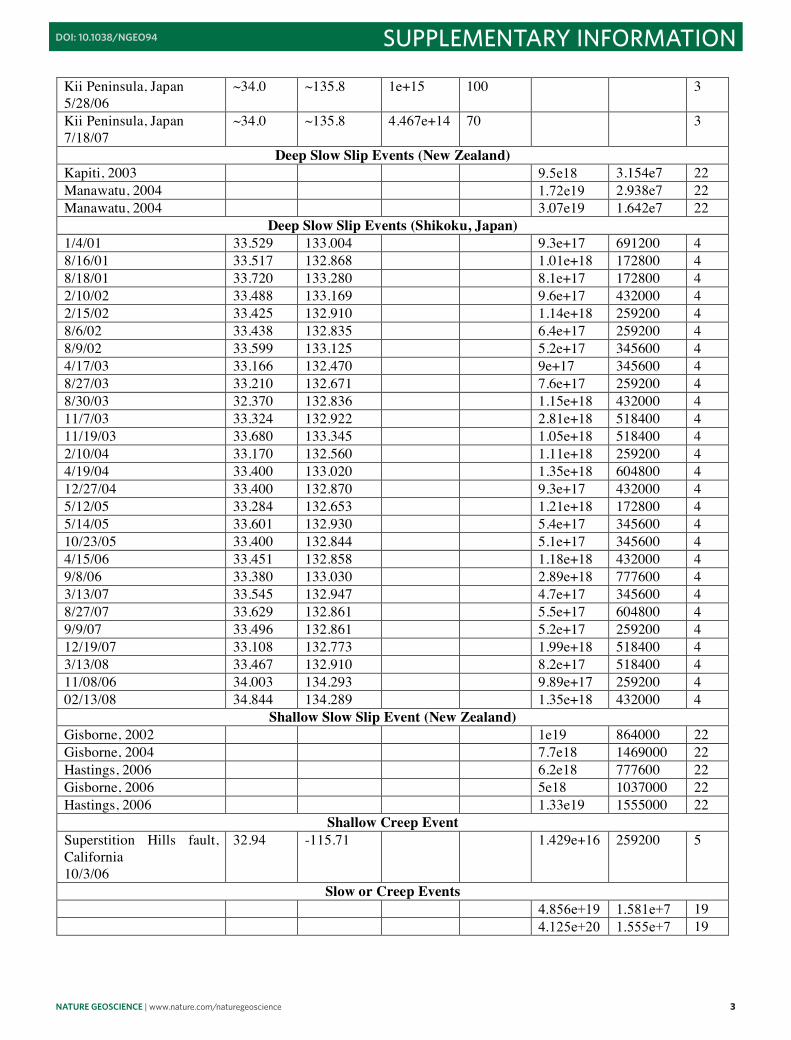
Peng_Gomberg_SuppTable_NGEO_2010.pdf: This table contains the estimates of slip event durations and moments displayed in Figure 5. For each event the table lists the event place name and date, epicentral coordinates, seismic moment and duration, geodetic moment and duration, and the number of the reference from which the information was obtained. The latter number corresponds to the references, with explanatory notes if applicable, listed below the table. Reference numbers also are noted on Figure 5.

2 nature geoscience | www.nature.com/naturegeoscience
SUPPLEMENTARY INFORMATION doi: 10.1038/ngeo940 1
Supplementary Table 1
This table contains the estimates of slip event durations and moments displayed in Figure
5. For each event the table lists the event place name and date, epicentral coordinates,
seismic moment and duration, geodetic moment and duration, and the number of the
reference from which the information was obtained. The latter number corresponds to the
references, with explanatory notes if applicable, listed below the table. Reference
numbers also are noted on Figure 5.
Figure 5 Measurements and References Source Location, Date Latitude Longitude Seismic
Moment
(N-m)
Seismic
Duration
(sec)
Geodetic
Moment
(N-m)
Geodetic
Duration
(sec)
Ref.
No,
Slow Earthquakes
Mid-Atlantic Ridge
3/20/78
0.90 -29.34 2.400e+18 20.00 1
Prince Edward Islands
8/21/78
-47.48 32.46 5.500e+18 28.00 1
East-Pacific Rise
12/25/78
10.41 -103.80 9.300e+18 28.00 1
Prince Edward Islands
2/18/79
-43.43 41.85 4.900e+18 18.00 1
Mid-Atlantic Ridge
6/10/79
8.17 -38.11 1.600e+18 26.00 1
South of Panama
6/27/79
7.05 -82.40 4.200e+18 36.00 1
Costa Rica
8/24/79
9.02 -83.31 5.800e+18 21.00 1
North-Atlantic Ridge
8/25/79
10.75 -41.70 1.590e+19 34.00 1
North Sumatra
9/29/79
1.23 94.24 2.210e+19 29.00 1
6.7e+20 200 19
3.5e+20 80 19
4e+20 45 19
3.7e+20 160 19
Kalapana, HI
11/29/75
18.86 -154.95 3.8e+20 72 17
Santa Maria Basin,
California 1/31/91
34.8 -120.4 4e+14 3 20
Very Low-frequency Earthquakes
Shikoku, Japan
3/14/07
33.618 132.357 3.162e+14 17 2
Shikoku, Japan
3/15/07
33.372 132.478 2.239e+14 12 2
Shikoku, Japan
3/15/07
33.436 132.478 6.310e+14 12 2
Shikoku, Japan
3/14/07
33.627 132.514 3.162e+14 18 2
nature geoscience | www.nature.com/naturegeoscience 3
SUPPLEMENTARY INFORMATIONdoi: 10.1038/ngeo94 2
Kii Peninsula, Japan
5/28/06
~34.0 ~135.8 1e+15 100 3
Kii Peninsula, Japan
7/18/07
~34.0 ~135.8 4.467e+14 70 3
Deep Slow Slip Events (New Zealand)
Kapiti, 2003 9.5e18 3.154e7 22
Manawatu, 2004 1.72e19 2.938e7 22
Manawatu, 2004 3.07e19 1.642e7 22
Deep Slow Slip Events (Shikoku, Japan)
1/4/01 33.529 133.004 9.3e+17 691200 4
8/16/01 33.517 132.868 1.01e+18 172800 4
8/18/01 33.720 133.280 8.1e+17 172800 4
2/10/02 33.488 133.169 9.6e+17 432000 4
2/15/02 33.425 132.910 1.14e+18 259200 4
8/6/02 33.438 132.835 6.4e+17 259200 4
8/9/02 33.599 133.125 5.2e+17 345600 4
4/17/03 33.166 132.470 9e+17 345600 4
8/27/03 33.210 132.671 7.6e+17 259200 4
8/30/03 32.370 132.836 1.15e+18 432000 4
11/7/03 33.324 132.922 2.81e+18 518400 4
11/19/03 33.680 133.345 1.05e+18 518400 4
2/10/04 33.170 132.560 1.11e+18 259200 4
4/19/04 33.400 133.020 1.35e+18 604800 4
12/27/04 33.400 132.870 9.3e+17 432000 4
5/12/05 33.284 132.653 1.21e+18 172800 4
5/14/05 33.601 132.930 5.4e+17 345600 4
10/23/05 33.400 132.844 5.1e+17 345600 4
4/15/06 33.451 132.858 1.18e+18 432000 4
9/8/06 33.380 133.030 2.89e+18 777600 4
3/13/07 33.545 132.947 4.7e+17 345600 4
8/27/07 33.629 132.861 5.5e+17 604800 4
9/9/07 33.496 132.861 5.2e+17 259200 4
12/19/07 33.108 132.773 1.99e+18 518400 4
3/13/08 33.467 132.910 8.2e+17 518400 4
11/08/06 34.003 134.293 9.89e+17 259200 4
02/13/08 34.844 134.289 1.35e+18 432000 4
Shallow Slow Slip Event (New Zealand)
Gisborne, 2002 1e19 864000 22
Gisborne, 2004 7.7e18 1469000 22
Hastings, 2006 6.2e18 777600 22
Gisborne, 2006 5e18 1037000 22
Hastings, 2006 1.33e19 1555000 22
Shallow Creep Event
Superstition Hills fault,
California
10/3/06
32.94 -115.71 1.429e+16 259200 5
Slow or Creep Events
4.856e+19 1.581e+7 19
4.125e+20 1.555e+7 19

4 nature geoscience | www.nature.com/naturegeoscience
SUPPLEMENTARY INFORMATION doi: 10.1038/ngeo940 3
9e+18 1.728e+6 19
6e+19 1.261e+8 19
1.512e+19 2.592e+7 19
1.26e+16 6.048e+5 19
1.8e+18 1.728e+6 19
1.8e+18 5.184e+6 19
1.134e+19 8.640e+5 19
7.875e+19 4.709e+7 19
Swarms
Wooded Island, WA 46.41 -119.28 6.410e+14 1.203e+7 6e+15 1.203e+7 6
Kilauea Volcano, HI
1/26/05
19.30 -155.15 1.8e+14 172800 6.8e+17 190100 7
Kilauea Volcano, HI
1/31/2010
19.30 -155.15 7.943e+17 129600 27
Brawley fault, CA, 1975 32.88 -115.48 4.624e+16 280800 8
West Moreland fault, CA,
1981
33.13 -115.63 6.383e+17 216000 8
Obsidian Buttes fault,
CA, 8/29/05
33.17 -115.63 1.023e+17 424800 8
Imperial fault, CA 2003 39.95 -115.55 7.328e+14 64800 8
Galapagos Ridge
transform, 2000
1.8 -90.9 9.016e+17 129600 8
Siqueiros transform, 2001 8.3 -103.5 7.586e+17 79200 8
Gofar transform, 2007 -4.6 -105.5 4.786e+16 144000 8
Earthquakes
Off San Andreas, CA
9/5/04 35.7685 -120.319
3.199e+11 0.056 9
Off San Andreas, CA
9/28/04 35.7784 -120.33
1.429e+13 0.0756 9
Off San Andreas, CA
9/28/04 35.7785 -120.33
2.851e+13 0.0625 9
Off San Andreas, CA
9/28/04 35.7818 -120.323
1.799e+12 0.0778 9
Off San Andreas, CA
9/28/04 35.7771 -120.329
2.851e+13 0.1036 9
Off San Andreas, CA
9/28/04 35.7983 -120.342
1.799e+12 0.0684 9
Off San Andreas, CA
9/29/04 35.7827 -120.334
1.274e+12 0.068 9
Off San Andreas, CA
9/30/04 35.7812 -120.323
4.519e+11 0.0812 9
Off San Andreas, CA
10/7/04 35.781 -120.332
3.589e+12 0.0775 9
Off San Andreas, CA
10/18/04 35.7826 -120.334
1.274e+12 0.0669 9
Off San Andreas, CA
10/18/04 35.7822 -120.334
4.519e+11 0.0596 9
Off San Andreas, CA
10/19/04 35.7699 -120.321
1.799e+12 0.0611 9

nature geoscience | www.nature.com/naturegeoscience 5
SUPPLEMENTARY INFORMATIONdoi: 10.1038/ngeo94 4
Off San Andreas, CA
10/20/04 35.7978 -120.341
5.070e+12 0.07 9
Off San Andreas, CA
10/29/04 35.781 -120.333
1.135e+14 0.0887 9
Off San Andreas, CA
11/3/04 35.7667 -120.318
3.199e+11 0.06 9
Off San Andreas, CA
9/20/01 35.9347 -120.487
2.541e+12 0.0388 9
Off San Andreas, CA
9/28/04 35.9345 -120.487
4.519e+11 0.0392 9
Off San Andreas, CA
9/28/04 35.9347 -120.487
5.070e+12 0.0412 9
Off San Andreas, CA
10/2/04 35.9354 -120.487
7.161e+12 0.0396 9
Off San Andreas, CA
1/8/05 35.9346 -120.487
5.070e+12 0.048 9
Off San Andreas, CA
2/4/04 36.0951 -120.66
1.603e+11 0.044 9
Off San Andreas, CA
2/9/05 36.095 -120.66
1.274e+12 0.0585 9
Off San Andreas, CA
2/9/05 36.0953 -120.66
1.603e+11 0.0516 9
Off San Andreas, CA
3/11/06 36.0362 -120.596
5.248e+12 0.0668 9
Off San Andreas, CA
1/17/07 36.037 -120.595
3.020e+12 0.0607 9
San Andreas fault, CA
6/4/02 35.932 -120.676
3.589e+12 0.0325 9
San Andreas fault, CA
6/4/02 35.932 -120.676
3.589e+12 0.0532 9
San Andreas fault, CA
9/6/04 36.148 -120.653
2.018e+13 0.0924 9
San Andreas fault, CA
9/26/04 36.143 -120.666
4.519e+14 0.1755 9
San Andreas fault, CA
9/27/04 36.154 -120.658
2.018e+13 0.0811 9
San Andreas fault, CA
9/27/04 36.152 -120.658
3.589e+12 0.0788 9
San Andreas fault, CA
10/3/04 36.153 -120.658
2.018e+13 0.074 9
San Andreas fault, CA
6/27/06 36.065 -120.192
7.763e+13 0.1039 9
San Andreas fault, CA
12/15/06 36.17 -120.298
5.248e+12 0.1086 9
San Andreas fault, CA
3/12/07 35.938 -120.691
1.567e+12 0.0256 9
San Andreas fault, CA
9/20/07 36.064 -120.194
3.846e+12 0.1606 9
M7.6 Chi-Chi, Taiwan 23.77 120.98 3.16e+20 28 10

6 nature geoscience | www.nature.com/naturegeoscience
SUPPLEMENTARY INFORMATION doi: 10.1038/ngeo940 5
9/20/99
M7.1 Hector Mine, CA
10/16/99
34.597 -116.27 5.62e+19 14 11
M7.9 Denali, AK
11/3/02
63.520 147.530 8.91e+20 120 12
M6.5 San Simeon, CA
12/22/03
35.704 - 121.096 7.1e+18 11 13
M6.0 Parkfield, CA
9/28/04
35.815 -120.374 1.3e+18 14 14
Aftershock Sequences
M6.5 Chengkung, Taiwan
12/10/03
23.065 121.357 6.3e+17 8.64e+7 6.2e+18 8.64e+7 15
M7.9 Denali, AK
11/3/02
63.520 147.530 2.228e+18 8.64e+7 16
M6.0 Parkfield, CA
9/28/04
35.815 -120.374 1e+17 8.64e+7 2.8e+18 8.64e+7 161
5
M7.1 Hector Mine, CA
10/16/99
34.597 -116.27 1.135e+18 8.64e+7 16
M7.6 Chi-Chi, Taiwan
9/20/99
23.77 120.98 1.24e+20 8.64e+7 16
M6.5 San Simeon, CA
12/22/03
35.704 - 121.096 1.2e+17 8.64e+7 16
M6.4 Nima-Gaize, Tibet
1/9/08
32.30 85.32 1.9e+17 6.765e+6 1.17e+18 6.765e+6 23
Landslide
Mantaro, Peru
4/25/1974
-12.6 -74.6 1.26e+15 240 25
Mount St. Helens, WA
5/18/1980
46.214 -122.194 4e+13 100 26
Glacial Slip
Dall Glacier, AK
9/2/99
62.66 -152.43 4.027e+16 40 18
Whillans Ice Stream,
Antarctica
-84.38 -158.84 1.1e+15 1500 4.9e+19 1500 24
(1) Beroza, G. and Jordan, T. Searching for slow and silent earthquakes using free
oscillations. J. Geophys. Res 95, 2485-2510 (1990).
(2) Matsuzawa, T., Obara, K. & Maeda, T. Source duration of deep very-low-frequency
earthquakes in western Shikoku, Japan. J. Geophys. Res. in press (2010).
(3) Ide, S., Imanishi, K., Yoshida, Y., Beroza, G. C. & Shelly, D. R. Bridging the gap
between seismically and geodetically detected slow earthquakes. Geophys. Res. Lett. 35, L10305 (2008).
(4) Sekine, S., Hirose, H. & Obara, K. Along-strike variations in short-term slow slip
events in the southwest Japan subduction zone. J. Geophys. Res., in press (2010).
(5) Wei, M., Sandwell, D. & Fialko, Y. A silent Mw4.7 slip event of October 2006 on the
Superstition Hills Fault, southern California. J. Geophys. Res. 114, B07402 (2009).
Estimate is based on the statement “more than 27 mm over the next 14 days, with 85%
of the amplitude manifested in the first 3 days”.

nature geoscience | www.nature.com/naturegeoscience 7
SUPPLEMENTARY INFORMATIONdoi: 10.1038/ngeo94 6
(6) Wicks, C.W., Thelen, W. Weaver, C., Gomberg, J., Rohay, A. and Bodin, P. InSAR
observations of aseismic slip associated with an earthquake swarm in the Columbia
River basalts, in preparation (2010).
(7) Segall, P., Desmarais, E.K., Shelly, D., Miklius, A. & Cervelli, P. Earthquakes
triggered by silent slip on the Kilauea volcano, Hawaii, Nature 442, 71-74, (2006).
(8) Roland, E. & McGuire, J.J. Earthquake swarms on transform faults, Geophys. J. Int.
178, 1677-1690 (2009).
(9) Harrington, R. & Brodsky, E. Source duration scales with magnitude differently for
earthquakes on the San Andreas fault and on secondary faults in Parkfield, California. Bull. Seismol. Soc. Am 99, 2323-2334 (2009).
(10) Ma, K.F., Mori, J., Lee, S.J. & Yu, S. B. Spatial and temporal distribution of slip for
the 1999 Chi-Chi, Taiwan, earthquake. Bull. Seismol. Soc. Am. 91, 1069-1087 (2001).
(11) Ji, C., Wald, D.J. & Helmberger, D.V. Source description of the 1999 Hector Mine,
California, earthquake, Part II: Complexity of slip history. Bull. Seismol. Soc. Am. 92,
1208-1226 (2002).
(12) Ozacar, A.A., Beck, S.L. & Christensen, D.H. Source process of the 3 November
2002 Denali fault earthquake (central Alaska) from teleseismic observations. Geol. Res.
Letts. 30, 1638 (2003).
(13) McLaren, M.K., et al. Complex faulting associated with the 22 December 2003 Mw
6.5 San Simeon, California, earthquake, aftershocks, and postseismic surface
deformation. Bull. Seismol. Soc. Am. 98, 1659-1680 (2008).
Duration is calculated from an average rupture velocity of 2.8 km/s and a 30 km long
fault (length estimated in this paper).
(14) Hartzell, S., Liu, P., Mendoza, C., Ji, C. & Larson, K.M. Stability and uncertainty of
finite-fault slip inversions: Application to the 2004 Parkfield, California, earthquake.
Bull. Seismol. Soc. Am. 97, 1911-1934 (2007).
Duration calculated from an average rupture velocity of 2.8 km/s and a 40 km long
fault (length and rupture velocity estimated in this paper).
(15) Savage, J.C. and Yu, S.B. Postearthquake relaxation and aftershock accumulation
linearly related after the 2003 M 6.5 Chengkung, Taiwan, and the 2004 M 6.0 Parkfield,
California, earthquakes. Bull. Seismol. Soc. Am. 97, 1632-1645 (2007).
Aftershock sequence cumulative moments are measured from the plots in Savage et al.
(2007) and Savage and Yu (2007) somewhat arbitrarily at 100 days. In all cases, the
difference between the moment at 100 days differs insignificantly from that at 1000
days.
(16) Savage, J. C., Svarc, J. L. & Yu, S.B. Postseismic relaxation and aftershocks. J.
Geophys. Res. 112, B06406 (2007).
(17) Nettles, M. & Ekstrom, G. Long-period source characteristics of the 1975 Kalapana,
Hawaii, earthquake. Bull. Seismol. Soc. Am. 94, 422–429 (2004).
(18) Ekstrom, G., Nettles, M. & Abers, G. Glacial earthquakes. Science 302, 622-624
(2003).
(19) Brodsky, E. E. & Mori, J. Creep events slip less than ordinary earthquakes. Geophys.
Res. Lett. 34, L16309 (2007).
The observations in this paper are a compilation from many sources and thus, events
are distributed among a variety of tectonic environments, depths, etc. Creep events
are those in which slip accrues over days to years and are thus observed geodetically.

8 nature geoscience | www.nature.com/naturegeoscience
SUPPLEMENTARY INFORMATION doi: 10.1038/ngeo940 7
‘Tsunami’ earthquakes are those that rupture the ocean bottom more slowly than ‘fast’
earthquakes. ‘Fast’ earthquakes shown in Figure 3 are not listed in the table because
they are too numerous, and all come from only two sources: 1) Abercrombie, R. E. &
Rice, J. R. Can observations of earthquake scaling constrain slip weakening? Geophys.
J. Int. 162, 406– 424 (2005), and 2) Venkataraman, A., et al. Measurements of spectral
similarity for microearthquakes in western Nagano, Japan. J. Geophys. Res. 111,
B03303 (2006).
(20) Kanamori, H. & Hauksson, E. A slow earthquake in the Santa Maria Basin,
California. Bull. Seismol. Soc. Am. 82, 2087-2096 (1992).
(21) Bilek, S. L., Lay, T. & Ruff, L. J. Radiated seismic energy and earthquake source
duration variations from teleseismic source time functions for shallow subduction zone
thrust earthquakes. J. Geophys. Res. 109, B09308 (2004).
(22) McCaffrey, R., Wallace, L. & Beavan, J. Slow slip events, temperature and
interseismic coupling at the Hikurangi subduction zone, New Zealand. EOS Trans. Am.
Geohys. Union 88(52), Fall Meet. Suppl., Abstract T21A-0367 (2007).
(23) Ryder, J., Burgmann, R. & Sun, J. Tandem afterslip on connected fault planes
following the 2008 Nima-Gaize (Tibet) earthquake. J. Geophys. Res. 115, B03404
(2010).
Postseismic deformation (seismic and aseismic) begins after the M5.9 aftershock that
occurs 7 days after the mainshock. Postseismic seismic deformation includes only the
largest, M5.5 aftershock, although a few M4.9s occurred and the post-seismic
deformation is fit with an exponential that has a time constant of 34 days with the
duration calculated as the time to reach 90% of the total postseismic slip.
(24) Wiens, D.A., Anandakrishnan, S., Winberry, J.P. & King, M.A. Simultaneous
teleseismic and geodetic observations of the stick-slip motion of an Antartic ice stream, Nature 453, 770-774 (2008).
(25) Berrocal, J., Espinosa, A.F. & Galdos, J. Seismological and geological aspects of
the Mantaro landslide in Peru. Nature 275, 533-536 (1978).
(26) Kanamori, H. and Given, J. Analysis of long-period seismic waves excited by the
May 18, 1980 eruption of Mount St. Helens – A terrestrial monopole? J. Geophys. Res.
87, 5422-5432 (1982).
(27) Poland, M., Mikulius, A., Wilson, D. & Okubo, P. Slow slip event at Kiluea
volcano. EOS Trans. Am. Geophys. Union 91, 118-119 (2010).