an introduction to remote sensing - nasa arset · an introduction to remote sensing nasa remote...
TRANSCRIPT
An Introduction to Remote Sensing
NASA Remote Sensing Training Geo Latin America and Caribbean Water Cycle capacity Building Workshop
Colombia, November 28-December 2, 2011
ARSET Applied REmote Sensing Training A project of NASA Applied Sciences
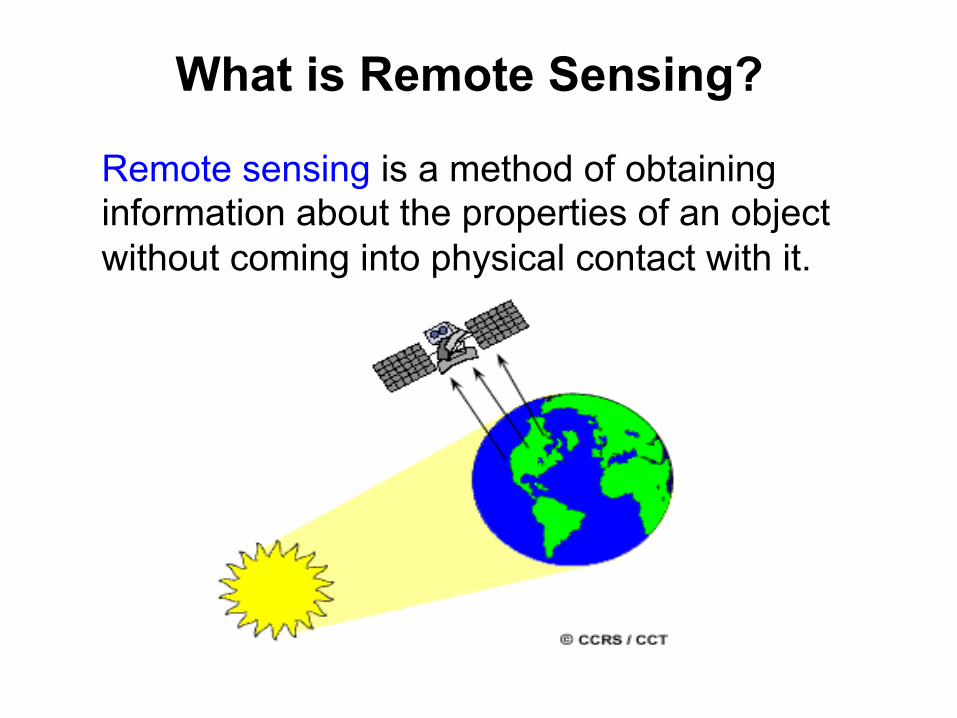
What is Remote Sensing?
Remote sensing is a method of obtaining information about the properties of an object without coming into physical contact with it.

Why use Remote Sensing to Study the Earth ?
• Provides visual Global information • Complements ground-monitoring networks or
provides information where there are no ground-based measurements
• Provides advance warning of impending
environmental events and disasters.

How Do Satellites Make Measurements?
• Passive satellite sensors measure radiation reflected or emitted by the earth-atmosphere system
- Radiance • Radiance is converted to a
geophysical parameter. Examples: Accumulated Rainfall Snow Cover
Accumulated Rainfall Guatemala

Example of Remote Sensing Product Precipitation Radar from TRMM
(Guatemala)
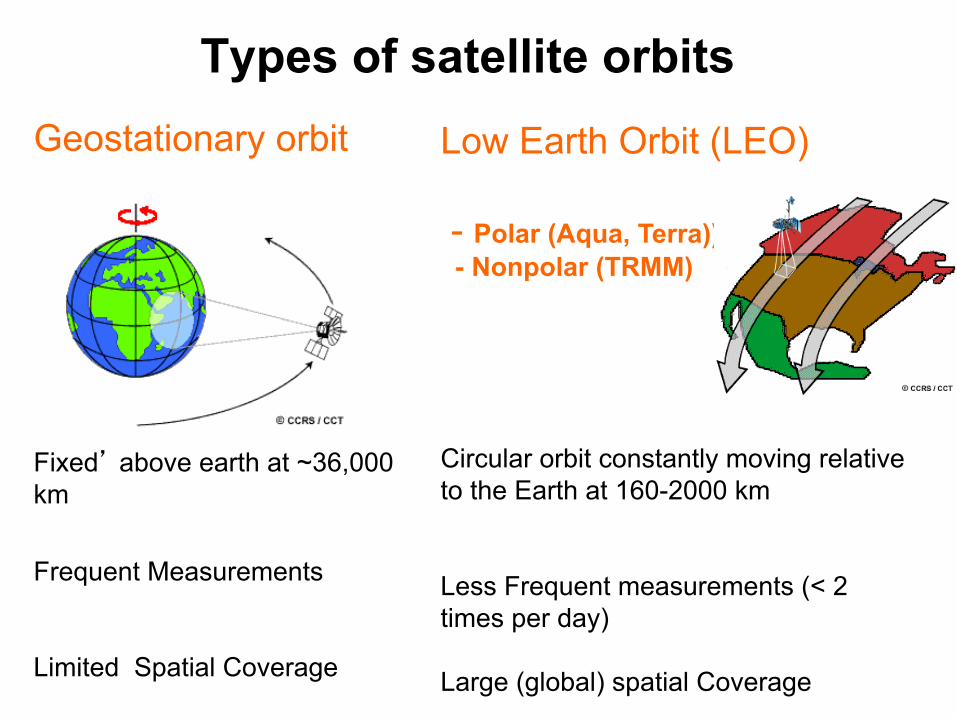
Types of satellite orbits Geostationary orbit Fixed’ above earth at ~36,000 km Frequent Measurements Limited Spatial Coverage
Low Earth Orbit (LEO) - Polar (Aqua, Terra)) - Nonpolar (TRMM) Circular orbit constantly moving relative to the Earth at 160-2000 km Less Frequent measurements (< 2 times per day) Large (global) spatial Coverage

Low Earth Orbit (LEO): Orbiting at an altitude of 160-2,000 km.
7
Path of Satellite
Low-Earth Orbits (LEO)
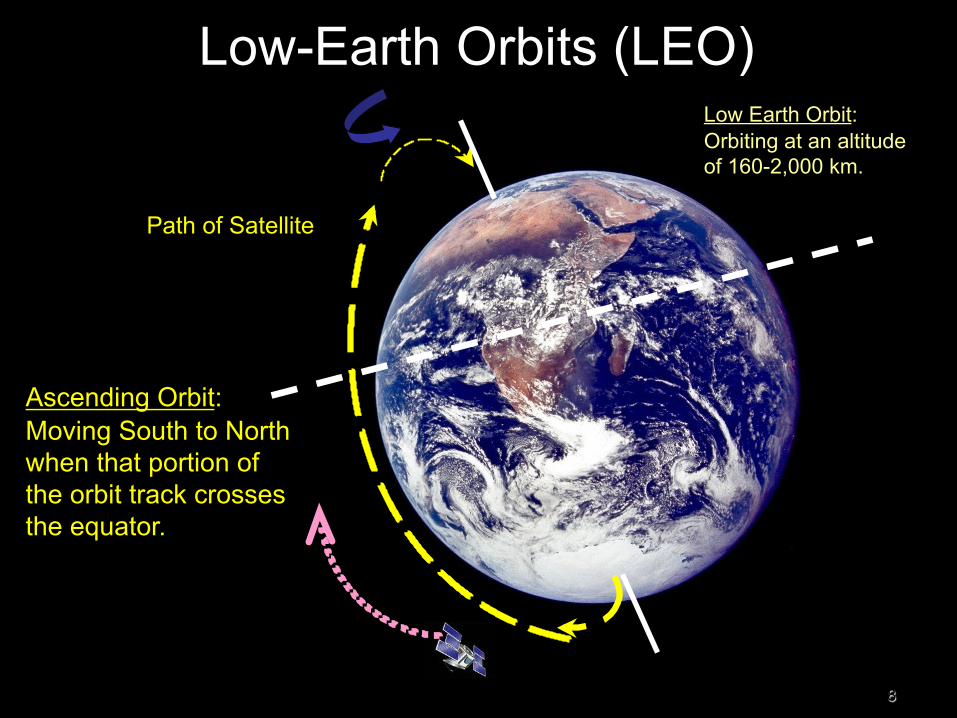
Ascending Orbit: Moving South to North when that portion of the orbit track crosses the equator.
Low Earth Orbit: Orbiting at an altitude of 160-2,000 km.
8
Path of Satellite
Low-Earth Orbits (LEO)
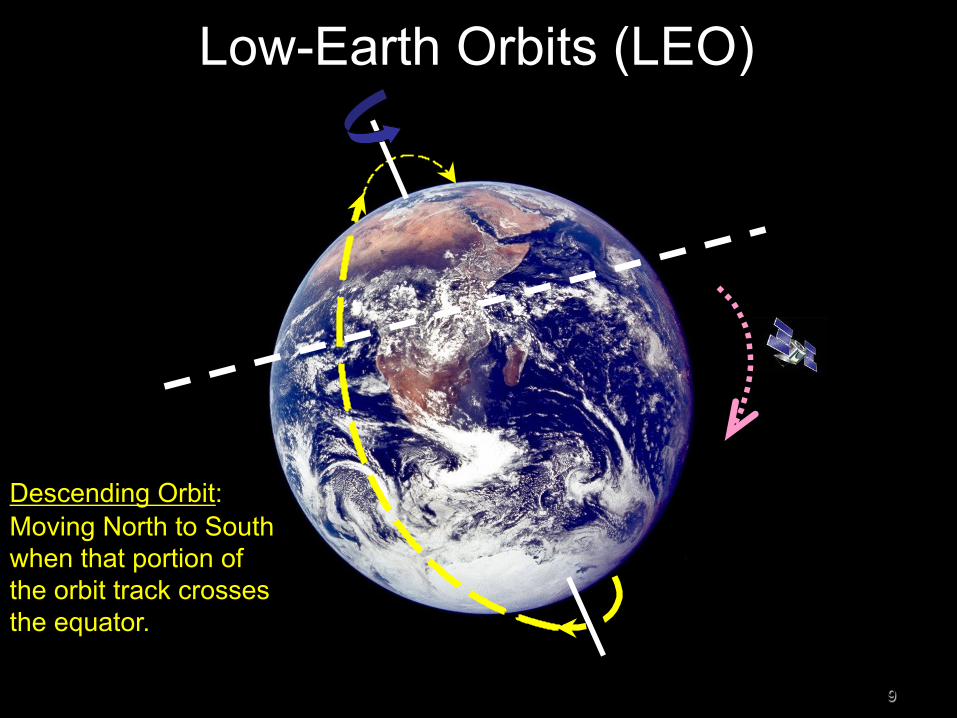
Descending Orbit: Moving North to South when that portion of the orbit track crosses the equator.
9
Low-Earth Orbits (LEO)

Aqua (“ascending” orbit) day time
Terra (“descending”) Day time
LEO Polar Orbiting

• Near-polar, sun-synchronous, orbiting the Earth every 98.8 minutes,
crossing the equator going north (daytime ascending) at 1:30 p.m. and going south (night time descending) at 1:30 a.m.
• The orbit track changes every day but will repeat on a 16 day cycle. This is true for Aqua, Terra, and TRMM.
Aqua’s Orbit

Terra - Descending Aqua - Ascending
When looking at an image of a piece of the orbit the two sensors will have opposite ‘tilts’.
Daytime Orbits
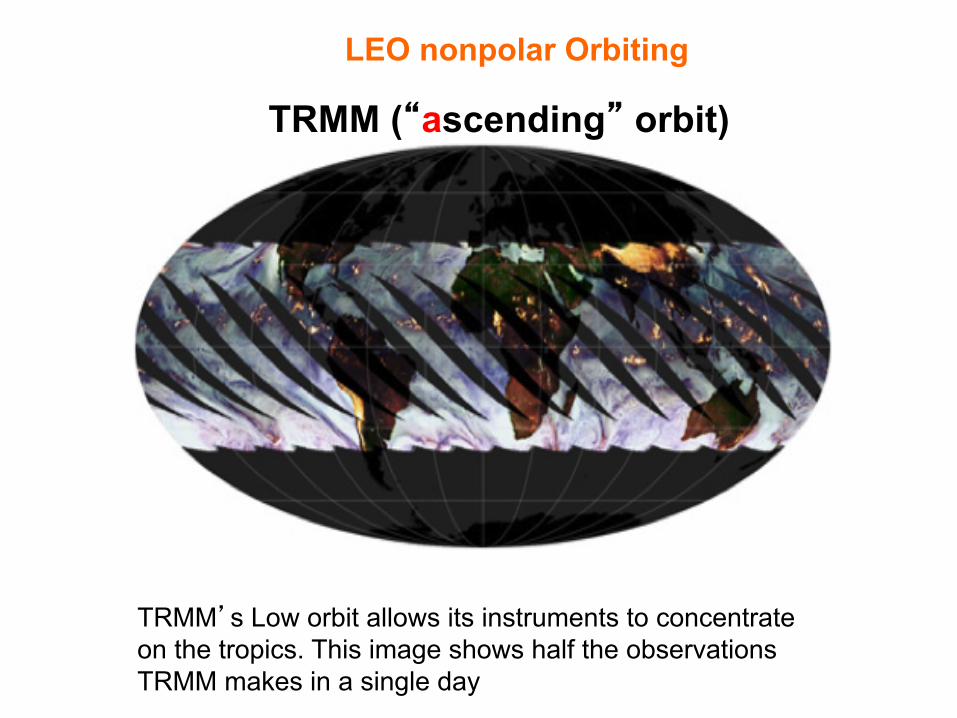
TRMM (“ascending” orbit)
LEO nonpolar Orbiting
TRMM’s Low orbit allows its instruments to concentrate on the tropics. This image shows half the observations TRMM makes in a single day
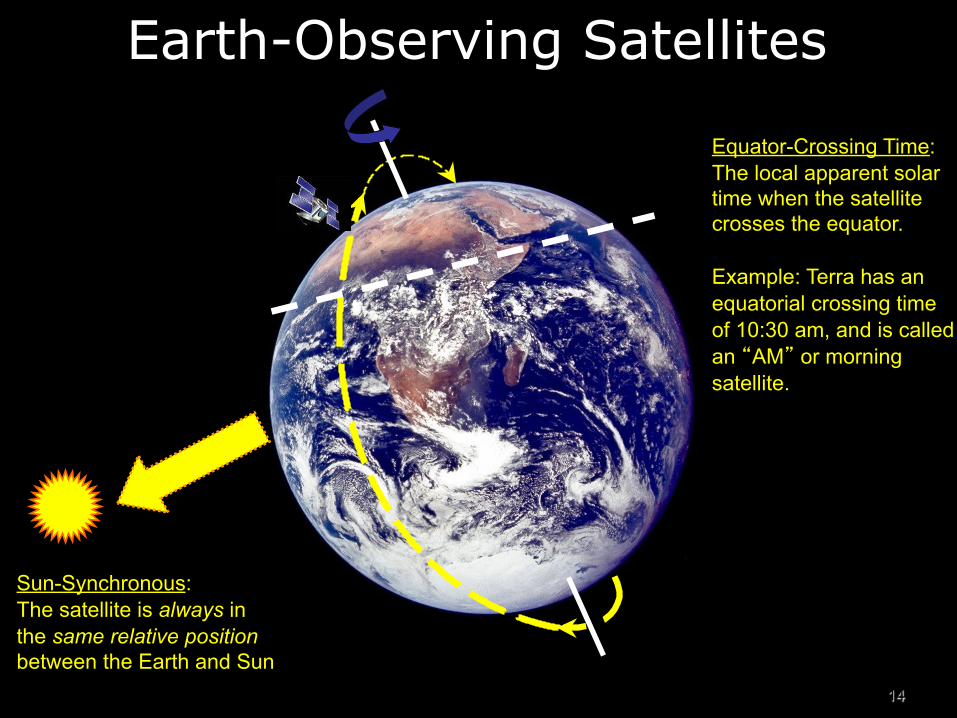
Earth-Observing Satellites
Sun-Synchronous: The satellite is always in the same relative position between the Earth and Sun.
Equator-Crossing Time: The local apparent solar time when the satellite crosses the equator. Example: Terra has an equatorial crossing time of 10:30 am, and is called an “AM” or morning satellite.
14
15
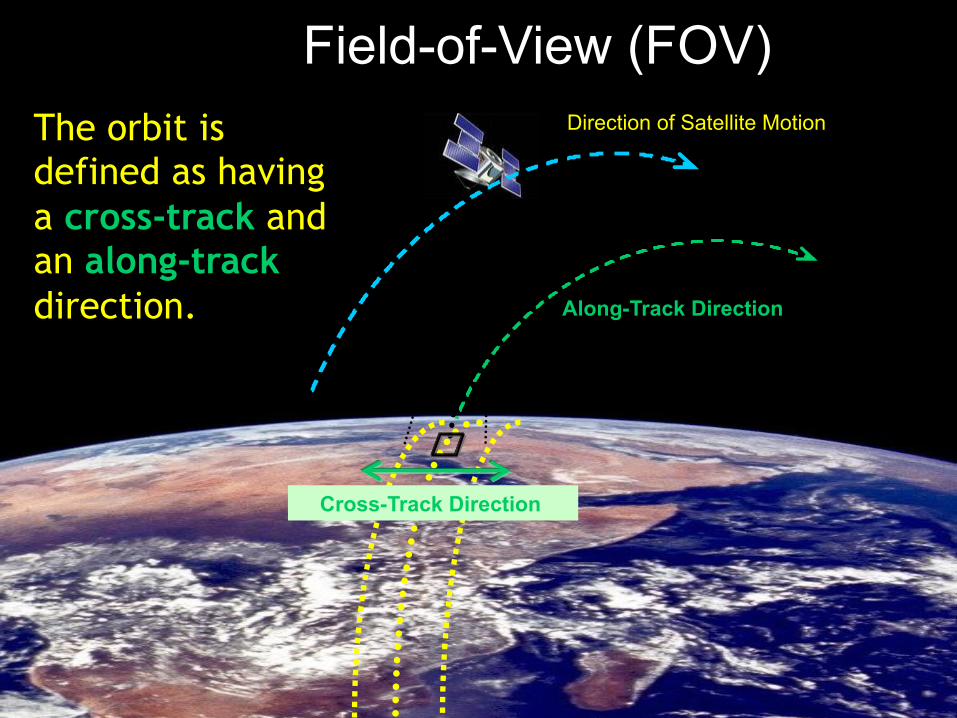
The orbit is defined as having a cross-track and an along-track direction.
Direction of Satellite Motion
Along-Track Direction
Cross-Track Direction
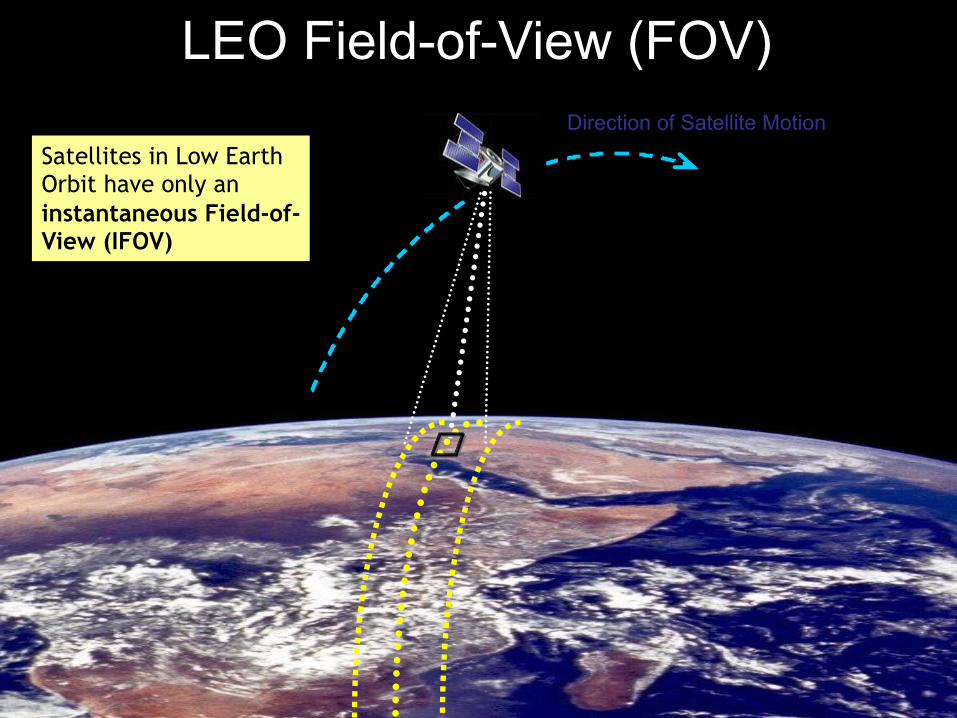
LEO Field-of-View (FOV)
16
Direction of Satellite Motion
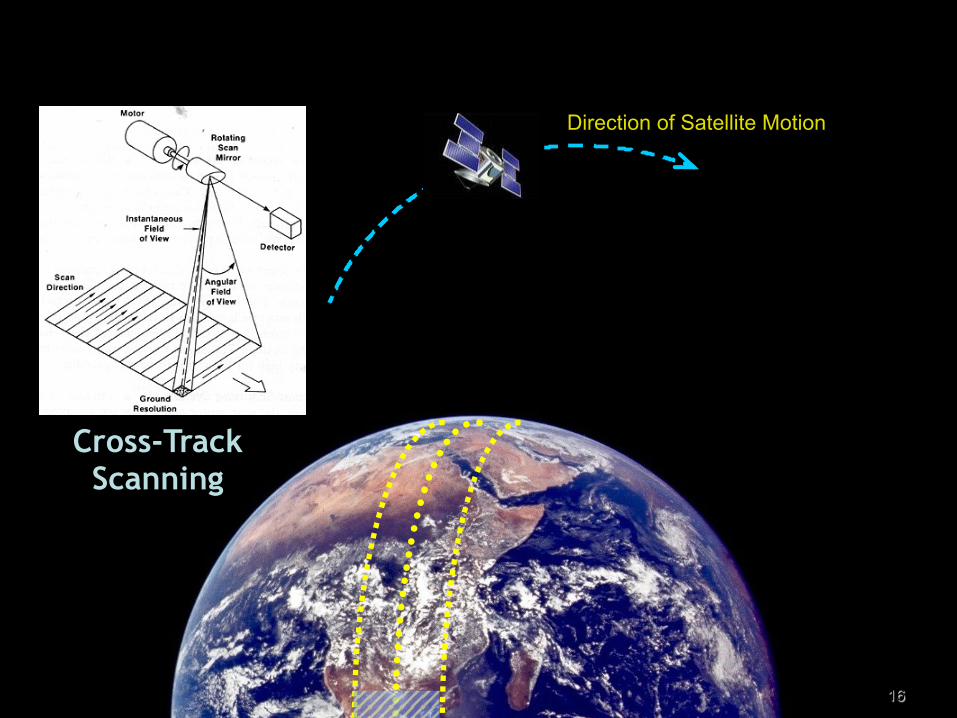
Cross-Track Scanning
“Cross-Track Scanning,” Scan mirror swings back and forth. Sensor observes pixels in sequence across track and along the direction of the satellite’s motion.
Earth-Observing Satellites
17
Direction of Satellite Motion Satellites in Low Earth Orbit have only an instantaneous Field-of-View (IFOV)
LEO Field-of-View (FOV)
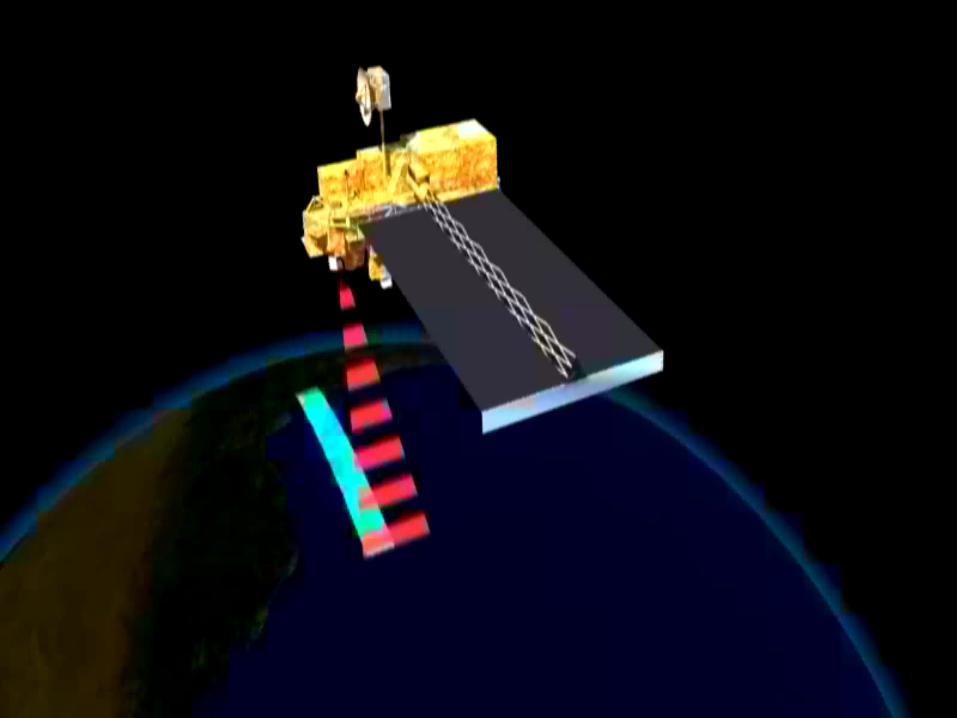
MODIS Orbit in 3D

Remote Sensing Resolutions
• Spatial resolution • Temporal resolution • Spectral resolution
• Radiometric resolution
Spatial Resolution
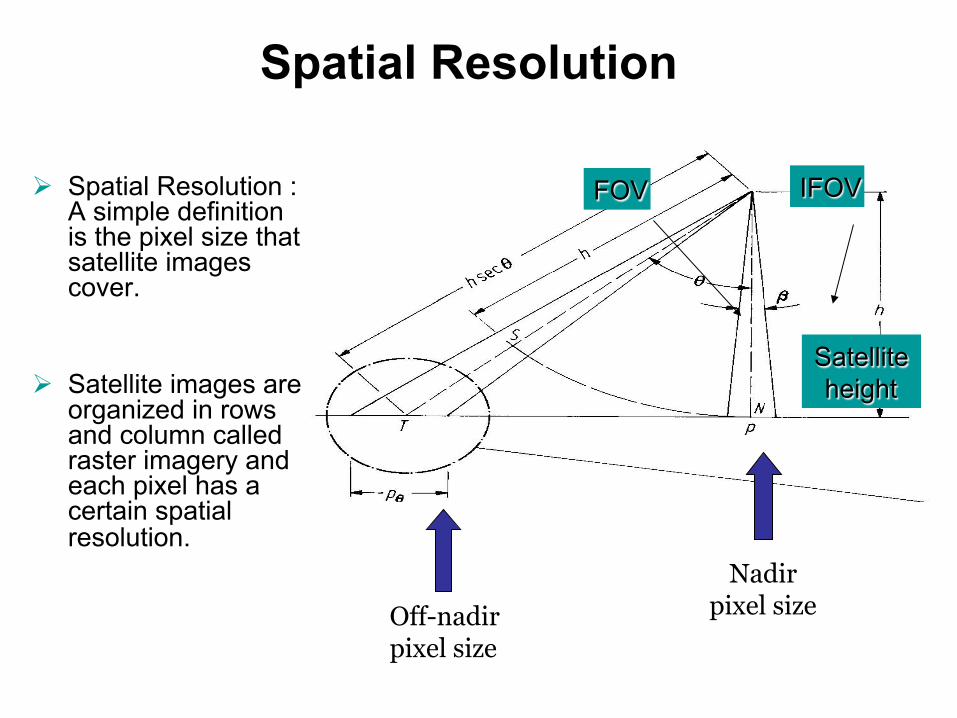
Ø Spatial Resolution : A simple definition is the pixel size that satellite images cover.
Ø Satellite images are
organized in rows and column called raster imagery and each pixel has a certain spatial resolution.
Nadir pixel size Off-nadir
pixel size
FOV IFOV
Satellite height

cylindrical isotropic projection
Native satellite view vs. map projection
increasing pixel size
bow-tie effect Flight direction
Sca
n di
rect
ion
“BowTie” effect
22
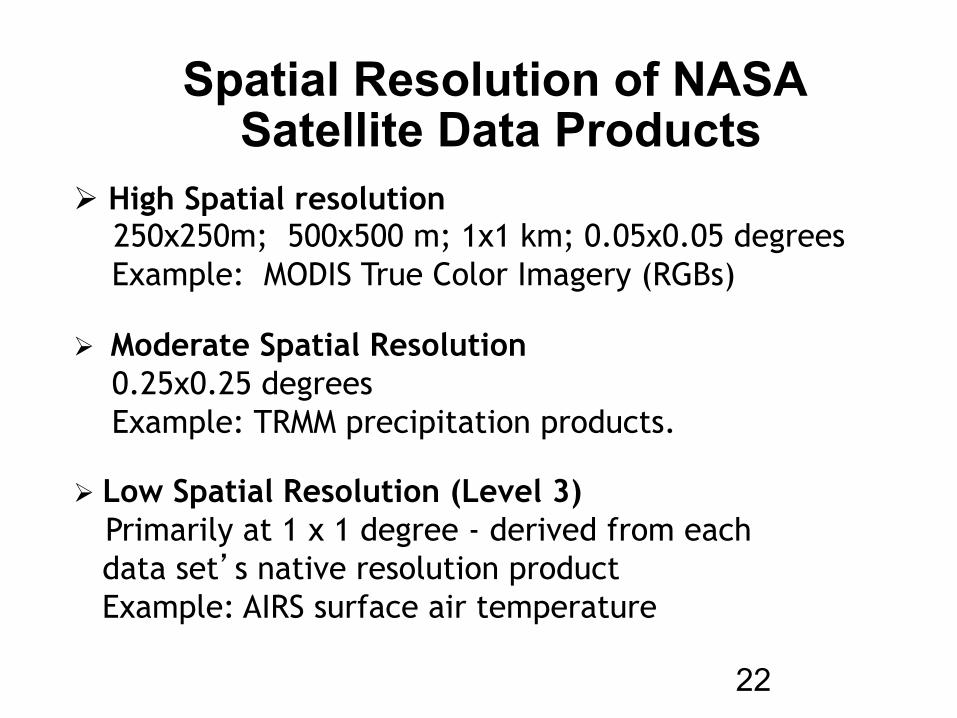
Spatial Resolution of NASA Satellite Data Products
Ø High Spatial resolution 250x250m; 500x500 m; 1x1 km; 0.05x0.05 degrees Example: MODIS True Color Imagery (RGBs) Ø Moderate Spatial Resolution 0.25x0.25 degrees Example: TRMM precipitation products. Ø Low Spatial Resolution (Level 3) Primarily at 1 x 1 degree - derived from each data set’s native resolution product Example: AIRS surface air temperature
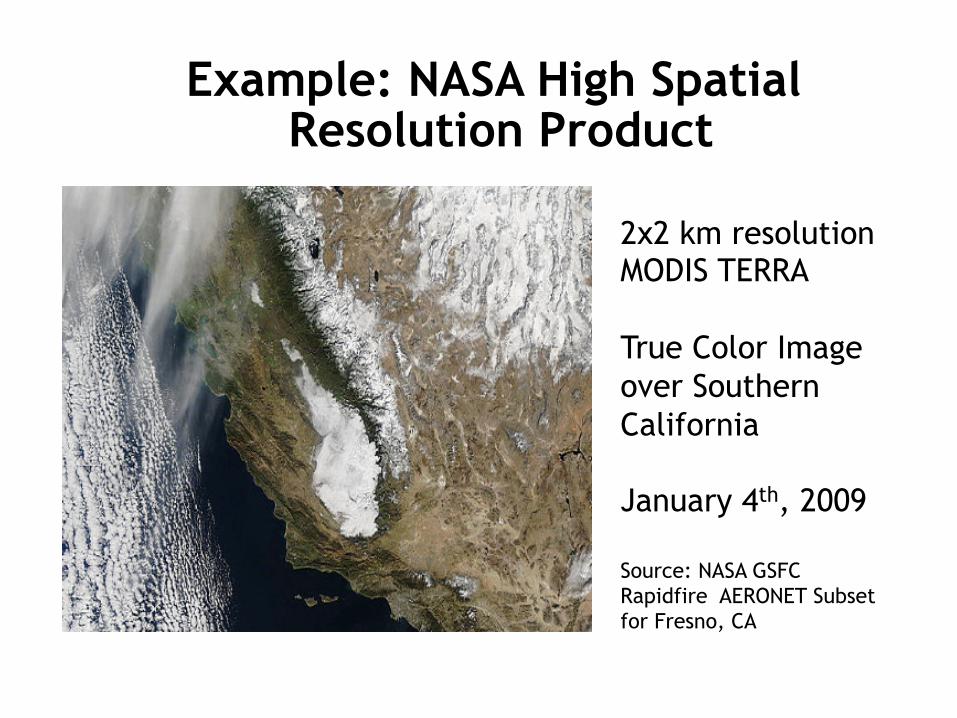
Example: NASA High Spatial Resolution Product
2x2 km resolution MODIS TERRA True Color Image over Southern California January 4th, 2009 Source: NASA GSFC Rapidfire AERONET Subset for Fresno, CA

Example: NASA Moderate Spatial Resolution Product
0.25x0.25 degree TRMM Accumulated Rainfall over Guatemala
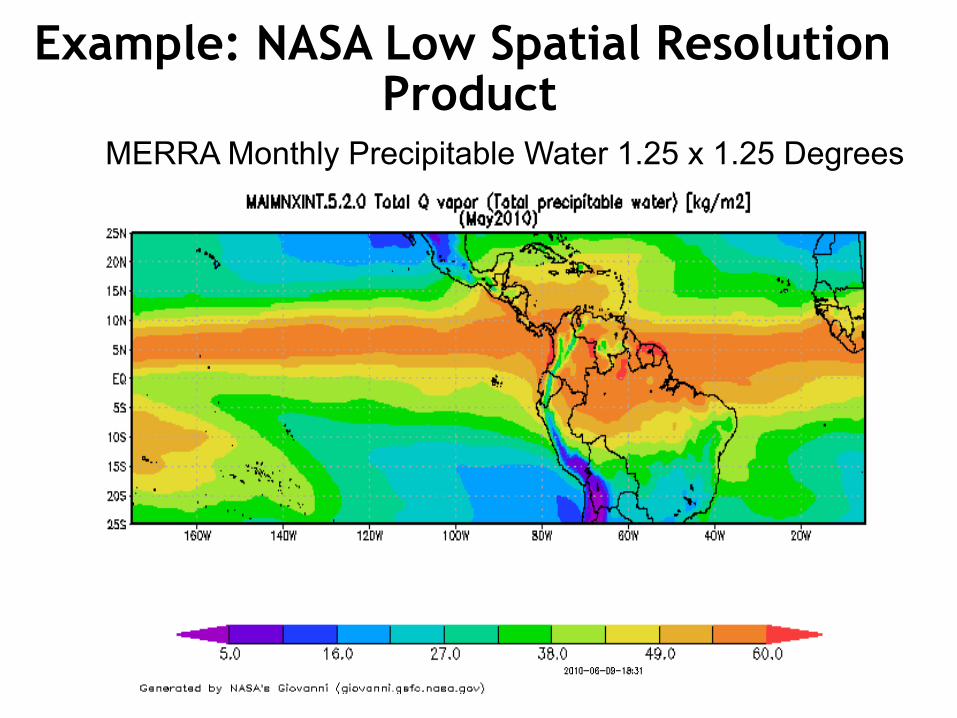
Example: NASA Low Spatial Resolution Product
MERRA Monthly Precipitable Water 1.25 x 1.25 Degrees

Temporal Resolution of Remote Sensing Data
The frequency at which data are obtained is determined by: - Type and height of orbit
- Size of measurement swath
Temporal resolution of Polar Orbiting Satellites
Example: Terra, Aqua
• Observations available only at the time of the satellite overpass.
• IR based observations available 2X a day (AIRS)
• Visible observations available 1X a day • Polar regions may have several observations
per day.
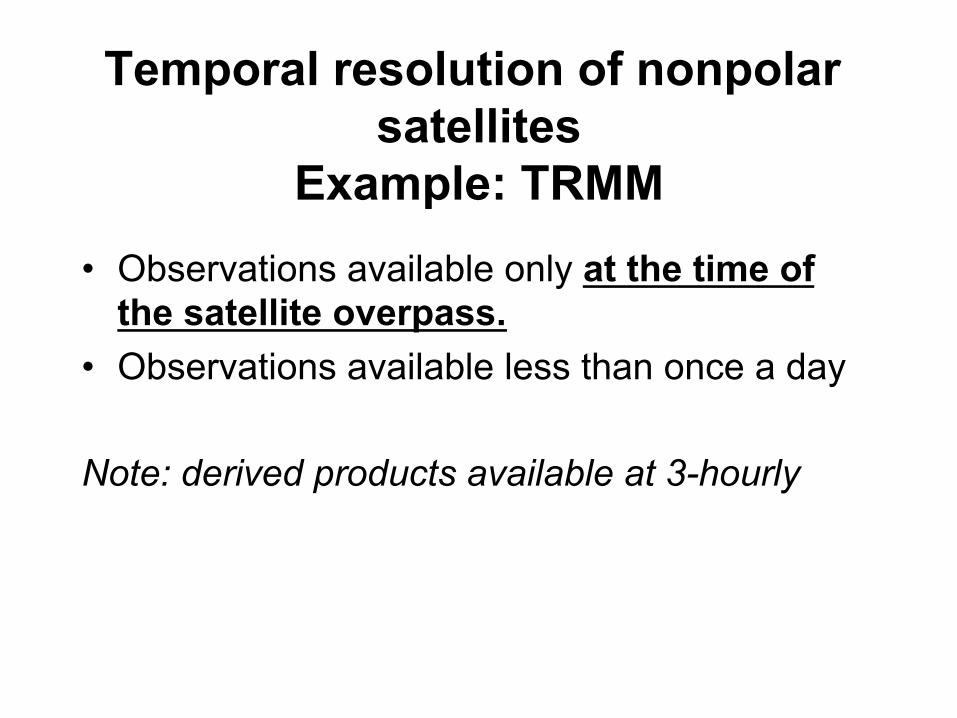
Temporal resolution of nonpolar satellites
Example: TRMM • Observations available only at the time of
the satellite overpass. • Observations available less than once a day Note: derived products available at 3-hourly

Remote Sensing – Resolutions
Spectral resolution – The number and range of spectral bands.
More bands = More information
Radiometric resolution – The bandwidth of the individual spectral bands. Important for avoiding or taking advantage of “atmospheric windows”
Satellite data levels of processing and formats
31
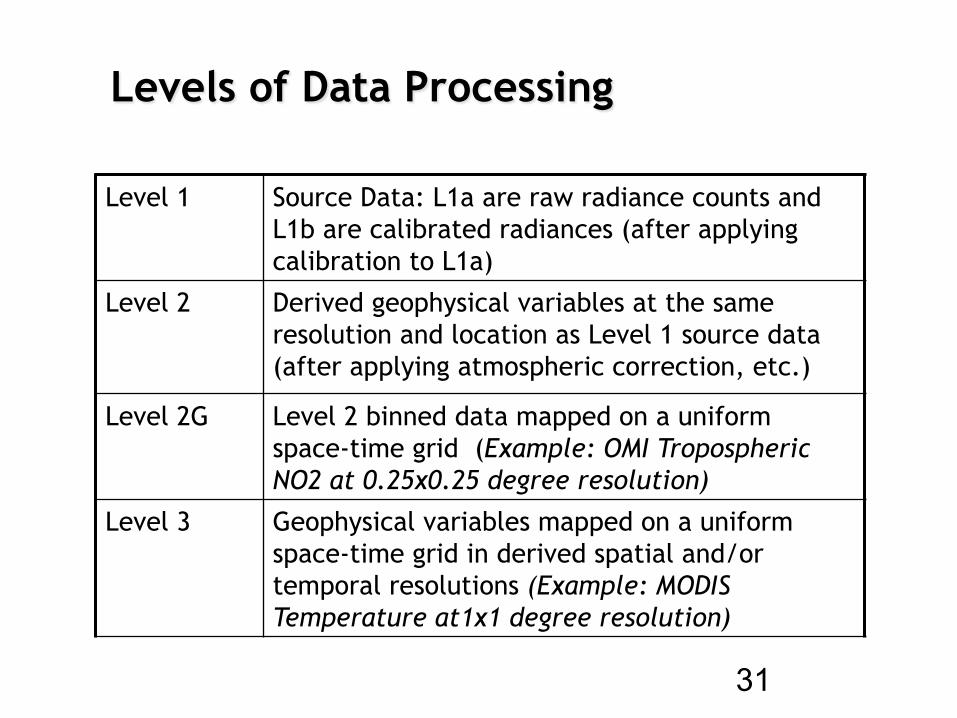
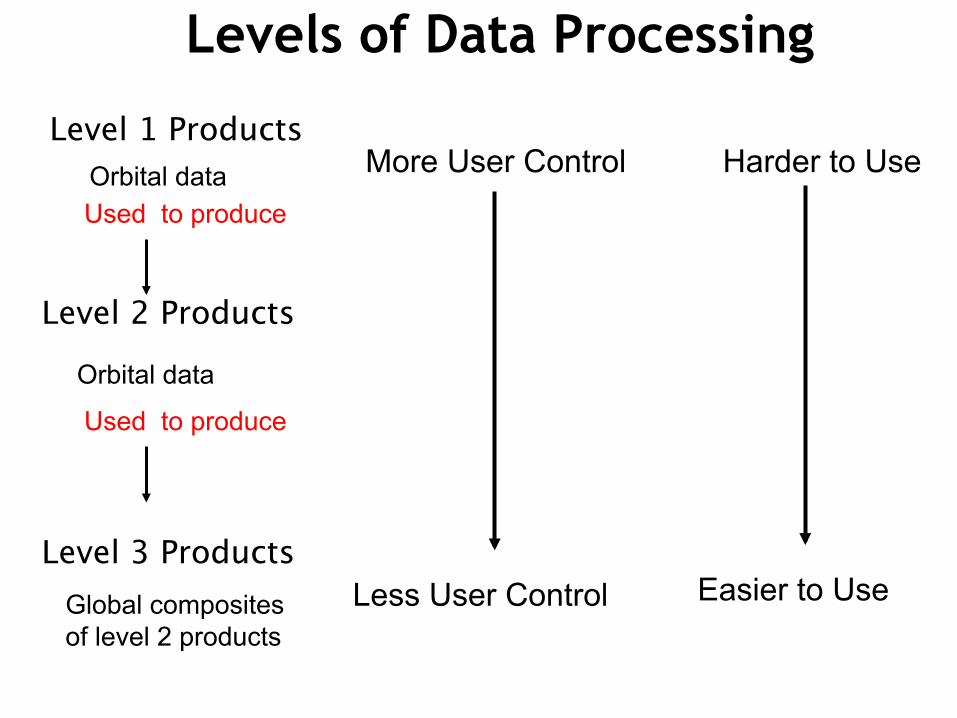
Levels of Data Processing
Level 1 Source Data: L1a are raw radiance counts and L1b are calibrated radiances (after applying calibration to L1a)
Level 2 Derived geophysical variables at the same resolution and location as Level 1 source data (after applying atmospheric correction, etc.)
Level 2G Level 2 binned data mapped on a uniform space-time grid (Example: OMI Tropospheric NO2 at 0.25x0.25 degree resolution)
Level 3 Geophysical variables mapped on a uniform space-time grid in derived spatial and/or temporal resolutions (Example: MODIS Temperature at1x1 degree resolution)

32
Levels of Data Processing and Spatial Resolution
• Level 1 and Level 2 data products have the highest spatial and temporal resolution • Level 3 products are derived products with equal or lower spatial and temporal resolution than Level 2 products. Available hourly, daily and for some products also monthly
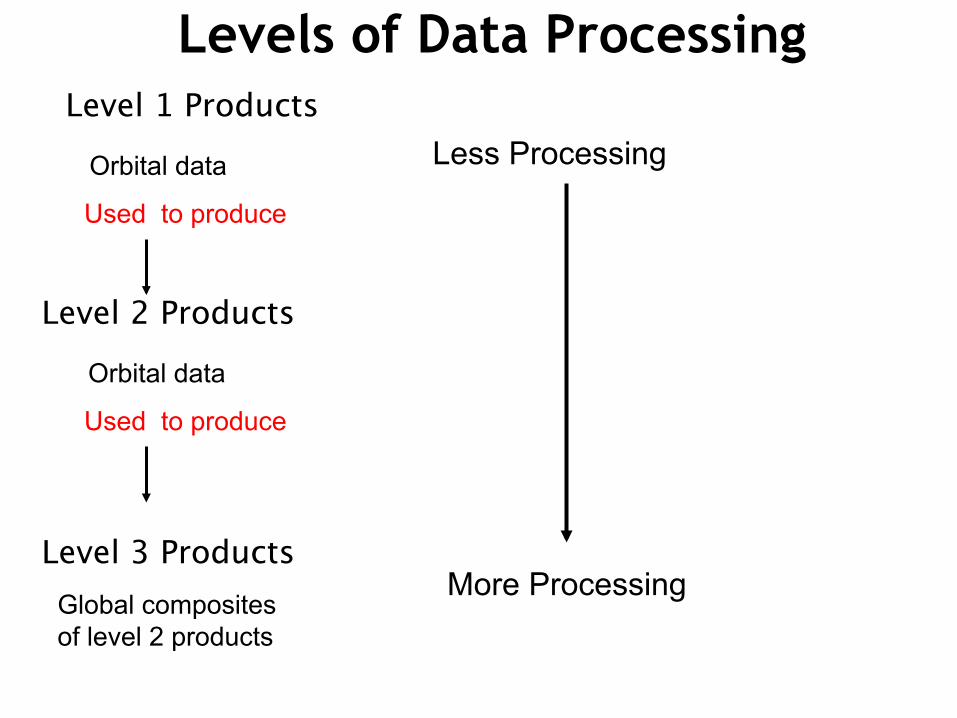
Level 1 Products
Level 2 Products
Less Processing
More Processing
Orbital data
Level 3 Products Global composites of level 2 products
Used to produce
Used to produce
Levels of Data Processing
Orbital data
Level 1 Products
Level 2 Products
Orbital data
Level 3 Products Global composites of level 2 products
Used to produce
Used to produce
More User Control
Less User Control
Harder to Use
Easier to Use
Levels of Data Processing
Orbital data
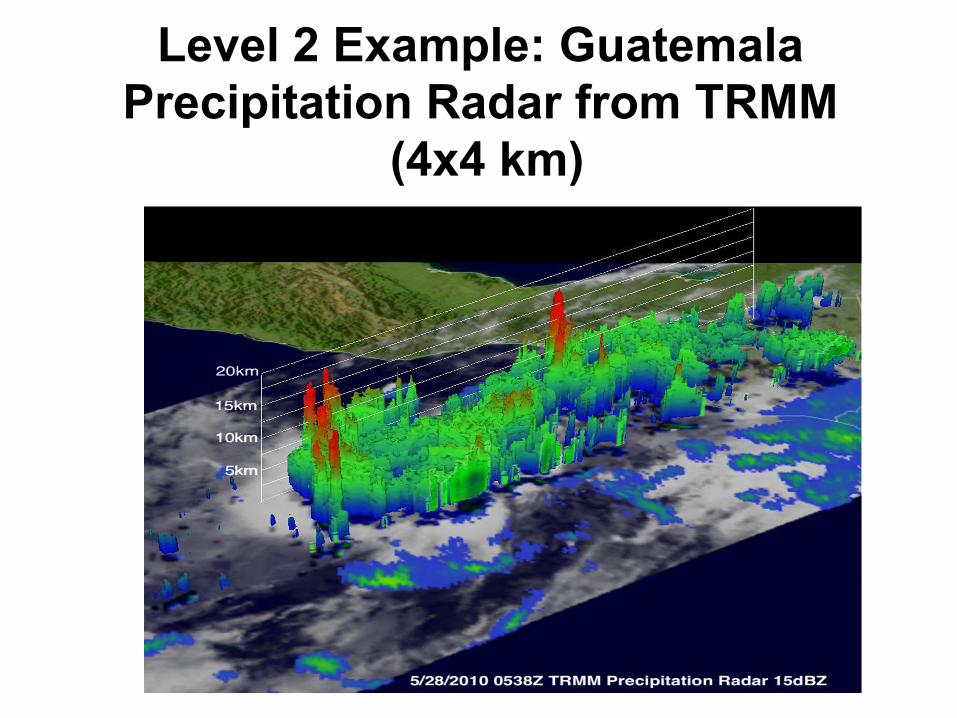
Level 2 Example: Guatemala Precipitation Radar from TRMM
(4x4 km)

Level 3 Example: TRMM Accumulated Rainfall
0.25x0.25 degree TRMM Accumulated Rainfall over Guatemala
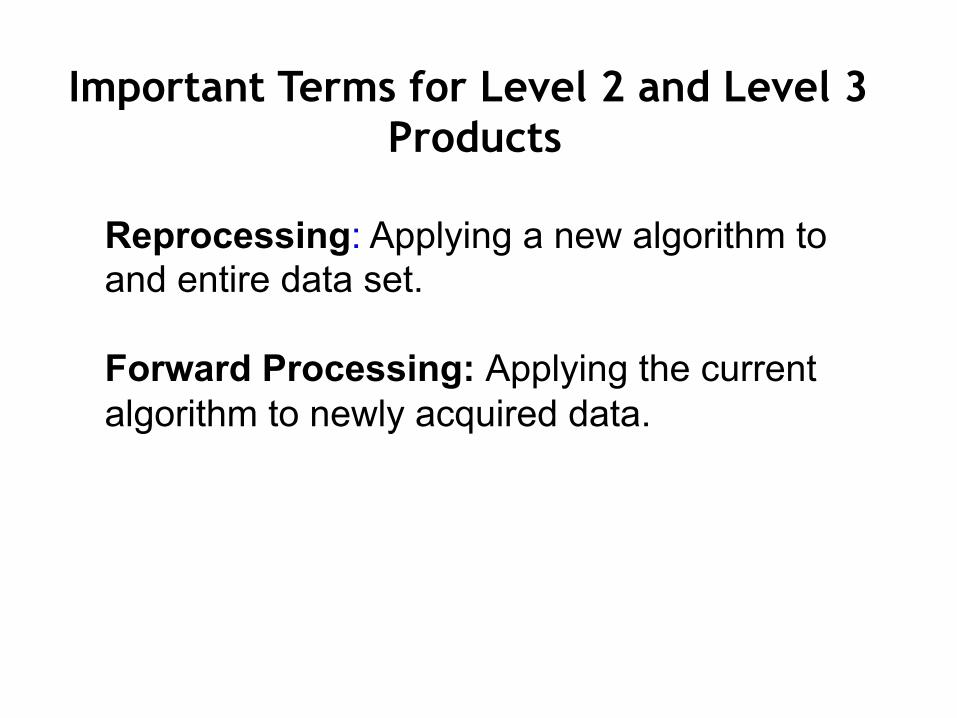
Reprocessing: Applying a new algorithm to and entire data set. Forward Processing: Applying the current algorithm to newly acquired data.
Important Terms for Level 2 and Level 3 Products
Data Versions • For some NASA data products more than one
version may be available • Note: Giovanni products are the most recent data
version publicly available • For each level of processing versions of data are
periodically released as retrieval algorithms or other sources of information improve, e.g. V001, V002, V003

Data Formats • Text/ASCII pros: easy to read and examine the data right away (can read with used tools such as excel and GIS software) cons: large data files • Binary – HDF, NetCDF pros: takes less space, more information (metadata,SDS) cons: need specific tools or code to read the data • KML or KMZ (zipped KML) pros - easy 2D and 3D visualization of the data through free tools such as Google Earth. Data are very low volume
39
HDF Data Formats HDF is the standard format for most NASA data HDF files contain both data and metadata SDS - Each parameter within an HDF file is referred to as an SDS (Scientific Data Set) An SDS must be referenced precisely according to name when analyzing the data with your own computer code.
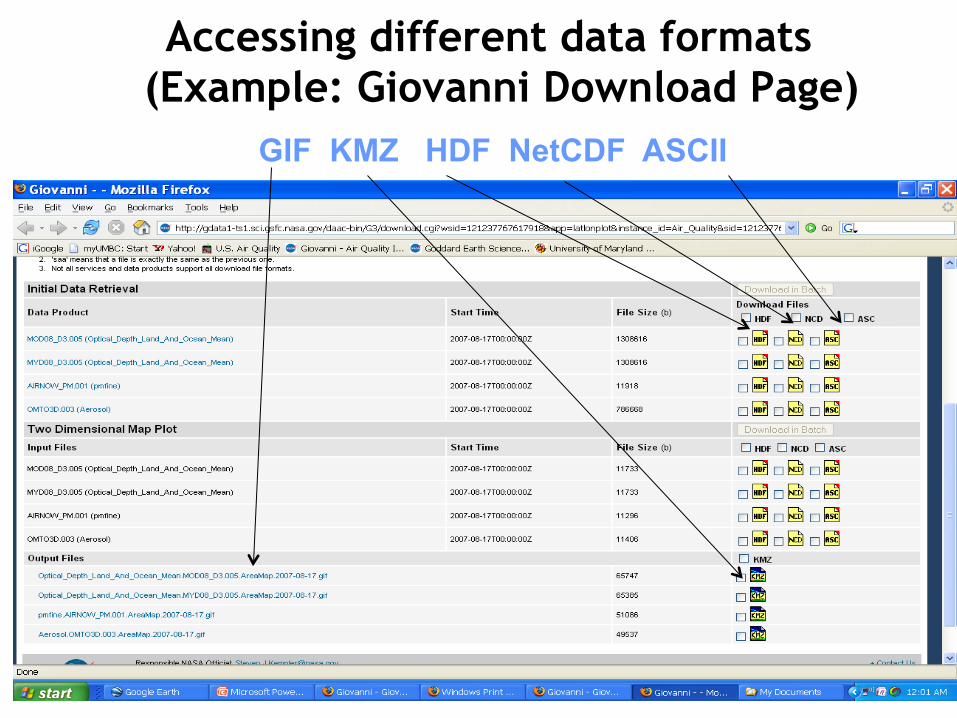
Accessing different data formats (Example: Giovanni Download Page)
41
GIF KMZ HDF NetCDF ASCII

Putting it all together: data file names
Data product: 3- Hourly Rain Rate (mm/hr) Version 6
Date (June 30, 2011)
Data format is HDF5 Level of Processing is L3 Version 6
Time (GMT hour: 21)
Data Format (HDF5)
3B42.110630.21.6A.HDF.Z Level 3
Conclusions • NASA satellite data formats are varied and the most appropriate depends on specific user needs • Available data formats include, ASCII, HDF, NetCDF, and KMZ • Satellite data vary in spatial resolution depending on instrument characteristics and the level of processing (L2, L2G, L3)