an investigation of river kinetic turbines: performance enhancements, turbine modelling techniques,...
Post on 21-Dec-2015
214 views
TRANSCRIPT

An Investigation of River Kinetic An Investigation of River Kinetic Turbines: Performance Turbines: Performance
Enhancements,Enhancements,Turbine Modelling Techniques, Turbine Modelling Techniques,
and and a Critical Assessment of a Critical Assessment of
Turbulence ModelsTurbulence Modelsby
David L. F. Gaden
Department of Mechanical and Manufacturing Engineering
University of Manitoba

Committee MembersCommittee Members
Dr. E. Bibeau (departmental advisor)Dr. E. Bibeau (departmental advisor) Dr. A. Gole (Electrical Engineering)Dr. A. Gole (Electrical Engineering) Tom Molinski (Manitoba Hydro)Tom Molinski (Manitoba Hydro) Dr. S. Ormiston (Mechanical Dr. S. Ormiston (Mechanical
Engineering)Engineering)
External ReviewerExternal Reviewer Mr. P. Vauthier (UEK)Mr. P. Vauthier (UEK)

OutlineOutline
IntroductionIntroduction Technology overviewTechnology overview Recent kinetic hydro developmentsRecent kinetic hydro developments Wind energy literature reviewWind energy literature review
Shroud OptimisationShroud Optimisation Anchor ExperimentAnchor Experiment ValidationValidation ConclusionConclusion Future StudyFuture Study

IntroductionIntroductionTechnology Overview Technology Overview
Geographic location with a natural flow restriction

Shroud (cut away)
Turbine, Huband Generator
Anchoring System
To Power Distribution
IntroductionIntroductionTechnology Overview Technology Overview

Example of a kinetic turbine
≈ 8 ft
IntroductionIntroductionTechnology Overview Technology Overview

AdvantagesAdvantages No reservoir or spillway – minimal No reservoir or spillway – minimal
environmental impactenvironmental impact Site selection far less restrictiveSite selection far less restrictive No dams or powerhouses – low cost No dams or powerhouses – low cost
installationinstallation Fast deployment timesFast deployment times Modular – easily scalable energy outputModular – easily scalable energy output Steady flow rates, steady energy Steady flow rates, steady energy
productionproduction
IntroductionIntroductionTechnology OverviewTechnology Overview

DisadvantagesDisadvantages Possibly dangerous flow conditionsPossibly dangerous flow conditions No control over upstream conditionsNo control over upstream conditions Turbulence, foreign debrisTurbulence, foreign debris Unknown fish mortality rateUnknown fish mortality rate
IntroductionIntroductionTechnology Overview Technology Overview

Little in open literature for river Little in open literature for river kinetic turbines kinetic turbines
Purpose:Purpose: To develop modelling techniques for river To develop modelling techniques for river
kinetic turbineskinetic turbines To understand the reliability of these To understand the reliability of these
modelsmodels Use these models to evaluate performance Use these models to evaluate performance
enhancements for kinetic turbinesenhancements for kinetic turbines
IntroductionIntroductionRecent kinetic hydro developments Recent kinetic hydro developments

1970
1980
1990
2000
Coriolis Program (Gulf Stream) ITDG / IT Power
(Sudan)UEK (Various)Nova Energy, NRC (3
sites)Nihon University (Japan) Scottish Nuclear, IT Power
(Scotland)Northern Territory University (Australia) Marine Current
Turbines (UK)Horizontal axis turbineVertical axis turbineDucted turbine
IntroductionIntroductionRecent kinetic hydro developmentsRecent kinetic hydro developments**
*Adapted from Segergren, 2005

1990
2000
Horizontal axis turbineVertical axis turbineDucted turbine
Ontario Power Generation, UEK (Ontario)Hammerfest Strøm AS (Norway)
Exim & Seapower (Sweden / Scotland)Hydro Venturi (Various)
TidEl Generator (Unspecified)
Stingray Tidal Stream, Eng Business Ltd.
New Energy (Alberta)
Pearson College, et al. (B.C.)
Starkraft Development (Norway)
IntroductionIntroductionRecent kinetic hydro developmentsRecent kinetic hydro developments**
*Adapted from Segergren, 2005

IntroductionIntroductionWind energy literature reviewWind energy literature review
1980
1990
2000
N x 5
N x 2
E x 3E x 1
E x 1.25E x 1.3THEORY THEORY
THEORY
THEORY
THEORY – Paper covers ducted turbine theoryN – Numerical study
x 3 – Results show a power increase by a factor of 3E – Experimental results
N x 4N x 3.2
N x 2
Igra Grassmann et al.Lewis et al.
Helmy
HelmyPhillips et al.
Bet et al.

Shroud OptimisationShroud OptimisationTheoryTheory
Conventional turbine
Small power available
Pa < 60% P∞ Betz limit (Betz, 1926)

Shroud OptimisationShroud OptimisationTheoryTheory
Shrouded turbine
Greater power available
(Lewis et al., 1977)

Shroud OptimisationShroud OptimisationTurbine ModellingTurbine Modelling
Four turbine modelling strategies:1.1. No model2.2. Momentum source3.3. Averaging rotating reference frame4.4. Sliding mesh rotating reference frame
• Does not capture pressure drop, swirl• Non-linear response to pressure not modelled• Not used
• Open passage

Shroud OptimisationShroud OptimisationTurbine ModellingTurbine Modelling
Four turbine modelling strategies:1.1. No model
2.2. Momentum source3.3. Averaging rotating reference frame4.4. Sliding mesh rotating reference frame
• Does not capture pressure drop, swirl• Non-linear response to pressure not modelled• Not used
• Open passage
k – Momentum source factor
• Models turbine as block of momentum
• Captures pressure drop
• Avoids complex geometry

Shroud OptimisationShroud OptimisationTurbine ModellingTurbine Modelling
Four turbine modelling strategies:1.1. No model2.2. Momentum source
3.3. Averaging rotating reference frame4.4. Sliding mesh rotating reference frame
k – Momentum source factor
• Models turbine as block of momentum
• Captures pressure drop
• Avoids complex geometry
0
0.1
0.2
0.3
0.4
0.5
0.6
0.7
-0.6 -0.1 0.4 0.9
Uw / U∞
P /
P∞
TheoryExperiment
• Does not account for power curves, mechanical losses
• Close to Betz theory
• ≈ 5% over-prediction of power
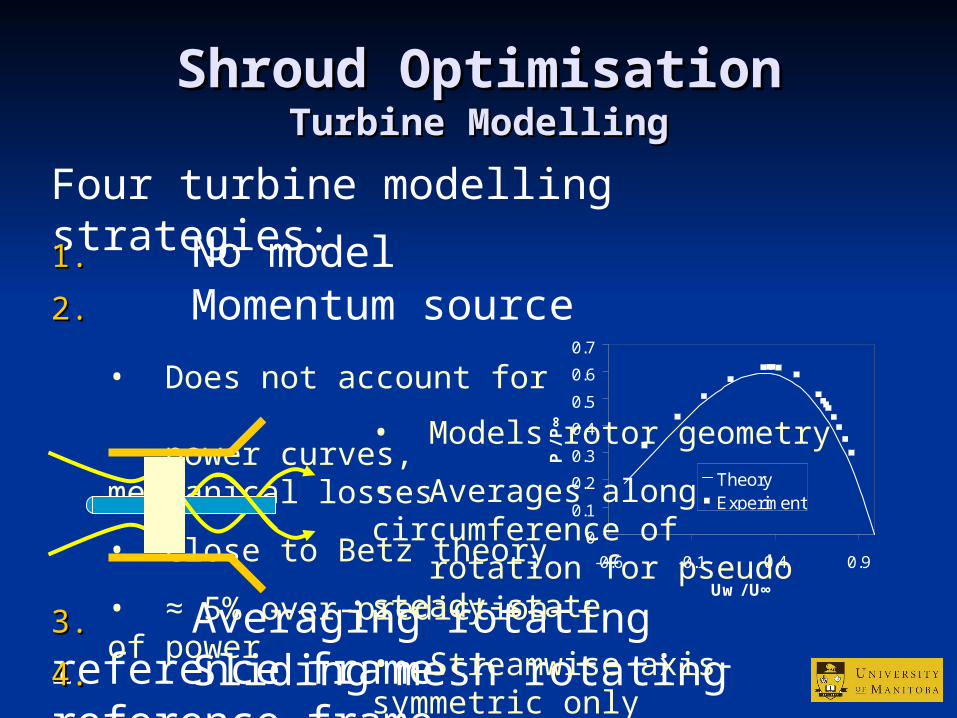
Shroud OptimisationShroud OptimisationTurbine ModellingTurbine Modelling
Four turbine modelling strategies:1.1. No model2.2. Momentum source
3.3. Averaging rotating reference frame4.4. Sliding mesh rotating reference frame
0
0.1
0.2
0.3
0.4
0.5
0.6
0.7
-0.6 -0.1 0.4 0.9
Uw / U∞
P /
P∞
TheoryExperiment
• Does not account for power curves, mechanical losses
• Close to Betz theory
• ≈ 5% over-prediction of power
• Models rotor geometry
• Averages along circumference of rotation for pseudo steady-state
• Streamwise axis-symmetric only

Shroud OptimisationShroud OptimisationTurbine ModellingTurbine Modelling
Four turbine modelling strategies:1.1. No model2.2. Momentum source3.3. Averaging rotating reference frame
4.4. Sliding mesh rotating reference frame
• Models rotor geometry
• Averages along circumference of rotation for pseudo steady-state
• Streamwise axis-symmetric only
• Rotates and interpolates mesh at each time step
• Computationally intensive; large output
• Fully transient solution

Shroud OptimisationShroud OptimisationMomentum SourceMomentum Source
Design variables:
1.1. Diffuser Angle

Shroud OptimisationShroud OptimisationMomentum SourceMomentum Source
Design variables:
1.1. Diffuser Angle
2.2. Area ratio

Shroud Shroud OptimisationOptimisationMomentum SourceMomentum Source
Model dimensions
Flow domain
Surface mesh

0
10
20
30
40
50
60
0 2 4 6 8
Area ratio
Po
we
r [k
W]
0
20
40
60
80
100
120
140
160
0 2 4 6 8
Area ratio
Dra
g [
kN
]
Shroud Shroud OptimisatioOptimisatio
nnMomentum SourceMomentum Source
Variable: Area ratio
15

Variable: Angle0
10
20
30
40
50
60
0 20 40 60
Diffuser Angle [degrees]
Po
wer
[kW
]
No diffuser
0
5
10
15
20
25
30
35
0 20 40 60
Diffuser angle [°]
Dra
g [k
N]
Total dragShroud dragTurbine drag
No diffuser
■■ Power increase by a factor of 3.1
■■ Drag increase by a factor of 3.9
Shroud Shroud OptimisatioOptimisatio
nnMomentum SourceMomentum Source

Streamlines for45° diffuser
Streamlines for20° diffuser
Shroud Shroud OptimisationOptimisationMomentum SourceMomentum Source

No diffuser versus diffuser
Shroud OptimisationShroud OptimisationMomentum SourceMomentum Source

3.8703.3612.8512.3421.324 1.8330.814-0.204 0.305-0.714
Axial ve locity [m /s]
Shroud OptimisationShroud OptimisationMomentum SourceMomentum Source

Shroud OptimisationShroud OptimisationMomentum SourceMomentum Source
If area is limited, shroud will reduce If area is limited, shroud will reduce turbine sizeturbine size
Shroud is still beneficialShroud is still beneficial
Output: 25.6 kW Output: 51.3 kW
Diameter: 3.0 m Diameter: 2.4 m

Shroud OptimisationShroud OptimisationRotating Reference FrameRotating Reference Frame
Tetrahedral mesh
Flow domain
Hexahedral mesh

Shroud OptimisationShroud OptimisationRotating Reference FrameRotating Reference Frame
A.A. B.B.
C.C. D.D.

Shroud OptimisationShroud OptimisationRotating Reference FrameRotating Reference Frame
100%46.4 kW
95.8%44.4 kW
84.7%39.3 kW
105.5%48.9 kW
Relative power output
(standard)A.A.B.B. C.C.D.D.


Shroud OptimisationShroud OptimisationRotating Reference FrameRotating Reference Frame

Anchor ExperimentAnchor Experiment
Boundary-layer causes power lossBoundary-layer causes power loss
U/U∞
y/δ
Velocity
P/P∞
Power

Shroud (cut away)
Turbine, Huband Generator
Anchoring System
To Power Distribution
Anchor ExperimentAnchor Experiment

Anchor ExperimentAnchor Experiment
Four anchor modelsFour anchor models
A.A. B.B.
C.C. D.D.
≈ 3 m

Anchor ExperimentAnchor Experiment
y / δ
P /
P∞
At 7.5 m downstream from Anchor

Anchor ExperimentAnchor ExperimentMidstream velocity contours

ValidationValidation
Particle Image Velocimetry (PIV) usedParticle Image Velocimetry (PIV) used Six experimental runs:Six experimental runs:
2 configurations (nozzle & diffuser)2 configurations (nozzle & diffuser) 3 flow speeds (0.5 m/s, 0.8 m/s and 1.0 m/s)3 flow speeds (0.5 m/s, 0.8 m/s and 1.0 m/s)
For each, four CFD simulations For each, four CFD simulations performed:performed: 2 Eddy-viscosity turbulence models (2 Eddy-viscosity turbulence models (k-k-εε & &
SST)SST) 2 Reynolds stress transport models (SSG & 2 Reynolds stress transport models (SSG &
BSL)BSL)

ValidationValidation
Laser Mirror Camera
Water tunnel test section
Model
Ruler (for alignment)

ValidationValidation
FLUID WITH SEEDING PARTICLES
CAMERA LASER AND OPTICS
DATA ACQUISITION AND CONTROL SYSTEM
COMPUTER AND SOFTWARE
TEST SECTION AND MODEL
PIV Apparatus

ValidationValidation
d1
d3
d2
Frame 1 Frame 2
Both framesRaw Image

ValidationValidation
Diffuser, 1 m/s Nozzle, 1 m/s
PIV Streamlines & velocity contours

ValidationValidationk-ε streamlines & velocity contours
Diffuser, 1 m/s Nozzle, 1 m/s

ValidationValidationSSG streamlines & velocity contours
Diffuser, 1 m/s Nozzle, 1 m/s

ValidationValidationk-ε velocity error
Diffuser, 1 m/s Nozzle, 1 m/s

ValidationValidationSSG velocity error
Diffuser, 1 m/s Nozzle, 1 m/s

ValidationValidation
■ ■ Root mean square error (RMSE) used to evaluate each model across the entire field:
Full-field validation results:

ValidationValidation
PIV Experimental errorPIV Experimental error Seeding particle density too lowSeeding particle density too low
5 particles / IA recommended (Dantec 2000)5 particles / IA recommended (Dantec 2000) ≈ ≈ 3 particles / IA3 particles / IA Velocity up to 55% under-read (Keane et al. Velocity up to 55% under-read (Keane et al.
1992)1992) Field of view too largeField of view too large
Poor handling of high velocity gradientsPoor handling of high velocity gradients 60% probability of valid detection (Keane et al. 60% probability of valid detection (Keane et al.
1992)1992) Regions with high gradients cannot be trustedRegions with high gradients cannot be trusted

ValidationValidation CFD inlet conditions inadequateCFD inlet conditions inadequate Modelled as uniform flow, but it Modelled as uniform flow, but it
was not:was not:
0
0.2
0.4
0.6
0.8
1
1.2
-0.12 -0.06 0 0.06 0.12y [m]
Up
iv /
Ucf
d
D60D45D30N60N45N30

ConclusionsConclusions
River kinetic turbines are studiedRiver kinetic turbines are studied Shroud optimisation (momentum source Shroud optimisation (momentum source
model):model): Power increase by a factor of 3.1Power increase by a factor of 3.1 Sacrificing turbine area for duct can double power Sacrificing turbine area for duct can double power
outputoutput Shroud optimisation (rotating reference frame):Shroud optimisation (rotating reference frame):
Cylindrical shroud can cause 30% power lossCylindrical shroud can cause 30% power loss Power increase of 4% with a diffuserPower increase of 4% with a diffuser Power increase of 25% comparing against shrouded Power increase of 25% comparing against shrouded
turbineturbine
ConclusionsConclusions
Anchor experimentAnchor experiment Up to 90% power loss due to boundary Up to 90% power loss due to boundary
layerlayer Upstream flow obstruction can increase Upstream flow obstruction can increase
power availablepower available 30% power increase seen 12 meters 30% power increase seen 12 meters
downstreamdownstream Geometries designed to maximize Geometries designed to maximize
vertical disturbance were most vertical disturbance were most successfulsuccessful

ConclusionsConclusions
ValidationValidation Full field velocity RMSE of between 21.2% to Full field velocity RMSE of between 21.2% to
47.4%47.4% PIV experimental errors:PIV experimental errors:
Low seeding particle density Low seeding particle density velocity under-read velocity under-read Small field of view Small field of view lower probability of valid lower probability of valid
detectiondetection CFD modelling errors:CFD modelling errors:
Inlet velocity assumed to be uniformInlet velocity assumed to be uniform Eddy-viscosity based turbulence models Eddy-viscosity based turbulence models
performed superior than Reynolds stress performed superior than Reynolds stress turbulence modelsturbulence models

Future StudyFuture Study Turbine rotor geometryTurbine rotor geometry Study of cavitationStudy of cavitation Mechanical and electrical lossesMechanical and electrical losses Additional shroud optimisation studyAdditional shroud optimisation study Further performance enhancements:Further performance enhancements:
Wing designWing design Inlet statorsInlet stators
Improve the shroud validation; validate Improve the shroud validation; validate the turbine modelthe turbine model
Study interactions with array installationsStudy interactions with array installations Fish mortality and damage susceptibilityFish mortality and damage susceptibility

AcknowledgmentsAcknowledgments
Dr. Eric Bibeau
Dr. A Gole
Andrea Kraj
Jeremy Langner
Manitoba Hydro
Mr. T. Molinsky
NSERC
Dr. S. Ormiston
Dr. M. Tachie
Mr. P. Vauthier
Dr. Eric Bibeau
Dr. A Gole
Andrea Kraj
Jeremy Langner
Manitoba Hydro
Mr. T. Molinsky
NSERC
Dr. S. Ormiston
Dr. M. Tachie
Mr. P. Vauthier