an investigation of the effect of firm’s life cycle ...profdoc.um.ac.ir/articles/a/1041551.pdf ·...
TRANSCRIPT
Asian Journal
of Research in
Banking and Finance Asian Journal of Research in Banking and Finance
Vol. 4, No. 8, August 2014, pp. 109-122.
ISSN 2249-7323
www.aijsh.org
Asian Research Consortium
An Investigation of the Effect of Firm’s Life Cycle Stages on Earning
Quality: Evidence from Iran
Fereshteh Moshtagh
a, Mohammad Reza Abbaszadeh
b, Mohammad Hossein Vadiei
Nowghabic, Mehdi Jabbari Nowghabi
d
aM.A Student, Department of Accounting, Ferdowsi University of Mashhad, Mashhad, Iran. bDepartment of Accounting, Ferdowsi University of Mashhad, Mashhad, Iran. cDepartment of Accounting, Ferdowsi University of Mashhad, Mashhad, Iran.
dDepartment of Statistics, Ferdowsi University of Mashhad, Mashhad, Iran.
Abstract
Based on life cycle theory, firms have various characteristics in various stages of their life cycle and Since earnings
quality and the quality of financial reporting in general are subjects that have attracted much attention and are the
center of debate for investors, regulators as well as scholars in the recent years, this heightened attention to the subject
of earnings quality is, in part, due to the wave of accounting scandals of the early 2000s so this present essay is mainly
aimed at analyzing the effects of company's life cycle on earning quality of companies listed on the Tehran Stock
Exchange. To do this study, financial information of 105 companies listed on the Tehran Stock Exchange during 2006
- 2012 (735 firm-years) examined. Given a lack of consensus about the best way to measure earning quality, it
measured by two models (the Modified Jones(1995)model and Leuz et al., (2003) model). To test the hypotheses we
used panel data analysis and Generalized Least Square (GLS) method. The results of the study indicated that earning
quality is not influenced by firm’s life cycle stages. In other words, the earning quality at each stages of the life cycle
is not significantly different from each other.
Keywords: Firm’s Life Cycle, Earning Quality, Leuz Model, The Modified Jones Model, Tehran Stock Exchange.
Moshtagh et al. (2014). Asian Journal of Research in Research in Banking and Finance,
Vol. 4, No. 8, pp.109-122.
References
Abdelghany, K. (2005).Measuring the Quality of Earnings. Managerial Auditing Journal, 20(9):1001-1015.
Aharony, J., H Falk. & N. Yehuda. (2006). Corporate Life Cycle and the Value-Relevance of Cash Flow versus
Accrual Financial Information. School of Economics and Management Bolzano, Italy, Working Paper: 34.
Ahmadpoor, A. &Ahmadi, A. (2008). Using qualitative characteristics of financial data in assessing profit quality.
Accounting and Auditing Studies, 52:3-16.
Anthony, J.H. & Ramesh, K. (1992). Association between Accounting Performance Measures and Stock Prices a test
of the life cycle hypothesis. Journal of Accounting and Economics, 15:203-217
Bailey, W., Haitao, L., Connie,.X.&Zhong, R.(2003). Regulation Fair Disclosure and Earnings Information: Market,
Analyst, and Corporate Responses, The Journal of Finance, 58(6):2487-2514.
Beneish, M.Vagus,M.(2002). Insider Trading, Earning Quality, and Accrual Mispricing, The Accounting Review,
77(4):755-791.
Bixia, X. (2007). Life Cycle Effect on the Value Relevance of Common Risk factor. Review of Accounting and
Finance, 6:162-175.
Black,E.L. (1998). Life-Cycle Impacts on the Incremental Relevance of Earnings and Cash flow Measures. Journal
of Financial Statement Analysis, 4(1): 40-56.
Bradshaw, M., Richardson, S. & Sloan, R.(1999). Earnings Quality and Financial Reporting Credibility: An
Empirical Investigation, Available at SSRN: http://ssrn.com/abstract=170558.
Chatresahar,.S.E., Mojarad,. M., Kamizi,. A. & Borhan,. Z.(2013), The Relation between Financial Reporting Quality
and Cash Dividend, World of Sciences Journal, 01(15):84-90
Dechow, P. &Dichev, D. (2002) .The quality of accruals and earnings: the role of accrual estimation errors. The
Accounting Review, 77: 35-59.
Dechow, P. & Skinner, D. (2000). Earnings Management: Reconciling the Views of Accounting Academics,
Practitioners, and Regulators, Accounting Horizons, 14(2):235-250.
Dechow, p. (1994). Accounting earning and cash flows as measures of firm performance-The role of accounting
accruals, Journal of Accounting and Economics, 18: 3-42.
Dechow, P.M., Sloan, R.G., and Sweeney, A.P. (1995). Detecting Earnings Management. The Accounting Review,
70(2): 193-225.
Dechow,P.M., Kothari,S.P.& Watts, R.L.(1998). The Relation between Earnings and Cash flow, Journal of
Accounting and Economics, 25(2):133-168.
Esmaeeli, Sh. (2007). Quality of earnings. Journal of Accounting, 184: 5-8.
Francis, J., Lafond, R., Olsson, P. &Schipper, K. (2004).Costs of Equity and Earnings Attributes. The Accounting
Review, 79: 967-1010.
Ghorbani, A. (2006). The relationship between earnings and cash flows in the firm life cycle, M. A Thesis, Islamic
Azad University of Mashhad.
Ghosh, A. & Moon, D. (2010). Corporate Debt Financing and Earnings Quality, journal of business finance &
accounting, 37: 538-559.
Giroux, Gary (2004), Detecting Earnings Management. New York: John Wiley & Sons.
Givoly,D., Hayn,C.& Sharon, P.K. (2010). Does Public Ownership of Equity Improve Earnings Quality?,The
Accounting Review, 85(1): 195-225.
Harasani, R., (2010), Earnings quality trend of change over time in the listed companies in Tehran Stock Exchange,
M. A Thesis, AllamehTabatabai University in Iran.
Hermanns, S. (2006).Financial Information and Earnings Quality: a Literature Review.Working Paper SSRN.
Available at SSRN: Http: //ssrn.com /abstract = 897722.
Hodge,F.(2003).Investors' perceptions of earnings quality , auditor independence , and the usefulness of audited
financial information, supplement Accounting Horizons, pp.37-48.
Jahankhani, A. &ZarifFard, A. (1995).Do managers and stockholders use suitable criteria to assess the firm's value?,
Financial investigations, 7 & 8: 41-66.
Jenkins, D.S., Kane, G.D. and Velury, U. (2004). The impact of the corporate life-cycle on the value-relevance of
disaggregated earnings components .Review of Accounting and Finance, 3: 5-20.
Moshtagh et al. (2014). Asian Journal of Research in Research in Banking and Finance,
Vol. 4, No. 8, pp.109-122.
Jones, J. (1991). Earnings management during import relief investigation. Journal of Accounting Research, 29:193-
228.
Kirschenheiter, M. & Melumad, N. (2004), Earnings' quality and smoothing?, working paper Columbia Business
school, pp.65. Available at: http://www.krannert.purdue.edu/events/bkd_speakers/papers/mikespaper.pdf.
Leuz, C., Nanda, D. & Wysocki, P. (2003). Earning Management and Investor Protection. Journal of Financial
Economics, 69: 505-527.
Lev, B. (1989).On the usefulness of earning and earning research: Lessons and Directions from two decades of
empirical research, Journal of Accounting Research, 27:153-192.
Mikhail, M, Walther, B, & Willis, R. (2003). Reactions to Dividend Changes Conditional On Earning Quality.
Journal of Accounting Auditing and Finance, 18(1): 121-151.
Monem ,.R. & Farshadfar ,S.H.(2007).Has Earnings Quality Declined Over Time?Australian Evidence, Illinois
International Accounting Symposium, Available at
http://www.business.illinois.edu/accountancy/research/vkzcenter/conferences/hawaii/index.html
Mueller, D. C. (1972). A Life Cycle Theory of the Firm. Journal of Industrial Economics.20 (3):199-219.
Mueller, D. C. (1975). Life Cycle Effects on Corporate Returns on Retentions. The Review of Economics and
Statistics, 57(4): 400-409.
Myers, S.C. (1977).Determinants of Corporate Borrowing .Journal of Financial Economics, 5:147-175.
Osta, S., Qytasy, R. (2012) .The firm life cycle on discretionary accruals. Research in Financial Accounting, 11: 89 -
104.
Park, Y. & Chen, K. (2006). The Effect of Accounting Conservatism and Life-Cycle Stages on Firm Valuation.
Journal of Applied Business Research, 22: 75-92.
Penman, S. & Zhang, X. (2002), accounting conservatism, the quality of earnings, and stock returns, The Accounting
Review, 77 (2): 237-264.
Prentice ,H. Wild, J. J. (1996).The Audit Committee and Earnings Quality .Journal of Accounting, Auditing and
Finance, 11: 246-266.
Revsine, L. & Collins, D. & Johnson, B. (1999). Financial Reporting and Analysis. New Jersey, Upper Saddle River,
Prentice Hall.
Richardson, S. & Sloan, R. & Soliman, M, & Tuna, I. (2001).Information In Accruals about the Quality of Earnings.
Working paper university of Michigan business School, Ann. Arbor, pp.52.
Richardson, S. (2003). Earnings Quality and Short Sellers, supplement accounting horizons,pp.49-61
Saghafi, A. &Kordestani, G, (2004). Review and Description of the Relationship between Earnings Quality and
Market Reaction to Changes in Cash Earnings,Reviews of Accounting and Auditing, 37:51-72
Schipper, K. & Vincent, L. (2003). Earnings quality, Accounting Horizons, supplement 17: 97-110.
Scholer, F. (2004).The quality of accruals and earnings and the market pricing of earnings quality, working paper
Aarhus school of business, 1-13.
Scott, W. R. (2003). Financial Accounting Theory (3th Edition). Toronto, Canada, Prentice Hall.
Shen, C. & Chih, H.(2007).Earning Management and Corporate Governance in Asia's Emerging Markets. Corporate
Governance: An International Review, 15:999-1021
Shorvarzy, M.R. (2008), Presentation a model for assessing the earnings quality using qualitative characteristics of
theoretical concepts of financial reporting in Iran.
Sugianis, T. (1996). The value Relevancy of Research Development on valuation of future Earnings.Journal of
Accounting and Economics, 21:128-142.
Tehrani, R. &Zakeri, H. (2009). Investigation the relationship between earnings quality and dividend in the
companies listed in Tehran Stock Exchange. Stock Exchange Journal, 2(5):39-55.
Watts R, Zimmerman J. (1990). Positive accounting theory, Englewood Cliffs, NJ.
White, G., Sondhi, A. & Fried, D. (2003). The analysts and use of financial statements, john Wiley and Sons, third
edition,
An Investigation of the Effect of Firm’s Life Cycle Stages on Earning Quality: Evidence from Iran
Fereshteh Moshtagha, Dr. Mohammad Reza Abbaszadehb, Dr. Mohammad Hossein Vadiei
Nowghabic, Dr. Mehdi Jabbari Nowghabid
aM.A Student, Department of Accounting, Ferdowsi University of Mashhad, Mashhad, Iran.
bDepartment of Accounting, Ferdowsi University of Mashhad, Mashhad, Iran. cDepartment of Accounting, Ferdowsi University of Mashhad, Mashhad, Iran.
dDepartment of Statistics, Ferdowsi University of Mashhad, Mashhad, Iran.
Abstract Based on life cycle theory, firms have various characteristics in various stages of their life cycle and Since earnings quality and the quality of financial reporting in general are subjects that have attracted much attention and are the center of debate for investors, regulators as well as scholars in the recent years, this heightened attention to the subject of earnings quality is, in part, due to the wave of accounting scandals of the early 2000s so this present essay is mainly aimed at analyzing the effects of company's life cycle on earning quality of companies listed on the Tehran Stock Exchange. To do this study, financial information of 105 companies listed on the Tehran Stock Exchange during 2006 - 2012 (735 firm-years) examined. Given a lack of consensus about the best way to measure earning quality, it measured by two models (the Modified Jones(1995)model and Leuz et al., (2003) model). To test the hypotheses we used panel data analysis and Generalized Least Square (GLS) method. The results of the study indicated that earning quality is not influenced by firm’s life cycle stages. In other words, the earning quality at each stages of the life cycle is not significantly different from each other. Keywords: Firm’s Life Cycle, Earning Quality, Leuz Model, The Modified Jones Model, Tehran Stock Exchange.

1. Introduction
Financial reports are the most important output of an accounting system. The purpose of financial reporting is to provide the information which can be useful for business decisions (Schipper and Vincent, 2003). Earning is one of the main indexes in accounting, which always has attracted particular attention for different purposes such as investments, financial analysis, evaluation of companies’ performance, and so on. Although the reported accounting earnings is a good guideline for future predictions and assessments, some limitations, such as caution and importance, has caused that financial analysts consider earnings quality as a better index for predictions and decisions. Therefore, the concept of earning quality has been proposed and studied in order to correct the measurements, improve the company performance evaluation, and solve the problems and shortcomings which are caused by timing and matching. Earning quality is a concept which has attracted serious attention among most of companies, financial analysts, and users of accounting information. Two important features can be pointed in the definition of earnings quality. The first feature is its usefulness in decision making and the second feature is the relation between earning quality and financial earning. This means that earning quality criteria in comparison with traditional conventional criteria is a more direct and more related index for predictions, resource allocation, and companies’ financial performance assessment, and it improves the quality of financial reporting (Chatresahar et al., 2013). It seems that a decline in earnings quality can be potentially informative about the disclosure trend, threatening future cash flows and performance. Stock market returns contribute to our understanding of how exchange rates influence on corporate performance, competitiveness, and economic activity (Bailey et al., 2003). Examination of the accounting scandal and bankruptcy of giants such as Enron, WorldCom, Xerox and Parmalat in the U.S. and Tell one in Australia has led to the conclusion that these events mainly stemmed from earnings manipulation and artificial, poor quality income statements (Ghosh et al., 2010; Shen et al., 2007). Majority of directors in the mentioned companies made use of fraudulent means such as structuring and artificial transactions with related parties with the intention of earnings management, which downgraded earnings quality to a record low. Consequently, many shareholders lost their confidence (Wats and Zimmerman, 1990).On the other hand the results of the previous researches show that the reaction of capital market to accounting information in different periods of life cycle has had meaningful differences (Aharony & Yehuda, 2006). Life cycle theory suggests that a firm possesses different risk characteristics and different economic attributes across life cycle stages (Bixia, 2007). Economic theory divides a corporate life cycle into four stages: start-up, growth, maturity and decline or stagnation stage. These stages are discerned by corporate-specific attributes such as the degree of uncertainty that faces the corporate, its assets in place and its investment opportunities (Mueller, 1972; 1975; Myers, 1977).The life cycle theory is based on this assumption that economic enterprises like all other living creatures have life cycle too. These living systems in each stage of their life cycle show specific behavioral patterns of themselves in order to

dominate periodical problems confronting with or to transfer them into the next cycles. Some researchers have studied the effect of accounting information on a company's life cycle (Black, 1998; Jenkins, 2004). So in the following research, the effects of the company's life cycle on earning quality in accepted corporations in Tehran Stock Exchange is being tested.
2. Literature review
2.1. Theoretical bases of firm's life cycle
The concept of life cycle in recent decades is a term known in the accounting literature. All living organisms, including plants, animals and humans may follow all the curves life or the life cycle. These beings are born, grow, to reach old age and eventually die. The life cycle theory assumes that firms and enterprises, like all living creatures that are born, grow and die. In youth period (growth period) organizations are more flexible, but are often uncontrollable. With the increase of life, relationships may vary: controls increased and flexibility decreases. Finally, by aging (during Decline) control capability will be reduced. When an entity is able to control and flexible, it is stated that both the young and old can benefit. The condition known as developmental stage (Maturity Stage) is known (Adizes, 1989). A review of recent literature on the economic and management shows corporate life cycle disclosed four common stages: birth, growth, maturity, and decline and for it some models are presented. In the framework of these models, institutions and companies pursue specific policy at every stage of their economic life. This policy is reflected in corporate accounting information (Ghorbani, 2006). 2.1.1. Start-Up Stage:
Usually at this stage the amount of assets (firm size) is at the low level, Cash flow from operating activities and profitability was low and Companies need to high liquidity for finance and realize growth opportunities. Rate on dividends in these companies is usually zero or the maximum rate 10%. The return on investment or return on adjusted investment relative to the weighted rate financing is often poor (Adizes, 1989). 2.1.2. Growth Stage:
At this stage, the size of the companies is more than emergence stage companies and growth in sales and earnings is higher than the emergence stage. Financial resources are more invested in productive assets, and the company has more flexibility in liquidity index. Companies' dividend ratio often fluctuates in the range of 10 % to 50 %. Return on investment or return on adjusted investment is often higher than funding costs weighted rate (Adizes, 1989). 2.1.3. Maturity Stage:
At this stage, corporate experience has stability in sales and the need for cash in most cases is supplied from domestic sources. The size of the company's assets is greater than the size of the assets of the company in growth stage. Dividend ratio of the companies often fluctuates in the range 50 % to 100%. Due to excess liquidity and reduce dependence on outside funding policy, return on investment or return on adjusted investment are often equal or more than funding costs weighted rate (Adizes, 1989). 2.1.4. Decline Stage:

At this stage, there is very little opportunity for growth, Indicators of profitability, liquidity and obligations have decreasing trend. The company has been very intensive and competitive conditions. Moreover, costs of financing from external sources are high, So that in most cases the adjusted investment returns and investment returns are lower than the rate financing.
2.2. Theoretical bases of earnings quality
The issue of earnings usefulness is of major importance to the financial information users since earnings are widely believed to be the premier information items provided in financial statements (Lev, 1989). Earnings quality and the quality of financial reporting in general are subjects that have attracted much attention and are the center of debate for investors, regulators as well as scholars in the recent years. This heightened attention to the subject of earnings quality is, in part, due to the wave of accounting scandals of the early 2000s (Hermanns, 2006). However, earnings quality has been a topic of increasing importance and interest especially after the colossal corporate collapses of Enron, WorldCom amongst others, which has put a big question mark on the financial reporting quality of the publicly listed companies in stock market (Giroux, 2004). The theory of earnings quality was first posed by financial analysts and Stock Exchange agents. They inferred that the reported profit does not show the firms' profitability as it is imagined. They found out that analyzing firms' financial statements is a difficult task due to the different weak points in assessing accounting information. We should not solely consider the amount reported to announce the profitability in determining the firms' value, but should also consider the quality of the reported profit. By earnings quality, we mean the potential profit growth and the probable amount of realization of future profits. In other words, the value of a share does not depend solely on the profit of each firm share's profit in the current year and it depends on our expectations of our firm's future and future years' profitability and assurance coefficients compared with the future profit gains (Jahankhani, 1995). Financial analysts generally consider the reported profit different from that of real profit. One of the reasons for it is profit manipulation by managers. Financial analysts try to assess the firms' profit perspective. Profit perspective refers to the desired and undesired net profit features' composition. Firms with repeatable accounting profit have a higher earnings quality in income statement compared with other firms. Thus, analysts can foretell firm's future profitability with more assurance capability (Esmaeeli, 2007). The concept of earnings quality considers two characteristics for quality determination: 1) Profitability in decision-makingand 2) The relationship between earnings quality and economical profit. In other words, earnings quality is honest expression of the reported profit. That is a high earnings quality shows the usefulness of profit information for decision-making by the users and also it is more adjusted with economic profit (Ahammadpoor & Ahmadi, 2008). Revsine (1999) considers a profit to be more qualified which is more consistent. "Earnings quality" has several definitions in the accounting literature and there is no unified definition about it. Richardson & et al., (2001) introduced earnings quality as the
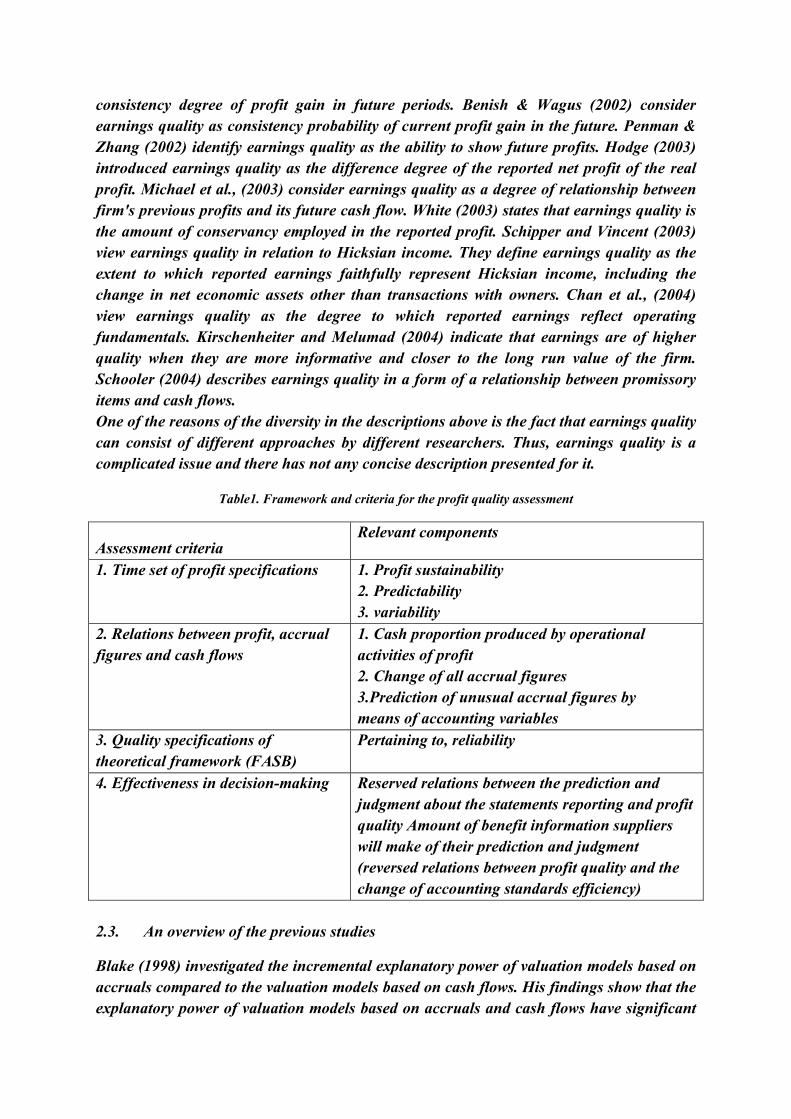
consistency degree of profit gain in future periods. Benish & Wagus (2002) consider earnings quality as consistency probability of current profit gain in the future. Penman & Zhang (2002) identify earnings quality as the ability to show future profits. Hodge (2003) introduced earnings quality as the difference degree of the reported net profit of the real profit. Michael et al., (2003) consider earnings quality as a degree of relationship between firm's previous profits and its future cash flow. White (2003) states that earnings quality is the amount of conservancy employed in the reported profit. Schipper and Vincent (2003) view earnings quality in relation to Hicksian income. They define earnings quality as the extent to which reported earnings faithfully represent Hicksian income, including the change in net economic assets other than transactions with owners. Chan et al., (2004) view earnings quality as the degree to which reported earnings reflect operating fundamentals. Kirschenheiter and Melumad (2004) indicate that earnings are of higher quality when they are more informative and closer to the long run value of the firm. Schooler (2004) describes earnings quality in a form of a relationship between promissory items and cash flows. One of the reasons of the diversity in the descriptions above is the fact that earnings quality can consist of different approaches by different researchers. Thus, earnings quality is a complicated issue and there has not any concise description presented for it.
Table1. Framework and criteria for the profit quality assessment
Assessment criteria Relevant components
1. Time set of profit specifications 1. Profit sustainability 2. Predictability 3. variability
2. Relations between profit, accrual figures and cash flows
1. Cash proportion produced by operational activities of profit 2. Change of all accrual figures 3.Prediction of unusual accrual figures by means of accounting variables
3. Quality specifications of theoretical framework (FASB)
Pertaining to, reliability
4. Effectiveness in decision-making Reserved relations between the prediction and judgment about the statements reporting and profit quality Amount of benefit information suppliers will make of their prediction and judgment (reversed relations between profit quality and the change of accounting standards efficiency)
2.3. An overview of the previous studies
Blake (1998) investigated the incremental explanatory power of valuation models based on accruals compared to the valuation models based on cash flows. His findings show that the explanatory power of valuation models based on accruals and cash flows have significant
different with each other at different stages of the life cycle. Valuation models based on cash flows are more relevant in growth and decline stages and in maturation stage, the opposite is true.
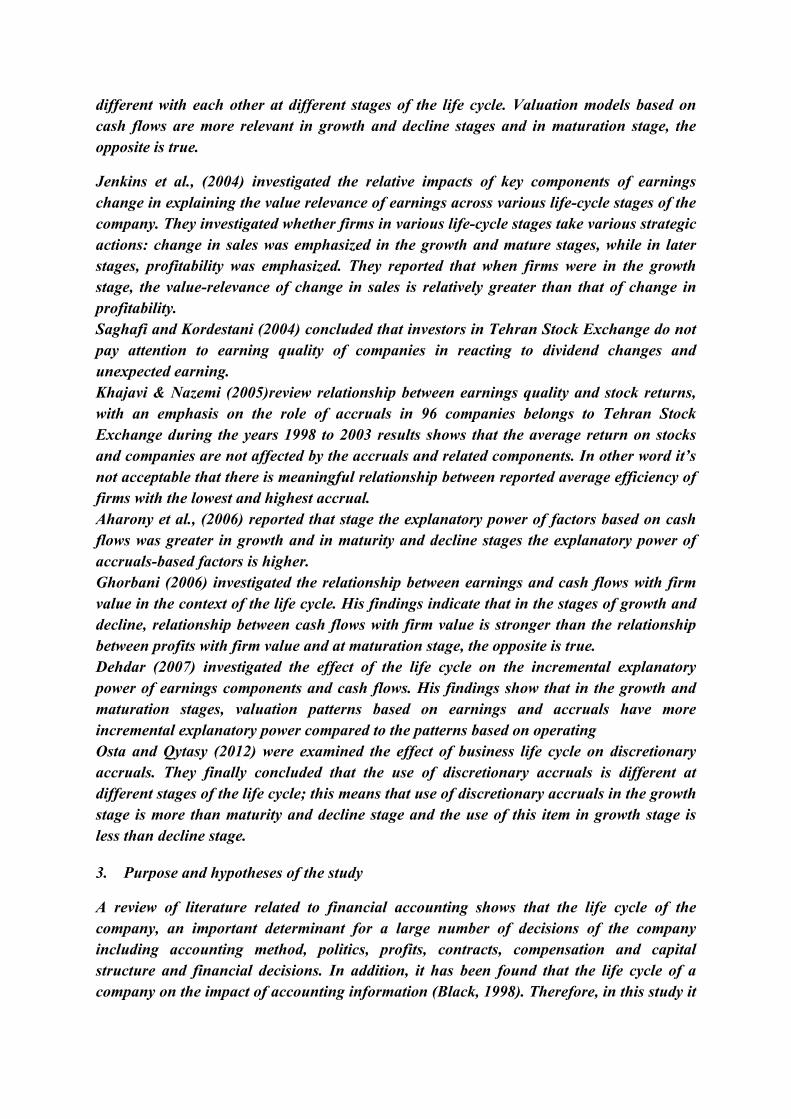
Jenkins et al., (2004) investigated the relative impacts of key components of earnings change in explaining the value relevance of earnings across various life-cycle stages of the company. They investigated whether firms in various life-cycle stages take various strategic actions: change in sales was emphasized in the growth and mature stages, while in later stages, profitability was emphasized. They reported that when firms were in the growth stage, the value-relevance of change in sales is relatively greater than that of change in profitability. Saghafi and Kordestani (2004) concluded that investors in Tehran Stock Exchange do not pay attention to earning quality of companies in reacting to dividend changes and unexpected earning. Khajavi & Nazemi (2005)review relationship between earnings quality and stock returns, with an emphasis on the role of accruals in 96 companies belongs to Tehran Stock Exchange during the years 1998 to 2003 results shows that the average return on stocks and companies are not affected by the accruals and related components. In other word it’s not acceptable that there is meaningful relationship between reported average efficiency of firms with the lowest and highest accrual. Aharony et al., (2006) reported that stage the explanatory power of factors based on cash flows was greater in growth and in maturity and decline stages the explanatory power of accruals-based factors is higher. Ghorbani (2006) investigated the relationship between earnings and cash flows with firm value in the context of the life cycle. His findings indicate that in the stages of growth and decline, relationship between cash flows with firm value is stronger than the relationship between profits with firm value and at maturation stage, the opposite is true. Dehdar (2007) investigated the effect of the life cycle on the incremental explanatory power of earnings components and cash flows. His findings show that in the growth and maturation stages, valuation patterns based on earnings and accruals have more incremental explanatory power compared to the patterns based on operating Osta and Qytasy (2012) were examined the effect of business life cycle on discretionary accruals. They finally concluded that the use of discretionary accruals is different at different stages of the life cycle; this means that use of discretionary accruals in the growth stage is more than maturity and decline stage and the use of this item in growth stage is less than decline stage.
3. Purpose and hypotheses of the study
A review of literature related to financial accounting shows that the life cycle of the company, an important determinant for a large number of decisions of the company including accounting method, politics, profits, contracts, compensation and capital structure and financial decisions. In addition, it has been found that the life cycle of a company on the impact of accounting information (Black, 1998). Therefore, in this study it

is argued that the connections between the life cycle of the company and earning quality. Thus, in this study, the following hypotheses proposed.
The below hypotheses have suggested achieving to the purpose of the study: H1: Earning quality is significantly different throughout the firm’s life cycle. H2: Earning quality of the growth firms is significantly different from mature firms. H3: Earning quality of the growth firms is significantly different from decline firms. H4: Earning quality of the mature firms is significantly different from decline firms.
4. Research methodology and variable measurement
4.1. Corporate Life Cycle (independent variable):
Previous experimental studies concerning accounting have shown that the firm's financial qualities are not the same in different terms of their life cycle and have relation with each term. Anthony’s and Ramesh’s findings (1992) show that there is a significant relation between the shares price and accounting data (Such as profit growth percent, cost of capital percent and cash profit division percent) during the life cycle. Here the firms are divided into growth, maturing and decline terms by the four variables; according to Park and Chen’s (2006) methodology as follows: 1. Primarily the sale growth, cost of capital, divisible profit proportion and age of the firms are calculated for each company. 2. Firm years are divided into five categories on the basis of each variable of the four ones and according to the statistical category from one to five by virtue of the following table. 3. Then a composite score is gained for each company year and classified by virtue of following conditions in one of the terms (Growth, maturing or decline): a. If total score is between 16–20; it is in growth term. b. If total score is between 9–15; it is in mature term. c. If total score is between 4–8; it is in decline term.
Table2. Life cycle model (Score Assignment)
Categories
AGE
Sale growth(SG)
Cost of capital(CE)
Divisible profit(DPR)
First 5 1 1 5 Second 4 2 2 4 Third 3 3 3 3
Fourth 2 4 4 2 Fifth 1 5 5 1
Where: SGit = [1– (Saleit / Saleit-1)] × 100 DPRit = (DPSit / EPS it) × 100 CEit=(increase (decrease) in fixed assets during the period/ firm market value) × 100 AGE = the difference of ‘t’ year and the year when the firm was established.
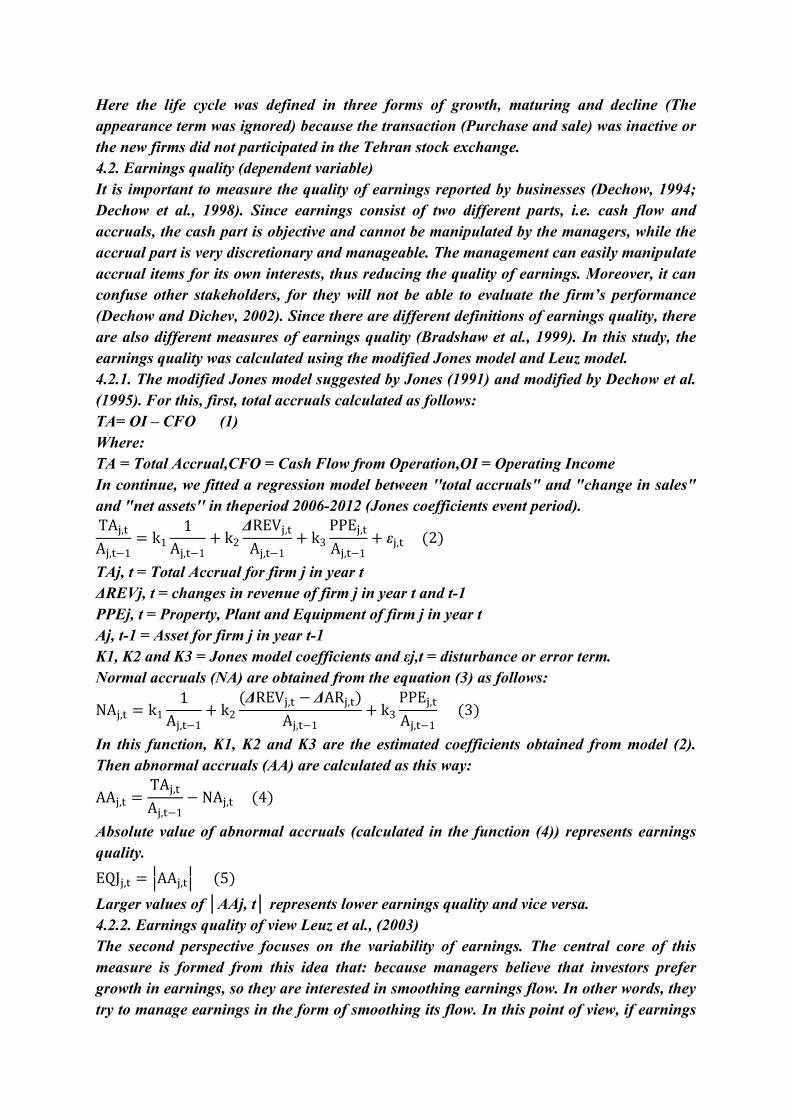
Here the life cycle was defined in three forms of growth, maturing and decline (The appearance term was ignored) because the transaction (Purchase and sale) was inactive or the new firms did not participated in the Tehran stock exchange. 4.2. Earnings quality (dependent variable) It is important to measure the quality of earnings reported by businesses (Dechow, 1994; Dechow et al., 1998). Since earnings consist of two different parts, i.e. cash flow and accruals, the cash part is objective and cannot be manipulated by the managers, while the accrual part is very discretionary and manageable. The management can easily manipulate accrual items for its own interests, thus reducing the quality of earnings. Moreover, it can confuse other stakeholders, for they will not be able to evaluate the firm’s performance (Dechow and Dichev, 2002). Since there are different definitions of earnings quality, there are also different measures of earnings quality (Bradshaw et al., 1999). In this study, the earnings quality was calculated using the modified Jones model and Leuz model. 4.2.1. The modified Jones model suggested by Jones (1991) and modified by Dechow et al. (1995). For this, first, total accruals calculated as follows: TA= OI – CFO (1) Where: TA = Total Accrual,CFO = Cash Flow from Operation,OI = Operating Income In continue, we fitted a regression model between ''total accruals" and "change in sales" and "net assets'' in theperiod 2006-2012 (Jones coefficients event period). TA ,A , −1 = k1 1A , −1 + k2 ΔREV ,A , −1 + k3 PPE ,A , −1 + ε , (2)
TAj, t = Total Accrual for firm j in year t ΔREVj, t = changes in revenue of firm j in year t and t-1 PPEj, t = Property, Plant and Equipment of firm j in year t Aj, t-1 = Asset for firm j in year t-1 K1, K2 and K3 = Jones model coefficients and εj,t = disturbance or error term. Normal accruals (NA) are obtained from the equation (3) as follows: NA , = k1 1A , −1 + k2 (ΔREV , − ΔAR , )A , −1 + k3 PPE ,A , −1 (3)
In this function, K1, K2 and K3 are the estimated coefficients obtained from model (2). Then abnormal accruals (AA) are calculated as this way: AA , = TA ,A , −1 − NA , (4)
Absolute value of abnormal accruals (calculated in the function (4)) represents earnings quality. EQJ , = ||AA , || (5)
Larger values of │AAj, t│ represents lower earnings quality and vice versa. 4.2.2. Earnings quality of view Leuz et al., (2003) The second perspective focuses on the variability of earnings. The central core of this measure is formed from this idea that: because managers believe that investors prefer growth in earnings, so they are interested in smoothing earnings flow. In other words, they try to manage earnings in the form of smoothing its flow. In this point of view, if earnings

of company fluctuate continuously, then it is obvious to conclude that obtained earnings of that company has not required quality. Leuz et al. (2003) formulated variability of earnings through dividing the standard deviation of operating income on standard deviation of operating cash flow. In this model, the less proportion indicates the lower quality of earnings. This view model is as follows: EQL , = Sd. OI ,Sd. CFO ,
EQL=in terms of earnings quality of view Leuzet al., SDOI = standard deviation of operating profit for 5 periods. SDCFO = standard deviation of operating cash flow for 5 periods.
5. Methods of data analysis and hypothesis testing 5.1. Sample selection
The sample is drawn from the population manufacturing companies listed on the Tehran Stock Exchange during 2006-2012. In this research census method has been used. In order to choose our statistical units, those firms having the following characteristics have been chosen as our statistical units: 1-These companies are listed in Tehran Stock Exchange before the year 2006. 2-Their financial period has not changed during the studied period. 3-Their information such as financial statements and notes are available. 4-The companies should be profitable. According to the above conditions, 105 company (735 years - companies) during 2006and 2012 were selected and in those 82, 577 and 76 years - companies were in growing, mature and decline stages respectively. The data needed for analysis are gathered from audited financial statements and decisions taken in annual general meetings. Necessary information was extracted by referring to financial reports, general meeting reports, and the stock exchange database.Independent and dependent variables and primary processing of data were carried out by Excel.Finally, SPSS and R software are used to perform statistical analysis and panel data analysis are used to investigate the objectives also the significance level for testing the hypothesis is 95 percent. 5.2. Descriptive statistics The descriptive statistics of variables for105 firms in during7 years are presented in Table 3.
Table 3. Summary of descriptive statistics
growth stage decline stage
Variables N Mean MedianStd. N Mean Median Std.
dpr 82 53.40 54.08 26.84 76 98.19 95.85 35.52 SG 82 48.93 35.06 115.68 76 -1.99 -0.31 15.77
CEV 82 16.36 7.80 33.31 76 -4.92 -1.86 14.45 AGE 82 25.22 22 11.14 76 43.97 47 10.07 TA 82 52123 13898 217951 76 25854 2363/5 409180

NA 82 0.64 0.57 0.39 76 0.47 0.40 0.42 AA 82 -0.55 -0.47 0.46 76 -0.45 -0.42 0.44 OI 82 334000 90800 731500 76 417000 113000 1541000
CFO 82 282000 45300 689300 76 391000 82800 1399000 mature stage Total
dpr 577 75.32 80.25 47.32 735 75.24 79.88 45.53 SG 577 19.43 15.37 34.38 735 20.51 15.49 50.73
CEV 577 3.08 1.04 16.26 735 3.73 1.10 19.42 AGE 577 33.80 35 12.38 735 33.90 35 12.7814 TA 577 56765 8136 617550 735 53051 7801 567197 NA 577 0.48 0.38 0.60 735 0.49 0.40 0.57 AA 577 -0.35 -0.35 1.03 735 -0.38 -0.36 0.94 OI 577 402000 98700 1267000 735 396000 99300 1250000
CFO 577 346000 76400 1119000 735 343000 69400 1112000 As it shown, the results of descriptive statistics for each variable have been given separately for each of life cycle stages. The main central indicator is mean, which shows the balance point and gravity center of distribution and it is a good indicator for showing the centrality of data. For example, the mean of dpr, SG, CEV, AGE, TA, NA, AA, OI, CFO in growth stage are 53.4, 48.93, 16.36, 25.22, 52123, 0.64, -0.55, 334000, 282000. The mean of dpr, SG, CEV, AGE, TA, NA, AA, OI, CFO in maturity stage are 75.32, 19.43, 3.08, 33.8, 56765, 0.48, -0.35, 402000, 346000 and The mean of dpr, SG, CEV, AGE,TA, NA, AA, OI, CFO in decline phase are 98.19, -1.99, -4.92, 43.97, 25854, 0.47, -0.45, 417000, 391000. Companies in growth stage have the highest sales growth and CEV and companies in the decline stage have the lowest sales growth and CEV. Companies in growth stage have the lowest AGE and companies in the decline stage have the highest AGE. Median is another central indicator which shows social condition. As is evident in Table 3 median of AGE variable in growth stageis 22 which show that half of data is less than quantity and other half of data is more than this quantity. Dispersion parameters is a criterion for determining the dispersion of each other or their dispersion proportion to mean standard deviance is one of the most important dispersion parameters the quantity of this parameter for SG variable in maturity stage equals 34.38.
5.2. Testing the hypotheses
5.3.1. Hypothesis testing using The Modified Jones modelto assessing the quality of earnings 5.3.1.1. Identify the appropriate models for hypotheses testing
As can be seen from the results of Table 4, To determine the appropriate method for estimating the model, first F-Limer test is performed to select one of the common effects and fixed effects methods and, if necessary Hausman test (to select one of the fixed effects and random effects methods) and other methods are performed to select the appropriate method. According to the results presented, appropriate method for testing hypotheses (using The Modified Jones model) is GLS method.
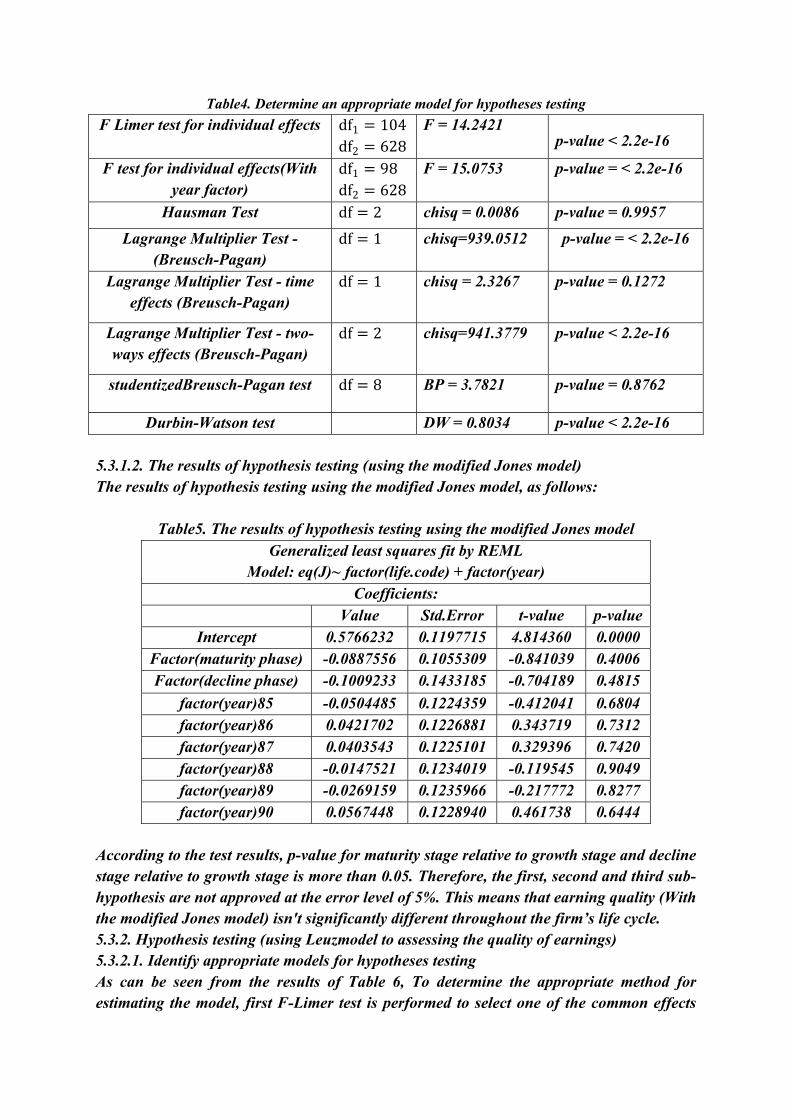
Table4. Determine an appropriate model for hypotheses testing
p-value < 2.2e-16 F = 14.2421 df1 = 104 df2 = 628
F Limer test for individual effects
p-value = < 2.2e-16 F = 15.0753 df1 = 98 df2 = 628 F test for individual effects(With
year factor)
p-value = 0.9957 chisq = 0.0086 df = 2 Hausman Test
p-value = < 2.2e-16 chisq=939.0512 df = 1 Lagrange Multiplier Test - (Breusch-Pagan)
p-value = 0.1272 chisq = 2.3267 df = 1 Lagrange Multiplier Test - time effects (Breusch-Pagan)
p-value < 2.2e-16 chisq=941.3779 df = 2 Lagrange Multiplier Test - two-ways effects (Breusch-Pagan)
p-value = 0.8762 BP = 3.7821 df = 8 studentizedBreusch-Pagan test
p-value < 2.2e-16 DW = 0.8034 Durbin-Watson test 5.3.1.2. The results of hypothesis testing (using the modified Jones model) The results of hypothesis testing using the modified Jones model, as follows:
Table5. The results of hypothesis testing using the modified Jones model
Generalized least squares fit by REML Model: eq(J)~ factor(life.code) + factor(year)
Coefficients: Value Std.Error t-value p-value
Intercept 0.5766232 0.1197715 4.814360 0.0000 Factor(maturity phase) -0.0887556 0.1055309 -0.841039 0.4006 Factor(decline phase) -0.1009233 0.1433185 -0.704189 0.4815
factor(year)85 -0.0504485 0.1224359 -0.412041 0.6804 factor(year)86 0.0421702 0.1226881 0.343719 0.7312 factor(year)87 0.0403543 0.1225101 0.329396 0.7420 factor(year)88 -0.0147521 0.1234019 -0.119545 0.9049 factor(year)89 -0.0269159 0.1235966 -0.217772 0.8277 factor(year)90 0.0567448 0.1228940 0.461738 0.6444
According to the test results, p-value for maturity stage relative to growth stage and decline stage relative to growth stage is more than 0.05. Therefore, the first, second and third sub-hypothesis are not approved at the error level of 5%. This means that earning quality (With the modified Jones model) isn't significantly different throughout the firm’s life cycle. 5.3.2. Hypothesis testing (using Leuzmodel to assessing the quality of earnings ) 5.3.2.1. Identify appropriate models for hypotheses testing As can be seen from the results of Table 6, To determine the appropriate method for estimating the model, first F-Limer test is performed to select one of the common effects

and fixed effects methods and, if necessary Hausman test (to select one of the fixed effects and random effects methods) and other methods are performed to select the appropriate method. According to the results presented, appropriate method for testing hypotheses (using the Leuz model) is GLS method.
Table 6.Determine an appropriate model for hypotheses testing
p-value < 2.2e-16 F = 3.5504 df1 = 104 df2 = 628 F Limer test for individual effects
p-value < 2.2e-16 F = 3.6848 df1 = 98 df2 = 628 F test for individual effects(With
year factor)
p-value = 0.9602 chisq = 0.0812 df = 2 Hausman Test
p-value < 2.2e-16 chisq=155.0254 df = 1 Lagrange Multiplier Test - (Breusch-Pagan)
p-value = 0.76 chisq = 0.0933 df = 1 Lagrange Multiplier Test - time effects (Breusch-Pagan)
p-value < 2.2e-16 chisq=155.1188 df = 2 Lagrange Multiplier Test - two-ways effects (Breusch-Pagan)
p-value = 0.3562 BP = 8.8375 df = 8 studentizedBreusch-Pagan test
p-value < 2.2e-16 DW = 0.9454 Durbin-Watson test
5.3.2.2. The results of hypothesis testing (using the Leuz model) The results of hypothesis testing using the Leuz model, as follows:
Table7. The results of hypothesis testing using the Leuz model Generalized least squares fit by REML
Model: eq(L) ~ factor(life.code) + factor(year) Coefficients:
Value Std.Error t-value p-value Intercept 0.8178353 0.08488546 9.634574 0.0000
factor(maturity phase) 0.0728358 0.07479276 0.973834 0.3305 factor(decline phase) -0.0293804 0.10157385 -0.289251 0.7725
factor(year)85 0.0420346 0.08677376 0.484416 0.6282 factor(year)86 -0.0533897 0.08695249 -0.614010 0.5394 factor(year)87 -0.0295929 0.08682633 -0.340829 0.7333 factor(year)88 -0.0975878 0.08745838 -1.115820 0.2649 factor(year)89 -0.1256664 0.08759642 -1.434606 0.1518 factor(year)90 -0.1098001 0.08709843 -1.260644 0.2078
According to the test results, p-value for maturity stage relative to growth stage and decline stage relative to growth stage is more than 0.05. Therefore, the first, second and third sub-

hypothesis are not approved at the error level of 5%. This means that earning quality (With the Leuz model) is not significantly different throughout the firm’s life cycle.
5. Discussion and Conclusion
Today, with limitations that exist in the reported accounting profits, investors still know earnings quality a better indicator of how they allocate their resources. When accounting profit has quality that it has continuity and predictability. If profit has high quality, shareholders can select stocks for investment with confidence (Shorvarzy, 2008). According to the theory of life cycle, financial characteristics of a company affected by the stage of the life cycle that company is located in it. In fact, companies are following specific policy by considering each stage of its economic life cycle. These policies are reflected in the company’s accounting information. Therefore, the main objective of this study is to investigate the effect of company's life cycle on earnings quality in accepted corporations in Tehran Stock Exchange (TSE). For this purpose, a sample of 105 companies during the years 2006-2012 is used. Also the Modified Jones' model (1995) and Luez et al., model's (2003) have been used to calculate earnings quality. The results show that earning quality in Tehran Stock Exchange is not significantly different throughout the firm’s life cycle. With a confidence of 95%, we can draw this conclusion that the firm’s life cycle cannot have any influence on earning quality. The obtained results of the study are in accordance with Monem (2007) and Harasani (2010). They concluded that the quality of corporate profits will follow a random step model and Process for earnings quality over time does not exist. It seems in Iran, manager’s compensation is based on some measures of performance, so managers manipulated the profit also we can say this could be due to a lack of investors' ability to analyze financial statements, including profit and quality of the items and have not sufficient knowledge of the earnings quality in companies on the Tehran Stock Exchange.
References 1. Abdelghany, K. (2005).Measuring the Quality of Earnings. Managerial Auditing
Journal, 20(9):1001-1015. 2. Aharony, J., H Falk. & N. Yehuda. (2006). Corporate Life Cycle and the Value-
Relevance of Cash Flow versus Accrual Financial Information. School of Economics and Management Bolzano, Italy, Working Paper: 34.
3. Ahmadpoor, A. &Ahmadi, A. (2008). Using qualitative characteristics of financial data in assessing profit quality. Accounting and Auditing Studies, 52:3-16.
4. Anthony, J.H. & Ramesh, K. (1992). Association between Accounting Performance Measures and Stock Prices a test of the life cycle hypothesis. Journal of Accounting and Economics, 15:203-217
5. Bailey, W., Haitao, L., Connie,.X.&Zhong, R.(2003). Regulation Fair Disclosure and Earnings Information: Market, Analyst, and Corporate Responses, The Journal of Finance, 58(6):2487-2514.
6. Beneish, M.Vagus,M.(2002). Insider Trading, Earning Quality, and Accrual Mispricing, The Accounting Review, 77(4):755-791.
7. Bixia, X. (2007). Life Cycle Effect on the Value Relevance of Common Risk factor.
Review of Accounting and Finance, 6:162-175. 8. Black,E.L. (1998). Life-Cycle Impacts on the Incremental Relevance of Earnings and
Cash flow Measures. Journal of Financial Statement Analysis, 4(1): 40-56. 9. Bradshaw, M., Richardson, S. & Sloan, R.(1999). Earnings Quality and Financial
Reporting Credibility: An Empirical Investigation, Available at SSRN: http://ssrn.com/abstract=170558.
10. Chatresahar,.S.E., Mojarad,. M., Kamizi,. A. & Borhan,. Z.(2013), The Relation between Financial Reporting Quality and Cash Dividend, World of Sciences Journal, 01(15):84-90
11. Dechow, P. &Dichev, D. (2002) .The quality of accruals and earnings: the role of accrual estimation errors. The Accounting Review, 77: 35-59.
12. Dechow, P. & Skinner, D. (2000). Earnings Management: Reconciling the Views of Accounting Academics, Practitioners, and Regulators, Accounting Horizons, 14(2):235-250.
13. Dechow, p. (1994). Accounting earning and cash flows as measures of firm performance-The role of accounting accruals, Journal of Accounting and Economics, 18: 3-42.
14. Dechow, P.M., Sloan, R.G., and Sweeney, A.P. (1995). Detecting Earnings Management. The Accounting Review, 70(2): 193-225.
15. Dechow,P.M., Kothari,S.P.& Watts, R.L.(1998). The Relation between Earnings and Cash flow, Journal of Accounting and Economics, 25(2):133-168.
16. Esmaeeli, Sh. (2007). Quality of earnings. Journal of Accounting, 184: 5-8. 17. Francis, J., Lafond, R., Olsson, P. &Schipper, K. (2004).Costs of Equity and Earnings
Attributes. The Accounting Review, 79: 967-1010. 18. Ghorbani, A. (2006). The relationship between earnings and cash flows in the firm life
cycle, M. A Thesis, Islamic Azad University of Mashhad. 19. Ghosh, A. & Moon, D. (2010). Corporate Debt Financing and Earnings Quality,
journal of business finance & accounting, 37: 538-559. 20. Giroux, Gary (2004), Detecting Earnings Management. New York: John Wiley &
Sons. 21. Givoly,D., Hayn,C.& Sharon, P.K. (2010). Does Public Ownership of Equity Improve
Earnings Quality?,The Accounting Review, 85(1): 195-225. 22. Harasani, R., (2010), Earnings quality trend of change over time in the listed
companies in Tehran Stock Exchange, M. A Thesis, AllamehTabatabai University in Iran.
23. Hermanns, S. (2006).Financial Information and Earnings Quality: a Literature Review.Working Paper SSRN. Available at SSRN: Http: //ssrn.com /abstract = 897722.
24. Hodge,F.(2003).Investors' perceptions of earnings quality , auditor independence , and the usefulness of audited financial information, supplement Accounting Horizons, pp.37-48.
25. Jahankhani, A. &ZarifFard, A. (1995).Do managers and stockholders use suitable criteria to assess the firm's value?, Financial investigations, 7 & 8: 41-66.
26. Jenkins, D.S., Kane, G.D. and Velury, U. (2004). The impact of the corporate life-cycle on the value-relevance of disaggregated earnings components .Review of Accounting and Finance, 3: 5-20.
27. Jones, J. (1991). Earnings management during import relief investigation. Journal of Accounting Research, 29:193-228.
28. Kirschenheiter, M. & Melumad, N. (2004), Earnings' quality and smoothing?, working paper Columbia Business school, pp.65. Available at: http://www.krannert.purdue.edu/events/bkd_speakers/papers/mikespaper.pdf.
29. Leuz, C., Nanda, D. & Wysocki, P. (2003). Earning Management and Investor Protection. Journal of Financial Economics, 69: 505-527.
30. Lev, B. (1989).On the usefulness of earning and earning research: Lessons and Directions from two decades of empirical research, Journal of Accounting Research, 27:153-192.
31. Mikhail, M, Walther, B, & Willis, R. (2003). Reactions to Dividend Changes Conditional On Earning Quality. Journal of Accounting Auditing and Finance, 18(1): 121-151.
32. Monem ,.R. & Farshadfar ,S.H.(2007).Has Earnings Quality Declined Over Time?Australian Evidence, Illinois International Accounting Symposium, Available at http://www.business.illinois.edu/accountancy/research/vkzcenter/conferences/hawaii/index.html
33. Mueller, D. C. (1972). A Life Cycle Theory of the Firm. Journal of Industrial Economics.20 (3):199-219.
34. Mueller, D. C. (1975). Life Cycle Effects on Corporate Returns on Retentions. The Review of Economics and Statistics, 57(4): 400-409.
35. Myers, S.C. (1977).Determinants of Corporate Borrowing .Journal of Financial Economics, 5:147-175.
36. Osta, S., Qytasy, R. (2012) .The firm life cycle on discretionary accruals. Research in Financial Accounting, 11: 89 - 104.
37. Park, Y. & Chen, K. (2006). The Effect of Accounting Conservatism and Life-Cycle Stages on Firm Valuation. Journal of Applied Business Research, 22: 75-92.
38. Penman, S. & Zhang, X. (2002), accounting conservatism, the quality of earnings, and stock returns, The Accounting Review, 77 (2): 237-264.
39. Prentice ,H. Wild, J. J. (1996).The Audit Committee and Earnings Quality .Journal of Accounting, Auditing and Finance, 11: 246-266.
40. Revsine, L. & Collins, D. & Johnson, B. (1999). Financial Reporting and Analysis. New Jersey, Upper Saddle River, Prentice Hall.
41. Richardson, S. & Sloan, R. & Soliman, M, & Tuna, I. (2001).Information In Accruals about the Quality of Earnings. Working paper university of Michigan business School, Ann. Arbor, pp.52.
42. Richardson, S. (2003). Earnings Quality and Short Sellers, supplement accounting horizons,pp.49-61
43. Saghafi, A. &Kordestani, G, (2004). Review and Description of the Relationship between Earnings Quality and Market Reaction to Changes in Cash Earnings,Reviews
of Accounting and Auditing, 37:51-72 44. Schipper, K. & Vincent, L. (2003). Earnings quality, Accounting Horizons,
supplement 17: 97-110. 45. Scholer, F. (2004).The quality of accruals and earnings and the market pricing of
earnings quality, working paper Aarhus school of business, 1-13. 46. Scott, W. R. (2003). Financial Accounting Theory (3th Edition). Toronto, Canada,
Prentice Hall. 47. Shen, C. & Chih, H.(2007).Earning Management and Corporate Governance in
Asia's Emerging Markets. Corporate Governance: An International Review, 15:999-1021
48. Shorvarzy, M.R. (2008), Presentation a model for assessing the earnings quality using qualitative characteristics of theoretical concepts of financial reporting in Iran.
49. Sugianis, T. (1996). The value Relevancy of Research Development on valuation of future Earnings.Journal of Accounting and Economics, 21:128-142.
50. Tehrani, R. &Zakeri, H. (2009). Investigation the relationship between earnings quality and dividend in the companies listed in Tehran Stock Exchange. Stock Exchange Journal, 2(5):39-55.
51. Watts R, Zimmerman J. (1990). Positive accounting theory, Englewood Cliffs, NJ. 52. White, G., Sondhi, A. & Fried, D. (2003). The analysts and use of financial
statements, john Wiley and Sons, third edition,