an olympic mosaic - ddd.uab.cat · 3. the ability of barcelona’s economy to capitalise on the...
TRANSCRIPT

OlympicAn
Mosaic
AnOlympicMosaic
OLIMPIC_ING_CS4.indd 1OLIMPIC_ING_CS4.indd 1 06/06/11 11:4306/06/11 11:43

EditorsEmilio Fernández Peña, Berta Cerezuela, Miquel Gómez Benosa, Chris Kennett, Miquel de Moragas Spà.
PublishersAjuntament de Barcelona and Centre d’Estudis Olímpics de la Universitat Autònoma de Barcelona
Barcelona City Council Publications BoardIgnasi Cardelús, Enric Casas, Eduard Vicente, Jordi Martí, Màrius Rubert, Jordi Campillo, Glòria Figuerola, Víctor Gimeno, Joan A. Dalmau, Carme Gibert, José Pérez Freijo.
Translation and Language CorrectionSteve Norris, UAB Servei d’Idiomes Moderns, Anna Baldirà
Design and LayoutMireia Rocher, Ramon G. Sedó,
Publishing and PrintingDirecció d’Imatge i Serveis Editorialswwww.bcn.cat/publicacions
© Of the publication: Ajuntament de Barcelona and Centre d’Estudis Olímpics de la Universitat Autònoma de Barcelona© Of the texts: The authorsISBN Ajuntament de Barcelona: 978-84-9850-317-3ISBN Centre d’Estudis Olímpics 978-84-938759-2-3Legal Deposit: B: 23138-2011April 2011Printed on paper from sustainable sources
AcknowledgmentsThis book has been published within the framework of celebrations marking the 20th anniversary of the Olympic Studies Centre at the Autonomous University of Barcelona (CEO-UAB), which was founded in June 1989.We would like to express our thanks to all the people and institutions that, in one way or another, have helped to make this project a reality. And, in particular, to CEO-UAB co-founder Barcelona City Council, which has made the printing of this publication possible.
The contents of this book may not be reproduced in whole or in part, or recorded or transmitted by an information retrieval system in any form or by any means, whether photomechanical, photochemical, electronic, photocopying or otherwise, without prior written permission from the publishers.
Centre d’Estudis Olímpics (CEO-UAB)Universitat Autònoma de BarcelonaCampus UAB — Edifi ci N, planta 1E-08193 Bellaterra (Cerdanyola del Vallès)Barcelona, Catalunya — SpainTel. +34 93 581 19 92Fax: +34 93 581 21 [email protected] http://ceo.uab.cat
OLIMPIC_ING_CS4.indd 2OLIMPIC_ING_CS4.indd 2 02/06/11 11:1702/06/11 11:17

AnOlympicMosaic
Editors
Emilio Fernández Peña
Berta Cerezuela
Miquel Gómez Benosa
Chris Kennett
Miquel de Moragas Spà
OLIMPIC_ING_CS4.indd 3OLIMPIC_ING_CS4.indd 3 06/06/11 11:4406/06/11 11:44

ContentsForeword ............................................................................................................................................................... 9Ana Ripoll
Preface................................................................................................................................................................. 11
Alejandro Blanco
Introduction ........................................................................................................................................................ 13Emilio Fernández Peña The Academic Reasons for an Olympic Studies Centre at the University .................................................... 19Miquel de Moragas
Origins and Evolution of an Olympic Studies CentreThe Origins of CEO-UAB, 1989-1994 ................................................................................................................ 31Muriel Ladrón de Guevara
The Management of Information and Documentation at a Research Centre Service:The CEO-UAB Information and Documentation Service (IDS) ....................................................................... 39
Berta Cerezuela and Pilar Cid Leal
The Olympic Movement and the Academic World .......................................................................................... 47Nuria Puig Brandes
CEO-UAB as a Driving Force for Olympic Studies..........................................................................................57Testimonies by international experts, valuing the legacy of CEO-UAB:
• Deanna Binder (Institute for Olympic Education at the University of Alberta) .............................................................58
• Susan Brownell (University of Missouri, St. Louis) .......................................................................................................59
• Richard Cashman (University of Technology, Sydney) .................................................................................................60
• Laurence Chalip (University of Texas at Austin) ...........................................................................................................61
• Gabriel Colomé (Opinion Studies Centre, Government of Catalonia ) ..........................................................................62
• Lamartine P. DaCosta (Gama Filho University) ............................................................................................................63
• Conrado Durántez (Spanish Olympic Academy) ...........................................................................................................64
OLIMPIC_ING_CS4.indd 5OLIMPIC_ING_CS4.indd 5 02/06/11 11:1702/06/11 11:17

• Kang Shin-Pyo (Inje University) .....................................................................................................................................65
• Bruce Kidd (University of Toronto) ................................................................................................................................66
• John J. MacAloon (University of Chicago) ....................................................................................................................67
• Andy Miah (University of the West of Scotland) ............................................................................................................68
• Roy Panagiotopoulou (National and Kapodistrian University of Athens) .....................................................................69
• Hai Ren (Beijing University of Physical Education) .......................................................................................................70
• Nancy K. Rivenburgh (University of Washington) ........................................................................................................71
• Otto J. Shantz (University of Koblenz-Landau) .............................................................................................................72
The 1992 Olympic GamesJuan Antonio Samaranch, Pasqual Maragall and Josep Miquel Abad Talk about the Legacyof the Barcelona’92 Olympics 10 Years after the Event .................................................................................. 77
Miquel Botella and Miquel de Moragas
The Shadow of Barcelona .................................................................................................................................. 87Isidre Rigau
The Olympic Ceremonies at Barcelona’ 92: The vast smorgasbord of media images ................................ 97Núria Garcia
The Cultural Olympiad of Barcelona’92. Lights and Shadows. Lessons for the Future ........................... 103Miquel de Moragas
Knowledge and the Barcelona Olympics: Preservation of and access to the memory of the Barcelona’92Olympic Games through documentary sources ........................................................................................... 115Berta Cerezuela
Barcelona’92 and the Study of the Olympic Legacy ..................................................................................... 123Chris Kennett
OLIMPIC_ING_CS4.indd 6OLIMPIC_ING_CS4.indd 6 02/06/11 11:1702/06/11 11:17

Key Topics of Olympism
Television and the Olympic Games: Symbiosis, globality and the construction of meaning .................. 133
Emilio Fernández Peña and Ibone Lallana del Rio
New Media and the Olympic Games:The Olympic Movement and the Social Web in the dissemination of messages ....................................... 143Emilio Fernández Peña The Cultural Dimension of Olympic Games: Ceremoniesand Cultural Olympiads as Platforms for Sustainable Cultural Policy ...................................................... 153Beatriz Garcia
Volunteers as a Variable in the Success of the Olympic Games in the 21st Century ................................. 165Anna Belén Moreno Vílchez
Olympism and Gender Studies ....................................................................................................................... 173Natividad Ramajo and Ibone Lallana del Rio
Post-Olympic Barcelona: Sport and multiculturalism .................................................................................. 181
Chris Kennett
Educational Dimension of the Olympic Games ............................................................................................. 189Berta Cerezuela
Study of Olympic Urban Planning: Research assessment and future outlook .......................................... 199Francesc Muñoz
Analysis of the Economic Impact of the Olympic Games ............................................................................ 211Ferran Brunet
OLIMPIC_ING_CS4.indd 7OLIMPIC_ING_CS4.indd 7 02/06/11 11:1702/06/11 11:17

211
Analysis of the Economic Impactof the Olympic GamesFerran Brunet Tenured Lecturer, Department of Applied Economics, Autonomous University of Barcelona; CEO-UAB Research Collaborator
Introduction
The benefi ts of ‘mega-events’ are twofold: their organisation increases economic activity, particularly investment in infra-structure, and their celebration gives greater international visibility to the place hosting the event.
Major events mobilise a great number of people, managers and workers, attract participants and visitors, and gener-ate major media (particularly from television) and public interest. Sports events are the biggest of all mega-events: an Olympic Summer Games attracts the largest television audience over a two-week period, with the opening and closing ceremonies drawing the largest share.
Therefore, mega-events are a source of business and have become an industry in their own right. The resources required for holding a mega-event can be self-funded with the income received from the sale of broadcast rights, advertising, sponsor-ship and merchandising, and they can attract numerous other sources of investment. Consequently, mega-events can produce signifi cant tangible and intangible assets that, with better management, are greater and more durable.
In today’s world of free movement of capital, goods and people, which is driven by technological developments and where services are essential, particularly those related to a knowledge-based economy, the ability to organise and stage a global mega-event increases the productivity, competitiveness and standard of living of the local population in the host city.
From Barcelona to Beijing, from the World Cup in South Africa to the European Capital of Culture, from Expo 2010 Shang-hai to the Rio 2016 Olympic Games, mega-events have the ability to attract, to make an impact and to promote cities, regions and countries, in some cases for decades after the event.
The analysis of mega-events developed considerably after the Barcelona 1992 Olympic Games (Brunet 1994, Moragas and Botella 1995 and 2002) and subsequent Games (Preuss 2004, Brunet and Xinwen 2009, IOC 2010). We shall examine the resources and legacy of the Barcelona Olympic Games, focusing particularly on their economic impact.
1. Preparing for the Games: Resources for Barcelona (1986-1992)
In pursuit of Barcelona’s dream of hosting an Olympic Games that would be a celebration of excellence in terms of both the human spirit and sporting achievements, the city underwent an impressive urban transformation. Three aspects of
An Olympic MosaicMultidisciplinary Research and Dissemination of Olympic Studies. CEO-UAB: 20 Years
OLIMPIC_ING_CS4.indd 211OLIMPIC_ING_CS4.indd 211 02/06/11 11:1802/06/11 11:18

this process can be highlighted:
1. The Barcelona 1992 Olympic Games were excellent in terms of their organisation and sporting achievements.
2. The urban transformation that resulted from investment in the Games had a major economic and social impact.
3. The ability of Barcelona’s economy to capitalise on the impetus provided by the Games and their capital legacy has resulted in Barcelona being ranked in fourth place as the most attractive European city in 2010, compared to eleventh and sixth in 1990 and 2000, respectively.
As a result, the organisation and impact of the Barcelona 1992 Olympic Games have become a model, from a sports, organi-sational, economic, social and urban perspective. The following aspects will be analysed:
• The organisation of the Barcelona 1992 Olympic Games from the viewpoint of its model and resources for the period 1986-1992.
• The impact of Olympic investments on economic activity, employment, income, construction, tourism and transport, with a focus on the period 1992-2004.
• Barcelona’s ability to capitalise on the impetus provided by the Olympic Games in order to improve its ranking over the period 2004-2020.
1.1. The Barcelona model of organising the Olympic Games
Barcelona’s desire to host the Olympic Games was based on offering excellent sports competitions, in keeping with the Ol-ympic spirit, and to carry out a large-scale urban transformation project that would improve the quality of life and attractive-ness of the city. Without doubt, the key to the success (Samaranch 1992) of the 1992 Olympic Games lay in the strength of its objectives (organisational excellence and urban impact), inter-institutional consensus, the use of special management bodies, mixed funding, and also the ability of the city’s economy to respond to the impetus of the Olympics and to attract investment.
This approach and the excellent results obtained (Ajuntament de Barcelona, several years) comprise the Barcelona model for urban transformation and the organisation of major events. Figure 1 shows the various elements of the Barcelona model of organisation and urban redevelopment.
1.2. Cost of the Olympic Games and funding of investments
With regard to the economic resources for the Olympics, a distinction should be made between organisational costs (not us-able after the Games) and investment in building works (usable). The organisational costs are the real ‘costs’, since they dis-appear as soon as the event has fi nished. For this reason, it is considered advantageous to keep them to a minimum. However, investment is the legacy, the benefi ts of which will remain. It is therefore, advantageous to maximise the level of investment.
The resources allocated to organisational costs and investment, and also their impact, are set out in Figure 2. There is a con-siderable difference between organisational costs (US$1.36 billion, largely self-funded by the Organising Committee) and investment in building work (US$8.01 billion). As a result, investment represented 85.5% of total spending on the Olympics (see Table 1).
212
Analysis of the Economic Impact of the Olympic Games Ferran Brunet
OLIMPIC_ING_CS4.indd 212OLIMPIC_ING_CS4.indd 212 02/06/11 11:1802/06/11 11:18

213
Figure 1. The Barcelona model: organisation, impact and urban transformation
BarcelonaModel ImpactOrganisation
Maximisation, attractionand concentration of investment
Ability to profit from economic influx
Permanent and temporary employment
Olympic legacy and revenue
Continuity of investments
Enhancedpositioning
Neighbourhoodtransformation
InfrastructureScale and extentof interventions
Urbantransformation
Sporting and organisationalexcellence
Institutional unanimity
Mixed economy
Separate managementagencies
Excellent urbanprogramme
Urban transformation
Source: Brunet 1994 and 2009.
Figure 2. Financial resources for Barcelona’92: budgetary and commercial sources, distributionin investment and organisation
Organisation
Investment
Commercial
Budgetary
US$ US$ US$ US$
3.778
8.012
5.598
1.364
Sources Distribution
Financial resources for Barcelona’92 (in billions)
Source: Brunet 1994.
An Olympic MosaicMultidisciplinary Research and Dissemination of Olympic Studies. CEO-UAB: 20 Years
OLIMPIC_ING_CS4.indd 213OLIMPIC_ING_CS4.indd 213 02/06/11 11:1802/06/11 11:18

214
Table 1a. Financial resources for the Barcelona’92 Olympic Games: source, allocation and impact
Accumulated value over the period 1986-1993
(in millions)
Pesetas
(current)
US$
(current)
US$
constant at
2000 rates
Euros
constant at
2000 rates
Distribution
(%)
A. SOURCE OR FINANCING OF RESOURCES (= B) 1,119,510 9,376 11,532 12,474 100.0
1. Resources from commercial sources(commercial income) 668,387 5,598 6,886 7,448 59.7 100.0
Investment from domestic private companies 204,697 1,714 2,108 2,280 18.3 30.6
Investment from foreign private companies 108,320 907 1,116 1,207 9.7 16.2
Investment from Spanish state companies 130,416 1,092 1,343 1,453 11.6 19.5
HOLSA: income from its companies 42,306 354 435 471 3.8 6.3
COOB’92 182,648 1,530 1,882 2,036 16.3 27.3
• Television rights 54,164 454 558 604 4.8 8.1
• Sponsors: monetary contributions 58,152 487 599 648 5.2 8.7
• Sponsors: payments in kind 42,448 356 438 474 3.8 6.4
• Lotteries 20,143 169 208 225 1.8 3.0
• Others 7,741 65 80 87 0.7 1.2
2. Budgetary resources (fi scal income) 451,123 3,778 4,647 5,026 40.3 100.0
Transfers from state to COOB’92 12,947 108 133 144 1.2 2.9
HOLSA: loan to be repaid by MEH and AB 112,590 943 1,160 1,255 10.1 25.0
Investment from public budget 325,586 2,727 3,354 3,628 29.1 72.2
• Barcelona City Council (municipality) 22,789 191 235 254 2.0 5.1• Government of Catalonia
(regional government) 142,726 1,195 1,470 1,590 12.7 25.7
• Government of Spain (central government) 116,124 973 1,197 1,295 10.4 31.6
• European Union 8,100 68 84 91 0.7 1.8
• Other public administrations 35,848 300 369 399 3.2 7.9
Analysis of the Economic Impact of the Olympic Games Ferran Brunet
OLIMPIC_ING_CS4.indd 214OLIMPIC_ING_CS4.indd 214 02/06/11 11:1802/06/11 11:18

215
Table 1b. Financial resources for the Barcelona’92 Olympic Games: source, allocation and impact
Accumulated value over the period 1986-1993
(in millions)
Pesetas
(current)
US$
(current)
US$
constant at
2000 rates
Euros
constant at
2000 rates
Distribution
(%)
B. ALLOCATION OR USE OF THE RESOURCES (= A) 1,119,510 9,376 11,532 12,474 100.0
1. Resources allocated to organisation(Organisational costs of COOB’92 programme)
162,880 1,364 1,678 1,815 14.5 100.0
Competitions 14,045 118 145 157 1.3 8.6Ceremonies & cultural activities 9,053 76 93 101 0.8 5.6Press, radio & television 18,254 153 188 203 1.6 11.2Preparation of facilities (not including
investment in building work) 13,510 113 139 150 1.2 8.3
Technology 24,791 208 256 277 2.2 15.2Services for the Olympic Family 37,023 310 381 412 3.3 22.7Security 4,671 39 48 52 0.4 2.9Management & corporate image 18,618 155 191 207 1.7 11.5Support structures 22,915 192 236 255 2.0 14.1
2. Resources allocated to building work (Public & private investment related to Olympic Games = Olympic legacy)
956,630 8,012 9,855 10,660 85.5 100.0
Roads & transport 404,514 3,388 4,167 4,507 36.1 42.3Telecommunications & services 123,313 1,033 1,271 1,375 11.1 2.9Coasts, recovery & parks 60,438 506 622 673 5.4 6.3Housing, offi ces and business premises 139,741 1,170 1,439 1,556 12.5 14.6Hotels 119,884 1,004 1,235 1,336 10.7 12.5Sports facilities 87,511 733 902 976 7.8 9.1Cultural and health facilities, and others 21,229 178 219 237 1.9 2.2
C. TOTAL ECONOMIC IMPACT 3,107,788 26,028 32,014 34,628 100.0
1. Direct impact 1,165,600 9,762 12,007 12,987 37.5Resources allocated to organisation and building
works (A = B) 1,119,510 9,376 11,532 12,474 36.0
Spending by non-resident visitors 46,090 386 475 514 1.5
2. Indirect impact 1,942,188 16,266 20,007 21,641 62.5
Source: Brunet 1994.
An Olympic MosaicMultidisciplinary Research and Dissemination of Olympic Studies. CEO-UAB: 20 Years
OLIMPIC_ING_CS4.indd 215OLIMPIC_ING_CS4.indd 215 02/06/11 11:1802/06/11 11:18

216
With regard to the organisation, the Organising Committee (COOB’92) closed its accounts in July 1993: spending had totalled 195.59 billion Pesetas45, that is to say, US$1.63 billion (equivalent to US$1.67 billion constant at 2000 rates), with a surplus of US$3 million. As the Olympic project advanced, the investment made by the different public and private entities far exceeded expecta-tions: US$1.98 billion in April 1985, US$6.43 billion in March 1991 and US$9.37 billion in July 1993. The real costs, the organi-sational costs, were maintained in constant Pesetas, whereas the investment stimulated by the Games expanded extraordinarily.
Figure 3. Income and cost structure for the organisation and building work for Barcelona’92
Other
TV
Sponsors
Investment
Media & promotion
Technology & facilities
Competitions, ceremonies & culture
Olympic Family
Security
Organisation
COOB’92 Income COOB’92 Expenditure
62 %
33 %
5 %
19 %
12 %
19 %
17 % 14 %
19 %
Investment
Financing Olympic investments Allocation of Olympic investments
Others
Foreign private companies
European Union
Government of Spain
Government of Catalonia
Barcelona City Council
HOLSA (MEH+AB)
HOLSA companies
Spanish public companies
COOB’92
Spanish private companies
Sports facilities
Hotels
Housing & offices
Coasts, clear up & parks
Telecommunications
Roads & transport
Cultural & health facilities & others22 %
11 %
14 %
4 %12 %
2 %
15 %
12 %1 %
3 % 4 %
42 %
2 %9 %
13 %
15 %
6 %
13 %
Source: Brunet 1994 and Table 1.
45. When Spain joined the European Monetary Union on 1 January 1999, the Peseta was replaced by the Euro at an exchange rate of 166.386 Pesetas to one Euro. This is the rate applied when expressing fi gures in Euros. Over the period 1986-1993, the average exchange rate was 119.4 pesetas to one US Dollar. This is the rate applied when expressing fi gures in US Dollars (FedStats 2007).
Analysis of the Economic Impact of the Olympic Games Ferran Brunet
OLIMPIC_ING_CS4.indd 216OLIMPIC_ING_CS4.indd 216 02/06/11 11:1802/06/11 11:18

217
Of all COOB’92 revenue streams, the growth in self-funded revenue was remarkable, accounting for 75.2% of total revenue. Therefore, sponsorship and television broadcast rights were the main sources of income for the Organising Committee. With regard to organisational costs, the main outgoings were for television and press facilities (an international centre and technology), and the competitions and services for the Olympic Family (see distribution in Table 1 and Figure 3). The main costs for COOB’92 were service acquisition (49.9% of the total), and second, investments (33.8%) (Barcelona Holding Olímpico 1990; COOB’92 1993).
1.3. Revenue of Organising Committees for the Olympic Games
In comparison to other Olympic Games, the Barcelona Games were remarkable for the high level of revenue for Olympic organisation and investment, and for their impact (Figures 4, 5 and 6) (IOC 2002 and 2010). In fact, the Barcelona Olympic Games are notable for the following reasons:
• On a global level, as an organisational model – the memory of the excellence of the organisation and of sporting results lives on (Marshall 2004; Blake 2005) – and as a model for urban transformation.
• On a local level, for the ongoing effects of the high levels of investment, for the scale of the Olympic legacy and the far-reaching impact on improving the world ranking of Barcelona.
For these reasons, an analysis of the investment generated by Barcelona’92, the capitalisation of the Olympic legacy and the ongoing (or lack of) investment and urban transformation is of interest (Brunet 1996 and 2009).
Figure 4. Response of Olympic cities: capitalisation on new capacity
100
150
200Sydney
Atlanta
Seoul
Barcelona
two yearspost
one yearpost
Olympicyear
one yearprior
two yearsprior
100
150
200Sydney
Atlanta
Seoul
Barcelona
A. Increase in hotel room supply: before, during and after the Olympic Games(Room supply index)
B. Increase in foreign visitors: before, during and after the Olympic Games (International arrivals index)
two yearspost
one yearpost
Olympicyear
one yearprior
two yearsprior
Source: Jones Lang LaSalle IP 2002.
An Olympic MosaicMultidisciplinary Research and Dissemination of Olympic Studies. CEO-UAB: 20 Years
OLIMPIC_ING_CS4.indd 217OLIMPIC_ING_CS4.indd 217 02/06/11 11:1802/06/11 11:18

218
Figure 5: Revenue of Organising Committees for the Olympic Games: structure and dynamics 1964-2016
0
200
400
600
800
1000
1200
Ticket sales
Television rights
Sponsorship & licences
Other revenue
Rio
201
6
Lond
on 2
012
Bei
jing
2008
Ath
ens
2004
Syd
ney
2000
Atla
nta
1996
Bar
celo
na 1
992
Seo
ul 1
988
Los
Ang
eles
198
4
Mon
treal
197
6
Mun
ich
1972
Toky
o 19
64
Millions of US$at 2010 rates
Source: Brunet 1994 and 2009 and IOC 2010.
Figure 6: Financial resources generated for the Olympic Games: organisation, investments and impact 1964-2016
0 5000 10000 15000 20000 25000
Resulting economic Impact
Olympic investment generated
Organisation of the Olympics
Rio 2016
London 2012
Beijing 2008
Athens 2004
Sydney 2000
Atlanta 1996
Barcelona 1992
Seoul 1988
Los Angeles 1984
Montreal 1976
Munich 1972
Tokyo 1964
Millions of constant US$at 2010 rates
Source: Brunet 1994 and 2002 and IOC 2002 and 2010.
Analysis of the Economic Impact of the Olympic Games Ferran Brunet
OLIMPIC_ING_CS4.indd 218OLIMPIC_ING_CS4.indd 218 02/06/11 11:1802/06/11 11:18
219
1.4. Building work for the Olympic Games
In order to facilitate the investment process, the Government of Spain and Barcelona City Council combined their assets and Olympic building projects in a joint venture company, Barcelona Holding Olímpico, S.A. (HOLSA). Providing the perfect example of mixed funding, HOLSA built the main Olympic facilities, the majority of the network of 78km of new roads and the Olympic Village.
To fulfi l the aims of Barcelona’92, a vast amount of construction work was required, and much more than was strictly neces-sary for the Olympic Games was generated. This is precisely one of the aims of candidate host Olympic cities: to obtain as much investment as possible for projects that are usable after the Games have ended. Investment related to the Barcelona Games over the period 1986-1993 totalled US$8.01 billion (see Table 1 for details).
The main Olympic building works were:
1. Road and transport infrastructure
2. Housing, offi ces and business premises
3. Telecommunications and services
4. Hotels
5. Sports facilities
6. Environmental infrastructure
A total of 61.5% of the Olympic investment was allocated to infrastructure projects, which indicates a key aspect of Bar-celona’92: their ability to restructure the city.46 For this reason, the greatest and most far-reaching impact of investment in infrastructure is long term.
The construction of various ring roads or bypasses, the re-opening of the seafront with the building of the Olympic Village, the creation of various new areas and Olympic venues in Montjuïc, Diagonal and Vall d’Hebron were the main actions taken in Barcelona (Barcelona Holding Olímpico 1990).
The scale of the urban transformation that took place in Barcelona as a result of the Olympic Games is demonstrated by the following facts: in comparison to 1986, the road system was increased by 15%, the sewerage system by 17%, and parks and beaches by 78%. However, an added feature of Barcelona’92 was the decentralisation of some competitions to several other sub-host cities. As a result, only 38.5% of total investment was allocated to the city of Barcelona, meaning that the immediate impact was felt all over the region.
Another aspect of Barcelona’92 investments will clearly illustrate the economics of these Olympic Games. The construction of sports facilities only accounted for 9.1% of total investment in the Olympic Games. This low percentage refl ected the huge volume of additional indirect investment that was attracted as a consequence of the Olympic Games.
A total of 36.8% of construction work for the Olympics was carried out by the private sector, a third of which was foreign capital. Private investment was directed towards housing, hotels and business centres. Large investments by the private sector in building work for Barcelona’92 were the result of the high expectations created by improvements in the city’s attractive-ness (Roldán 1992).
46. On the subject of urban planning, see Bohigas 1986, Busquets 1992, Esteban 1999, Ajuntament de Barcelona 1999, Marshall 2004 and Pareja et al. 2007.
An Olympic MosaicMultidisciplinary Research and Dissemination of Olympic Studies. CEO-UAB: 20 Years
OLIMPIC_ING_CS4.indd 219OLIMPIC_ING_CS4.indd 219 02/06/11 11:1802/06/11 11:18
220
1.5. Olympic Games fi scal balance
The Olympic Games require public resources which, in turn, generate other public revenue. Thus, the Olympic Games are promoted by the public sector, but the returns will match or possibly exceed the original expenditure. The aim is, therefore, to keep public funding of organisational costs to a minimum, and allocate funds largely to investment in infrastructure and facilities.
Public funding may increase and exceed original budget limits set by politicians. However, the higher the level of public funding, the higher the level of private funding that will be drawn in. Similarly, the capital legacy, such as new business and employment created, will also increase proportionately. As a result, the return on public funding of investments and activities for the Olympic Games will also be greater.
The fi scal balance analyses total public sector expenditure for the Olympic Games and total public sector revenue obtained directly from the Olympic Games and indirectly from activities generated by the Olympic Games.
In the Barcelona’92 fi scal balance, two periods are under consideration: the preparatory period (1986-1992), and the post-Games period. Up to 1992, expenditure on public infrastructure was high, but so was public sector revenue from Olympic activities that did not qualify for tax benefi ts. From 1992 onwards Games-related public sector expenditure was limited to the maintenance of the public capital legacy. Additionally, revenue derived from greater private capital, additional economic activity resulting from the Games and Olympic investment was high. As a result, both periods show a positive fi scal balance.
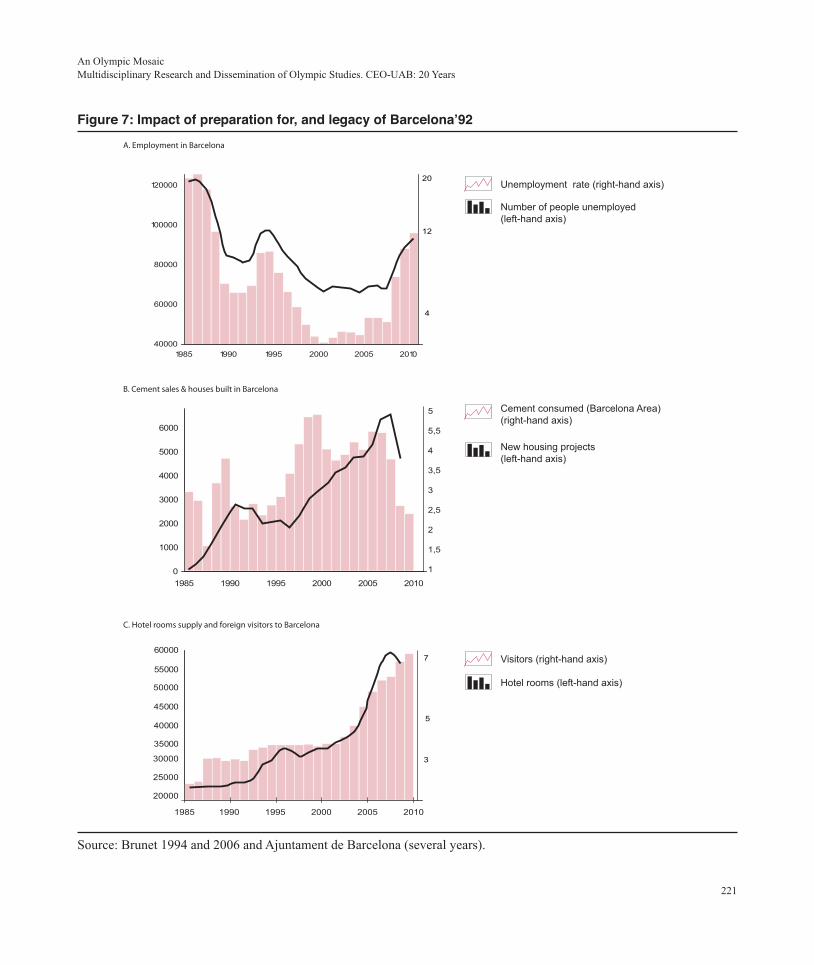
By 2004, the public sector was receiving good returns on its investment in the Olympic Games as shown in Figure 7. The fi scal balance shown in this research has a margin of error of more or less 15% (Brunet 2002). These fi gures do not include revenue derived from social security payments. When included, the fi scal balance surpluses are US$6.83 billion current for the period 1986-1992, US$2.60 billion for the period 1993-2001 and US$3.87 billion for the period 2002-2010.
2. After the Olympic Games: impact on Barcelona (1992-2004)
2.1. Ability to capitalise on the impetus of the Olympic Games and generate investment and economic activity
The impact of the city’s nomination as an Olympic host city was immediate: unemployment fell dramatically and the there was a boom in the housing market and, of course, in the construction industry (Brunet 1995; see Figure 7).
However, what is surprising is the continuity of such an expansive trend. Even though 1993 was not as good as 1992 (as was the case all over the region, Spain, and across Europe), every year since then Barcelona has beaten previous records for eco-nomic growth according to all the indicators: employment, investment, income, attractiveness, etc. Not only did Barcelona react particularly well to the Olympic Games, but it has also managed to maintain the growth on an unprecedented scale.
2.2. Economic dynamics and the impact of the Olympic Games
The labour market in Barcelona and the surrounding area improved substantially in the preparatory period. The number of unemployed fell from an all-time high of 127,774 in November 1986, to an all-time low of 60,885 in July 1992 during the Games (see Figure 7). The unemployment rate in Barcelona fell from 18.4% in October 1986 to 9.6% in August 1992, when the unemployment rate in Spain was 20.9% and 15.5%, respectively. In the preparatory period, the Olympic Games generated employment for an average of 35,309 people per year.
Analysis of the Economic Impact of the Olympic Games Ferran Brunet
OLIMPIC_ING_CS4.indd 220OLIMPIC_ING_CS4.indd 220 02/06/11 11:1802/06/11 11:18
221
Figure 7: Impact of preparation for, and legacy of Barcelona’92
0
1000
2000
3000
4000
5000
6000
35000
40000
25000
30000
20000
1985 1990 1995 2000 2005 2010
45000
50000
55000
60000
1985 1990 1995 2000 2005 2010
Cement consumed (Barcelona Area)(right-hand axis)
New housing projects(left-hand axis)
40000
60000
80000
100000
120000
1985 1990 1995 2000 2005 2010
Unemployment rate (right-hand axis)
Visitors (right-hand axis)
Hotel rooms (left-hand axis)
20
12
4
7
5
3
C. Hotel rooms supply and foreign visitors to Barcelona
B. Cement sales & houses built in Barcelona
A. Employment in Barcelona
5
5,5
4
3,5
3
2,5
2
1,5
1
Number of people unemployed(left-hand axis)
Source: Brunet 1994 and 2006 and Ajuntament de Barcelona (several years).
An Olympic MosaicMultidisciplinary Research and Dissemination of Olympic Studies. CEO-UAB: 20 Years
OLIMPIC_ING_CS4.indd 221OLIMPIC_ING_CS4.indd 221 02/06/11 11:1802/06/11 11:18
222
Furthermore, permanent employment for an estimated 20,019 people was provided by activities related to the Olympic Games. In short, Barcelona’92 was providing an average of 59,328 people with jobs over the period 1987-1993. Therefore, the 66,889 fall in registered unemployed in Barcelona between November 1986 and July 1992 is largely accounted for (88.7%), by the celebration of the Olympic Games in 1992.
Once the Olympic Games had ended, unemployment in Barcelona increased by 21,000, a fi gure similar to the annual em-ployment provided by COOB’92. Over the following years, unemployment fell signifi cantly (see Figure 7). The investment generated by the Olympic Games acted as a cushion against a widespread economic depression. Barcelona’s economy proved to be more resilient against the economic crisis, and from 1994 onwards, new jobs were being created. By 1993, 41,450 new jobs had been created, which halved the unemployment rate. In 1993 and 1994, the number of unemployed increased by 18,000, but from 1995 onwards, this proceeded to fall, partly thanks to the 20,230 permanent jobs created as a result of investment in the Olympics (a legacy of 956 billion Pesetas in equity; see Figure 8).
The rest of the economic indicators demonstrate the progress made by Barcelona in the years following the Olympic Games. This is particularly so in the case of the construction industry. Sales of cement soared (see panel B of Figure 7), increasing by two and a half times between 1986 and 1992, and continued to grow, increasing by three and a half times in 2001. There was also an increase in the construction of housing, even in a city such as Barcelona where potential sites for building had already been extensively exploited.
Barcelona’s hotel capacity escalated and the number of visitors grew accordingly (see panel C of Figure 7). When we com-pare four Olympic cities, Barcelona’s results are consistently the best, and often far ahead of the others, especially in the case of hotel capacity and number of visitors from abroad (see Figure 4).
Barcelona’s response to the impetus of the Olympic Games has been far more intense and sustained than that of other host cit-ies. For this reason, Barcelona has become a model for the impact of an Olympic Games. Barcelona is an exception because of its extraordinary and sustained ability to capitalise on the impulse provided by the Olympic Games.
2.3. The Barcelona model of economic impact of the Olympic Games
Organising the Olympic Games and the related investment had an immediate and considerable impact on Barcelona. How-ever, more surprising than that was the scale of continued impact of the Olympic legacy and the continued impetus of Bar-celona’92 in the post-Olympic period 1992-2004. The Barcelona model of the impact of the Olympic Games and the main results are shown in Figure 9 and Table 2.
The key factor of the Barcelona model of economic impact of the Olympic Games has been the quantity and quality of in-vestments. However, the impact model presupposes a model of organisation which implies a model of urban transformation.
The model of economic impact is based on attracting and maximising investments, over a specifi c period of time. Given the extent of the urban transformation programme, continued investment is essential, as has been the case in Barcelona.
Barcelona has demonstrated great success in capitalising on the impetus provided by the Olympic Games and the impact of investment; these are ideal circumstances for implementing change. The resources allocated to infrastructure and facilities provided temporary employment in construction works and later, permanent employment in the operation of this infrastruc-ture. Both cases resulted in increased economic activity, which, by the way, was not restricted to the city. Increased capital and economic activity has produced better levels of income, well-being and social cohesion, as well as a more attractive city.
Analysis of the Economic Impact of the Olympic Games Ferran Brunet
OLIMPIC_ING_CS4.indd 222OLIMPIC_ING_CS4.indd 222 02/06/11 11:1802/06/11 11:18

223
An Olympic MosaicMultidisciplinary Research and Dissemination of Olympic Studies. CEO-UAB: 20 Years
Temporary employment41,450 jobs for six years
Employment20,230 jobs
Org
anis
atio
nPe
riod
198
6-19
93U
S$1.
36 b
illio
n(1
62.8
8 bi
llion
Pes
etas
)
Com
mer
cial
inco
me
US$
1.25
b(1
49.9
3b P
eset
as)
Budg
etin
com
eU
S$10
8m(1
2.94
b Pe
seta
s)
Inve
stm
ent i
n in
fras
truc
ture
and
fa
cilit
ies
per
iod
1986
-199
2 U
S$8.
01 b
illio
n (9
56.6
3 bi
llion
Pes
etas
)
Publ
icU
S$5.
39b
(643
.61b
Pes
etas
)
Priv
ate
US$
2.62
b(3
13.0
1b P
eset
as)
Econ
omic
& s
ocia
l im
pact
per
iod
1986
-199
2 U
S$16
.26
billi
on
(1,9
42.1
8 bi
llion
Pes
etas
)
Urb
an
tran
sfor
mat
ion
Incr
ease
d em
plo
ymen
tIn
crea
sed
bus
ines
s ac
tivi
ty
Abi
litie
s
Inco
me
from
Oly
mpi
cs
Oly
mpi
c le
gacy
Oly
mp
ic, o
rgan
isat
iona
l kno
w-h
owCu
ltur
e of
exc
elle
nce,
cul
ture
of c
onse
nsus
‘Bar
celo
na M
odel
’ for
org
anis
ing
even
ts, e
cono
mic
imp
act a
nd u
rban
tran
sfor
mat
ion
US$
702m
per
yea
rG
reat
er a
nd b
ette
r eco
nom
ic a
ctiv
ity,
bet
ter q
ualit
y of
life
Incr
ease
d pu
blic
and
soc
ial c
apita
lU
S$5.
39 b
illio
nU
rban
dev
elop
men
tH
ousi
ngPu
blic
tran
spor
tRi
ng ro
ads
Cult
ural
inst
itut
ions
Cle
an u
p, s
por
ts fa
cilit
ies
Seaf
ront
, bea
ches
, par
ks
Incr
ease
d em
plo
ymen
t (20
,230
job
s) a
nd b
ette
r qua
lified
wor
kfor
ceIn
crea
sed
com
pet
itiv
enes
s (2
002:
rank
ed 6
th m
ost a
ttra
ctiv
e Eu
rop
ean
city
for b
usin
ess)
Incr
ease
d pr
ivat
e ca
pita
lU
S$2.
62 b
illio
nH
otel
sBu
sine
ss p
rem
ises
Offi
ces
Hou
sing
Oly
mp
ic M
arin
aC
omp
anie
s
Incr
ease
d ad
ded
valu
eU
S$70
2m p
er y
ear
Incr
ease
d ta
x yi
eld
US$
150m
per
yea
r
Enha
nced
pos
itio
ning
Incr
ease
d p
rodu
ctiv
ity
Incr
ease
d co
mp
etit
iven
ess
Incr
ease
d at
trac
tive
ness
:m
ore
cap
ital
, res
iden
ts &
tour
ism
Soci
al c
ohes
ion
Hig
her l
evel
s of
inco
me
and
wel
l-bei
ng o
f re
side
nts
Org
anis
atio
n +
Inve
stm
ent +
Imp
act
O
lym
pic
lega
cy =
= A
bili
ty +
incr
ease
d ca
pit
al +
hig
her e
mp
loym
ent
+ h
ighe
r lon
g-te
rm e
mp
loym
ent
In
com
e fr
om O
lym
pic
Gam
es
Sour
ce: B
rune
t 200
2.
Fig
ure
8. I
mp
act,
leg
acy
and
rev
enu
e fo
r th
e ci
ty fr
om
sta
gin
g B
arce
lon
a’92
OLIMPIC_ING_CS4.indd 223OLIMPIC_ING_CS4.indd 223 02/06/11 11:1802/06/11 11:18

224
Figure 9: Keys to the success of Barcelona’92
Separate Agenciesfor Organizationand for Works
InstitutionalUnanimity
MixedEconomy
UrbanRenewalCapacity
Excellenceof Sports and
Urban Programme
Source: Brunet 2002.
Table 2: Olympic Decalogue. A strategy for success in the organisation of mega-events
1. Institutional agreement2. Mixed economy: public direction and private management3. Separate bodies: one to organise the Games (sports) and one to manage the construction work and investments (stone)4. The Concentric Circles Principle: Olympic resources are not costs but investments5. Maximise investments and minimise costs6. The Excellence Principle: over two weeks of excellence, you must match all previous organisational efforts and antici-
pate all future ones7. The fi rst benefi ciary of the Games is the state: in the medium term, there is always a fi scal surplus8. From a strategic perspective, the most important period begins after the Games!9. Olympic investments are the legacy
10. Continued investment is needed to maintain and to benefi t from the new strategic position of the city and the country
Source: Brunet 2006.
2.4. Comparison of the impact of the Olympic Games
A database has been set up to compare the impact of various Olympic Games in terms of organisation, investment in infra-structure and facilities and the resulting economic impact (see Table 2 and Figure 6).47
47. On the subject of the impact of the Olympic Games, in addition to IOC 2002 and 2010, see Jong-Gie et al. 1989 and Pyun 1999 for Seoul; Humphreys and Plummer 2002 for Atlanta; Centre for Regional Economic Analysis - Arthur Andersen 1999 and Preuss 2004 for Sydney; ATHOC 2002 for Athens; BOCOG 2007 and Brunet and Xinwen 2009 for Beijing; Thornton et al. 2006 for London; and Rio 2016 Bid 2009 for Rio de Janeiro.
Analysis of the Economic Impact of the Olympic Games Ferran Brunet
OLIMPIC_ING_CS4.indd 224OLIMPIC_ING_CS4.indd 224 02/06/11 11:1802/06/11 11:18

225
Clearly, the case of Barcelona is exceptional. The level of investment in the Olympic Games and their economic impact are un-paralleled by any other Olympic host city. Tokyo was only able to reach half the level of investment made in Barcelona. In Seoul, the level of investment was considerable, but in Atlanta and Sydney it was very limited. Athens made an attempt, and Beijing did indeed follow the Barcelona model of major urban and economic impact (Brunet and Xinwen 2009), as will Rio. London 2012 is making strides to improve its strategic positioning among the creative regions of Europe (Poynter and Macrury 2009).
3. Evaluating the Olympic legacy
3.1. Continued investment: a driving force in Barcelona’s new strategic positioning
In the case of Barcelona’92, investment in infrastructure and facilities was the key factor in the fi nancial resources, economic impact, urban transformation and subsequent rise in economic activity, incomes and well-being.
The quality of the infrastructures in which investment was made, and the level of investment made (€10.66 billion), goes a long way to explaining the enormous success of Barcelona’92. Investment was important for providing the Olympic impe-tus, and has since been important for further developing not only the impact, but also urban transformation and Barcelona’s positioning. Investment in urban transformation in the post-Olympic period has centred on two areas: projects related to the 2004 Universal Forum of Cultures and the Poblenou 22@BCN plan.
The fi rst of these was concerned with transforming the Barcelona coastline, thereby completing the Olympic Village seafront (Brunet 2009). Like the Olympic Games, the Forum was a catalyst for carrying out ambitious urban projects, some of which would be diffi cult to carry out under normal circumstances. This project was primarily funded by the public sector. The second project is concerned with the transformation of the Poblenou neighbourhood (Brunet 1995) next to the Forum. This project was primarily funded by the private sector. Other noteworthy urban transformation projects carried out up until 2004 are the inland districts of Barcelona: Ciutat Vella, Eixample, Gràcia and Nou Barris. These investments constitute, therefore, the Olympic legacy, and go a long way to explaining Barcelona’s economic and social prosperity since the Olympic Games were held.
3.2. Olympic legacy and strategic perspectives
New public and private capital and new permanent employment as a consequence of investments in the Olympic Games constitute the city’s Olympic legacy. Evidence of this legacy can be seen in Barcelona’s urban transformation, its new eco-nomic structure and its increased capitalisation, services sector, international role, attractiveness, centrality, productivity and competitiveness. Barcelona’s exceptional ability to capitalise on and maintain the impetus provided by the Olympic Games and to improve economic activity, incomes, quality of life, social cohesion and strategic positioning is well documented.
Confi dence in Barcelona as a business centre, as expressed by international companies willing to set up in the city, increased considerably following the Games, clearly indicating its new-found attractiveness, availability of services, workforce, market and competiveness (Healey and Baker 2010) (see Table 4).
Barcelona’s ability to capitalise on the impetus of the Olympic Games has acted to counteract limitations, such as disputes between government bodies, and to limit the negative impact of delays in the construction of certain infrastructure projects, such as the high-speed train (AVE), and to overcome the uncertainty surrounding the programmes for urban transformation and the seafront. Despite a number of signifi cant factors that do not favour Barcelona (it is not the capital of Spain, many multinational companies do not have their headquarters in Barcelona, gaps in the public transport system, limited language training, workforce mobility and building ground available etc.), the city still manages to attract investment and business.
An Olympic MosaicMultidisciplinary Research and Dissemination of Olympic Studies. CEO-UAB: 20 Years
OLIMPIC_ING_CS4.indd 225OLIMPIC_ING_CS4.indd 225 02/06/11 11:1802/06/11 11:18
226
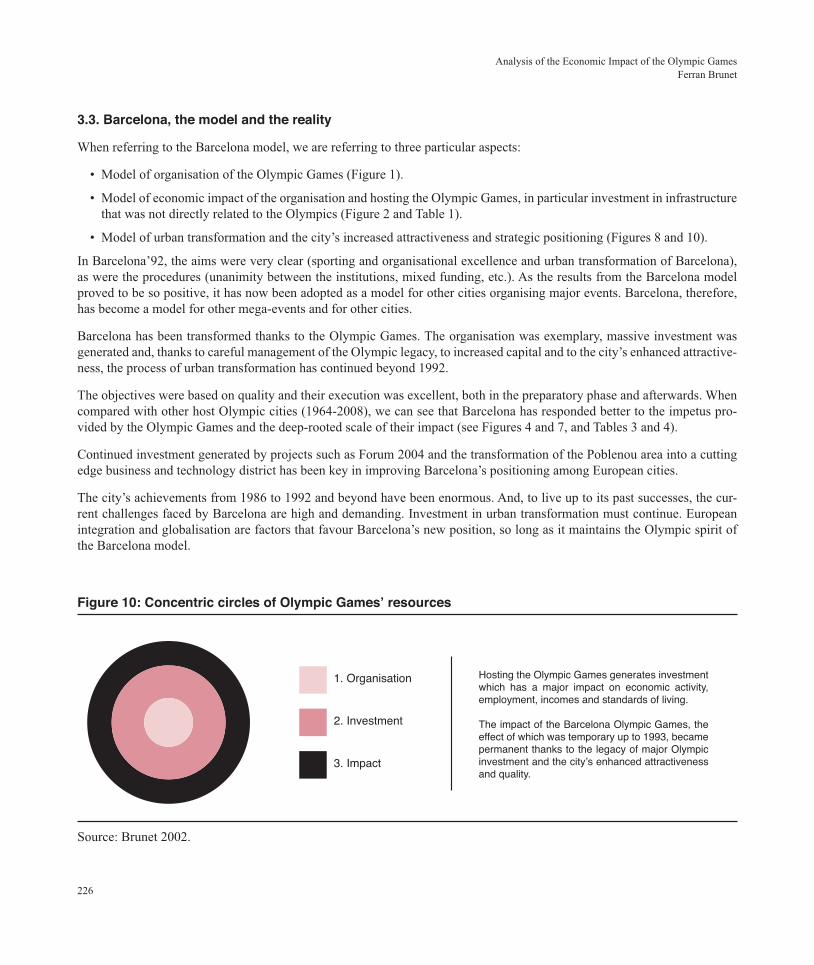
3.3. Barcelona, the model and the reality
When referring to the Barcelona model, we are referring to three particular aspects:
• Model of organisation of the Olympic Games (Figure 1).
• Model of economic impact of the organisation and hosting the Olympic Games, in particular investment in infrastructure that was not directly related to the Olympics (Figure 2 and Table 1).
• Model of urban transformation and the city’s increased attractiveness and strategic positioning (Figures 8 and 10).
In Barcelona’92, the aims were very clear (sporting and organisational excellence and urban transformation of Barcelona), as were the procedures (unanimity between the institutions, mixed funding, etc.). As the results from the Barcelona model proved to be so positive, it has now been adopted as a model for other cities organising major events. Barcelona, therefore, has become a model for other mega-events and for other cities.
Barcelona has been transformed thanks to the Olympic Games. The organisation was exemplary, massive investment was generated and, thanks to careful management of the Olympic legacy, to increased capital and to the city’s enhanced attractive-ness, the process of urban transformation has continued beyond 1992.
The objectives were based on quality and their execution was excellent, both in the preparatory phase and afterwards. When compared with other host Olympic cities (1964-2008), we can see that Barcelona has responded better to the impetus pro-vided by the Olympic Games and the deep-rooted scale of their impact (see Figures 4 and 7, and Tables 3 and 4).
Continued investment generated by projects such as Forum 2004 and the transformation of the Poblenou area into a cutting edge business and technology district has been key in improving Barcelona’s positioning among European cities.
The city’s achievements from 1986 to 1992 and beyond have been enormous. And, to live up to its past successes, the cur-rent challenges faced by Barcelona are high and demanding. Investment in urban transformation must continue. European integration and globalisation are factors that favour Barcelona’s new position, so long as it maintains the Olympic spirit of the Barcelona model.
Figure 10: Concentric circles of Olympic Games’ resources
����������
�����������
���������
� ������������������������������������������� ���� �� ��� �� ������ � �� ��� ������������ ������� ���������������� ������� ��������� ������!����� ��������������������������� ��������������� �����"��� ��##���$�����������������%��� ������������ ����� ���������������������������&�������������������������'"�����
Source: Brunet 2002.
Analysis of the Economic Impact of the Olympic Games Ferran Brunet
OLIMPIC_ING_CS4.indd 226OLIMPIC_ING_CS4.indd 226 02/06/11 11:1802/06/11 11:18

227
Table 3: Olympic Games economy: organisation, investment and impact 1964-2016
Figures expressed in millions of US$ constant at 2010 rate
Direct organisation
of the Games Investments allo-cated to the Games and attractedby them
Economic impact of organisation and
‘Olympic’ investments
Tokyo 1964 169 5,106 5,550
Munich 1972 617 1,652 . .
Montreal 1976 451 3,123 . .
Los Angeles 1984 528 88 . .
Seoul 1988 698 3,908 3,796
Barcelona 1992 1,678 10,330 20,007
Atlanta 1996 543 1,301 3,082
Sydney 2000 1,099 1,387 3,050
Athenes 2004 2,230 4,736 7,420
Beijing 2008 1.435 8,817 22,816
London 2012 1,742 2,078 9,035
Rio de Janeiro 2016 2,815 11,617 . .
Source: Brunet 1994 and 2009 and IOC 2002 and 2010.
4. Conclusion: from Games to mega-events, from sport to competitiveness, from invest-ment to quality of life
The Olympic Games are the ultimate mega-event; they are the focus of the eyes of the world over a two-week period and they generate investment, raise the profi le of cities, regions and countries, sometimes relatively unknown, and make them more attractive.
An analysis of mega-events highlights their most relevant features, which are then often referred to collectively as a model. It has been established that the paradigm know as the ‘Barcelona model’ refers to the following aspects:
• Model of organisation: inter-institutional consensus, excellence of events, separate bodies for organisation and invest-ment, self-funding.
• Model of economics: mixed economy, minimum organisational costs, maximum investment, continuity of investment after the event.
• Model of urban transformation: extent of the transformation, multipolarity, decentralisation and sustainability of actions.
The impact of mega-events such as the Olympic Games can be viewed as three concentric circles: the inner one, like a stone thrown into a pond is the organisation. The second circle, the immediate impact, represents investment, a major component of the funding generated for a major event. The third, outer circle is the economic impact, all the economic activity generated by the Olympic Games.
An Olympic MosaicMultidisciplinary Research and Dissemination of Olympic Studies. CEO-UAB: 20 Years
OLIMPIC_ING_CS4.indd 227OLIMPIC_ING_CS4.indd 227 02/06/11 11:1802/06/11 11:18

Table 4: Competitiveness and ranking of European cities as attractive business locations
City 2010 2005 2000 1990
London 1 1 1 1
Paris 2 2 2 2
Frankfurt 3 3 3 3
Barcelona 4 4 6 11
Brussels 5 5 4 4
Madrid 6 7 8 17
Munich 7 9 10 12
Amsterdam 8 6 5 5
Berlin 9 8 9 15
Milan 10 12 11 9
Geneva 11 20 12 8
Hamburg 12 16 18 14
Zurich 13 10 7 7
Birmingham 14 19 - -
Düsseldorf 15 14 17 6
Manchester 16 21 14 13
Lisbon 17 15 16 16
Dublin 18 11 13 -
Lyon 19 24 20 18
Stockholm 20 17 15 19
Prague 21 13 21 23
Rome 22 26 25 -
Warsaw 23 18 27 25
Leeds 24 28 - -
Copenhaguen 25 27 24 -
Budapest 26 22 22 21
Istanbul 27 29 - -
Vienna 28 23 23 20
Glasgow 29 25 19 10
Bucharest 30 29 - -
Helsinki 31 30 26 -
Moscow 32 31 30 24
Oslo 33 33 28 -
Athens 34 32 29 22
Source: Brunet 1997 and Healey and Baker 2010.
Analysis of the Economic Impact of the Olympic Games Ferran Brunet
228
OLIMPIC_ING_CS4.indd 228OLIMPIC_ING_CS4.indd 228 02/06/11 11:1802/06/11 11:18

As can be seen in Figures 6 and 10, which show a breakdown of funding for the Olympic Games, the fi rst concentric circle relating to organisational costs is the most stable between successive events. Organisational costs have been kept to a mini-mum, which is an important factor in the management of an event.
The second circle relating to investment varies greatly between editions of the Olympic Games. In fact, the aim should be to maximise levels of investment, since most of it is made up of self-funding private investment, much of which comes from abroad; it is attracted by the investment and business opportunities generated by a mega-event.
The third circle relating to the economic impact comprises all the past, current and future tangible and intangible costs and investments. Maximising the impact depends upon the ability of the host city to make the most of all available business op-portunities provided by the Olympic Games and on excellent management of the event.
The second and third circles, relating to investment and impact, are central to a mega-event’s legacy. In today’s global economy where innovation and knowledge are key factors to productivity, hosting such a complex event in the media spot-light brings greater competiveness. For these reasons, organising and staging a mega-event is hugely benefi cial to a creative economy and society.
An Olympic MosaicMultidisciplinary Research and Dissemination of Olympic Studies. CEO-UAB: 20 Years
229
OLIMPIC_ING_CS4.indd 229OLIMPIC_ING_CS4.indd 229 02/06/11 11:1802/06/11 11:18

230
References
Ajuntament de Barcelona. Barcelona economia: indicadors econòmics de Barcelona i de la regió metropolitana. Barcelona: Ajuntament de Barcelona, http://www.bcn.es/publicacions/b_economia/index.htm.
Ajuntament de Barcelona. 1999. Barcelona, 1979-2004: del desenvolupament a la ciutat de qualitat. Barcelona: Ajuntament de Barcelona. http://www.bcn.es/expo1979al2004.
Artur Andersen. 1999. Economic Impact Study of the Sydney 2000 Olympic Games. Sydney: University of Tasmania, Centre for Regional Economic Analysis.
Athens Organising Committee for the Olympic Games, ATHOC. 2002. Annual Report 2000-2001. Athens: ATHOC 2004.
Barcelona Holding Olímpico. 1990. Barcelona, la ciutat i el 92. Barcelona: HOLSA.
Beijing Organising Committee for the Olympic Games, BOCOG. 2007. Finance Department, http://en.beijing2008.cn/bo-cog/organization/n214071835.shtml#cw.
Blake, Adam. 2005. The Economic Impact of the London 2012 Olympics. Nottingham: Christel DeHaan Tourism and Travel Re-search Institut. TTRI Discussion Paper 2005/5. http://www.nottingham.ac.uk/ttri/discussion/2005_5.pdf.
Bohigas, Oriol. 1986. Reconstrucción de Barcelona. Madrid: MOPU.
Brunet, Ferran. 1994. Economy of the 1992 Barcelona Olympic Games. Lausanne: International Olympic Committee.
Brunet, Ferran. 1995. Dimensió econòmica i posició estratègica del Poblenou. Barcelona: Institut Municipal d’Urbanisme.
Brunet, Ferran. 1996. Anàlisi econòmica de les actuacions urbanístiques a Ciutat Vella. Barcelona: Procivesa.
Brunet, Ferran. 1997. “The Economic Impacts of the Olympic Games”. In The Centennial President, dirs. Ferran Brunet, François Carrard and Jean-Albert Corrand, 1-10. Lausanne: International Olympic Committee.
Brunet, Ferran. 2002. “Anàlisi de l’impacte econòmic dels Jocs Olímpics de Barcelona, 1986-2004”. In Barcelona: l’herència dels Jocs (1992-2002), eds. Miquel de Moragas and Miquel Botella, 209-243. Barcelona: Editorial Planeta.
Brunet, Ferran. 2006. An Economic Analysis of the Barcelona’92 Olympic Games: Resources, Financing and Impact. Bel-laterra: Centre d’Estudis Olímpics (CEO-UAB). http://ceo.uab.cat/2010/docs/wp028_spa.pdf.
Brunet, Ferran. 2009. “The Economy of the Barcelona Olympic Games”. In Olympic Cities: 2012 and the Remaking of Lon-don, eds. Gavin Poynter and Iain Macrury, 97-119. Hants: Ashgate.
Brunet, Ferran and Zuo Xinwen. 2009. “The Economy of the Beijing Olympic Games: An Analysis of Prospects and First Im-pacts”. In Olympic Cities: 2012 and the Remaking of London, eds. Gavin Poynter and Iain Macrury, 163-180. Hants: Ashgate.
Busquets, Joan. 1992. Barcelona: evolución urbanística de una ciudad compacta. Madrid: Mapfre-América.
Centre for Regional Economic Analysis - Arthur Andersen. 1999. Economic Impact Study of the Sydney 2000 Olympic Games. Full Report. [Sydney?]: Arthur Andersen ; [Hobart]: Centre for Regional Economic Analysis, University of Tasmania.
COOB’92. 1993. Offi cial Report of the Games of the XXV Olympiad Barcelona 1992. Vols. 2 and 3. Barcelona: Enciclopèdia Ca talana. http://www.la84foundation.org/5va/reports_frmst.htm.
Esteban, Juli. 1999. El projecte urbanístic: valorar la perifèria i recuperar el centre. Barcelona: Fundació Bosch i Gimpera. Aula Barcelona.
Analysis of the Economic Impact of the Olympic Games Ferran Brunet
OLIMPIC_ING_CS4.indd 230OLIMPIC_ING_CS4.indd 230 02/06/11 11:1802/06/11 11:18

231
An Olympic MosaicMultidisciplinary Research and Dissemination of Olympic Studies. CEO-UAB: 20 Years
FedStats. 2007. http://www.fedstats.gov.
Healey and Baker. 2010. European Cities Monitor, http://www.europeancitiesmonitor.eu/.
Horne, John and Wolfram Manzenreiter, eds. 2006. Sport Mega-Events: Social Scientifi c Analyses of a Global Phenomenon. Hoboken: Wiley-Blackwell.
Humphreys, Jeffrey M. and Michael K. Plummer. 2002. The Economic Impact of Hosting the 1996 Summer Olympics. Geor-gia: Selig Center for Economic Growth, Terry College of Business, University of Georgia - IRE Advisors. http://www.selig.uga.edu/forecast/olympics
International Olympic Committee, IOC. 2002. 100 Years of Olympic Marketing Evolution of Olympic Marketing During the 20th Century, http://www.olympic.org/en/content/The-IOC/Commissions/Marketing/Evolution-of-Marketing/.
International Olympic Committee, IOC. 2010. Marketing Fact File. Lausanne: IOC. http://multimedia.olympic.org/pdf/en_report_344.pdf (Consulta 10 octubre 2010).
International Monetary Fund. 2010. When Sports Help Economies Score. Finance and Development, Monograph (March).
Jong-Gie, Kim et al. 1989. Impact of the Seoul Olympic Games on National Development. Seoul: Korea Development Institute.
Marshall, Tim, ed. 2004. Transforming Barcelona. London: Routledge.
Moragas, Miquel de and Miquel Botella, eds. 1995. The Keys to Success: the Social, Sporting, Economic and Communica-tions Impacts of Barcelona’92. Bellaterra: Centre d’Estudis Olímpics, Universitat Autònoma de Barcelona.
Moragas, Miquel de and Miquel Botella, eds. 2002. Barcelona: l’herència dels Jocs (1992-2002). Barcelona: Centre d’Estudis Olímpics (UAB), Ajuntament de Barcelona, Editorial Planeta.
Pareja Eastaway, Montserrat et al. 2007. The City of Marvels? Multiple Endeavours Towards Competitiveness in Barcelona: Pathways to Creative and Knowledge-based Regions. Amsterdam: University of Amsterdam, Institute for Metropolitan and International Development Studies, ACRE Report 2.2.
Poynter, Gavin and Iain Macrury eds. 2009. Olympic Cities: 2012 and the Remaking of London. Hants, UK: Ashgate
Preuss, Holger. 2004. The Economics of Staging the Olympics: A Comparison of the Games 1972-2008. London: Edward Elgar.
Pyun, D. Y. 1999. “The Economic Impact of the Seoul Olympic Games”. In Proceedings of the 7th Annual International Ol-ympic Academic Post Graduate Seminar. Olympia: International Olympic Academy.
Rio 2016 Bid. 2009. Rio 2016 Candidate City: dossier de candidature de Rio de Janeiro à l’accueil des Jeux olympiques et paralympiques du 2016. Rio de Janeiro: Rio 2016 BID.
Roldán, Santiago. 1992. Barcelona olímpica: la ciutat renovada. Barcelona: HOLSA.
Samaranch, Juan Antonio. 1992. “Discours d’ouverture par le président du CIO et Pasqual Maragall, Maire de Barcelone, président du COOB’92”. Revue olympique 300: 473.
Thornton, Grant, Torkildsen Barclay and Christel DeHaan Tourism.Travel Research Institute. 2006. Economic Impact Study of the London 2012 Olympic Games and Paralympic Games. Final Report. London: East of England Development Agency.
OLIMPIC_ING_CS4.indd 231OLIMPIC_ING_CS4.indd 231 02/06/11 11:1802/06/11 11:18