an overview of the family life project -...
TRANSCRIPT

An Overview of the Family Life Project
Mark Greenberg, Ph.D.Emily Werner, Ph.D.Ben Goodman, M.S.
Acknowledgements: This research was supported by a grant from the National Institute of Child Health and Human Development (PO1-HD-39667), Lynne-Vernon Feagans and Martha Cox, PIs, with co-funding from the National Institute on Drug Abuse.

Project Goal
To better understand how child characteristics, family life, and community support interact to contribute to the healthy growth and development of children

Project Investigators
• Mark Greenberg
• Lynne Vernon-Feagans
• Emily Werner
• Clancy Blair / Mark Greenberg
• Lynne Vernon-Feagans
• Martha Cox
• Nan Crouter
• Linda Burton / Debra Skinner
• Peg Burchinal
• Principal Investigator – Penn State
• Principal Investigator – North Carolina
• Project Director – Penn State
• Project 1: Emotion Regulation & Temperament
• Project 2: Precursors of School Readiness
• Project 3: Family Processes
• Project 4: Work and Family
• Project 5: Community & Family Ethnography
• Data Management & Statistical Core

Rationale for the Family Life Project
• Most of the research about children is based on studies of urban children
• Nearly half of all children live in non-urban settings (rural settings and small towns)
• Children in non-urban areas are on average poorer than children in urban areas
• There is some evidence that there may be different risk and protective factors in urban versus rural areas

Poverty Rates – Metropolitan versus Nonmetropolitan Areas
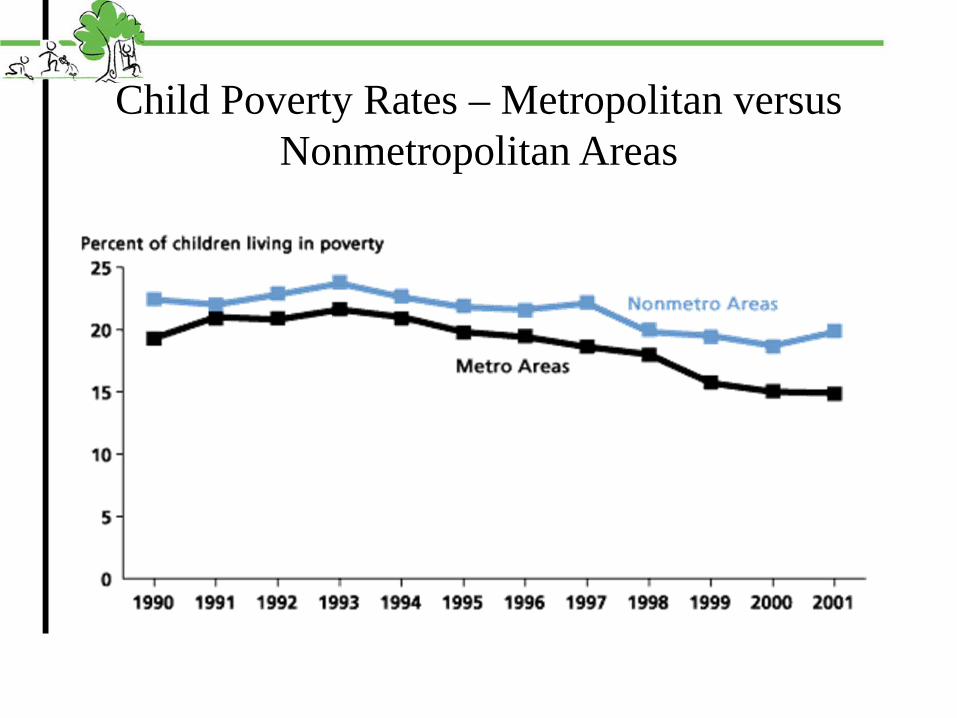
Child Poverty Rates – Metropolitan versus Nonmetropolitan Areas

Risk Factors Associated with Non-Urban Life
• More maternal depression• More tobacco use• More alcohol and prescription drug abuse• Less access to health and mental health services• Less access and availability to childcare• Longer distances to work and childcare• Less access to public transportation• Fewer good jobs

Protective Factors Associated with Non-Urban Life
• Less exposure to random violent crime• More single family homes • More homes and land owned by families• More access to extended family• Stronger connections to religious institutions• Greater sense of community
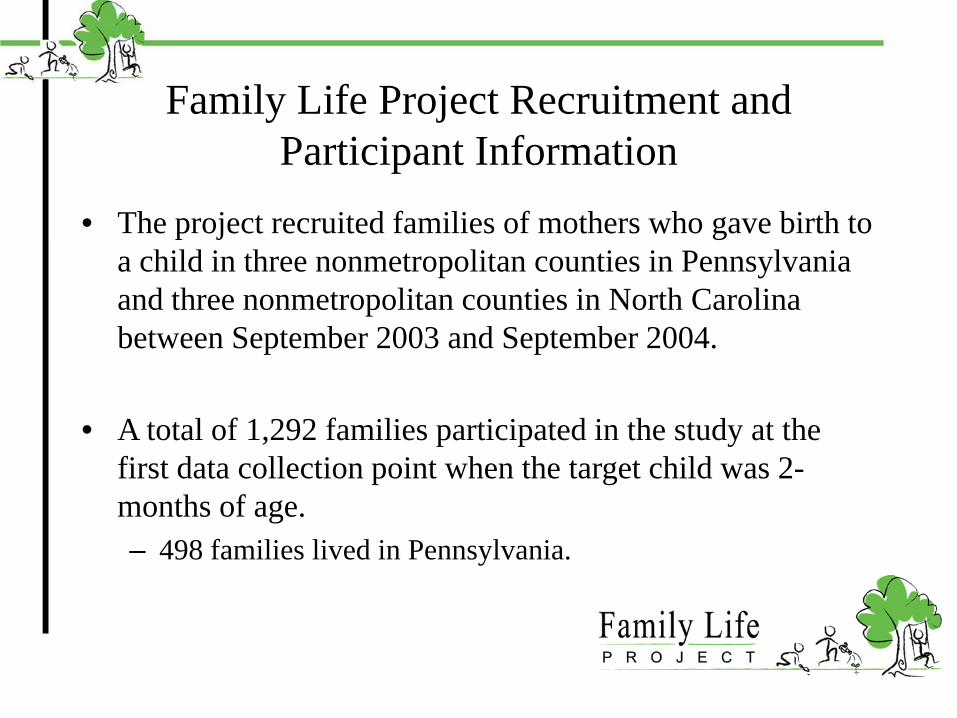
• The project recruited families of mothers who gave birth to a child in three nonmetropolitan counties in Pennsylvania and three nonmetropolitan counties in North Carolina between September 2003 and September 2004.
• A total of 1,292 families participated in the study at the first data collection point when the target child was 2-months of age.– 498 families lived in Pennsylvania.
Family Life Project Recruitment and Participant Information

Family Life Project: Participant Counties
10

11

12
Family Life Project: Schedule of Data Collection – Phase I
Birth 2-MonthsHospital Home Visit
6-Months2 Home Visits Phone Call 1 Home Visit
15-Months
Child CareVisit
Child CareVisit
Phone Call 2 Home Visits Phone Calls 2 Home Visits24-Months 36-Months
Child CareVisit
Child CareVisit

How do our families compare to Huntingdon County Census data?

Household Type
Married with Children
23%Married without Children
35%
Male Head -No Wife or
Child2%
Female Head -No Husband or
Child3%
Single Parent7%
Single Person26%
Other4%
Household Type - Huntingdon County
Married with Children
59%
Single Parent*33%
Other8%
Household Type - Family Life Project
• In contrast to Huntingdon County households overall, the FLP sample consists entirely of families with one or more children in the home.
• The percentage of single parent households in the FLP sample is high because it includes cohabiting parents who are not married (this is consistent U.S. Census data).

Household Income
Less than $25,000
36%
$25,000 -$34,999
16%
$35,000 -49,99919%
$50,000 -$74,999
18%
$75,000 or Greater
10%
Household Income - Huntingdon County
• The FLP sample contains more families earning less than $25,000 per year, compared to Huntingdon County households overall. This is, in part, because the project targeted low-income families for participation in the study.
Less than $25,000
76%
$25,000 -$34,999
4%
$35,000 - 49,9996%
$50,000 -$74,999
10%
$75,000 or Greater
4%
Household Income - Family Life Project

Race / Ethnicity
White92%
African American
5.6%
Hispanic / Latino1.2%
Other1.1%
Race / Ethnicity - Huntingdon County
• The percentage of White and minority families in the Family Life Project is very similar to overall patterns found in Huntingdon County.
White92%
African American
4%
Hispanic / Latino
4%
Race / Ethnicity - Family Life Project

Education
No HS Diploma
25%
HS Diploma / GED47%
Some College / Associates
Degree16%
BA or Higher12%
Highest Education Level -Huntingdon County
No HS Diploma
31%
HS Diploma / GED33%
Some College / Associates
Degree20%
BA or Higher16%
Highest Education Level - Family Life Project
• Compared to Huntingdon County overall, the Family Life Project contains a slightly higher percentage of both mothers who have not obtained a high school diploma, and mothers whose highest level of education is a 4-year college degree or higher.

Poverty
Above Poverty Line
88%
Below Poverty Line
12%
Poverty - Huntingdon County
Above Poverty Line69%
Below Poverty Line31%
Poverty - Family Life Project
• The FLP sample contains a higher percentage of families with total household incomes below the federal poverty line, compared to Huntingdon County households overall. Again, this is because the project targeted low-income families for participation in the study.

Home Ownership
Own77%
Rent23%
Home Ownership - Huntingdon County
Own45%
Rent33%
Owned by Another Family Member
14%
Occupied Rent Free6%
Home Ownership - Family Life Project
• Families in the FLP sample are less likely to own their own home, and are more likely to rent, compared to overall rates of home ownership in Huntingdon County.

Child Insurance
Insured98%
Uninsured2%
Child Insurance - Huntingdon County
Insured98%
Uninsured2%
Target Child Insurance - Family Life Project
• Rates of uninsured children are low in both the Family Life Project and Huntingdon County overall.
Public Assistance
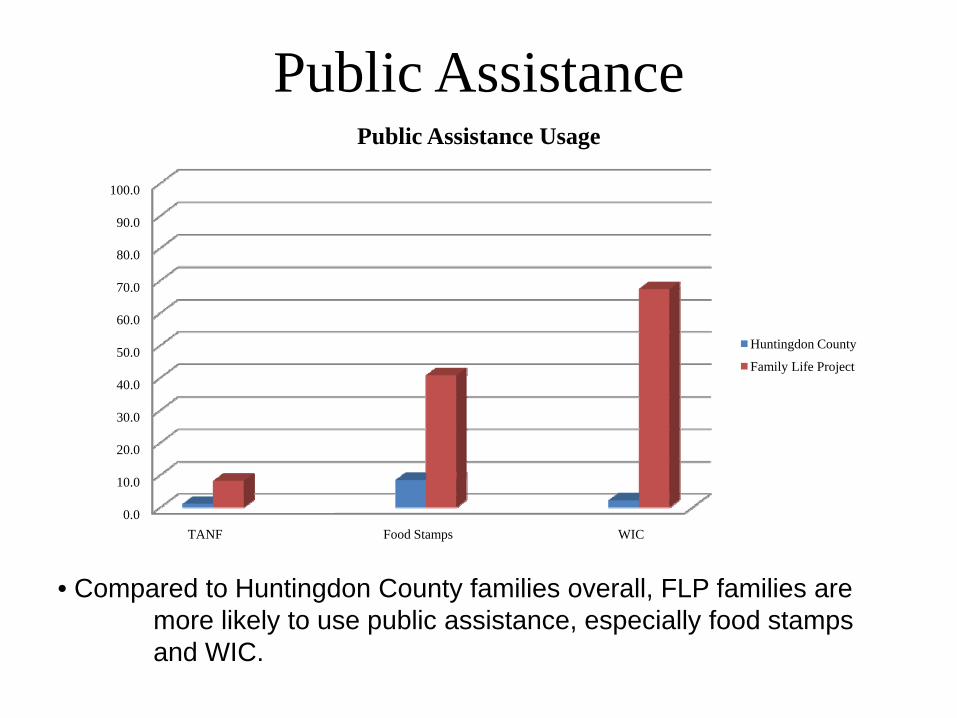
• Compared to Huntingdon County families overall, FLP families are more likely to use public assistance, especially food stamps and WIC.
0.0
10.0
20.0
30.0
40.0
50.0
60.0
70.0
80.0
90.0
100.0
TANF Food Stamps WIC
Public Assistance Usage
Huntingdon County
Family Life Project

Summary
• FLP contains a higher percentage of families with young children.• FLP mothers are more likely to have no high school degree or a 4-
year college degree.• FLP contains a higher percentage of low-income families and
families living in poverty.• FLP families are less likely to own their own home.• FLP families are more likely to use various forms of public
assistance, including WIC and food stamps.
• Almost all FLP and Huntingdon County families are White• Almost all FLP and Huntingdon County children have health
insurance.

The Lives of Families in Huntingdon County:Data from the Family Life Project

Measures of Family Life
• Information was collected on different aspects of family life including:– Family structure and household income– Parental education and employment– Home and vehicle ownership– Child care participation and arrangements– Family use of public assistance programs
• The data make comparisons between poor and non-poor families in our study.

Poverty Definition• Federal poverty level for a family of 4 in 2004 was $18,850.
• We considered families who made less than twice the Federal poverty level ($37,700) to be poor because most poverty programs allow families to be eligible up to 185% of the federal poverty level.
• The current results compare families who made less than 175% of the Federal poverty level ($32,988) to families who made 175% or more of the Federal poverty level.
• 175% represents the approximate income cut off for Head Start eligibility.

Household Type
0.0
10.0
20.0
30.0
40.0
50.0
60.0
70.0
80.0
90.0
100.0
Poor
Non-Poor

Education
• 75% of poor mothers report a high school degree or less as being their highest level of education obtained.
• About 25% of poor mothers are currently in school or some type of job training.
0.0
10.0
20.0
30.0
40.0
50.0
60.0
70.0
80.0
90.0
100.0
No HS Degree
HS Degree
Some College
BA or Higher
Maternal Education
Poor
Non-Poor
0.010.020.030.040.050.060.070.080.090.0
100.0
Currently in School or Job Training
Mother Currently in School or Job Training
Poor
Non-Poor
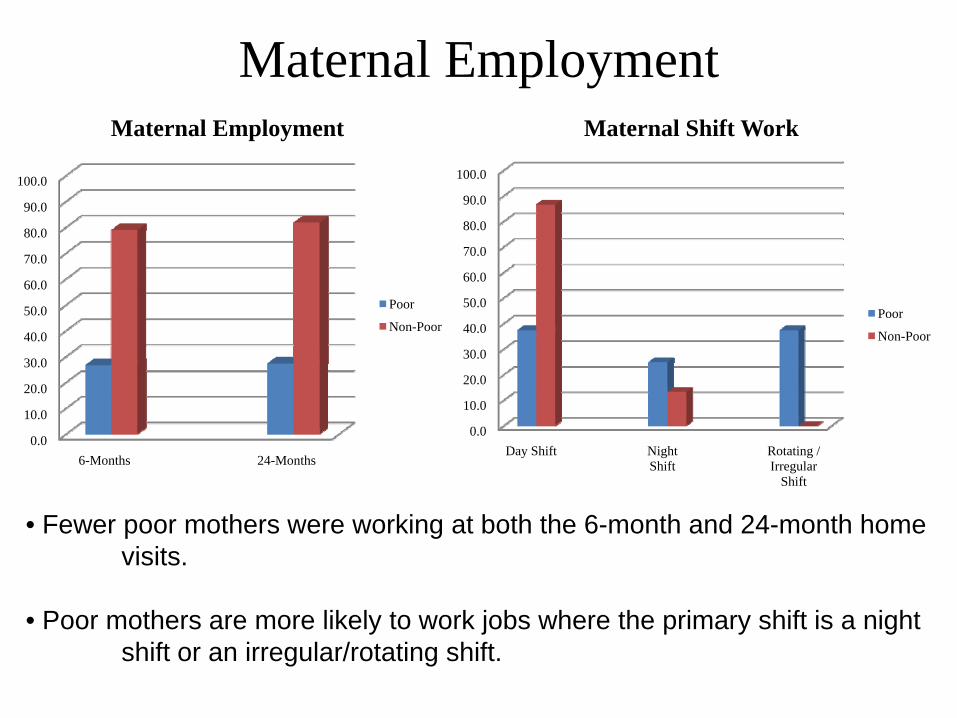
Maternal Employment
• Fewer poor mothers were working at both the 6-month and 24-month home visits.
• Poor mothers are more likely to work jobs where the primary shift is a night shift or an irregular/rotating shift.
0.0
10.0
20.0
30.0
40.0
50.0
60.0
70.0
80.0
90.0
100.0
Day Shift Night Shift
Rotating / Irregular
Shift
Maternal Shift Work
Poor
Non-Poor
0.0
10.0
20.0
30.0
40.0
50.0
60.0
70.0
80.0
90.0
100.0
6-Months 24-Months
Maternal Employment
Poor
Non-Poor

Secondary Caregiver Employment
• Secondary caregivers were more likely to be employed than mothers, but fewer poor secondary caregivers were working at both the 6-month and 24-month home visits.
• Type of shift worked was similar between poor and non-poor secondary caregivers.
0.0
10.0
20.0
30.0
40.0
50.0
60.0
70.0
80.0
90.0
100.0
Day Shift Night Shift
Rotating / Irregular
Shift
Secondary Caregiver Shift Work
Poor
Non-Poor
0.0
10.0
20.0
30.0
40.0
50.0
60.0
70.0
80.0
90.0
100.0
6-Months 24-Months
Secondary Caregiver Employment
Poor
Non-Poor

Child Care
• At 6- and 24-months of age, more non-poor children were in child care for 10 or more hours per week.
• Poor children were slightly more likely to be in center-based child care at 24-months of age.
0.0
10.0
20.0
30.0
40.0
50.0
60.0
70.0
80.0
90.0
100.0
6-Months 24-Months
% Children in Child Care (10+ Hrs. / Week)
Poor
Non-Poor
0.0
10.0
20.0
30.0
40.0
50.0
60.0
70.0
80.0
90.0
100.0
6-Months 24-Months
% Children in Center-Based Care
Poor
Non-Poor

Home & Vehicle Ownership
• Poor families were more likely to rent their home. Non-poor families were more likely to own their home.
• Poor families were less likely to report owning a car, truck, or van.
0.0
10.0
20.0
30.0
40.0
50.0
60.0
70.0
80.0
90.0
100.0
Own Owned by
Family Member
Rent Other
Home Ownership
Poor
Non-Poor
0.0
10.0
20.0
30.0
40.0
50.0
60.0
70.0
80.0
90.0
100.0
Own Car, Truck, Or Van
Vehicle Ownership
Poor
Non-Poor

Health Insurance
• Almost all target children in the study have health insurance, regardless of family income status.
• The majority of mothers also have health insurance, regardless of family income status
0.0
10.0
20.0
30.0
40.0
50.0
60.0
70.0
80.0
90.0
100.0
Insurance No Insurance
Target Child Health Insurance
Poor
Non-Poor
0.0
10.0
20.0
30.0
40.0
50.0
60.0
70.0
80.0
90.0
Insurance No Insurance
Maternal Health Insurance
Poor
Non-Poor
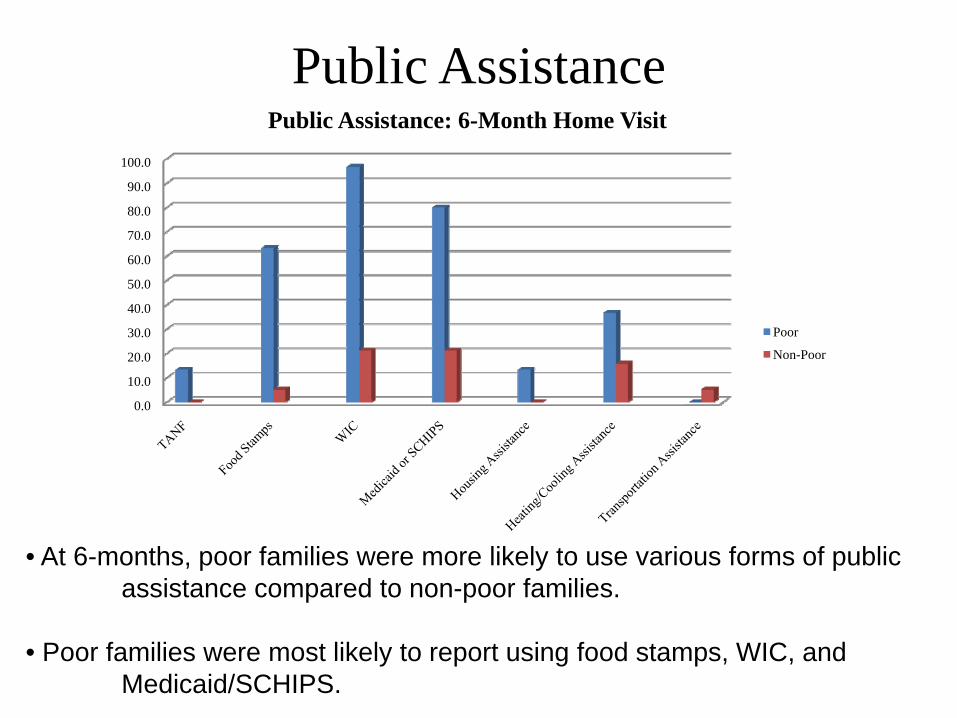
Public Assistance
• At 6-months, poor families were more likely to use various forms of public assistance compared to non-poor families.
• Poor families were most likely to report using food stamps, WIC, and Medicaid/SCHIPS.
0.0
10.0
20.0
30.0
40.0
50.0
60.0
70.0
80.0
90.0
100.0
Public Assistance: 6-Month Home Visit
Poor
Non-Poor

Public Assistance
• At 24-months, poor families were also more likely to use various forms of public assistance compared to non-poor families.
• Rates of public assistance usage among both poor and non-poor families were similar at 6-months and 24-months.
0.0
10.0
20.0
30.0
40.0
50.0
60.0
70.0
80.0
90.0
100.0
Public Assistance: 24-Month Home Visit
Poor
Non-Poor

Early Head Start
• At 24-months, poor families were more likely to have their child enrolled in Early Head Start.
0.0
10.0
20.0
30.0
40.0
50.0
60.0
70.0
80.0
90.0
100.0
Participating in Early Head Start
Participating in Early Head Start
Poor
Non-Poor

Summary
• Poor Families Are Less Likely To: Have two biological parents living togetherHave mothers with more educationHave mothers and secondary caregivers who are employedHave mothers who work standard (i.e., day) shifts when they are employedOwn a car or own a homeHave children in child care
• Poor Families Are More Likely To: Have mothers who are currently enrolled in school or job trainingUse public assistance. Rates of public assistance were consistent between 6- and 24-monthsEnroll their children in Early Head Start

Family Life Project Measures of Maternal Substance Use

Measures of Mother Substance Use
• Information was collected on mothers’ use of legal and illegal substances at the 24-month visit including:– Cigarettes and other tobacco products– Alcohol– Marijuana– Other illegal drugs

Smoking
• At 24-months, poor mothers were more likely to report smoking daily compared to non-poor mothers.
0.0
10.0
20.0
30.0
40.0
50.0
60.0
70.0
80.0
90.0
100.0
None 1-5 Days / Week Daily
Mother Smoking Frequency
Poor
Non-Poor

Drinking
• At 24-months, non-poor mothers were more likely to report occasional drinking.
0.0
10.0
20.0
30.0
40.0
50.0
60.0
70.0
80.0
90.0
100.0
None 1-5 Days / Week Daily
Mother Drinking Frequency
Poor
Non-Poor

Marijuana Use
• Poor mothers were more likely to report using marijuana than non-poor mothers.
0.0
10.0
20.0
30.0
40.0
50.0
60.0
70.0
80.0
90.0
100.0
None 1-5 Days / Week
Daily
Mother Marijuana Use
Poor
Non-Poor

Other Illegal Drug Use
• No mothers reported using illegal drugs other than marijuana.
0.0
10.0
20.0
30.0
40.0
50.0
60.0
70.0
80.0
90.0
100.0
None 1-5 Days / Week
Daily
Mother Other Illegal Drug Use
Poor
Non-Poor

Summary
• More poor mothers are daily smokers compared to non-poor mothers, who are more likely to be non-smokers.
• Non-poor mothers are somewhat more likely to be occasional drinkers than poor mothers, who are more likely to be non-drinkers.
• Poor mothers were more likely to report using marijuana, but no mothers reported using other illegal drugs.

Family Life Project Measures of Child Development

Measures of Child Development
• Information was collected on different aspects of children’s development including:– Mental Development– Early Communication Skills and Abilities– Early Language Use and Understanding
• The data represent differences in children’s development compared to national averages for children of the same age.– Below Average, Average, or Above Average

Infant/Toddler Mental Development
• Almost all children at 15-months had average levels of mental development compared to other children the same age.
0.0
10.0
20.0
30.0
40.0
50.0
60.0
70.0
80.0
90.0
100.0
Below Average Average Above Average
15-Month Infant Mental Development
Poor
Non-Poor

Infant/Toddler Early Communication Skills
• The majority of poor and non-poor children had average levels of communication skills at 24-months.
• However, poor children were more likely to be below average andnon-poor children were more likely to be above average.
0.0
10.0
20.0
30.0
40.0
50.0
60.0
70.0
80.0
Below Average Average Above Average
15-Month Early Communication Skills
Poor
Non-Poor

Child Language Skills
• The majority of poor and non-poor children had average levels of language skills at 24-months.
• However, poor children were more likely to be below average andnon-poor children were more likely to be above average.
0.0
10.0
20.0
30.0
40.0
50.0
60.0
70.0
Below Average Average Above Average
24-Month Child Language Skills
Poor
Non-Poor

Summary
• At 15-months, both poor and non-poor children exhibited similar levels of mental development.
• However, some differences were found between poor and non-poor children in communication and language skills at 15- and 24-months.
– Poor children were more likely to be average or below average
– Non-poor children were more likely to be average or above average

Past and Future Directions
• To date in Central PA, the Family Life Project has completed:– 3,126 Home Visits– 569 Child Care Visits– 1,706 Phone Interviews
• Currently starting the second wave of the Family Life Project to follow the same children from 4 years of age through the second grade.
51
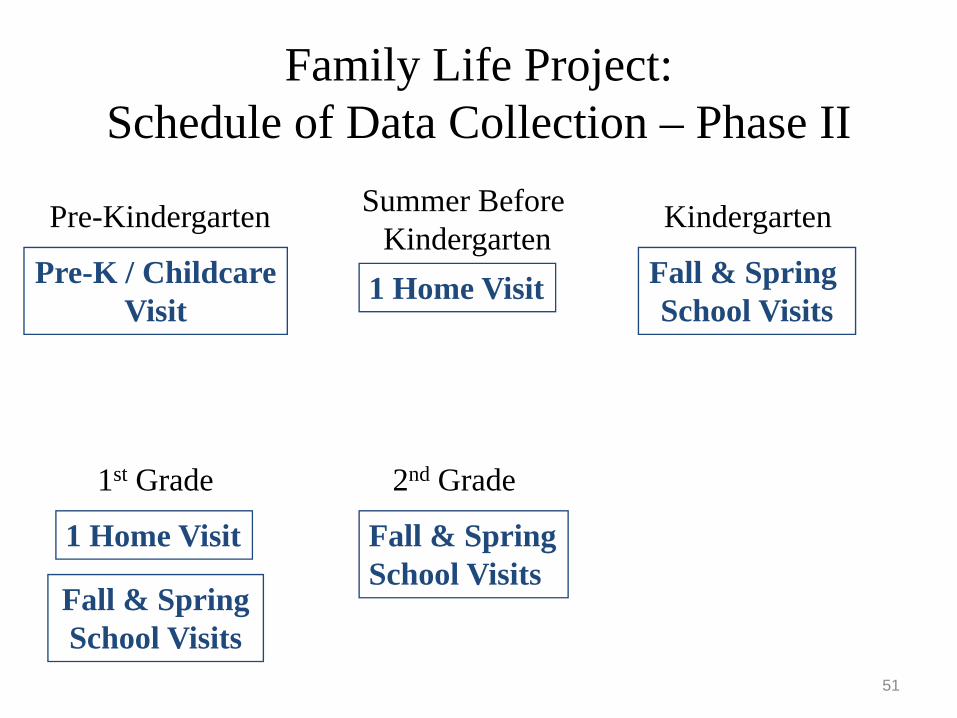
Family Life Project: Schedule of Data Collection – Phase II
Pre-Kindergarten
Pre-K / ChildcareVisit
Summer Before Kindergarten
1 Home Visit Fall & Spring School Visits
Kindergarten
1 Home Visit Fall & SpringSchool Visits
1st Grade 2nd Grade
Fall & Spring School Visits

Our sincerest appreciation to the families participating in this study and to the counties
and communities who have supported this work over the past four years.