an3751, frequency analysis in the industrial market...
TRANSCRIPT

AN3751Rev 0, 07/2008
Freescale Semiconductor Application Note
Frequency Analysis in the Industrial Market Using Accelerometer Sensorsby: Kimberly Tuck
FUNDAMENTALS OF VIBRATIONVibration is the mechanical oscillation of a structure about
an equilibrium point. The location of the vibrating surface varies with time. A vibratory system must in general include a method of storing potential energy such as elasticity. It must be able to store kinetic energy through mass or inertia and must have a method by which energy is dissipated through either dampening or resistance. The oscillations may be periodic like the motion of a pendulum or it may be random from the movement of a bicycle riding on gravel or falling into a pothole. Vibration is occasionally desirable such as from a tuning fork, or from a musical instrument, but often vibration is undesirable, which can be an indication of wasting energy and creating unwanted noise. Vibrations are often caused by imbalances in the rotating parts, an effect that is generally unwanted.
Types of Vibration1. Free Vibration occurs when a mechanical system is set
off with an initial input and allowed to vibrate freely, such as the tuning fork. The mechanical system will then vibrate at one or more of its natural frequencies and dampen down to zero.
2. Forced Vibration is when an alternating force or motion is applied to mechanical systems such as a shaking washing machine due to an imbalance. In forced vibration, the frequency of the vibration is the frequency of the force or motion applied, with the order of magnitude being dependent on the actual mechanical system.
Vibration MeasurementsTo take vibration measurements, a sensor is attached or
held by hand to the vibrating surface during a vibration measurement. The sensor used in this case is an accelerometer. The accelerometer converts this mechanical motion into a voltage which corresponds to the surface acceleration. The vibration analyzer system program is then used to sample this electrical signal from the accelerometer
and then analyze the measurements first in the time domain. Then the time domain data can also be converted into the frequency domain in order to understand more about the characteristics of the vibration between normal and failure operation modes. Depending on the application, a certain diagnostic output action can be determined and alerted.
DATA ACQUISITION AND SYSTEM ANALYSISThe following is the system architecture for vibration
monitoring:
Figure 1. Block Diagram of Vibration Sensing
Sampling Rate and Maximum Bandwidth
Transducer Output
Signal Conditioning
ACCELEROMETER
FFT: Converting from Time Domain to Frequency Domain
Data Analysis
Output Diagnostic Algorithm
© Freescale Semiconductor, Inc., 2008. All rights reserved.

AccelerometerThe transducer output is signal conditioned inside the
accelerometer. The accelerometer outputs the sensed acceleration. This acceleration output will be bandwidth limited based on the accelerometer characteristics. The typical Freescale low-g consumer accelerometers have a bandwidth response between 300 to 400 Hz at the -3 dB point. This indicates that the accelerometer can detect more than
400 Hz signals but it will be limited as the amplitude decays due to an internal low pass filter. About 10% of the signal is seen out at 1kHz.
The data from the accelerometer is collected and data-logged in time. The time domain signal of a vibration is representative of a sine wave, with all the frequencies and amplitudes combined in the overall signal as shown in Figure 2.
Figure 2. Time domain data from a motor with a weight on itThe time domain data can be useful for doing waveform
analysis of impulse or transient vibration signals, but it can be difficult to determine vibration faults in a mechanical structure. The frequency of a simple vibration can be calculated from its period. The vibration signals from most rotating machinery contain harmonics of the fundamental rotation frequencies, so data has to be analyzed by Fourier methods, which are established for periodic and random vibrations using a Fast Fourier Transform (FFT) algorithm. Therefore it is necessary to process the data-logged time domain data and convert it
into the frequency domain for spectrum analysis as shown in Figure 3. This can be done efficiently by applying an FFT. In the frequency domain, each individual amplitude and frequency can be displayed, which allows for the analysis of repetitive signals.
The sensor placement is an important factor for collecting the data. Typically the sensor placement is as close to the component of interest but typically in a safe location away from changing temperatures.
Figure 3. Frequency Domain Data from Vocal Cords
AN3751
Sensors 2 Freescale Semiconductor

Sampling Rate/ BandwidthIn order to take the time domain data and convert it into the
frequency domain, the bandwidth and sampling rate requirements must be determined. The maximum bandwidth is somewhat determined by the accelerometer limitations. In this case, the bandwidth is set to 1024 Hz, since it has been determined that this is near the limitation of the sensor. The sample rate is chosen to be double the Nyquist frequency, which is the highest frequency detectable. This ensures that up to 1024 Hz can be maintained without aliasing effects from under-sampling.
From Time Domain to Frequency DomainThe frequency domain contains the same information as
the time domain, but in a different form. The frequency domain is used to look at the spectral density, which describes how much signal (amplitude) exists per unit of bandwidth. The time domain signal to be processed is discrete and periodic. Therefore, the Discrete Fourier Transform (DFT) is the technique to be processed. The number of samples in the time domain is represented by N. In a DFT, any positive integer value can be chosen, but a power of two is usually chosen because digital data storage uses binary addressing, making powers of two a natural signal length. The most efficient algorithm to calculate the DFT is the Fast Fourier Transform (FFT), which operates at 2N. The time domain will have an array of x[n], with N samples. The frequency domain has N/2+1 samples in two parts: Real X[] and ImX[]. The values in ReX[] and ImX[] are the amplitudes of the cosine waves and sine waves respectively. If each amplitude is assigned to the proper sine and cosine wave, the result is a set of scaled sine and cosine waves that can be added to form the time domain signal.
The FFT is an efficient algorithm to compute the Discrete Fourier Transform (DFT), which takes sampled data from a continuous input in the time domain and transforms the sampled signal into the frequency domain. It only evaluates enough frequency components to reconstruct the finite segment that was analyzed. Computing the FFT requires time and RAM to do the calculation. If the FFT is processed on a microcontroller, the calculation can be very limited due to the limited memory space and processing speed.
The sampling speed must be twice the maximum frequency to be detected in order to satisfy the Nyquist criteria. If 2048 samples are taken per second, then 1024 Hz is the maximum detectable frequency. In the software program used in this analysis, the data is collected and updated every second. Therefore, 2048 time domain values are converted into 0-1023 possible frequency values every second.
Data AnalysisWith the data available in the time domain and the
frequency domain, it is possible to analyze the data to understand the characteristics of the operation of the device in normal and various failure modes. In the time domain, analysis can be done on impulses or transient data collected during a controlled change. The time domain response can be used in trending changes over time by comparing surveys taken at specific intervals.
Most defects encountered in rotating machinery have a distinct vibration pattern, and most faults can be recognized using vibration signature analysis techniques. Real time frequency analysis can provide a perspective of the whole vibration signal in all frequency bands of interest.
In the initial stages of developing algorithms for vibration applications, very simplified algorithm conditions can be set which can apply to a large range of scenarios found in many different vibration applications. In more sophisticated systems, after doing trend analysis, software can be used to analyze a database of known fault conditions and compare the current trends to the known fault conditions. It may be well known that a particular fault generates a typical frequency pattern. If the frequency components identified match with that fault pattern, the program will flag the fault condition. It is always possible that a particular frequency can be generated by more than one fault. By assigning probability values to each fault, depending on the existence of select frequencies in the fault, a database of the overall probability of each fault in the signal can be computed as part of the analysis to predict failing conditions.
Generalized Algorithm:
Characteristic Conditions of a simple DC MotorIn order to discover the characteristic signature of the
motor, a baseline must be taken. The characteristic signature can be analyzed by following these steps.
1. Determine the highest dominant frequency. This is the frequency with the highest amplitude value. (TopFq)
2. Look at the noise of the signal to determine what the average value is. Record the average Noise value. (AvgNoise)
3. Find all other dominating frequencies by subtracting out the average noise from the characteristic. Store all of the dominant frequencies, which are 20% greater than the average noise value. DominantFqs[]
4. Do a secondary sort on DominantFqs[]. Compare the amplitudes of the frequencies that are within 5-10 frequencies, and only store the frequency with the max Amplitude value.
5. Count the number of Dominant Frequencies NumDominantFq.
AN3751
Sensors Freescale Semiconductor 3

6. Sort the DominantFqs from highest to lowest Frequency DominantFqsSortF, then sort the DominantFqs from highest to lowest by Amplitude DominantFqsSortA
7. Sort the DominantFqs to group all dominant frequencies 75% or greater than the TopFq into HighestDominantFqs. Also record the number of frequencies in that array. This will sort out the top dominant frequencies in the entire array.
8. Determine how many frequencies in the final HighestDominantFqs array are a harmonic (multiple) of the TopFq.
9. Determine where the majority of the energy is in the spectrum.
10. Determine what the harmonic frequency is and how many harmonics exist in the characteristic signature.
Figure 4 is a picture of a simple DC brushed motor that has been used to do the data analysis in the following graphs.
Figure 4. DC Motor used for Vibration AnalysisFigure 5 is the characteristic signature of the motor under
no load (normal) conditions.The electromagnetic torque fluctuations of the motor are
identified by the characteristic signature. All of the energy is
focused around harmonics of 70 Hz. The dominant frequency is the 6th harmonic at 422 Hz.
Figure 5. Motor: Normal NO LOAD Conditions
AN3751
Sensors 4 Freescale Semiconductor

Figure 6 and Figure 7 are examples of the frequency output when a load is placed on the shaft of the motor. In Figure 6, a small weight was centered on the shaft by hand. It is noticed that the dominant frequency changed to 66 Hz, and few fundamental frequencies are visible. The addition of the
weight caused the frequency of the motor to slow down. There is slightly more movement and more torque on the motor due to higher inertia from the weight. Also, there is more resistance from the weight.
Figure 6. Load Condition: Centered Light Weight 66HzIn Figure 7, a larger weight was placed balanced on the
center of the motor. A shift in the frequency again is observed. The fundamental frequency has lowered further to 50 Hz. There is more movement and more torque on the motor due
to higher inertia from the larger weight. There is also more resistance. Noticeable harmonics are seen on the 1st, 2nd, 3rd and 4th frequency.
Figure 7. Heavy Load Condition Balanced Weight 50Hz
AN3751
Sensors Freescale Semiconductor 5

In Figure 8, the graph displays the frequency spectrum from the motor when a weight has been placed on the shaft to create an out-of-balance scenario. From this graph, it is now visible that due to the asymmetry of the mass on the motor there are centripetal accelerations which are causing the
motor to move resulting in large amplitude accelerations. This dominates over the electromagnetic torque fluctuations. The fundamental frequency has shifted much lower and is 25 Hz. Harmonics are seen on the 2nd, 3rd,4th,5th etc.
Figure 8. Heavy Load Out of Balance Condition
CONSUMER AND INDUSTRIAL VIBRATION APPLICATIONS
There are many common devices that create vibrations and can be analyzed using an accelerometer. The accelerometer can be useful to determine the difference between normal “characteristic” conditions verses potentially dangerous or problematic situations. The following is a list of the different devices that have been analyzed using the Freescale MMA7361L accelerometer:
• Musical Instruments: Piano, Flute, Guitar, Voice, Tuning Forks
• Washing Machine• Vacuum Cleaner• Blender• Hair Dryer• Power Tools• Handheld Fan Motor• Compressor System
It is very useful in certain vibration applications to be able to predict failure or hazardous vibration conditions in industrial and consumer equipment. In order to do this, it is necessary to analyze the signature of the vibration of the device in normal operation. Then, by analyzing the failure vibration signature, the idea is to identify the change. Using this data, an algorithm can be generated. It is important to be able to predict the failure before it actually happens, which can be extremely challenging, because in many cases there may not be much distinction between normal operation and the beginning of the failure.
AN3751
Sensors 6 Freescale Semiconductor

Musical Instruments: Tuning Forks, Piano, Flute, Guitar, Voice
By analyzing the vibration characteristics of musical instruments and tuning forks, it can be shown that the
accelerometer can recognize an isolated characteristic frequency where all the energy is channeled about one frequency. In some cases, there can be harmonics that are evident.
Figure 9. Note F Played on the FluteFrom the time domain data, there is not much that can be
discerned. From the frequency domain, the flute frequency is seen to match the F note. If a note higher than 1023 Hz is hit, the data will fold back and appear as a much lower frequency than it actually is. This happens because the sampling rate must always be twice that of the highest detectable frequency at all times. Otherwise, aliasing effects are seen. The amplitudes displayed near the very low frequencies are typically just from movement of the sensor during the measurement, and this should be zeroed out.
The accelerometer can be used to detect selected notes from various instruments such as a piano, guitar, flute, trumpet, or even from the human voice.
AN3751
Sensors Freescale Semiconductor 7

Washing MachineIn the case of a washing machine, there are normal
conditions that the machine should cycle through (wash, spin-rinse, spin). The purpose of the vibration analysis is to detect different normal conditions of the machine as well as to protect the machine from the out-of balance condition by either rebalancing the machine or just by shutting it down before it damages itself. In the washing machine example, dominant
frequency can be recognized during the regular cycle. When the machine becomes unbalanced a frequency shift will be observed, and the top frequency will be lowered as the motor is thrown off balance.
The graph in Figure 10 is characteristic of the wash, rinse and spin cycle. These three cycles look very similar. The dominant frequency in each case is 120 Hz. There are very few other significant frequencies observed.
Figure 10. Wash Spin and Rinse cycles of the Washing MachineWhen the washing machine is put into a power spin mode,
it shakes more, and some lower frequencies become more dominant.
Figure 11. Washing Machine in Power Spin Mode
AN3751
Sensors 8 Freescale Semiconductor
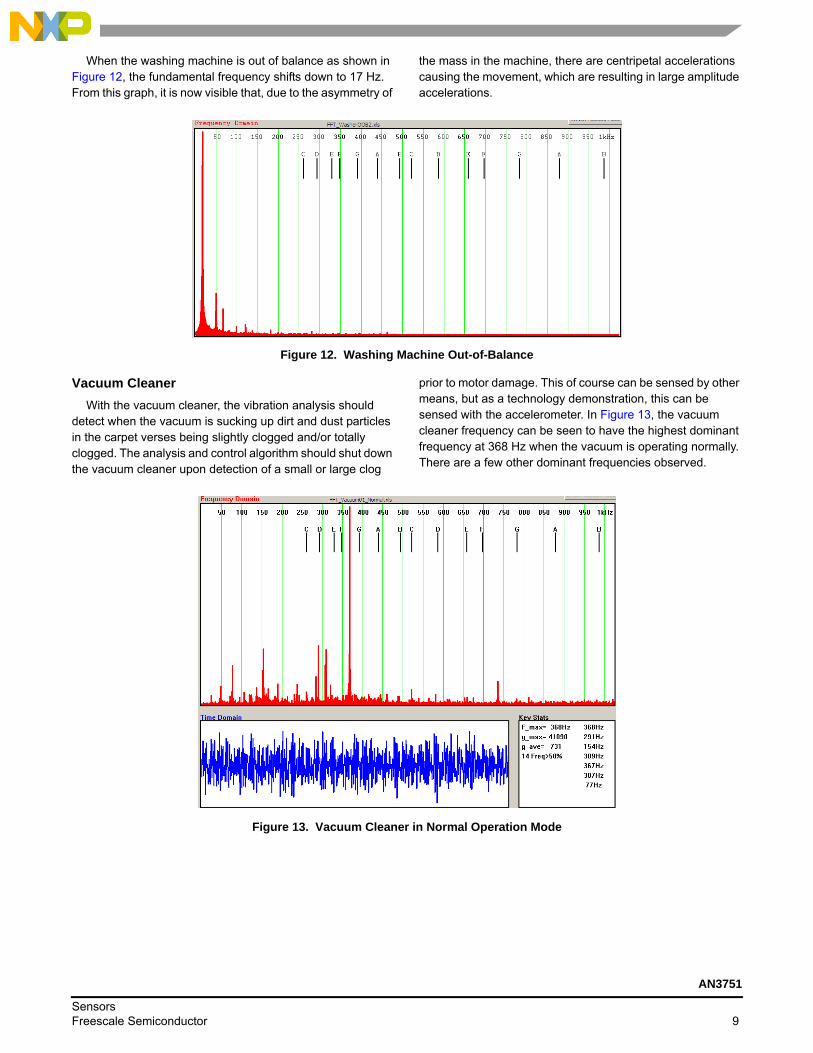
When the washing machine is out of balance as shown in Figure 12, the fundamental frequency shifts down to 17 Hz. From this graph, it is now visible that, due to the asymmetry of
the mass in the machine, there are centripetal accelerations causing the movement, which are resulting in large amplitude accelerations.
Figure 12. Washing Machine Out-of-Balance
Vacuum CleanerWith the vacuum cleaner, the vibration analysis should
detect when the vacuum is sucking up dirt and dust particles in the carpet verses being slightly clogged and/or totally clogged. The analysis and control algorithm should shut down the vacuum cleaner upon detection of a small or large clog
prior to motor damage. This of course can be sensed by other means, but as a technology demonstration, this can be sensed with the accelerometer. In Figure 13, the vacuum cleaner frequency can be seen to have the highest dominant frequency at 368 Hz when the vacuum is operating normally. There are a few other dominant frequencies observed.
Figure 13. Vacuum Cleaner in Normal Operation Mode
AN3751
Sensors Freescale Semiconductor 9

In Figure 14, the response of the system is displayed for the vacuum cleaner when there is a small clog. The dominant frequency has shifted down from 368 Hz to 350 Hz.
Figure 14. Vacuum Cleaner with a Small ClogWhen the vacuum cleaner has a large clog the dominant
frequency has changed back to match the original dominant frequency of the vacuum cleaner in normal operation mode.
All of the energy appears to be concentrated around this one dominant frequency in the case of the large clog.
Figure 15. Vacuum Cleaner with a Large Clog
AN3751
Sensors 10 Freescale Semiconductor

BlenderIn the case of the blender, the vibration signatures can be
analyzed on the different mixing modes to understand the typical signature. It will then recognize when the blender is spinning with no load if all the material has been pushed out to the side of the jug. It will also detect if he blender blades are stuck on a heavy load and cannot cut through the material. When the blender is stuck or spinning with no load, it should be signaled to shut down or change directions. The results from the data analysis show the dominant frequency changes depending on the mode of the blender. When the blender has
nothing in it and can spin freely, the dominant frequency increases.
Power ToolsIn the case of power tools, there are a wide variety of
normal conditions for the operation of the tools. In this situation, it may be important to understand and identify what typical frequencies can cause numbness and blood flow restrictions to workers that are using these tools. The vibration analysis would detect when certain frequencies are present over a certain time duration and send a warning to the user. Figure 16 shows the dominant frequency on a hand held cordless power drill.
Figure 16. Power Drill Normal Operation
CONCLUSIONSThere are many vibration applications where the
accelerometer can be used as the method of detection. The current accelerometer products have been designed with a limiting ability to sense about 1 kHz without excessive external filtering. This is useful for certain applications within that range. If there are justified opportunities, it may be worthwhile to design a sensor for the market that is capable of sensing at an even higher bandwidth range.
AN3751
Sensors Freescale Semiconductor 11

AN3751
Sensors 12 Freescale Semiconductor

How to Reach Us:
Home Page:www.freescale.com
Web Support:http://www.freescale.com/support
USA/Europe or Locations Not Listed:Freescale Semiconductor, Inc.Technical Information Center, EL5162100 East Elliot Road Tempe, Arizona 85284 1-800-521-6274 or +1-480-768-2130www.freescale.com/support
Europe, Middle East, and Africa:Freescale Halbleiter Deutschland GmbHTechnical Information CenterSchatzbogen 781829 Muenchen, Germany+44 1296 380 456 (English)+46 8 52200080 (English)+49 89 92103 559 (German)+33 1 69 35 48 48 (French)www.freescale.com/support
Japan:Freescale Semiconductor Japan Ltd. Headquarters ARCO Tower 15F 1-8-1, Shimo-Meguro, Meguro-ku, Tokyo 153-0064 Japan 0120 191014 or +81 3 5437 [email protected]
Asia/Pacific:Freescale Semiconductor China Ltd. Exchange Building 23F No. 118 Jianguo Road Chaoyang District Beijing 100022 China +86 010 5879 [email protected]
For Literature Requests Only:Freescale Semiconductor Literature Distribution CenterP.O. Box 5405Denver, Colorado 802171-800-441-2447 or +1-303-675-2140Fax: [email protected]
Information in this document is provided solely to enable system and software implementers to use Freescale Semiconductor products. There are no express or implied copyright licenses granted hereunder to design or fabricate any integrated circuits or integrated circuits based on the information in this document.
Freescale Semiconductor reserves the right to make changes without further notice to any products herein. Freescale Semiconductor makes no warranty, representation or guarantee regarding the suitability of its products for any particular purpose, nor does Freescale Semiconductor assume any liability arising out of the application or use of any product or circuit, and specifically disclaims any and all liability, including without limitation consequential or incidental damages. “Typical” parameters that may be provided in Freescale Semiconductor data sheets and/or specifications can and do vary in different applications and actual performance may vary over time. All operating parameters, including “Typicals”, must be validated for each customer application by customer’s technical experts. Freescale Semiconductor does not convey any license under its patent rights nor the rights of others. Freescale Semiconductor products are not designed, intended, or authorized for use as components in systems intended for surgical implant into the body, or other applications intended to support or sustain life, or for any other application in which the failure of the Freescale Semiconductor product could create a situation where personal injury or death may occur. Should Buyer purchase or use Freescale Semiconductor products for any such unintended or unauthorized application, Buyer shall indemnify and hold Freescale Semiconductor and its officers, employees, subsidiaries, affiliates, and distributors harmless against all claims, costs, damages, and expenses, and reasonable attorney fees arising out of, directly or indirectly, any claim of personal injury or death associated with such unintended or unauthorized use, even if such claim alleges that Freescale Semiconductor was negligent regarding the design or manufacture of the part.
Freescale™ and the Freescale logo are trademarks of Freescale Semiconductor, Inc. All other product or service names are the property of their respective owners.© Freescale Semiconductor, Inc. 2008. All rights reserved.
AN3751Rev. 007/2008