ana jacinta oliveira gonçalves · industrialization, agriculture, and pollution (postel &...
TRANSCRIPT

DEPARTAMENTO DE CIÊNCIAS DA VIDA
FACULDADE DE CIÊNCIAS E TECNOLOGIAUNIVERSIDADE DE COIMBRA
2011
UNIVERSIDADE DE COIMBRA
oon
unde
r te
d co
asta
l lag
oen
ts o
f a
prot
ec
Toxicity of surface versus subsurfacesediments of a protected coastal lagoon underrecent remediation (Paramos, Portugal)bs
urfa
ce s
edim
es,
Por
tuga
l)
recent remediation (Paramos, Portugal)
rfac
e ve
rsus
sub
iati
on (
Par
amos
Toxi
city
of
sur
Rec
ent r
emed
inç
alve
s
Ana Jacinta Oliveira Gonçalves
a O
livei
ra G
on
2011
Ana
Jaci
nta

DEPARTAMENTO DE CIÊNCIAS DA VIDA
FACULDADE DE CIÊNCIAS E TECNOLOGIAUNIVERSIDADE DE COIMBRAUNIVERSIDADE DE COIMBRA
Toxicity of surface versus subsurfacesediments of a protected coastal lagoon underrecent remediation (Paramos, Portugal)recent remediation (Paramos, Portugal)
Dissertação apresentada à Universidade deCoimbra para cumprimento dos requisitosnecessários à obtenção do grau de Mestreem Ecologia realizada sob a orientaçãoem Ecologia, realizada sob a orientaçãocientífica do Professor Doutor Rui Ribeiro(Universidade de Coimbra) e da DoutoraMatilde Moreira-Santos (Universidade deCoimbra)
Ana Jacinta Oliveira Gonçalves
2011

3
TABLE OF CONTENTS
Contents
Abstract ........................................................................................................................... 4
Resumo ........................................................................................................................... 6
AGRADECIMENTOS .................................................................................................... 8
Chapter 1 General Introduction .............................. 10
1.1 – The ecotoxicological line of evidence ......................................................... 12
1.2 – The Paramos lagoon ..................................................................................... 13
1.3 – Study objectives ............................................................................................. 16
Chapter 2 Materials and Methods .................................. 18
2.1 – Study site ......................................................................................................... 19
2.2 – Experimental design ...................................................................................... 20
2.3 – Collection of water and sediment samples ................................................ 20
2.4 – Sediment and water physico-chemical characteristics ............................ 21
2.5 – Toxicity tests ................................................................................................... 22
2.6 – Statistical analyses ........................................................................................ 28
Chapter 3 Results ................................... 30
3.1 – Sediment and water physico-chemical characteristics ............................ 31
3.2 – Remediation efficacy with a test battery ..................................................... 33
3.3 – Further investigation on primary producers ............................................... 37
Chapter 4 Discussion ........................ 39
4.1 – Remediation efficacy with a test battery ..................................................... 40
4.2 – Overall toxicity ................................................................................................ 46
4.3 – Primary producers ......................................................................................... 48
Chapter 5 Conclusion ...................... 51
References .................................................................................................................... 54

4
Abstract
Wetlands, especially coastal lagoons, are important ecosystems providing
services being therefore one of the most developed regions supporting large
urban and industrial areas. As a consequence of this development,
contamination of these ecosystems is unavoidable. This is the case of the
Paramos lagoon, which has a long contamination history and has lately suffered
some remediation measures.
The present study aimed to assess the efficacy of the remediation
measures already implemented in the Paramos lagoon, by comparing the
toxicity of surface versus subsurface sediments to a battery of test organisms,
as depth profiles in sediments provide information about the temporal
contaminant inputs. For this purpose, a battery of standard toxicity tests was
made, with organisms bearing a key role in important ecosystem functions. The
following species were selected: the bacteria Vibrio fischeri Lehmann &
Neumann (decomposer), the unicellular green algae Pseudokirchneriella
subcapitata Koršhikov (primary producer), the crustacean ostracod Heterocypris
incongruens Ramdohr (epibenthic omnivorous) and the midge Chironomus
riparius Meigen (benthic insect larvae; deposit feeder). To further explore the
efficacy of remediation measures, the toxicity of sediments was assessed by
conducting a standard toxicity test with the microalgae Pseudokirchneriella
subcapitata and a toxicity test with the sediment rooted aquatic dicotyledon
macrophyte Myriophyllum aquaticum Bernard Verdcourt (under
standardization). The obtained results regarding the battery tests demonstrated
that further intervention should be taken, since there is no clear remediation of

5
the site. Results for the primary producers suggest that further testing would be
necessary to reduce uncertainties associated to sediment contaminants.
Key words: sediments, toxicity, battery of bioassays, primary producers,
remediation
6
Resumo
As zonas húmidas, em especial as lagoas costeiras são ecossistemas
muito importantes por providenciarem serviços do ecossistema, tendo-se
tornado por isso regiões muito desenvolvidas abrangendo grandes áreas
urbanas e industriais. Como consequência dessa exploração, a contaminação
desses ecossistemas ao longo do tempo foi inevitável. A lagoa de Paramos
encontra-se nesta situação, tendo já um longo histórico de contaminação, no
entanto, mais recentemente foram tomadas algumas medidas de remediação.
Este trabalho teve como objectivo avaliar a eficácia das medidas de
remediação implementadas na lagoa de Paramos, por comparação da
toxicidade de sedimentos superficias com sedimentos mais profundos, uma vez
que estes fornecem informação sobre a contaminação histórica, usando para
esse efeito uma bateria de ensaios padronizados. Para isso foi realizada uma
bateria de ensaios padrão com organismos representantes de importantes
funções do ecossistema. Foram seleccionadas as seguintes espécies: a
bactéria Vibrio fisheri Lehmann & Neumann (decompositor), a alga verde
unicelular Pseudokirchneriella subcapitata Koršhikov (produtor primário), o
crustáceo Heterocypris incongruens Ramdohr (omnívoro epibentónico) e o
invertebrado Chironomus riparius Meigen (insecto bentónico; detritívoro). Para
melhor explorar a eficácia das medidades de remediação, foi avaliada a
toxicidade dos sedimentos através da realização do ensaio padrão com a
microalga Pseudokirchneriella subcapitata e do ensaio de toxicidade com a
macrófita Myriophyllum aquaticum Bernard Verdcourt. Os resultados obtidos
em relação à bateria de ensaios indicam que são necessárias mais

7
intervenções, uma vez que não há clara remediação do local de estudo. O
resultado dos ensaios com os produtores primários revelou ser necessário a
realização de mais ensaios de modo a reduzir as incertezas associadas a
contaminantes no sedimento.
Palavras-chave: sedimentos, toxicidade, bateria de ensaios, produtores
primários, remediação

8
AGRADECIMENTOS
Este trabalho foi concretizado com o apoio de várias pessoas e
entidades às quais gostaria de deixar aqui o meu agradecimento:
À Fundação para a Ciência e Tecnologia (FCT, Portugal) por
parcialmente financiar este estudo através dos projectos "FRAMEFFECTIVE –
Can bioassays be cost-effectively integrated in a predictive model approach for
rivers in compliance with the Water Framework Directive?" (referência
PTDC/AAC AMB/105411/2008), "ECOTOXTOOLS - Ecotoxicological tools for
assessing agriculture associated environment risks in Southern Europe big
man-mad freshwater reservoirs" (referência PTDC/AAC-AMB/103547/2008) e ‖
AMPHIBIA – How will climate changes influence the viability of amphibian
populations already stressed with anthropogenic contamination‖ (reference
PTDC/AAC-AMB/104532/2008).
Ao IMAR – Instituto do mar que permitiu a realização deste trabalho e
pelas amizades criadas.
Ao meu orientador Dr. Rui Ribeiro e co-orientadora Dr.ª Matilde Moreira-
Santos por me terem aceitado como sua aluna, pelo apoio, conselhos e
motivação ao longo destes dois anos. Também por toda a dedicação e revisão
deste manuscrito.
À Isabel Lopes pelo seu apoio nas saídas de campo, no laboratório e
pela revisão do trabalho.
À Gertie Arts e Dick Belgers do Instituto de Alterra na Universidade de
Wageningen e Centro de Investigação (Wageningen, Holanda) por terem

9
providenciado material biológico e pareceres científicos para a realização do
ensaio de toxicidade com Myriophyllum aquaticum.
À Eng.ª Isabel Quintaneiro da SIMRIA, Saneamento Integrado dos
Municípios da Ria (Aveiro) pela disponibilidade e material fornecido sobre o
local de estudo.
À Dr.ª Elsa Rodrigues pela determinação de parâmetros e propriedades
das minhas amostras.
Também gostaria de agradecer a todos os que de alguma forma
tentaram ajudar a melhorar este trabalho, incluindo os meus colegas de
mestrado e de laboratório, a Rita Rosa, Lúcio, Elena, Mónica Martinez,
Andressa, Ahmed, Ana Leitão, Jon Nesbit…
A todos os meus amigos, que me têm acompanhado ao longo deste
caminho, pela sua paciência, apoio, conselhos, partilha e bons momentos
passados, os quais nunca esquecerei, à Carina, Cátia Domingos, Cátia Silva,
Inês, Joana, Mónica, Sandra. Porque os amigos são uma parte fundamental da
nossa vida!
Finalmente à minha família, pilar fundamental sem o qual não teria
chegado até aqui, ao meu irmão, avó e especialmente aos meus pais pela
educação que me deram e por todo o seu apoio e suporte na conquista dos
meus sonhos. Devo-lhes tudo aquilo que sou!

Chapter 1 Introduction

Chapter 1 – General Introduction
11
1 - Introduction
Wetlands are transitional areas between aquatic and terrestrial
environments, estimated to cover about 4 to 6% of the world’s land (Mitsch &
Gossenlink, 2000). They are among the richest ecosystems concerning
biodiversity and primary productivity and are responsible for many processes
such as production of biomass, water replacement, retention of nutrients and
sediment and control of floods (Sá & Loureiro, 1995; Mitsch & Gossenlink,
2000). As a result, wetlands help to maintain water quality and provide various
ecosystem services, being considered very valuable capital assets (Green et
al., 1994; Mitsch & Gossenlink, 2000). However, nowadays wetlands are
vulnerable ecosystems facing various threats, such as urbanization,
industrialization, agriculture, and pollution (Postel & Carpenter, 1997).
As a category of wetlands, coastal lagoons are very dynamic
ecosystems, characterized by their relative isolation, shallowness and strong
physical and ecological gradients, resulting in high productivity (Mitsch &
Gosselink, 2000; Guerra et al., 2009). Coastal areas are among the most
developed regions supporting large urban and industrial areas, as well as the
overuse of fisheries, tourism and aquaculture, all leading to the deterioration of
these ecosystems, and, thus, compromising the productivity of a natural capital
(Postel & Carpenter, 1997; Gönenç & Wolflin, 2005).
Contaminants, introduced into the surface water by anthropogenic inputs,
accumulate in sediments, which generally act as a repository and source for
many toxicants long after the pollution of surface waters (Ingersoll, 1995; De
Hass et al., 2002); aquatic organisms, especially benthic organisms, are thus

Chapter 1 – General Introduction
12
exposed to contaminants by both water and sediments (Giesy & Hoke, 1989).
Consequently, because sediments maintain a record of past pollution, providing
information on the temporal evolution of contamination (Degetto et al., 1997;
Bellucci et al., 2002), studies on the assessment of sediment toxicity fit the
purpose of highlighting anthropogenic impacts of pollution (Feiler et al., 2004).
1.1 – The ecotoxicological line of evidence
To cope with environmental degradation, different approaches, i.e., lines
of evidence, can be employed to assess the impacts of contaminants on aquatic
ecosystems, being the most commonly used the chemical, the ecological and
the ecotoxicological line of evidence (Jensen & Mesman, 2006; Crane et al.,
2007). Each of these approaches has strengths and limitations but the
uncertainties resulting from each line of evidence can be reduced by integrating
the information provided by each (Jensen & Mesman, 2006; Chapman, 2007;
Crane et al., 2007). In short, the chemical line of evidence quantifies
contaminant levels to compare them with levels at reference sites or with
screening values, being its major weakness the fact that such levels provide no
information on contaminants bioavailability (Crane et al., 2007). Through the
ecological line of evidence, comparisons are made between exposed and non-
exposed communities, but such evaluation is highly dependent on the species
biology, life history and potential classification as endangered or threatened
species (Crane et al., 2007).
The ecotoxicological line of evidence, performs toxicity tests that are
designed to measure the effects of contaminants on organisms, either in the

Chapter 1 – General Introduction
13
laboratory under controlled conditions, where simple tests provide strong cause-
effect relationships, or under more realistic field conditions, where test
complexity is high and results are more difficult to interpret (Cairns, 1983; Giesy
& Hoke, 1989; Cooney, 1995; Rand et al., 1995; Crane et al., 2007). Although
such tests are often performed under conditions with a low realism, both in
terms of environmental variables and test species, they are still exceedingly
useful for estimating probable damage from anthropogenic stress and provide
information on concentrations and durations of exposure to chemicals that can
be expressed in changes in behavior, biochemistry, physiology, reproduction,
and survival of individuals (Cairns, 1983; Giesy & Hoke, 1989; Cooney, 1995;
Maltby, 1999; Crane et al., 2007). Moreover, by performing toxicity tests with a
battery of test organisms selected according to their representativeness in the
food chain, function at the ecosystem level and sensitivity to the potential
contaminants, more comprehensive estimates of contaminant effects can be
performed (Giesy & Hoke, 1989; Narracci et al., 2009; Rosa et al., 2010).
1.2 – The Paramos lagoon
Along the Portuguese northwest coast there are several coastal lagoons,
being the Paramos lagoon the one located further north (40º58’N; 08º38’W)
(Figure 1). As a coastal lagoon, the Paramos lagoon has a high biodiversity,
both in terms of fauna and flora, and, thus, it is: (i) included in the National
Ecological Reserve, (ii) classified as a CORINE biotope, (iii) integrated into the
second phase of the NATURA 2000 network (site code PTCON0018), and (iv)
classified as an Important Bird Area.

Chapter 1 – General Introduction
14
Figure 1 – Schematic representation of the Paramos lagoon
(Northwest Portugal) and its two main tributaries (rivers Maior and
Maceda), with location of the four selected study sites (NW, NE, SW,
and SE).
Despite its ecological significance, the environmental quality of this
ecosystem has long been under threat and even deteriorating (SIMRIA, 2002).
Sources of contamination are mostly from untreated domestic sewages (in an
over-populated region) and effluents from agricultural and industrial activities,
the latter including cork, leader, wood, textile, paper, painting, and metallurgical
industries, which are directly discharged into the lagoon tributaries (Dias, 2000;
SIMRIA, 2002). More specifically, previous studies revealed the presence of
contaminants in sediments (e.g., metals: Zn > Cu > Pb = Cr, polychlorinated
biphenyls, nitrogen, and phosphorus), water (e.g., metals: similar pattern to that
in sediments, pesticides) and groundwater (e.g., chloride, mineral oils) (SIMRIA,

Chapter 1 – General Introduction
15
2002; Fernandes et al., 2007b; Fernandes et al., 2008a,b). Additionally, studies
carried out with the leaping mullet Liza saliens (Risso) – the dominant fish in the
Paramos lagoon – revealed the occurrence of hepatic histological alterations in
liver histology, changes in plasma blood biochemistry and gill permeability
(Fernandes et al., 2007a; Fernandes et al., 2008b) and of bioaccumulation of
metals in liver (copper and zinc) and muscles (zinc) (Fernandes et al., 2008a).
Some remediation measures have already been implemented, like the
management of the connection channel between the lagoon and the sea, that
allows water exchange with the sea and the release of contaminants, and the
upgrading of some sections of the tributaries and its major affluents (SIMRIA,
2002). Also as a remediation measure, the treatment centre of the city of
Espinho domestic wastes, working since 1998 and covering a total population of
19,800 inhabitants, is considered a major achievement (SIMRIA, 2002).
Although the sewage network of the Espinho waste treatment centre does not
cover the full area of the Paramos lagoon, the fact that it is already operational
for more than ten years suggests that some remediation of water and sediments
might have taken place. Nevertheless, despite the ecological significance of the
Paramos lagoon and the many contaminant inputs, knowledge on the effects of
contaminants on the biological communities and on the efficacy of remediation
measures is scarce or even inexistent.

Chapter 1 – General Introduction
16
1.3 – Study objectives
The main objective of the present study was to assess the efficacy of the
remediation measures already implemented in the Paramos lagoon, by
comparing the toxicity of surface (S) versus subsurface (D) sediments to a
battery of test organisms, as depth profiles in sediments provide information
about the temporal contaminant inputs (Belluci et al., 2002). To attain this goal,
two specific objectives were delineated. The first, to perform a battery of
standard toxicity tests with organisms bearing a key role in important ecosystem
functions. The following species were selected: the bacteria Vibrio fisheri
Lehmann & Neumann (decomposer), the unicellular green algae
Pseudokirchneriella subcapitata Koršhikov (primary producer), the crustacean
ostracod Heterocypris incongruens Ramdohr (epibenthic omnivorous), and the
midge Chironomus riparius Meigen (benthic insect larvae; deposit feeder). The
second, to further explore the efficacy of the remediation measures toward
primary producers. For this, the toxicity of sediments was assessed by
conducting not only the standard toxicity test with the microalgae P. subcapitata
but also a toxicity test with the sediment rooted aquatic dicotyledon macrophyte
Myriophyllum aquaticum Bernard Verdcourt, given that the latter test, though
still under standardization, allows to evaluate toxicity via the sediment or pore
water (Arts et al., 2008).
All toxicity tests selected to perform the present study were considered
and designed to focus on the following key features: (1) to assess sediment
toxicity as sediments act as a sink and source of contamination, (2) to evaluate
sensitive biological responses to maximize their likelihood of being responsive

Chapter 1 – General Introduction
17
to the remediation measures, (3) to use species with a key role in different
ecosystem functions as a wide range of contaminants was expected, (4) to
collect sediment samples representative of a worst-case scenario (dry season,
i.e., when the dilution of contaminants in effluents is minimal), as this will cover
the entire temporal scale, and finally (5) to collect samples covering relevant
areas of concern, i.e., major routes of contaminants discharge.

Chapter 2 Materials and Methods

Chapter 2 – Material and Methods
19
2 – Material and Methods
2.1 – Study site
The Paramos lagoon is located on the Northwest coast of Portugal
(40º58’N; 08º38’W), with a total area of 396 ha, 1,500 m of length (N-S) and 700
m of width (W-E), a 2.5 m maximum depth, and a catchment area of 78 Km2
(SIMRIA, 2002). The dynamics of this lagoon is dependent mainly on its
communication with the sea, which is established through a non-permanent
channel, and on the two major tributaries, one in the north (river Maior, also
known as river Paramos) and another in the south (river Maceda), via which the
system receives most (untreated) effluents (Figure 1) (SIMRIA, 2002).
Groundwater and rain also contribute to the dynamics of the lagoon (SIMRIA,
2002). Four sampling sites were selected within the wet area of the lagoon so
that they would not only cover the whole lagoon area but also the regions close
to the two tributaries (likely to be the most contaminated) and to the non-
permanent channel (likely to be the least contaminated). At the north side of the
lagoon, sites NW and NE were in the region of the non-permanent channel and
river Maior, respectively, whereas at the south side sites SW and SE were
located in the regions of the centre of the lagoon and river Maceda, respectively
(Figure 1).

Chapter 2 – Material and Methods
20
2.2 – Experimental design
To assess the ecotoxicological efficacy of the remediation measures so
far implemented in the Paramos lagoon, surface (S) and subsurface (i.e., up to
15 cm deep; D) sediment samples were collected once during the dry season
(to mimic a worst-case scenario of contamination) at each of the four study
sites. All toxicity tests were performed on both S and D sediment samples –
only the 100% dilution. Whereas all toxicity tests performed to fulfil specific
objective 1 were carried out within two weeks of sediment collection, the toxicity
tests with the two primary producers to fulfil specific objective 2 were carried out
12 months after sediment collection. It is a fact that after one year of storage the
bioavailability of the contaminants in the sediments might have been altered.
Yet, it should be pointed out that the main purpose of the second part of the
present study was to compare the responses of two primary producers
(microalgae and macrophyte) and not to identify which specific contaminants
would have a toxic effect on the primary producers at the Paramos lagoon.
2.3 – Collection of water and sediment samples
At each of the four study sites, surface (5-cm depth) water samples were
collected into acid-washed 1.5-L polyethylene–terephthalate bottles (three per
site) and transported to the laboratory in thermally insulated boxes (below 15°C
in darkness). Upon arrival to the laboratory, part of the water was stored at 4°C
in darkness to be used in the toxicity tests (within 2 weeks and 12 months for

Chapter 2 – Material and Methods
21
specific objectives 1 and 2, respectively) and the remaining was immediately
filtered (0.20 µm) and deep frozen for chemical analysis (see below).
Composite sediment samples were collected at each of the four study
sites into acid-washed high density polyethylene bottles, immediately
transported to the laboratory in thermally insulated boxes (below 15°C in
darkness) and stored at 4°C in darkness to be used in the toxicity tests (within 2
weeks and 12 months for specific objectives 1 and 2, respectively) and for
sediment physical determinations (see below). At each site, 25 to 30 sediment
cores with a depth of 15 cm were retrieved. From each core, the first 5 cm were
taken as surface sediment and the subsequent 10 cm as subsurface sediment.
Approximately 2 and 3 L of surface and subsurface sediment were collected at
each site, respectively.
2.4 – Sediment and water physico-chemical characteristics
At each site, pH (Wissenschaftlich Technische Werkstätten 537 pH
meter, WTW, Weilheim, Germany), conductivity (WTW Cond315i/SET
conductivity meter), salinity (HANNA Instruments Seawater Refractometer HI
968222, Woonsocket, RI, USA), and dissolved oxygen (WTW OXI 92 oxygen
meter) were measured prior to water and sediment collection. The water
chemical parameters measured in the laboratory were hardness, ammonia,
nitrate, nitrite and reactive phosphorous determinations. All the latter
parameters were determined by ion chromatography (DX120 Ion
Chromatograph integrated system, Dionex, Sunnyvale, CA, USA)), except

Chapter 2 – Material and Methods
22
reactive phosphorus, which was determined by the ascorbic acid method
(APHA/AWWA/WPCF, 1995),
Laboratory physico-chemical characterization of surface and subsurface
sediments included the determination of humidity, organic matter content and
particle size distribution. Humidity was determined as the mean percentage loss
of the initial wet weight of three sediment aliquots of each sample after drying at
60°C for five days. Organic matter content was determined as the mean
percentage loss of the dry weight of the later sediment aliquots after igniting
them in a muffle furnace (Nabatherm L3, Lilienthal, Germany) at 550°C for 8
hours (Buchanan & Kaine, 1971). As for the sediment particle size distribution it
was determined on approximately 100 g of dried sediment using a standard
sieving technique through a sequence of six sieves (from 2000, to 63 µm;
Retsch, Haan, Germany) on a sieve mechanical shaker (agitation provided for
15 minutes at 1 mm vibration; Retsch AS 200) (Buchanan & Kaine, 1971). Each
sediment fraction was weighted and expressed as a percentage of the total final
weight.
2.5 – Toxicity tests
The luminescence test with the marine bacteria Vibrio fischeri was
conducted according to the basic solid-phase test (Azur Environmental,
Carlsbad, CA, USA). The light emission of the test organisms was measured
using the microtox toxicity analyzer model 500 (Strategic Diagnosis, Newark,
DE, USA) after a maximum exposure period of 30 minutes. According to the
test protocol, the maximum sediment concentration that can be tested is

Chapter 2 – Material and Methods
23
197,400 mg/L of the test diluent. For each sediment sample, the latter
concentration was tested in duplicate, whereas the standard microtox control
was tested in triplicate.
The 72-hours growth test with the microalgae P. subcapitata was done
following, as close as possible, the OECD (OECD, 1996) and EC (EC, 1992)
guidelines and methodologies described in Moreira-Santos et al. (2004) to
conduct toxicity tests with microalgae cells immobilized in calcium alginate
beads. The latter approach allows performing toxicity tests on the sediment-
overlying water since it avoids the loss of algae into the sediment and permits
the recovery of all exposed cells at the end of the test (Moreira-Santos et al.,
2004). Stock cultures of P. subcapitata were maintained in 100-ml nonaxenic
batch cultures with Woods Hole MBL growth medium (Stein 1973), at 19 to
21°C under continuous cool-white fluorescent illumination (100 μE/m2/s). Beads
with P. subcapitata cells were prepared as described in detail by Moreira-
Santos et al. (2004). In short, a volume of an algal cell suspension (obtained
from an exponentially growing algal culture) was gently mixed by gentle stirring
with a 1.3% (w/v) solution (prepared with distilled water) of sodium alginate
(Sigma Chemical, A-7128, Steinheim, Germany) to obtain an alginate-cell
suspension with a nominal cell concentration of 105 cells/ml of alginate. Beads
were formed by dropping the latter suspension through a syringe equipped with
a needle into a 2% (w/v) CaCl2 solution, in which they were kept stirring for 45
minutes for gel hardening to take place. They were then washed with distilled
water, stored in roughly 20-times diluted MBL medium, in the dark at 4°C, and
used within 15 days of preparation. Beads used in the toxicity test performed to
fulfil specific objective 1 had a mean diameter of 2.7 mm (n = 50) with a

Chapter 2 – Material and Methods
24
coefficient of variation (CV) of 7%, whereas correspondent values of beads
prepared to conduct the toxicity test of specific objective 2 were 3.1 mm (n = 50)
and a CV of 8%.
For each sediment three replicates were set up each consisting of 150 ml
glass vials filled with 50 g (dry weight) of sediment plus 50 ml of local water
previously vacuum-filtered (0.45 µm) to remove indigenous microalgae. A
control treatment, also with 3 replicates, consisted simply of 50 ml of MBL
medium diluted 2.5 times to be in accordance with the required N/P ratios
(OECD, 1996). Vials, except control ones, were prepared 12 to 18 hours prior to
the beginning of the test and left with continuous aeration, to allow stabilization
between sediment and water. After the letter period, aeration was stopped and
15 to 20 beads were added per replicate. To prevent the possible dissolution of
the beads due to the presence of chelating agents in the sediment, beads were
placed at the top of a 250 µm mesh screen (also in the control replicates to
eliminate possible differences in light intensity). Toxicity tests were conducted
under the same temperature and light conditions used for stock culturing. At the
end of the 72-hours exposure, the mean specific growth rate per day was
estimated. To estimate initial and final cell densities, beads from each replicate
were dissolved in 3 ml of a 3% (w/v) solution of trisodium citrate (Sigma, 71404,
Steinheim, Germany) with the help of a vortex mixer Unimag Zx (UniEquip,
München, Germany). Cell counts were made on well-mixed aliquots of each
replicate under a microscope at 400× magnification, using a Neubauer chamber
(American Optical, Bufalo, NY).
The 15-day growth test with the rooted macrophyte M. aquaticum was
performed according to a ―Standardized method for investigating test substance

Chapter 2 – Material and Methods
25
impact on rooted aquatic macrophytes‖, a protocol that is still under
development (Maltby et al., 2010), and to ISO guidelines (ISO, 2009) to
determine toxic effects of sediments on the growth of M. aquaticum. Stock
cultures of the terrestrial form of M. aquaticum were maintained in glass aquaria
filled with artificial sediment (Maltby et al., 2010) at 19 to 21°C under a 16-
hours:8-hours light (cool-white fluorescent illumination at 140 μE/m2/s):dark
photoperiod.
For each sediment, three replicates were set up, each consisting of small
pots (10-cm diameter x 9-cm height) filled with 500 ml of sediment and placed
inside glass vials (11-cm diameter x 24-cm height) filled with 2 L of Smart and
Barko medium (Maltby et al., 2010). Each pot was previously planted with three
shoots apices cut from the culture at a minimum 6-cm height so that the lower
two nodes were planted beneath the sediment surface. The sediment surface of
each replicate was covered with a thin layer of sand (< 5 mm in particle size) to
assist in keeping the sediment in place when adding the 2 L of medium. Test
vessels had a minimum of a 12-cm water-column height above sediment
surface to allow plants to growth submerged during the entire test period. For
the control treatment, 11 replicates were set up with artificial sediment (Maltby
et al., 2010). From these, five replicates were removed after a 3-days pre-test
culturing phase, during which root formation takes place, to estimate plant
biomass (wet weight) at the start of the test. The toxicity test (pre-test and test
itself) was incubated under the same conditions as for stock culturing, though
the illumination source consisted of a neutral white light and temperature
fluctuated from 18.5 to 21.5°C. During the exposure period water levels were
daily adjusted with distilled water. At day 11, 1000 and 500 ml of medium were

Chapter 2 – Material and Methods
26
renewed in the control and treatment replicates, respectively, to prevent
microalgae growth during testing. At days 0, 4, 11, and 14 total shoot length
(main and lateral shoots) of each plant was measured with a ruler. At the end of
the 15-days exposure period, plants were harvested and total shoot length and
whole plant biomass (wet weight) were determined. Plant growth was
determined as the mean specific growth rate per day.
The 6-day growth test with the ostracod H. incongruens was conducted
according to the Ostracodtoxkit F standard operating procedure (Creasel,
2001); the purchased kit contains all the necessary materials to perform tests
with this organism. The medium used to hatch the organisms and as overlying
water for all sediments was reconstituted moderately hard water (ASTM, 2002).
For hatching, cysts were incubated in the latter medium at 25°C under
continuous illumination (approximately 50 μE/m2/s) for 52 hours. After the first
48 hours of incubation pre-feeding was carried out with spirulina-powder. For
each tested sediment, five replicates were set up, each consisting of 1 mL of
sediment plus 2 mL of algal food suspension, and 10 recently hatched
ostracods. A standard control treatment was also set up with reference sand.
The test was conducted at 25°C in darkness. After the 6 days exposure period,
percentages of mortality were determined and growth was estimated as the
total body length (in µm).
The C. riparius 10-day growth test and 48-hours postexposure feeding
test were conducted according to the OECD (OECD, 2004) and EC (EC, 1997)
guidelines, and procedures described in detailed in Soares et al. (2005),
respectively. Whereas first-instar larvae were used in the growth test, the
postexposure feeding test used third-instar larvae. Larvae for testing were

Chapter 2 – Material and Methods
27
obtained form laboratory cultures consisting of crystallizing dishes containing
185 g of quartz sea sand (0.1 – 0.4 mm particle size; Merck, Darmstadt,
Germany) and 300 ml of reconstituted hard water (ASTM, 2002), fed a
suspension of ground Tetramin (Tetrawerk, Melle, Germany) every other day
(0.1 g/dish, with 30 and 15 larvae/dish up to day seven and from there onwards,
respectively), and maintained at 19 to 21 ºC, under a 14-hours:10-hours light
(50 μE/m2/s):dark photoperiod with 90-minutes dawn and dusk periods (for
further details see Rosa et al., 2010).
For each sediment and also for the standard control using the same
sediment and medium as the cultures, four and three replicates were set up for
the growth and postexposure feeding tests, respectively. Each replicate
consisted of 175-mll glass vials filled with 50 g (dry weight) of sediment plus 100
ml of local water under continuous aeration. Vials were prepared 12 hours prior
to the beginning of each test, to allow stabilization between sediment and water.
At the start of the tests, three and five larvae were added per replicate, for the
growth and postexposure feeding test, respectively, and 30 minutes latter
aeration was restarted. Food was provided only during the growth test at a daily
rate of 1 mg of TetraMin per larva up to the second day and 1.5 mg Tetramin
per larva from day 2 onwards. Both tests were conducted under the same
environmental conditions as those used for culturing. Water levels were daily
adjusted with distilled water. At the end of the 10-days exposure period,
percentages of mortality were determined and growth was estimated as the
body dry weight (in mg). At the end of the 48-hours exposure feeding, larvae
were retrieved from the sediment, immediately individually transferred to a 50
ml glass vial filled with 30 ml of ASTM hard water and 100 defrosted nauplii (<

Chapter 2 – Material and Methods
28
than 24-hours old) of Artemia franciscana Kellog, allowed to feed at 20°C in
darkness for 1 hour, time after which larvae were retrieved and the remaining
nauplii were counted. Feeding rates (number of nauplii/larva/hour) were
calculated as the difference between the initial and the final number of nauplii.
Levels of pH, conductivity and dissolved oxygen were measured in
overlying water during the following toxicity tests: macrophyte growth at days 0,
4, 7, 11 and 14, microalgae growth and both C. riparius tests at test initiation
and end. Values measured in the controls were within the limits established in
the guidelines, whereas those measured in the treatments were within levels
known not to be appropriate for the test organisms.
2.6 – Statistical analyses
For all toxicity tests performed, the effect of the two main factors,
sediment depth (two levels: surface and subsurface) and sediment site (four
levels: NW, NE, SW, and SE), and their interaction on the organism responses
was evaluated. The violations of normality and homoscedasticity were checked
using the Shapiro–Wilk’s and Bartlett’s tests, respectively. For the V. fischeri
test, a 2-way analysis of variance (ANOVA) was applied on the adjusted
absolute luminescence (mean of the two subreplicates) calculated by
multiplying the percentage of luminescence of each treatment subsample after
a 30 minutes exposure (i.e., 100 minus the % of effect inhibition as given by the
Microtox Omni Software 1.18; Azur Environmental) with the overall mean of all
control luminescence readings , given that the microtox has a different control

Chapter 2 – Material and Methods
29
luminescence for each subsample. For both the microalgae tests, growth
differences were evaluated through a 2-way ANOVA. For the macrophyte test
and for both C. riparius tests, organism responses were compared through a 2-
way nested ANOVA. Although a nested ANOVA design was used in the
ostracod test, a two-way ANOVA was applied to the growth data as a mean to
fulfil the assumption of homoscedasticy. When significant effects were detected,
the latter analysis were followed by planned comparisons to test for the effects
of one factor within the other (if the interaction effect was significant) or for the
effects of one factor irrespectively of the other (if the interaction effect was not
significant), and by the Tukey HSD test when necessary. All statistical analysis
were conducted on Statistic 7.0 software.

Chapter 3 Results

Chapter 3 – Results
31
3 - Results
3.1 – Sediment and water physico-chemical characteristics
The percentage of organic matter was much higher in surface than in
subsurface sediments at all study sites, except at NW where similar
percentages were found (Table I). The particle size distribution was reasonably
similar among all sites, both for surface and subsurface sediments (Table I).
Whereas for sites NW, SW and SE more than 50% of both the surface and
subsurface sediment was composed of medium sand and more than 75% of
medium and coarse sand together, sediment from site NE had the highest
percentage of very coarse sand (> than 30%) and gravel (> than 9%), especially
the subsurface sediment.
Water physico-chemical characteristics in what regards levels of pH,
salinity and hardness were very similar among all four study sites, whereas
conductivity ranged from 334 to 1460 µS/cm (Table II). Dissolved oxygen levels
were much lower at site NE (< than 2 mg/L) than at all other sites (> 5 mg/L).
Regarding nutrient levels the highest values were found at site SE and rather
similar levels were found among the other three study sites.

Chapter 3 – Results
Tab
le I
. O
rga
nic
ma
tter
co
nte
nt
(in
%)
an
d p
art
icle
siz
e d
istr
ibu
tio
n (
in %
) fo
r su
rfa
ce
(S
) a
nd
su
bsu
rfa
ce
(D
)
se
dim
en
ts c
olle
cte
d a
t e
ach
of
the
fo
ur
stu
dy s
ite
s (
NW
, N
E,
SW
, S
E)
in t
he
Pa
ram
os l
ago
on
(N
ort
hw
est
Po
rtu
ga
l).
S
ite
N
W
NE
S
W
SE
S
D
S
D
S
D
S
D
Org
an
ic m
atte
r 0
.252
(±
0.0
10
) 0
.529
(±
0.3
6)
12
.3
(± 1
.6)
1.1
6
(± 0
.18
) 7
.74
(± 3
.4)
0.6
70
(± 0
.12
) 8
.11
(± 0
.88
) 0
.549
(± 0
.030
) P
art
icle
siz
e (
µm
)
>
20
00
0.1
4
0.0
0
9.2
2
23
.27
0.0
0
0.1
2
11
.32
7.1
1
10
00
– 2
000
0.0
8
0.1
9
33
.45
34
.00
0.1
3
0.4
2
12
.65
11
.51
50
0 –
10
00
8.1
9
16
.74
39
.71
27
.83
13
.24
15
.40
27
.34
27
.31
25
0 –
50
0
84
.05
74
.38
16
.47
12
.92
73
.24
75
.10
46
.07
50
.21
12
5 –
25
0
7.1
2
7.3
9
0.7
0
1.2
8
8.3
0
5.4
5
2.0
5
3.5
3
63
– 1
25
0.2
1
0.7
9
0.2
4
0.2
9
1.9
1
1.1
4
0.2
3
0.1
5
< 6
3
0.2
0
0.5
0
0.2
1
0.4
2
3.1
8
2.3
7
0.3
4
0.1
7

Chapter 3 – Results
33
Table II. Water physico-chemical parameters measured at each
of the four study sites (NW, NE, SW, SE) in the Paramos
lagoon (Northwest Portugal). Values of pH, salinity, conductivity
(Cond.), and dissolved oxygen (DO) were measured in the field
and those of hardness, nitrite, nitrate, ammonium, and
phosphate were measured in samples collected at the study
site and kept frozen until analysis (within 1 day).
Parameter
Site
NW NE SW SE
pH 7.40 7.20 7.49 7.24 Salinity 0.5 0.1 0.5 0.0
Cond. (µS/cm) 1460 686 1431 334 DO (mg/L) 5.2 1.8 7.2 8.7 Hardness (mg CaCO3/L) 142 145 182 104 NO2- (mg/L) < 0.1 < 0.1 < 0.1 0.435
NO3- (mg/L) 0.0815 0.0741 2.001 7.32 NH4
+ (mg/L) < 0.05 < 0.05 < 0.05 1.296 PO4
3- (mg/L) 0.0374 0.0426 < 0.03 0.6291
3.2 – Remediation efficacy with a test battery
All toxicity tests fulfilled the validity criteria for control performance
established in the adopted guidelines/standard operating procedures. In the 30-
minutes luminescence test with V. fischeri, results of a 2-way ANOVA revealed
a significant effect of both main factors (site: F1,3 = 139, P < 0.001; depth: F1,1 =
18, P < 0.001) and of the interaction effect (F1,3 = 9.6, P < 0.001). As shown in
Figure 2, the bacteria luminescence was significantly lower in surface than in
subsurface sediments at site SW (planned comparisons: F1,16 = 43, P < 0.001),
whereas for the other three sites no differences were observed between both
sediment depths (planned comparisons: F1,16 < 1.6, P > 0.2). Differences in
luminescence among sites were found both for surface and subsurface
sediments (planned comparisons: F3,16 > 43, P < 0.001). For both sediment

Chapter 3 - Results
34
depths luminescence was significantly lower at site SW than at all other sites
(Tukey: P < 0.001).
Results of a 2-way ANOVA on the 72-hours growth rate of the
microalgae showed that growth was significantly affected by site (F1,3 = 34, P <
0.001) and by the interaction effect (F1,3 = 18, P < 0.001) but not by the
sediment depth (F1,1 = 18, P = 0.14). Due to the interaction effect, differences
among sites were only revealed for subsurface sediments (planned
comparisons: F3,16 > 49, P < 0.001), with growth at NW and SW being
significantly lower than at NE (Tukey: P < 0.001), and growth at SE being
significantly higher than at all other sites (Tukey: P < 0.05) (Figure 2). Also,
differences between surface and subsurface sediments were found at all sites,
with growth at surface significantly higher than at subsurface at sites NW and
SW (planned comparisons: F1,16 > 4.6, P < 0.05) and the opposite at sites NE
and SE (planned comparisons: F1,16 > 5.2, P < 0.05).
When H. incongruens was exposed to the tested sediments, 74%
mortality was registered for the surface sediment at site SW (well above the
criterion of 20% allowed for the standard control), whereas a 100% survival was
registered for all other sediments. A 2-way ANOVA revealed that the 6-days
growth was influenced by site (F1,3 = 53, P < 0.001) and by the interaction (F1,3
= 41, P < 0.001), but not by the sediment depth (F1,1 = 3.7, P = 0.054).
Differences among sites were observed both for surface and subsurface
sediments (planned comparisons: F3,327 > 29, P < 0.001). Growth was higher at
site NW for S sediments (Tukey: P < 0.001) and at sites NW, SW and SE for
subsurface sediments (Tukey: P < 0.001), and was higher for surface than
subsurface sediments at sites NW and NE (planned comparisons: F1,327 > 16, P

Chapter 3 - Results
35
< 0.001) and lower for surface than for subsurface at site SW (planned
comparisons: F1,327 = 82, P < 0.001) (Figure 2).
For the 10-days growth test with C. riparius, larval mortality was
observed only for subsurface sediments at sites SW (17%) and SE (8%), but
both values were below the criterion of 30% allowed for the standard control. A
2-way nested ANOVA showed growth to be affected by site (F1,3 = 17, P <
0.001) and by the interaction (F1,3 = 4.7, P < 0.01), and not by sediment depth
(F1,1 = 3.1, P = 0.090). For surface sediments growth was significantly higher at
site NW than at all other sites (Tukey: P < 0.001), whereas for subsurface
sediments growth was significantly higher at NW and SW than at NE (Tukey: P
< 0.05) (Figure 2). Differences between surface and subsurface sediments were
only found at sites SW and SE, with growth at surface being lower than at
subsurface (planned comparisons: F1,55 > 5.4, P < 0.05) (Figure 2).
In the 48-hours C. riparius postexposure feeding test, a 2-way nested
ANOVA revealed a significant effect of site (F1,3 = 53, P < 0.001) and of the
interaction (F1,3 = 4.1, P < 0.05), but not of the sediment depth (F1,1 = 0.16, P =
0.70). For surface sediments postexposure feeding was lower at site NE that at
all other sites (Tukey: P < 0.001), whereas for subsurface sediments
postexposure feeding was lower at sites NE and SW than at the other two sites
(Tukey: P < 0.001) (Figure 2). A difference between surface and subsurface
sediment was found only at site NW (planned comparisons: F1,88 = 13, P <
0.001) (Figure 2).

Chapter 3 - Results
36
Figure 2. Sublethal effects of surface (S) and subsurface (D)
sediments collected at each of the four study sites (NW, NE,
SW, SE) in the Paramos lagoon (Northwest Portugal), on Vibrio
fischeri (30-minutes luminescence), Pseudokirchneriella
subcapitata (72-hours growth), Heterocypris incongruens (6-
days growth), and Chironomus riparius (10-days growth and 48-
A
B
C
B
a
b
aa
0
200
400
600
800
1000
1200
NW NE SW SE
Gro
wth
(um
)
A A
A
A
c
b
c
a
0.0
0.2
0.4
0.6
0.8
1.0
1.2
1.4
NW NE SW SE
B
B
A
Bbc
ab
a
c
0
10
20
30
40
50
60
70
80
90
NW NE SW SE
Lum
inescence
inhib
itio
n(%
)
S D
A
BB
B
a
b
a
ab
0.0
0.5
1.0
1.5
2.0
2.5
NW NE SW SE
B
C
B
Aa
b
b
a
0
10
20
30
40
50
60
70
80
90
100
NW NE SW SE
Feed
ing
(naup
lii/larv
a/h
)
*
*
*
*
*
*
*
**
*
**
Site Site
H. incongruensP. subcapitata
C. riparius
V. fischeri
C. riparius
Gro
wth
rate
(/d
)G
row
th((
mg
)

Chapter 3 - Results
37
hours postexposure feeding). Error bars indicate ± 1 standard
deviation; common letters above error bars indicate means not
significantly different between sites – capital letters for
differences within S sediments and small letters for differences
within D sediments – and asterisks denote significant
differences between S and D sediments within each site (by
planned comparisons and Tukey tests when necessary).
3.3 – Further investigation on primary producers
The microalgae test fulfilled the validity criteria established in the adopted
guidelines. A 2-way ANOVA revealed that only site had an effect on the growth
of P. subcapitata (F1,3 = 11, P < 0.001), with growth at site NW being lower than
at all other sites (Tukey: P < 0.05) (Figure 3).
The macrophyte growth test fulfilled the validity criterion established in
the under-development protocol of Maltby et al. (2010) regarding biomass
increase, but not that established in the ISO (2009) guidelines regarding the
specific growth rate; according to the latter protocol the test is to be started with
shoots of a much smaller length which are expected to have a different growth
rate. A 2-way nested ANOVA showed that growth was significantly affected only
by site (F1,3 = 21, P < 0.001). Growth at site NW was lower than at sites NE and
SW (Tukey: P < 0.05) and at site NE was higher than at all other sites (Tukey: P
< 0.001) (Figure 3).

Chapter 3 - Results
38
Figure 3. Sublethal effects of surface (S) and subsurface (D)
sediments collected at each of the four study sites (NW, NE,
SW, SE) in the Paramos lagoon (Northwest Portugal), on
Pseudokirchneriella subcapitata (72-hours growth) and
Myriophyllum aquaticum (15-days growth). Error bars indicate ±
1 standard deviation; common letters above error bars indicate
means not significantly different between sites – capital letters
for differences within sites (NW, NE, SW, SE).
B
BCC
A
0.00
0.04
0.08
0.12
0.16
0.20
NW NE SW SE
Gro
wth
rate
(/
d)
Site
S ID
B
AA
A
0.0
0.2
0.4
0.6
0.8
1.0
1.2
1.4
NW NE SW SE
Gro
wth
rate
(/
d)
Site
P. subcapitata M. aquaticum

Chapter 4 Discussion

Chapter 4 –Discussion
40
4 – Discussion
4.1 – Remediation efficacy with a test battery
To evaluate the efficacy of the remediation measures that have taken
place up to date in the Paramos lagoon (Northwest Portugal), a battery of
toxicity tests on surface and subsurface sediments from four selected study
sites was carried out with organisms representative of different: (i) throphic
levels in the food web, (ii) taxonomic groups and (iii) functions at the ecosystem
level. Previous studies indicated that sediments from this lagoon were
contaminated mainly with metals, such as zinc, copper, lead and chromium, but
also with polychlorinated, biphenyls, phosphorous, nitrogen (SIMRIA, 2002;
Fernandes et al., 2007a; Fernandes et al., 2008a,b).
It is well known that toxicity tests/bioassays provide relevant information
on the biological damage caused by contamination, i.e., on the environmental
quality of sediments (Chapman, 2002; Ghirardini et al., 2005). Assessing
sediment toxicity by using standard bioassays with a battery of test species is
essential because: (i) species sensitivity varies among toxicants, no single
species is more sensitive to all contaminants (Burton, 1991), (ii) provides insight
into the potential effects of contaminants on the population dynamics (Maltby,
1999), (iii) gives a direct measure of functional responses (Giesy & Hoke,
1989), and (iv) integrates additive, synergistic and antagonistic effects of all
contaminants (Pandard et al,. 2006). Thus, using a battery of bioassays is an
important tool to reduce uncertainties, to provide robustness in toxicity

Chapter 4 –Discussion
41
assessments, and, depending on the type of assays selected, it has also the
potential to be a rapid screening tool (Giesy & Hoke, 1989; Bailey & Young,
1997; Narracci et al., 2009).
In what regards bioassay endpoints, growth and reproduction are among
the most classically and commonly used sublethal organism measurements,
mostly because they are generally sensitive responses whose consequences at
the individual level are expected to be transferred to population, community and
finally to ecosystem structure and functions in a time-delayed process (Giesy &
Hoke, 1989; Maltby, 1999). However, effects on reproduction and growth imply
time-delayed extrapolations from individuals to population and ecosystems
(Krell et al., 2011). Yet, postexposure feeding has shown to be an important
endpoint to be evaluated since exposure to stressors can have direct effect on
the feeding rate which in turn induces changes in growth and reproduction of
the population and thus has eventually effects on ecosystem functioning
(Matlby, 1994; Maltby, 1999). Feeding answer has been proved to be a
sensitive and fast endpoint to be measured, since it takes only few days (Alonso
et al., 2009; Maltby, 1994; McWilliam & Baird, 2002). Furthermore using feeding
as an endpoint has advantages because a depression in feeding may have
direct and indirect effects on the ecosystems by preventing the functioning of
the ecosystem before its effects at individual level may have consequences at
higher levels of biological organization (Krell et al., 2011). At the screening
level, and because bacteria have an important role as decomposers, the
luminescence bioassay with the marine bacteria V. fischeri has been
demonstrated to be a sensitive, easy and rapid test, and as a result has been

Chapter 4 –Discussion
42
widely incorporated into batteries of bioassays to asses both water-column and
sediment toxicity (Giesy & Hoke, 1989; Burton, 1991; Pandard et al., 2006).
The bacteria V. fischeri has been used in toxicity tests due to its functions
in the ecosystem, as the degradation process and the nutrient cycling (Giesy &
Hoke, 1989). The luminescence test with V. fischeri was highly sensitive to
sediment samples for surface and subsurface sediment at site SW that is
luminescence was inhibited by 96% and 59% respectively. This was the only
site showing differences between the two types of sediments for site SW. In fact
surface sediments reveal to be more contaminated than deeper ones. Burton
(1991) stated that contaminants are associated to fine sediment particles, due
to the relatively large surface area and transport. This fine sediment particles
promotes also bacterial adhesion, that settle out at the bottom, thus affecting
light emission (Davorean et al., 2005, Parvez et al., 2006). Fine sediment
fractions tend to predominate in deposition areas, in fact that is what happened
to this sampling site, with an average of 3% fine particles for site SW
contrasting to < 0.5% for the other sampling sites. Probably the reason for these
results is related to the sediment particle size and to the presence of chemicals
such as, polycyclic aromatic hydrocarbons (PAHs) and metals, which have
confirmed to be toxic to V. fischeri (Salizzato et al., 1998; Wolksa et al., 2007).
Bacteria are known to be sensitive to organic compounds rather than
chlorinated organic compounds and can uptake contaminants from the
sediments and water in a short period of time (Giesy & Hoke, 1989; Liss & Ahlf,
1997).
Chapter 4 –Discussion
43
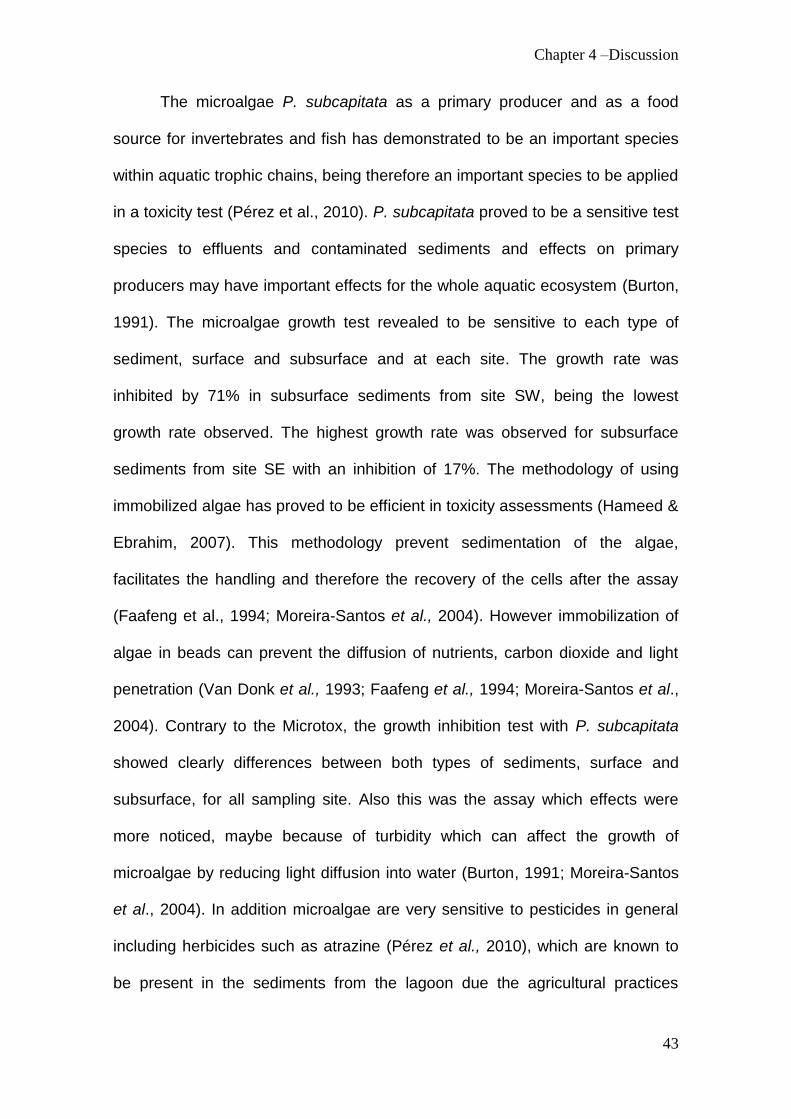
The microalgae P. subcapitata as a primary producer and as a food
source for invertebrates and fish has demonstrated to be an important species
within aquatic trophic chains, being therefore an important species to be applied
in a toxicity test (Pérez et al., 2010). P. subcapitata proved to be a sensitive test
species to effluents and contaminated sediments and effects on primary
producers may have important effects for the whole aquatic ecosystem (Burton,
1991). The microalgae growth test revealed to be sensitive to each type of
sediment, surface and subsurface and at each site. The growth rate was
inhibited by 71% in subsurface sediments from site SW, being the lowest
growth rate observed. The highest growth rate was observed for subsurface
sediments from site SE with an inhibition of 17%. The methodology of using
immobilized algae has proved to be efficient in toxicity assessments (Hameed &
Ebrahim, 2007). This methodology prevent sedimentation of the algae,
facilitates the handling and therefore the recovery of the cells after the assay
(Faafeng et al., 1994; Moreira-Santos et al., 2004). However immobilization of
algae in beads can prevent the diffusion of nutrients, carbon dioxide and light
penetration (Van Donk et al., 1993; Faafeng et al., 1994; Moreira-Santos et al.,
2004). Contrary to the Microtox, the growth inhibition test with P. subcapitata
showed clearly differences between both types of sediments, surface and
subsurface, for all sampling site. Also this was the assay which effects were
more noticed, maybe because of turbidity which can affect the growth of
microalgae by reducing light diffusion into water (Burton, 1991; Moreira-Santos
et al., 2004). In addition microalgae are very sensitive to pesticides in general
including herbicides such as atrazine (Pérez et al., 2010), which are known to
be present in the sediments from the lagoon due the agricultural practices

Chapter 4 –Discussion
44
(SIMRIA, 2002). Interactions between pesticides can have an overall higher
effect due to synergism between them (Pérez et al., 2010). Water sample from
site SE had the highest content of available N and P, this could have enhanced
growth of algae that was observed for site D-SE.
The ostracod H. incongruens is a freshwater cosmopolitan species, is an
omnivorous species and is considered to be an indicator of organic pollution
(Ganning, 1971; Külköylüoglu, 2004). The growth test with H. incongruens was
very sensitive to SW surface sediment with a growth inhibition of 33%. For
surface sediments from site NW the highest growth was observed (21%). This
assay has proved to be simple to do, sensitive and precise (Belgis et al., 2003).
Gills are the major site for metal uptake in crustaceans (Maltby, 1999), and fine
sediment particles can decrease respiration rate by affecting respiratory
structures (Lemly, 1982). Ostracods are also affected by metals, especially zinc
and PAHs (Wang et al., 2009), which was confirmed to exist in the sediments
(Fernandes et al., 2007b; Fernandes et al., 2008a). These could be the main
causes of stress that ostracod individuals faced to. Nevertheless, results from
sampling sites were not very different from each others with the exception for
surface sediments from site SW. This result is probably due to high mortality (74
%) rate observed for surface sediments.
The midge C. riparius is an important aquatic key species in
decomposition process and is in constant contact with sediment being therefore
a good organism for assessment of sediment toxicity (Giesy & Hoke, 1989;
Pérez et al., 2010). The growth test with C. riparius revealed that the midge had
a lower growth rate in surface sediments for site SE (95%), as the higher growth
rate was detected for surface sediments for site NW (214%). Chironomid larvae

Chapter 4 –Discussion
45
are in constant contact with sediments being therefore a good organism for
assessment of sediment toxicity (Giesy & Hoke, 1989). The C. riparius growth
test revealed some differences between treatments. C. riparius is known for
being an opportunistic species and for being resistant to contaminants (Burton
et al., 1991; De Hass et al., 2002). During the test individuals were feed at a
minimum level to compensate for the physicochemical characteristics of
sediments and to avoid them to starve (Akerblom & Goedkoop, 2003; Ristola et
al., 1999). However, some authors suggest that this species respond more to
sediment nutritional levels than to associated contaminants, indeed,
chironomids can incorporate a significant nutritive value from detrital matter
associated to sediments (Ankley et al., 1994, De Hass et al., 2002).
Furthermore, feeding can mask the effects of contaminants on larval
development (De Haas et al., 2002), by reducing (Stuijtzand et al., 2000), or
increasing (Akerblom & Goedkoop, 2003) their bioavailability meaning that
results may not be directly related to effects of contaminants. In fact, this
relation of food levels with growth of C. riparius occurs in eutrophic
environments, where an overcompensation of toxic effects by food was
observed (Stuijtzand et al., 2000). This could be the reason for the obtained
results since the study site is highly eutrophic.
In postexposure feeding test, C. riparius feeding rate was mainly affected
at sites NE and SW. Surface sediments at site SE promoted a high feeding rate
of larvae on artemia (187%), while for subsurface sediments from site NE had
the lowest feeding rate (16%). Chironomid where exposed to water and
sediment samples for 48 hours without being feed. Thus the physicochemical
characteristics of the sediment were the main stress cause to these organisms.

Chapter 4 –Discussion
46
Ankley et al. (1994) demonstrated that sediment characteristics can have
effects on the response of chironomids (Ankley et al., 1994). In fact he suggests
that better growth rate of chironomids is observed in slightly coarse sediments
particles (particle size: 250 – 500 µm). Sampling site NE is mostly composed by
coarse sediments (Table 1), this could be a stress factor which effect was
observed in the feeding rate. Other important result is the one for site SW,
which effects could be also related to particle size. For this sampling site, a
higher percentage of very small particles were present. Often, contaminants are
associated to small particles (Burton, 1991) being an important exposure route
and acting therefore as another stressor factor. Moreover, metals can be linked
to small particles, which is also an important stress factor. Fine sediment
composition can prevent the performance of chironimid (Ankley et al., 1994).
Even for a short time duration it could be that larvae feed on the organic matter
present in sediments which in turn are highly associated to metals (Fernandes
et al., 2007b; Fernandes et al., 2008a).
4.2 – Overall toxicity
A positive correlation between organic matter and metals was found,
being an important factor contributing to the decline of water and sediments
quality of this lagoon (Fernandes et al., 2007b; Fernandes et al., 2008a). The
present data clearly show that, depending on the endpoint measured (growth,
feeding and luminescence), that differences in toxicity were observed. Some
considerations can be made regarding the different toxic responses of the
various species. Even though, a battery of bioassays may not provide a perfect

Chapter 4 –Discussion
47
correlation between assays due to the relative sensitivity of the different test
species to the variety of contaminants, it has been proved to reduce
uncertainties (Giesy & Hoke, 1989; Tuikka et al., 2011). Uncertainties related to
contamination of sediments were reduced, even if no clear trend between the
toxicity bioassays was observed.
In overall, responses from the battery assays in surface sediments were
higher than or equal to responses in subsurface sediments at all sites except at
SW. The only exceptions were once at site NW (S < D by 19% in the C. riparius
postexposure feeding test), once at site NE (S < D by 25% in the P. subcapitata
growth test) and twice at site SE (S < D by 24% and 46% in the C. riparius
growth test and the P. subcapitata growth test respectively). Only at site SW,
responses at surface sediments were lower than responses in subsurface
sediments for all tests, with exception to the C. riparius postexposure test (S >
D by 26%). Site NW together with site SE were among the sites which
presented higher organism responses. These results were expected since site
NW is located next to the sea which promotes some renewal of the water and
sediments, and site SE located in the Maceda river where remediation
measures first took place. Contrary, sites NE and SW were sites with lower
organism responses and with higher uncertainties in what regards their toxicity.
These sites were expected to have lower responses since site NE is located in
the Maior river which has been very contaminated for many years and site SW,
which is located in the centre of the lagoon where probably contaminants
accumulate. For the microalgae test no specific responses were detected,
revealing some uncertainties. In order to establish if these uncertainties are due

Chapter 4 –Discussion
48
to the sensitivity of the selected species or due to the presence of other
contaminants not detected by the other assays, a macrophyte growth test with
M. aquaticum and microalgae growth test with P. subcapitata was performed to
distinguish differences among primary producers.
In a case study with such a contamination history, confounding factors
are usual due to the high complexity of compounds in sediments and water
Pandard et al., 2006). However, this study along with others (Bailey & Young,
1997, Rosa et al., 2010), demonstrated that a battery of assays is an important
approach for impacted environments where industrial and domestic
contamination is observed providing information with ecological realism.
4.3 – Primary producers
Primary producers are very important in ecosystems because they
convert solar energy and carbon dioxin into organic matter, produce of oxygen,
sequestrate carbon dioxin and therefore sustain higher levels. Submersed
macrophytes can be regarded as key species since changes in the marophyte
community can have consequences for the aquatic ecosystem (Arts et al.,
2008). Macrophytes maintain important ecosystem structures and functions,
such as cycling and retention of nutrients, stabilization of sediments, provision
of food, habitat resources for aquatic fauna and promote biodiversity (Maltby et
al., 2009). The M. aquaticum growth test has been recently developed to better
understand the exposures routes through sediments to aquatic plants, this
because the only aquatic plant used in risk assessment, Lemna minor, is not
exposed by roots (Arts et al., 2010).
Chapter 4 –Discussion
49
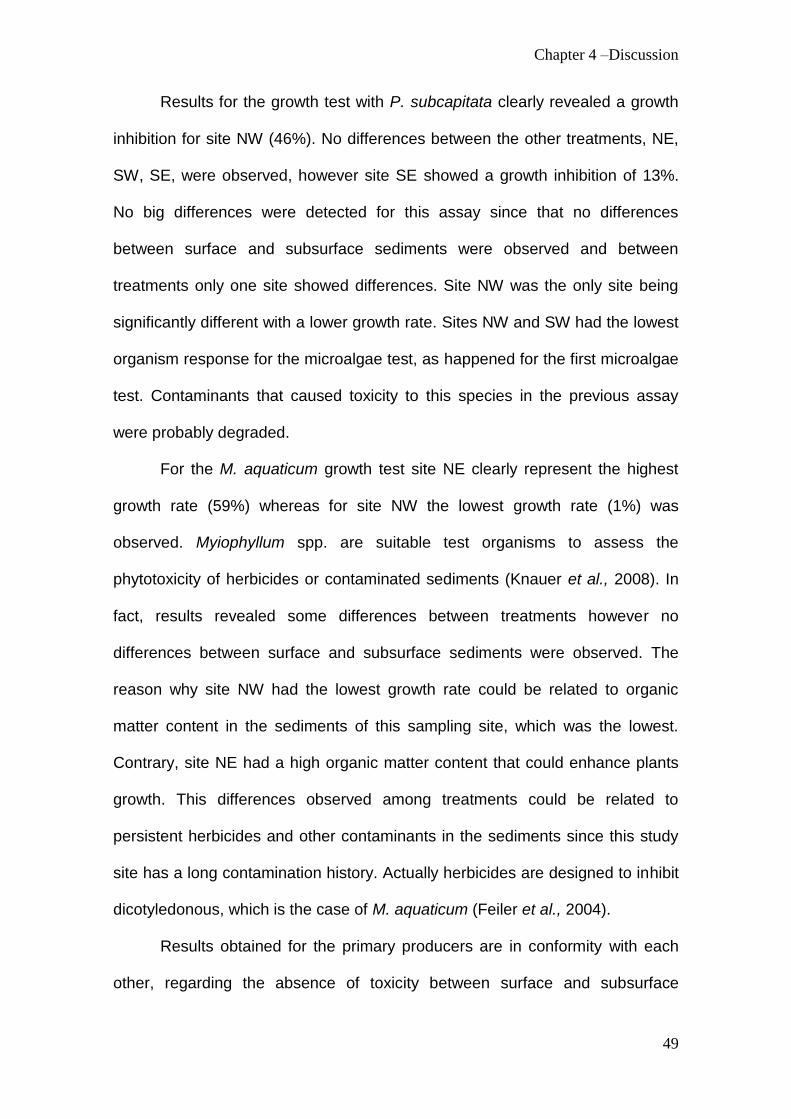
Results for the growth test with P. subcapitata clearly revealed a growth
inhibition for site NW (46%). No differences between the other treatments, NE,
SW, SE, were observed, however site SE showed a growth inhibition of 13%.
No big differences were detected for this assay since that no differences
between surface and subsurface sediments were observed and between
treatments only one site showed differences. Site NW was the only site being
significantly different with a lower growth rate. Sites NW and SW had the lowest
organism response for the microalgae test, as happened for the first microalgae
test. Contaminants that caused toxicity to this species in the previous assay
were probably degraded.
For the M. aquaticum growth test site NE clearly represent the highest
growth rate (59%) whereas for site NW the lowest growth rate (1%) was
observed. Myiophyllum spp. are suitable test organisms to assess the
phytotoxicity of herbicides or contaminated sediments (Knauer et al., 2008). In
fact, results revealed some differences between treatments however no
differences between surface and subsurface sediments were observed. The
reason why site NW had the lowest growth rate could be related to organic
matter content in the sediments of this sampling site, which was the lowest.
Contrary, site NE had a high organic matter content that could enhance plants
growth. This differences observed among treatments could be related to
persistent herbicides and other contaminants in the sediments since this study
site has a long contamination history. Actually herbicides are designed to inhibit
dicotyledonous, which is the case of M. aquaticum (Feiler et al., 2004).
Results obtained for the primary producers are in conformity with each
other, regarding the absence of toxicity between surface and subsurface

Chapter 4 –Discussion
50
sediments. The microalgae test revealed big differences that could be due to
contaminants degradation, between the first microalgae test and the second
one, revealing some uncertainties. Nevertheless the macrophyte growth test
could detect more differences between treatments than the microalgae growth
test, however contrary to what happened in the battery test, site NW was no
more the one with a higher growth rate, as site NE was the site with higher
response. Uncertainties regarding primary producers’ responses at all sites,
dictate that it is necessary to carry further testing. Yet, the possibility that
herbicides with a sediment distribution different than the other contaminants are
responsible for the results found in the microalgae test cannot be ruled out. For
instance, some herbicides like atrazine are highly persistent could justify this
results.

Chapter 5 Conclusion

Chapter 5 - Conclusion
52
5 – Conclusion
The quality of water and sediments within this lagoon has been gradually
degraded over the last few years, by industrial and domestic discharges
(Fernandes et al., 2007b; Fernandes et al., 2008a). This degradation was
confirmed by results obtained from the toxicity assays. Along with other studies
(Bailey & Young, 1997, Rosa et al., 2010), this study demonstrated that a
battery of assays is an important approach for impacted environments where
industrial and domestic contamination is observed providing information with
ecological realism.
Sites NW and SE were the ones that demonstrated higher organism
responses. Contrary sites NE and SW were sites with lower organism
responses and with higher uncertainties in what regards their toxicity.
Concerning surface versus subsurface sediments, site SW was the only with
responses for surface sediments lower than responses in subsurface sediments
for all test, with exception to the C. riparius postexposure feeding test.
The macrophyte growth test proved to be, as in other studies, a valuable
complement assay to add to a battery of bioassays (Feiler et al., 2004).
Concerning primary producers, both revealed for site NW the lowest response,
as for site NE the higher response was observed. Different uptake routes were
the reason for the differences between the microalgae and macrophyte test, still
contaminants that promoted that behavior remained unknown. Uncertainties
regarding primary producers’ responses at all sites dictate that it is necessary to
carry further testing.

Chapter 5 - Conclusion
53
This kind of assays proved to be useful for rapidly establish the state of
the lagoon indicating that further interventions should take place in order to
remediate this ecosystem.

References

References
55
Akerblom N. & Goedkoop W. (2003). Stable isotopes and fatty acids reveal that
Chironomus riparius feeds selectively on added food in standardized
toxicity tests. Environmental toxicology and chemistry 22: 1473 - 1480.
Alonso A., De Lange H. & Peeters E. (2009). Development of a feeding
behavioural bioassay using the freshwater amphipod Gammarus pulex
and the Multispecies Freshwater Biomonitor. Chemosphere 75: 341 - 346.
Ankley G.T., Benoit D.A., Balogh J.C., Reynoldson T.B., Day K.E. & Hoke R.A.
(1994). Evaluation of potential confounding factors in sediment toxicity
tests with three freshwater benthic invertebrates. Environmental
Toxicology and Chemistry 13: 627 - 635.
APHA/AWWA/WPCF (American Public Health Association, American Water
Works Association, Water Pollution Control Federation). (1995). Standard
Methods for the Examination of Water and Wastewater, 19th ed. American
Public Health Association, Washington, DC, USA.
Arts G.H.P., Belgers J.D.M., Hoekzema C.H. & Thissen J.T.N.M. (2008).
Sensitivity of submersed freshwater macrophytes and endpoints in
laboratory toxicity tests. Environmental Pollution 153:199 - 206.
Arts G., Davies J., Dobbs M., Ebke P., Hanson M., Hommen U., Knauer K.,
Loutseti S., Maltby L., Mohr S., Poovey A. & Poulsen V. (2010). AMEG:
the new SETAC advisory group on aquatic macrophyte ecotoxicology.
Environmental Scientific Pollution Research 17: 820 - 823.
ASTM (American Society for Testing and Materials). (2002). Standard guide for
conducting acute toxicity tests on test materials with fishes,
macroinvertebrates, and amphibians. E 729–96. Annual Book of ASTM
Standards, vol. 11.05. Philadelphia, PA, USA.

References
56
Bailey H.C. & Young L. (1997). A comparison of the results of freshwater
aquatic toxicity testing of pulp and paper mill effluents. Water Science and
Technology 35: 305 - 313.
Belgis Z.C., Persoone, G. & Blaise C. (2003). Cyst-based toxicity tests XVI--
sensitivity comparison of the solid phase Heterocypris incongruens
microbiotest with the Hyalella azteca and Chironomus riparius contact
assays on freshwater sediments from Peninsula Harbour (Ontario,
Canada). Chemosphere 52: 95 - 101.
Bellucci L.G., Frignani M., Paolucci D. & Ravenelli M. (2002). Distribution of
heavy metals in sediments of the Venice Lagoon: the role of the industrial
area. The science of the Total Environment 295: 35 - 49.
Buchanan J.B., & Kaine J.M. (1971). Measurement of the physical and chemical
environment. In Holme NA, McIntyre AD, eds, Method for the Study of
Marine Benthos. Blackwell Scientific, Oxford, UK, pp 30 - 58.
Burton G.A. (1991). Assessing the toxicity of freshwater sediments.
Environmental Toxicology and Chemistry 10: 1585 - 1627.
Cairns Jr, J. (1983). Are single species toxicity tests alone adequate for
estimating environmental hazard? Hydrobiologia 100: 47 - 57.
Chapman P.M. (2007). Determining when contamination is pollution — Weight
of evidence determinations for sediments and effluents. Environment
International 33: 492 - 501.
Chapman P.M., Ho K.T., Munns Jr W.R., Solomon K. & Weinstein M.P. (2002).
Issues in sediment toxicity and ecological risk assessment. Marine
Pollution Bulletin 44: 271 - 278.

References
57
Cooney J.D. (1995). ―Freshwater tests‖ in Rand Gary (ed.) Fundamentals of
aquatic ecotoxicology: effects, environmental fate and risk assessment.
Washington DC: Taylor and Francis, pp 71 - 102.
Crane M., Burton G.A., Culp J.M., Greenberg M.S., Munkittrick K.R., Ribeiro
R., Salazar M.H. & St-Jean S.D. (2007). Review of aquatic in situ
approaches for stressor and effect diagnosis. Integrated Environmental
Assessment and Management 3: 234 - 245.
Creasel (2001). Ostracodtoxkit F: Chronic direct contact toxicity test for
freshwater sediments. Standard Operational Procedure. Creasel, Deinze,
Belgium, 28 pp.
Davorean M., Shúilleabháin S.N., O'Halloran J., Hartl M.G.J., Sheehan, D.,
O'Brien N.M., Van Pelt F.N.A.M. & Mothersill C. (2005). A test battery
approach for the ecotoxicological evaluation of estuarine sediments.
Ecotoxicology 14: 741 - 755.
De Haas E.M., Reuvers B., Moermond C.T.A., Koelmans A.A. & Kraak M.H.S.
(2002). Responses of benthic invertebrates to combined toxicant and food
input in floodplain lake sediments. Environmental Toxicology and
Chemistry 21: 2165 - 2171.
Degetto S., Schintu M., Contu A. & Sbrignadello G. (1997). Santa Gilla lagoon
(Italy): a mercury sediment pollution case study. Contamination
assessment and restoration of the site. The Science of the Total
Environment 204: 49 - 56.

References
58
Dias, A.M.S. (2000). Estudo da dinâmica espacial e temporal dos principais
factores abióticos e da comunidade fitoplanctónica da vala de Maceda.
Master thesis. Department of Zoology and Anthropology, Faculty of
Science, University of Porto, Portugal.
EC (Environment Canada). (1992). Biological test method: Growth inhibition test
using the freshwater alga Selenastrum capricornutum. Report EPS
1/RM/25. Ottawa, ON, Canada.
EC (Environment Canada). (1997). Biological test method: Test for survival and
growth in sediment using the larvae of freshwater midge (Chironomus
tentans or Chironomus riparius). Report EPS 1/RM/32. Ottawa, ON,
Canada.
Faafeng B.A., Van Donk E. & Källqvist S.T. (1994). In situ measurement of algal
growth potential in aquatic ecosystems by immobilized algae. Journal of
Applied Phycology 6: 301 - 308.
Feiler U., Kirchesch I. & Heininger P. (2004). A New Plant-based Bioassay for
Aquatic Sediments. Journal of Soils and Sediments 4: 261 - 266.
Fernandes C., Fontaínhas-Fernandes A., Monteiro, S.M. & Salgado M.A.
(2007a). Changes in plasma electrolytes and gill histopathology in wild
Liza saliens from the Esmoriz-Paramos coastal lagoon, Portugal.
Environmental Contamination and Toxicology 79: 301 - 305.
Fernandes C., Fontaínhas-Fernandes A., Peixoto F. & Salgado M.A. (2007b).
Bioaccumulation of heavy metals in Liza saliens from the Esmoriz-
Paramos coastal lagoon, Portugal. Ecotoxicology and Environmental
Safety 66: 426 - 431.

References
59
Fernandes C., Fontaínhas-Fernandes A., Cabral D. & Salgado M.A. (2008a).
Heavy metals in water, sediment and tissues of Liza saliens from Esmoriz-
Paramos lagoon, Portugal. Environmental Monitoring assessment 136:
267 - 275.
Fernandes C., Fontaínhas-Fernandes A., Rocha E. & Salgado A. (2008b).
Monitoring pollution in the Esmoriz-Paramos lagoon, Portugal: Liver
histological and biochemical effects in Liza saliens. Environmental
Assessment and Monitoring 145: 315 - 322.
Ganning B. (1971). On the ecology of Heterocypris salinus, H. incongruens and
Cypridopsis aculeata (Crustacea : Ostracoda) from Baltic brackish-water
rockpools. Marine Biology 8: 271 - 279.
Ghirardini A.V., Novelli A.A. & Tagliapietra D. (2005). Sediment toxicity
assessment in the Lagoon of Venice (Italy) using Paracentrotus lividus
(Echinodermata: Echinoidea) fertilization and embryo bioassays.
Environmental International 31: 1065 - 1077.
Giesy J. & Hoke R. (1989). Freshwater sediment toxicity bioassessment:
rationale for species selection and test design. Journal of Great Lakes
Research 15: 539 - 569.
Gönenç I.E. & Wolflin J.P. (2005). Coastal lagoons. Ecosystem Processes and
Modeling for sustainable use and Development, 1 - 2 pp.
Green I.M., Folke C., Turner K. & Batemen I. (1994). Primary and secondary
values of wetland ecosystem. Environmental and Resource Economics 4:
55 - 74.

References
60
Guerra R., Pasteris A. & Ponti M. (2009). Impacts of maintenance channel
dredging in a northern Adriatic coastal lagoon. I: Effects on sediment
properties, contamination and toxicity. Estuarine Coastal and Shelf
Science 85: 134 - 142.
Hameed M.S.A. & Ebrahim O.H. (2007). Biotechnological Potential Uses of
Immobilized Algae. International Journal of Agriculture & Biology 9: 183 -
192.
Ingersoll, C.G. (1995). ―Sediment tests‖ in Rand Gary (ed.) Fundamentals of
aquatic ecotoxicology: effects, environmental fate and risk assessment.
Washington DC: Taylor and Francis, pp 231 - 255.
ISO (International Standardization Orhanization) (2009). Water quality -
Determination of the toxic effect of sediment and soil on the growth
behavior of Myriophyllum aquaticum - Myriophyllum test. ISO International
Standard ISO/WD Myriophyllum. Germany.
Jensen & Mesman (2006). Ecological risk assessment of contaminated land.
RIVM 711701047, The Netherlands, 138 pp.
Knauer K., Mohr S. & Feiler U. (2008). Comparing growth development of
Myriophyllum spp. in laboratory and field experiments for ecotoxicological
testing. Environmental Scientific Pollution Research 15: 322 - 331.
Krell B., Moreira-santos M., & Ribeiro R. (2011). An estuarine mudsnail in situ
toxicity assay based on postexposure feeding. Environmental Toxicology
and Chemistry 30: 1935 - 1942.
Külköylüoglu O. (2004). On the usage of ostracods (Crustacea) as bioindicator
species in different aquatic habitats in the Bolu region, Turkey. Ecological
Indicators 4: 139 - 147.

References
61
Lemly A. (1982). Modification of benthic insect communities in polluted streams:
combined effects of sedimentation and nutrient enrichment. Hydrobiologia
87: 229 - 245.
Liss W. & Ahlf W. (1997). Evidence from whole-sediment, porewater, and
elutriate testing in toxicity assessment of contaminated sediments.
Ecotoxicology and environmental safety 36: 140 - 147.
Maltby L. (1994). Stress, shredders and streams: ―Using Gammarus energetics
to assess water quality‖ in Sutcliffe DW (ed.) Water quality and stress
indicators in marine and freshwater systems: linking levels of
organisation. Freshwater Biological Association, Ambleside, Cumbria, UK,
pp 98 - 110.
Maltby L. (1999). Studying stress: the importance of organism-level responses.
Ecological Applications 9: 431 - 440.
Maltby L., Arnold D., Arts G., Davies J., Heimbach F., Pickl C. & Poulsen V.
(2010). Aquatic Macrophyte Risk Assessment for Pesticides: Reports of
Workgroups and Follow-up Investigations. Chapter 5. CRC Press,
Netherlands, pp 45 - 63.
McWilliam R.A. & Baird D.J. (2002). Application of postexposure feeding
depression bioassays with Daphnia magna for assessment of toxic
effluents in rivers. Environmental Toxicology and Chemistry 21: 1462 -
1468.
Mitsch W.J. & Gosselink J.G. (2000). The value of wetlands: importance of
scale and landscape setting. Ecological Economics 35: 25 - 33.

References
62
Moreira-Santos M., Soares A. M. V. M. & Ribeiro R. (2004). An in situ bioassay
for freshwater environments with the microalga Pseudokirchneriella
subcapitata. Ecotoxicology and Environmental Safety 59: 164 - 173.
Narracci M., Cavallo R.A., Acquaviva M.I., Prato E. & Biandolino F. (2009). A
test battery approach for ecotoxicological characterization of Mar Piccolo
sediments in Taranto (Ionian Sea, Southern Italy). Environmental
Monitoring Assessment 148: 307 - 314.
OECD (Organization for Economic Cooperation and Development) (1996).
Alga, Growth Inhibition Test. OECD guidelines for testing of chemicals
(Vol. 201).
OECD (Organization for Economic Cooperation and Development) (2004).
Sediment water chironomid test using spiked water. OECD guidelines for
testing of chemicals (Vol. 218). Paris: OECD.
Pandard P., Devillers J., Charissou A.M., Poulsen V., Jourdain M.J., Férard
J.F., Grand C. & Bispo A. (2006). Selecting a battery of bioassays for
ecotoxicological characterization of wastes. Science of the Total
Environment 363: 114 - 125.
Parvez S., Venkatarman C. & Mukherji S. (2006). A review on advantages of
implementing luminescence inhibition test (Vibrio fischeri) for acute toxicity
prediction of chemicals. Environmental International 32: 265 - 268.
Pérez J.R., Loureiro S., Menezes S., Palma P., Fernandes R.M., Barbosa I. R.
& Soares A.M.V.M. (2010). Assessment of water quality in the Alqueva
Reservoir (Portugal) using bioassays. Environmental Science and
Pollution Research 17: 688 - 702.

References
63
Postel S. & Carpenter S. (1997). ―Freshwater Ecosystem Services‖ in Gretchen
C. Daily (ed.) Nature’s services: societal dependence on natural
ecosystems. USA: Island Press, pp 195 - 214.
Rand G.M., Wells P.G. & McCarty L.S. (1995). ―Introduction to aquatic
toxicology‖ in Rand Gary (ed.) Fundamentals of aquatic ecotoxicology:
effects, environmental fate and risk assessment. Washington DC: Taylor
and Francis, pp 3 - 67.
Ristola T., Pellinen J., Ruokolainen M., Kostamo A. & Kukkonen J.V.K. (1999).
Effect of sediment type, feedinf level, and larval density on growth and
development of a midge (Chironomus riparius). Environmental Toxicology
and Chemistry 18: 756 - 764.
Rosa R., Moreira-Santos M., Lopes I., Silva L., Rebola J., Mendonça E., Picado
A. & Ribeiro R. (2010). Comparison of a test battery for assessing the
toxicity of a bleached-kraft pulp mill effluent before and after secondary
treatment implementation. Environmental Monitoring Assessment 161:
439 - 451.
Sá A. & Loureiro J. (1995). Barrinha de Esmoriz-Lagoa de Paramos. Quercus.
Portugal.
Salizzato M., Pavoni B., Ghirardini A.V. & Ghetti P.F. (1998). Sediment toxicity
measured using Vibrio fischeri as related to the concentrations of organic
(PCBs, PAHs) and inorganic (metals, sulphur) pollutants. Chemosphere
36: 2949 - 2968.
SIMRIA (2002). Avaliação da Contaminação da Barrinha de Esmoriz.
International Report. Saneamento integrado dos municípios da Ria,
Aveiro, Portugal.

References
64
Soares S., Cativa I., Moreira-Santos M., Soares A. M. V. M. and Ribeiro R.
(2005). A short-term sub-lethal in situ sediment assay with Chironomus
riparius based on postexposure feeding. Archives of Environmental
Contamination and Toxicology 49: 163 - 172.
Stuijfzand S.C., Helms M., Kraak M.H.S. & Admiraal W. (2000). Interacting
effects of toxicants and organic matter on the midge Chironomus riparius
in polluted river water. Ecotoxicology and Environmental Safety 46: 351 -
356.
Tuikka A.I., Schmitt C., Höss S., Bandow N., Von der Ohe P.C., De Zwart D.,
De Deckere E., Streck G., Mothes S., Van Hattum B., Kocan A., Brix R.,
Brack W., Barceló D., Sormunen A.J. & Kukkonen J.V.K. (2011). Toxicity
assessment of sediments from three European river basins using a
sediment contact test battery. Ecotoxicology and Environmental Safety 74:
123 - 131.
Van Donk E., Faafeng B.A., Hessen D.O. & Källqvist T. (1993). Use of
immobilized algae for estimating bioavailable phosphorus released by
zooplankton. Journal of Plankton Research 15: 761 - 769.
Wang F., Leung A.O.W., Wu S.C., Yang M.S. & Wong M.H. (2009). Chemical
and ecotoxicological analyses of sediments and elutriates of contaminated
rivers due to e-waste recycling activities using a diverse battery of
bioassays. Environmental Pollution 157: 2082 - 2090.
Wolska L., Sagajdakow A., Kuczyńska A. & Namieśnik J. (2007). Application of
ecotoxicological studies in integrated environmental monitoring:
Possibilities and problems. Trends in Analytical Chemistry 26: 332 - 344.