analiendivalentionrevealsamajorroleforca2 ... · sured at 380 nm wavelength and at the isos-bestic...
TRANSCRIPT
Cellular/Molecular
An Alien Divalent Ion Reveals a Major Role for Ca2�
Buffering in Controlling Slow Transmitter Release
Norbert Babai,1 X Olexiy Kochubey,1 Daniel Keller,2 and Ralf Schneggenburger1
1Laboratory of Synaptic Mechanisms, Brain Mind Institute, School of Life Science, Ecole Polytechnique Federale de Lausanne, 1015 Lausanne, Switzerland,and 2Blue Brain Project, Brain Mind Institute, School of Life Science, Ecole Polytechnique Federale de Lausanne, 1015 Lausanne, Switzerland
Ca 2�-dependent transmitter release occurs in a fast and in a slow phase, but the differential roles of Ca 2� buffers and Ca 2� sensors inshaping release kinetics are still controversial. Replacing extracellular Ca 2� by Sr 2� causes decreased fast release but enhanced slowrelease at many synapses. Here, we established presynaptic Sr 2� uncaging and made quantitative Sr 2�- and Ca 2�-imaging experimentsat the mouse calyx of Held synapse, to reveal the interplay between Ca 2� sensors and Ca 2� buffers in the control of fast and slow release.We show that Sr 2� activates the fast, Synaptotagmin-2 (Syt2) sensor for vesicle fusion with sixfold lower affinity but unchanged highcooperativity. Surprisingly, Sr 2� also activates the slow sensor that remains in Syt2 knock-out synapses with a lower efficiency, and Sr 2�
was less efficient than Ca 2� in the limit of low concentrations in wild-type synapses. Quantitative imaging experiments show that thebuffering capacity of the nerve terminal is markedly lower for Sr 2� than for Ca 2� (�5-fold). This, together with an enhanced Sr 2�
permeation through presynaptic Ca 2� channels (�2-fold), admits a drastically higher spatially averaged Sr 2� transient compared withCa 2�. Together, despite the lower affinity of Sr 2� at the fast and slow sensors, the massively higher amplitudes of spatially averaged Sr 2�
transients explain the enhanced late release. This also allows us to conclude that Ca 2� buffering normally controls late release andprevents the activation of the fast release sensor by residual Ca 2�.
Key words: calcium buffering capacity; calcium sensor; endogenous fixed buffer; slow release sensor; strontium; synaptotagmin
IntroductionCa 2�-dependent transmitter release is a fundamental signalingprocess for fast information transfer between neurons. Releasecan be separated into a fast phase with a brief duration (�1 ms),followed by a slower phase of up to hundreds of milliseconds.There is good evidence that the fast phase of release is mediatedby a rapidly acting Ca 2� sensor with a high Ca 2� cooperativity,requiring the binding of �4 –5 Ca 2� ions before vesicle fusionoccurs (Dodge and Rahamimoff, 1967; Goda and Stevens, 1994;Bollmann et al., 2000; Schneggenburger and Neher, 2000).Synaptotagmin-1 (Syt1) functions as the Ca 2� sensor for fastrelease at mouse forebrain synapses and in Drosophila (Geppert etal., 1994; Fernandez-Chacon et al., 2001; Yoshihara and Littleton,2002; Pang et al., 2006). Synaptotagmin-2 (Syt2) plays a homol-ogous role as a Ca 2� sensor mediating the steeply Ca 2�-dependent component of release at a large hindbrain synapses,the calyx of Held (Pang et al., 2006; Sun et al., 2007; Kochubeyand Schneggenburger, 2011).
For the slow phase of release, the underlying mechanisms areless clear. Slow release is driven by the spatially averaged [Ca 2�]i,which, because of its slower decay (�50 ms), can summate dur-ing repeated AP activity. Relating slow release to the measured[Ca 2�]i values in the nerve terminal has shown low apparentCa 2� cooperativities (Delaney and Tank, 1994; Xu-Friedmanand Regehr, 2000; Angleson and Betz, 2001), but nonlinear de-pendencies have been found in other synapses (Ravin et al., 1997;Kirischuk and Grantyn, 2003). Experiments at the calyx synapsehave shown that release ��2 �M is caused by a more linearlyacting Ca 2� sensor (Lou et al., 2005) that remains in Syt2 KOmice (Sun et al., 2007; Kochubey and Schneggenburger, 2011).
A characteristic feature of fast and slow release is their differ-ential modulation when Ca 2� is exchanged by Sr 2�, whichcauses decreased fast release, but increased slow release (Miledi,1966; Goda and Stevens, 1994; Rumpel and Behrends, 1999; Xu-Friedman and Regehr, 2000). One study has postulated that Sr 2�
preferentially activates a slow release sensor (Goda and Stevens,1994). Another study, using imaging of axonal Ca 2� and Sr 2�
transients, showed that Sr 2� transients were higher than Ca 2�
transients and that Sr 2� decayed more slowly (Xu-Friedman andRegehr, 1999). They concluded that the differences in releasewere caused by the slower removal of Sr 2� from the nerve termi-nal (Xu-Friedman and Regehr, 2000). Nevertheless, the absolutevalues of spatially averaged [Sr 2�]i transients have remained un-known; similarly, quantitative values of the buffering capacity ofcells for Sr 2� ions are missing. Because there is good agreementthat late release is strongly influenced by Ca 2� buffering (see
Received May 16, 2014; revised July 11, 2014; accepted July 30, 2014.Author contributions: N.B., O.K., and R.S. designed research; N.B., O.K., and D.K. performed research; D.K. con-
tributed unpublished reagents/analytic tools; N.B., O.K., and R.S. analyzed data; N.B., O.K., and R.S. wrote the paper.This work was supported by Swiss National Science Foundation 31003A_138320/1 to R.S. We thank Heather
Murray for expert technical assistance, and Erwin Neher for discussing a previous version of the manuscript.The authors declare no competing financial interests.Correspondence should be addressed to Dr. Ralf Schneggenburger, Laboratory of Synaptic Mechanisms, Brain
Mind Institute, School of Life Science, Ecole Polytechnique Federale de Lausanne, 1015 Lausanne, Switzerland.E-mail: [email protected].
DOI:10.1523/JNEUROSCI.1990-14.2014Copyright © 2014 the authors 0270-6474/14/3412622-14$15.00/0
12622 • The Journal of Neuroscience, September 17, 2014 • 34(38):12622–12635

above for references), we argue that quantitative measurementsof alien divalent ion buffering, and sensor activation with presyn-aptic Sr 2� and Ca 2� uncaging, should yield significant new in-sights into how Ca 2� buffering and Ca 2� sensor activationnormally shape fast and slow release.
Materials and MethodsSlice preparation and electrophysiology. Acute brainstem slices at the levelof MNTB were prepared as described previously (von Gersdorff et al.,1997), using C57BL/6J mice at postnatal days (P) 10 –15, or Syt2 �/� mice(Pang et al., 2006) bred on a C57BL6 background, at P12-P15. Mice ofeither sex were used throughout. Procedures of mouse breeding, hand-ling, and killing before slice preparation were approved by the Veterinaryoffice of the Canton of Vaud, Switzerland. Single or paired whole-cellrecordings were made from MNTB principal neurons and/or calyces ofHeld nerve terminals at room temperature (22°C–24°C), using an EPC-10/2 patch-clamp amplifier (HEKA Elektronik). Series resistances (5–30M� and 3– 8 M�) were compensated up to 50% and 83% in presynapticand postsynaptic recordings, respectively. The extracellular solutioncontained the following (in mM): 125 NaCl, 25 NaHCO3, 2.5 KCl, 1.25NaH2PO4, 25 glucose, 1 MgCl2, 0.4 ascorbic acid, 3 myo-inositol, and 2Na-pyruvate (all from Sigma-Aldrich/Fluka), continuously bubbled with95% O2/5% CO2 (pH 7.4; 310 mosm), to which either 2 mM CaCl2 or 2mM SrCl2 was added. During the afferent fiber stimulation experiments(see Fig. 2), 10 �M bicuculline methochloride (Biotrend) and 2 �M
strychnine (Sigma) were added to suppress inhibitory synaptic currents.Afferent fibers were stimulated using a custom-built platinum/iridiumbipolar electrode placed at the midline of the brainstem slice, with 2–10 Vpulses of 0.1 ms length from an isolated stimulator (A-M Systems, model2100). During paired recordings, the following chemicals were added tothe extracellular solution: 10 mM tetraethylammonium chloride (TEA,Sigma), 1 �M TTX, 50 �M D-AP5, 2 mM �-D-glutamylglycine, and 100 �M
cyclothiazide (all from Biotrend). The postsynaptic pipette solution con-tained the following (in mM): 130 Cs-gluconate, 20 TEA, 10 HEPES, 5Na2-phosphocreatine, 4 MgATP, 0.3 Na2GTP, 5 EGTA (pH 7.2 adjustedwith CsOH). The presynaptic pipette solution for double recordingswithout imaging (see Fig. 3) was identical, except for a reduced concen-tration of EGTA (100 �M). The presynaptic intracellular solution fordivalent ion uncaging and imaging experiments, referred to as “imagingsolution” below, contained the following (in mM): 130 Cs-gluconate, 20TEA, 20 HEPES, 5 Na2ATP, 0.3 Na2GTP (pH 7.2 adjusted with CsOH).To this, 1.5 or 1 mM DM-Nitrophen (DMN, Merck Chemicals), CaCl2 orSrCl2 to achieve 90% loading, and/or 100 �M of a fura2-like indicatorwere added.
Quantitative presynaptic divalent imaging and uncaging. We estab-lished presynaptic quantitative Sr 2� uncaging by using DMN (Ellis-Davies, 2003) and ratiometric fura-2 and fura-4F indicators (Invitrogen)for postflash [Sr 2�]i imaging (see Figs. 4 and 5). Titration experimentswith 100 �M fura-2 to measure free Sr 2� (data not shown) gave a Kd
value for Sr 2� binding to DMN of 160 nM (Table 1; �40 times higherthan for Ca 2�). Fura-2 and fura-4F were calibrated for Sr 2� binding inthe presence of DMN (1.5 mM) using a 5-point calibration procedure(Fig. 1). For this, suitable free Sr 2� concentrations were set by mixturesof SrCl2 with CDTA, EGTA, or HEDTA using published Sr 2� affinitiesfor these buffers (Martell and Smith, 1974) (Table 1), in the presence of
100 �M fura-4F and 1.5 mM DMN. Fluorescence spectra were then mea-sured in the experimental setup using the same optical path and excita-tion parameters as in Sr 2� uncaging experiments, using 50 �m pathlength borosilicate glass capillaries (VitroCom). Figure 1 shows an exam-ple for Sr 2� calibration of fura4F, revealing a Kd of 31.9 �M. In all cali-brations, at least one Sr 2� concentration was determined by twoindependent buffers (in the example of Fig. 1, EGTA and HEDTA for afree [Sr 2�] close to 20 �M). All calibrations for Ca 2� and Sr 2� wereperformed using the imaging solution supplemented with 100 �M of thefura2-like dye, 1.5 mM DMN, and CaCl2 or SrCl2 DMN as appropriate.The amount of CaCl2 or SrCl2 to be added was calculated based on ourestimates of the DMN stock purity (usually �65%).
For presynaptic Ca 2� and Sr 2� uncaging experiments, a xenon arcflash lamp (SP-20, Rapp OptoElectronic) with 395 nm short-pass filterwas used to generate short (0.4 – 0.5 ms half-width) UV light flashes toinduce DMN photolysis. The flashlight was fiber-coupled into the mi-croscope together with the light from a monochromator (PolychromeIV, TILL Photonics) using an 85%/15% beamsplitter (TILL Photonics),and the flash intensity was modulated by neutral density filters (RappOptoElectronic). For imaging postflash [Ca 2�]i and [Sr 2�]i followingweak flashes, we used fura-2, whereas fura-2FF (TEFLabs) or fura-4F wasused for stronger flashes for Ca 2� and Sr 2�, respectively (see Fig. 4C;Table 1). Ratiometric measurements of preflash and postflash [Ca 2�]i
and [Sr 2�]i were made using alternating 5 ms excitation light pulses fromthe monochromator at 380 and 350 nm. In Sr 2� uncaging experiments,the extracellular solution contained 2 mM SrCl2 (no added CaCl2), toavoid the possibility of Ca 2� leak into the presynaptic cell. When DMNwas used without added Sr 2� or Ca 2� in the presence of 2 mM extracel-lular Sr 2�, neither ratiometric changes nor release responses were ob-served upon full intensity flashes (n � 3 cells). This suggests that theseresponses were caused by Sr 2� release from DMN and not by a possibleCa 2� contamination.
Presynaptic buffered loading of divalent ions. To measure the divalention sensitivity of release close to the resting concentrations of Ca 2� orSr 2� (see Fig. 6), we loaded calyx nerve terminals with buffered Ca 2� orSr 2� solutions in paired presynaptic and postsynaptic recordings (Lou etal., 2005). For Sr 2�, we used 0.3, 1.6, and 5 mM SrCl2 mixed with 10 mM
CDTA and 100 �M fura-2 in the imaging solution, giving nominal free[Sr 2�] values of 0.14, 0.83, and 4.3 �M, respectively. For Ca 2�, we usedbuffered solutions with 10 mM EGTA and nominal [Ca 2�] of 0.12, 0.31,and 0.85 �M. The effective presynaptic [Ca 2�]i and [Sr 2�]i was imagedcontinuously during the recording using fura-2 ratio measurements ev-ery 5 s, and the mEPSC frequency was simultaneously sampled by thepostsynaptic recording.
Measurements of presynaptic Ca2� and Sr2� buffering capacity. Formeasuring the endogenous Sr 2� buffering capacity, �S(Sr) (see Fig. 7),we attempted to compete with endogenous buffers by adding bufferingcapacity of the indicator dye (�B) during the loading phase of whole-cellrecordings (Neher and Augustine, 1992). To do so, we used 75 and 200�M of the high-affinity indicator fura-2 for the determination of �S forCa 2� and Sr 2�, respectively. At these concentrations and consideringthe binding affinities of fura-2 for Ca 2� and Sr 2� (Table 1), fura-2 willattain final �B values of �350 for Ca 2� and �50 for Sr 2�. Measurementsof �S were then performed as described previously (Neher and Augus-tine, 1992; Helmchen et al., 1997), using repeated presynaptic depolar-
Table 1. Sr 2� binding affinities of buffers, indicators, and photolyzable chelators used in this study
Buffer Kd , Ca 2� Kd , Sr 2� Source Factor Sr 2�/Ca 2�
CDTA 0.011 �M 4.4 �M Martell and Smith, 1974 400EGTA 0.15 �M 35 �M Martell and Smith, 1974 233HEDTA 2.5 �M 62 �M Martell and Smith, 1974 25ATP 214 �M 724 �M Wilson and Chin, 1991 3.4fura-2 0.22 � 0.007 �M (n � 3) 4.8 � 0.22 �M (n � 7) Calibration 22fura-4F 1.1 �M 32 � 0.7 �M (n � 3) Calibration 28fura-6F 8.4 �M 134 �M Calibration 16fura-2FF 6.1 �M — CalibrationDMN 0.005 �M 0.160 �M Calibration 44
Babai et al. • Ca2� Buffering and Slow Transmitter Release J. Neurosci., September 17, 2014 • 34(38):12622–12635 • 12623

izations of 3 ms to 0 mV (see Fig. 7 A, B). Fura-2ratios in response to depolarizations were mea-sured at 380 nm wavelength and at the isos-bestic wavelengths, which were 357 and 362nm for Ca 2� and Sr 2�, respectively, using al-ternating 5 ms monochromator light pulses.For the determination of �S (Sr), 2 mM extra-cellular Sr 2� was present throughout theexperiment. The offline analysis started by ex-tracting the ratio F380/F357 (or F380/F362) fol-lowing suitable background correction. Ratiotraces were then converted to [Ca2�]i or [Sr2�]i
according to the equation of Grynkiewicz et al.(1985), using experimentally determined calibra-tion constants Rmin, Rmax, and Keff. Endogenousbuffering capacity (�S) and extrusion rates (�) forCa2� and Sr2� were estimated similarly as de-scribed before for Ca2� (Neher and Augustine,1992; Helmchen et al., 1997).
Imaging of physiological Ca2� and Sr2� tran-sients. For the experiments in Figure 8, we usedthe lowest-affinity Ca 2� indicator practical forratiometric measurements, fura-6F (Invitro-gen). Given the Kd values of fura-6F for Ca 2�
and Sr 2� (Table 1), 100 �M fura-6F corre-sponds to �B values of �12 for Ca 2� and � 1for Sr 2�. Because these values are severalfoldsmaller than the cellular buffering capacities �S
for each ion (see Fig. 7), fura-6F does notsignificantly influence the kinetics of Sr 2�
and Ca 2� transients. Ratiometric measure-ments were made before, during, and aftertrains of 50 AP-like presynaptic depolariza-tions (1 ms to 45 mV at 100 Hz), using alter-nating 10 ms pulses of monochromator light at380 and 350 nm at repetition rates of initially 8Hz and then 41 Hz to follow fast changes of[Ca 2�]i or [Sr 2�]i (see Fig. 8). Fluorescenceratio traces were converted into [Ca 2�]i or[Sr 2�]i time courses as explained above. Theextracellular recording solution contained 1�M TTX and 10 mM TEA.
Data analysis. Data analysis was done usingcustom-written routines in IgorPro 6.2 (WaveM-etrics). Spontaneous mEPSC events were de-tected using a semiautomatic routine with atemplate-matching algorithm (Clements andBekkers, 1997). EPSC deconvolution followedthe methods introduced by Neher and Sakaba(2001), as described previously (Wolfel et al.,2007). The quantal size for deconvolutionwas set by the average mEPSC amplitude de-termined in each cell. Release rates were corrected for the predicted“spillover” current estimated using “template” protocols, which con-sisted of a few presynaptic depolarizations of different length appliedat the beginning of paired recordings (Neher and Sakaba, 2001). Incase of Syt2 �/� recordings, template protocols were not helpful be-cause of the absence of synchronous release; thus, the strength ofresidual current � was set to values between 10 and 20, similar to thoseobserved in control synapses from the same age group. The cumula-tive release rate traces after uncaging were fitted with single-exponential, exponential plus line, double-exponential, double-exponential plus line, and triple-exponential functions with a fitroutine (Wolfel et al., 2007; Kochubey et al., 2009). In wild-typesynapses with uncaging steps 4 �M [Ca 2�]i or �15 �M [Sr 2�]i,
the best fits usually contained two exponential components (see Fig.4 A, B, bottom; and Fig. 4E, open and closed symbols). In Syt2 �/�, thebest fit was usually monoexponential and much slower (�200 ms; seeFig. 5A, bottom).
Data are reported as mean � SEM, unless indicated. Paired or un-paired Student’s t tests, as appropriate, were used to assess statisticalsignificance.
Model calculations. We modeled the Ca 2� and Sr 2� sensitivity oftransmitter release obtained from uncaging experiments with the “2-sensor model” (see Fig. 4F ) (Sun et al., 2007), or with an allosteric modelof Ca 2� binding and vesicle fusion (Lou et al., 2005). For fitting the Ca 2�
and Sr 2� uncaging data in Syt2 �/� synapses (see Fig. 5), we assumed thatrelease can be described by a slow sensor with a single divalent ion bind-ing site (see Fig. 5F ). The set of differential equations corresponding toeach model was solved numerically with the fourth- or fifth-orderRunge-Kutta method in IgorPro, calculating the accumulation into thevarious fused states for a series of Ca 2� and Sr 2� steps. Ca 2� and Sr 2�
steps decayed by 30% per 100 ms similar to observed steps (see Fig.4 A, B). We derived the release rate traces by differentiation of the simu-lated cumulative release traces and then analyzed the peak release rate,release delay (time to release of 5 vesicles), and release time constants.
Figure 1. Example of a Sr 2� calibration measurement of fura-4F. A, Excitation spectra of fura-4F experimentally obtained in aset of buffered Sr 2� calibration solutions. Each curve is the average of three repetitions. B, The same set of spectra after normal-ization to the isosbestic point (dashed lines; 362 nm). For each [Sr 2�], the fluorescence decrement at 380 nm was divided by itsmaximal value (indicated by the arrow) to calculate the Sr 2�-bound fura-4F fraction. C, Sr 2�-bound fraction of fura-4F as afunction of free Sr 2� concentration (symbols). The fit with a Michaelis–Menten function (line) yielded Kd � 31.9 �M. Note thatfura-4F binding affinity to Sr 2� is much lower than that for Ca 2� (�1.1. �M; Table 1). D, The solutions with the lowest andhighest [Sr 2�] and a 24 �M [Sr 2�]free solution buffered with high HEDTA were used to determine the calibration parameters Rmin,Rmax, and Keff for the ratiometric determination of pre- and postflash [Sr 2�]i. Shown are the fura-4F fluorescence ratios measuredin vitro at 350 and 380 nm excitation, using the same illumination protocol as in the presynaptic Sr 2� uncaging experiments. Eachdata point is an average of three repetitions. E, Table summarizing the content of Sr 2� calibration solutions. For calculating free[Sr 2�], 1.5 mM DMN, 100 �M fura-4F, and 5 mM ATP contained in the solutions were considered in addition to the specified buffer,using the dissociation constants listed in Table 1. F, Preflash and postflash values of the fura-4F calibration ratios Rmin, Rmax,and R24�M, and of the third calibration parameter Keff calculated from the three calibration ratios, assuming DMN photolysisefficiency of 80%.
12624 • J. Neurosci., September 17, 2014 • 34(38):12622–12635 Babai et al. • Ca2� Buffering and Slow Transmitter Release

The Ca 2� and Sr 2� sensitivities of peak release rate, release delay, andfast component of the release time constants were then globally fitted bythe 2-sensor model (see Figs. 4C–E; Fig. 6B). We lowered the Ca 2� andSr 2� binding affinities of the slow release sensor relative to the valuesfound in Syt2 KO measurements (see Fig. 5), to account for “clamping”of the slow sensor by Syt2 in wild-type synapses (Table 2). The back-calculation of local [Ca 2�]i and [Sr 2�]i signals evoked by a single AP (seeFig. 9) was done as described previously (Kochubey et al., 2009).
The stochastic model of divalent ion influx and buffering (see Fig. 9E)was performed by the Monte Carlo simulator M-Cell (Kerr et al., 2008).The total simulated volume was a cube measuring 0.6 0.6 1.2 �m.The Sr 2� current through single Ca 2� channels was scaled to a factor of1.8 that of Ca 2� flux (see Fig. 3); the Ca 2� current was 0.12 pA at 0 mV.Ca 2� channels were modeled using a Hodgkin–Huxley model (Borst andSakmann, 1998) driven by an action potential with a half-width of 0.49ms. We assumed the presence of the following buffers, with on-rates(kon) and off-rates (koff) for Ca 2� and Sr 2�, respectively: (1) an endog-enous immobile (“fixed”) Ca 2� buffer; kon 1 10 8 and 4 10 7
M�1s �1
and koff 1000 and 2500 s �1. The Kd values of the endogenous immobilebuffer for Ca 2� and Sr 2� were 10 and 62.5 �M, respectively, achieved byusing a 0.4-fold lower kon and a 2.5-fold higher koff for Sr 2� comparedwith Ca 2�. Given the concentration of the buffer (400 �M), this corre-sponds to cellular buffer capacities �S of 40 and 6.4 for Ca 2� and Sr 2�,respectively, close to the experimentally observed values (see Fig. 7). (2)ATP was present as a mobile Ca 2� buffer (Naraghi and Neher, 1997) at aconcentration of 2 �M; kon 5 10 8/5 10 8
M�1s �1 (for Ca 2�/Sr 2�,
respectively), koff 45,000/152,242 s �1. The lower affinity for Sr 2� was asfound in previous experiments (Wilson and Chin, 1991) (Table 1). ATPalso bound Mg 2� with kon of 5 10 8
M�1s �1 and koff of 22,500 s �1; free
[Mg 2�] was 300 �M. The diffusion constant of free Sr 2� was 2.2 10 �6
cm 2/s, and the basal free [Sr 2�] was 100 nM.
ResultsSr 2� decreases AP evoked release probability but increaseslate asynchronous releasePrevious studies have shown that phasic release during the pre-synaptic AP is reduced in the presence of Sr 2�, whereas a latephase of release is increased (Miledi, 1966; Goda and Stevens,1994; Rumpel and Behrends, 1999; Xu-Friedman and Regehr,1999). Here, we used the ideal presynaptic accessibility of thecalyx of Held synapse to perform direct measurements of theSr 2� sensitivity of release and of Sr 2� buffering, to gain newinsights into how Ca 2� buffering and Ca 2� sensor activationnormally shape fast and slow release. We started by investigatingthe effects of Ca 2� replacement by Sr 2� on fiber-stimulation-evoked EPSCs. We used brief 100 Hz trains of 50 stimuli to studyboth AP-evoked fast release during the train and late asynchro-
nous release after the train (Fig. 2A1, A2). When the extracellularCa 2� was switched to Sr 2� (2 mM each), the first EPSC during100 Hz trains was strongly reduced, from 20.4 � 0.4 nA to 5.2 �0.5 nA (Fig. 2A,B; n � 5 cells; p � 0.01). The relative speed ofdepression was reduced (Fig. 2B), which is likely a consequence ofa lower release probability prel in the presence of Sr 2�. To quan-tify prel, we estimated the size of the readily releasable pool usinghigh-frequency stimulation trains and cumulative EPSC ampli-tude plots (Fig. 2B) (Schneggenburger et al., 1999). The pool sizewas slightly, but significantly, decreased in the presence of Sr 2�
(�20%; Fig. 2C; p � 0.05). Dividing the first EPSC amplitude bythe readily releasable pool showed that prel was strongly reducedin the presence of Sr 2� (Fig. 2C; p � 0.001). The cumulativeEPSC amplitude plots also showed a reduced late slope, whichcorresponds to a reduced EPSC amplitude between the 30th and50th stimuli (Fig. 2B, C). This could indicate a reduced Ca 2�-dependent readily releasable pool recovery in the presence ofSr 2� (Wang and Kaczmarek, 1998; Sakaba and Neher, 2001),which was not further analyzed here. Together, replacing Ca 2�
with Sr 2� decreased the EPSC amplitude, an effect that wascaused by a reduced prel.
We next analyzed the late asynchronous release following the100 Hz trains (Fig. 2A2). Late release, measured as mEPSC fre-quency, was significantly enhanced during the first 1 s intervalafter the train (2 mM Ca 2�, 20.5 � 6.8 Hz; 2 mM Sr 2�; 143.5 �11.8 Hz; p � 0.01). During the second and third 1 s time intervals,release was still enhanced, although the difference was smaller (Fig.2A2 bottom; p � 0.05 for both comparisons). This reveals a dif-ferential effect of Ca 2� replacement by Sr 2�, with less phasic butenhanced late asynchronous release, as shown previously at othersynapses.
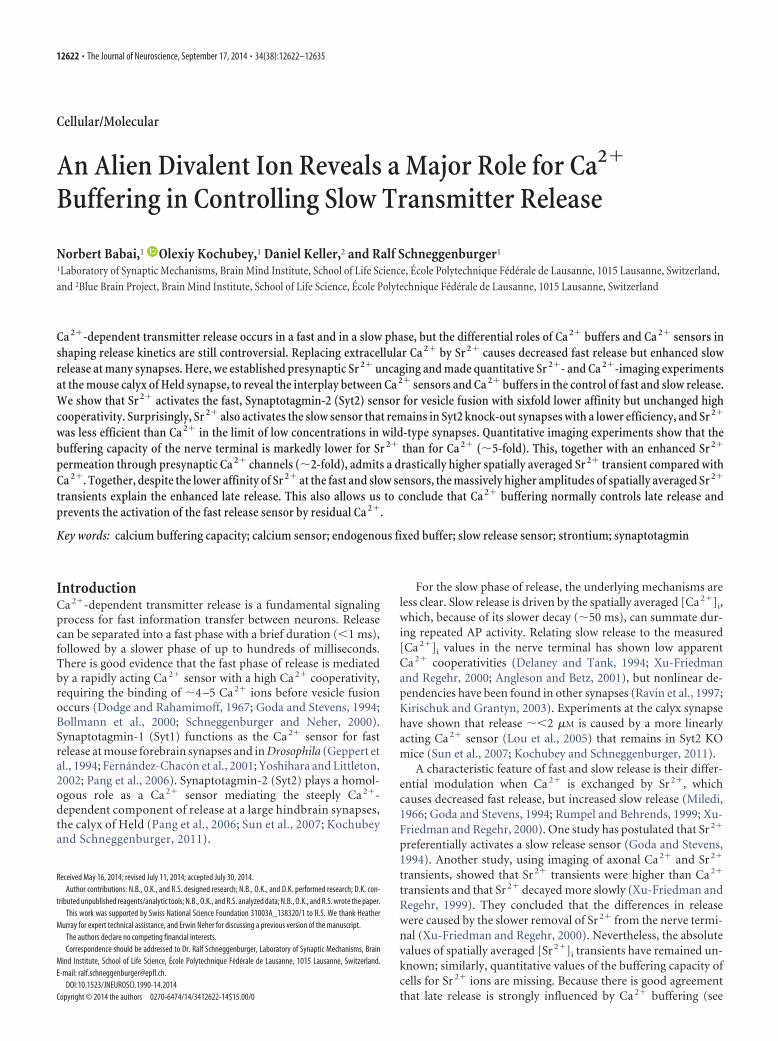
Sr 2� decreases fast release rates despite carrying largercurrents through Ca 2� channelsWe next wished to investigate the mechanism that underlies thelower efficiency of extracellular Sr 2� in activating fast transmitterrelease. Using paired presynaptic and postsynaptic whole-cell re-cordings, we found that Sr 2� currents through presynapticvoltage-gated Ca 2� channels were increased (Fig. 3A), suggestingthat Sr 2� is a better charge carrier than Ca 2� (Hagiwara andOhmori, 1982). Despite the higher Sr 2� currents, pool-depleting50 ms depolarizations caused smaller EPSCs, and deconvolution ofEPSCs showed that peak release rates were smaller in the presenceof Sr 2� (Fig. 3A, bottom, B). Fitting the cumulative release rateswith double-exponential functions, we also found that the num-ber of vesicles released in the fast phase was reduced, and the fastrelease time constant was slowed from an average value of 1.3 msto �2.3 ms (Fig. 3C; p � 0.01 for both comparisons). These datashow that, despite an increased flux of Sr 2� through Ca 2� chan-nels, the fast release component in response to presynaptic depo-larizations was activated less efficiently by Sr 2� than by Ca 2�.
Sr 2� activates the fast release sensor with sixfold lowerefficiency than Ca 2�
We next wished to investigate the mechanisms that underlie alower efficiency of extracellular Sr 2� in activating fast release.Because Sr 2� permeates more readily through Ca 2� channels(factor of �1.8-fold; see Fig. 3B), the microdomain intracellularSr 2� concentration attained close to open Ca 2� channels shouldbe higher in the presence of Sr 2� than Ca 2�, as we will also showbelow (see Fig. 9). Therefore, Sr 2� might activate the Ca 2� sensor
Table 2. Parameters of the 2-sensor model fitted to the Sr 2� and Ca 2� uncagingdata in wild-type synapse
Ca 2� Sr 2� Factor Sr 2�/Ca 2�
Fast sensorkon (M
�1s �1) 2.6 10 8 1.2 10 8 0.46koff (s �1) 6808 19,000 2.79Kd (koff /kon ) 26 �M 158 �M 6.07�F (s �1) 6900 6900 1b (cooperativity factor) 0.5 0.5 1No. of sites 5 5 1
Slow sensork� (M
�1s �1) 1.5 10 5 0.5 10 5 0.33k� (s �1) 323 520 1.61Kd (koff /kon ) 2.1 mM 10.4 mM 4.95�S (s �1) 28.5 28.5 1No. of sites 1 1 1
Spontaneous release�0 (s �1) 5.8 10 �4 5.8 10 �4 1
Babai et al. • Ca2� Buffering and Slow Transmitter Release J. Neurosci., September 17, 2014 • 34(38):12622–12635 • 12625

for fast release significantly less efficientlythan Ca 2�, a likely possibility that, how-ever, has never been tested directly.
To study the intracellular Sr 2� sensi-tivity of transmitter release, we next estab-lished Sr 2� uncaging experiments at thecalyx of Held synapse. This required anaccurate calibration of all involved fura2-like Ca 2� indicators and of DMN for Sr 2�
(see Materials and Methods; Fig. 1). Forall chelators and indicators calibratedhere, we found lower affinities for Sr 2�
than for Ca 2� (Table 1) (Xu-Friedmanand Regehr, 1999). The low affinity offura-4F for Sr 2� (�31 �M) turned out tobe very useful for imaging [Sr 2�]i in therange of 20 –100 �M, following Sr 2� un-caging pulses. Figure 4A shows an exam-ple of a paired recording with 1.5 mM
DMN (90% loaded with Sr 2�) and 0.1mM fura-4F in the presynaptic patch pi-pette. A full intensity flash led to a [Sr 2�]i
elevation of �50 �M; under similar con-ditions with 1.5 mM Ca 2�-loaded DMN,smaller rises in free [Ca 2�]i are observed(�10 –20 �M [Ca 2�]i; Fig. 4A,B). We at-tribute this difference to the significantlylower Sr 2� buffering capacity of the nerveterminal (see also below, Fig. 7). These ex-periments show the feasibility to controlpresynaptic [Sr2�]i in Sr2� uncaging exper-iments at a CNS nerve terminal.
Presynaptic Sr 2� uncaging experi-ments showed that, despite higher presyn-aptic [Sr 2�]i steps, EPSCs and peakrelease rates were smaller compared withCa 2� uncaging experiments (Fig. 4A,B),suggesting a lower efficiency of intracellu-lar Sr 2� at the Ca 2� sensor for vesicle fu-sion. Plotting the peak release rates as afunction of postflash [Ca 2�]i and [Sr 2�]i
indeed revealed a clear, �6-fold right-ward shift in the efficiency of Sr 2� in in-ducing transmitter release (Fig. 4C).Interestingly, the slopes in the steep partsof the double-logarithmic dose–responsecurves, determined by line fitting of thedata points in double-logarithmic space,were similar for Ca 2� and Sr 2� uncaging(3.42 � 0.37 and 3.50 � 0.24 over theranges 1–5 �M and 5–25 �M, respectively;error estimates are 95% confidence inter-val of the fits). Fits of the data with a mod-ified 2-sensor model of release (Sun et al.,2007) (Fig. 4F) or with an allosteric re-lease model (Lou et al., 2005) were consis-tent with an �6-fold rightward shift of theaffinity of Sr 2� binding to the fast sensor(Fig. 4C, solid and dashed lines, respectively). The Sr 2� data weredescribed well by 5 divalent ion binding sites and an unchangedcooperativity factor b (Table 2), in agreement with the finding ofunchanged slopes in double-logarithmic coordinates.
We next analyzed the kinetic components of release inducedby Sr 2� and Ca 2� uncaging to determine the kinetics of Sr 2�
binding to the fast release sensor. The release delays with Sr 2�
uncaging steps showed a clear rightward shift (Fig. 4D). Cumu-
Figure 2. Reduced fast release but increased asynchronous release upon substitution of extracellular Ca 2� with Sr 2�. A,Examples of afferent fiber stimulation-evoked train of EPSCs (A1; 50 APs, 100 Hz) recorded initially in the presence of 2 mM externalCa 2� (black trace), and after replacing Ca 2� with Sr 2� (red trace). Stimulation artifacts were blanked. Current traces on the right(A2) show the late release activity during a 3 s interval, and corresponding mEPSC frequency plots. mEPSC frequency analysesbefore and after 100 Hz trains (A2, bottom), show that Sr 2� markedly increased the asynchronous release rate after the train (n �4 cells). The baseline mEPSC frequency before the train was not significantly changed in the presence of Sr 2� ( p � 0.34). In thisandallsubsequentfigures,blackandredtracesanddatasymbolsrepresentsdataobtainedinthepresenceofCa 2�andSr 2�, respectively.*p�0.05.**p�0.01. B,PlotsofpeakEPSCamplitudes(top)andcumulativeEPSCs(bottom)asafunctionofstimulusnumberduring100Hz trains, both in the presence of 2 mM Ca 2� and after switching the extracellular solution to 2 mM Sr 2�. Back-extrapolation of line fits tothe late part of the cumulative EPSC plot indicates approximately similar pool size, despite a different late slope. Dividing the first EPSCamplitude by the pool size provides an estimate for initial release probability (prel). C, Individual and average values for the first EPSCamplitude; pool size; prel; and the late slope, each in the presence of 2 mM Ca 2� or Sr 2�. Note that the decreased first EPSC amplitude (by�75%) is, to a large part, explained by the decreased prel (�60% relative decrease; p � 0.001). *p � 0.05. ***p � 0.001.
12626 • J. Neurosci., September 17, 2014 • 34(38):12622–12635 Babai et al. • Ca2� Buffering and Slow Transmitter Release
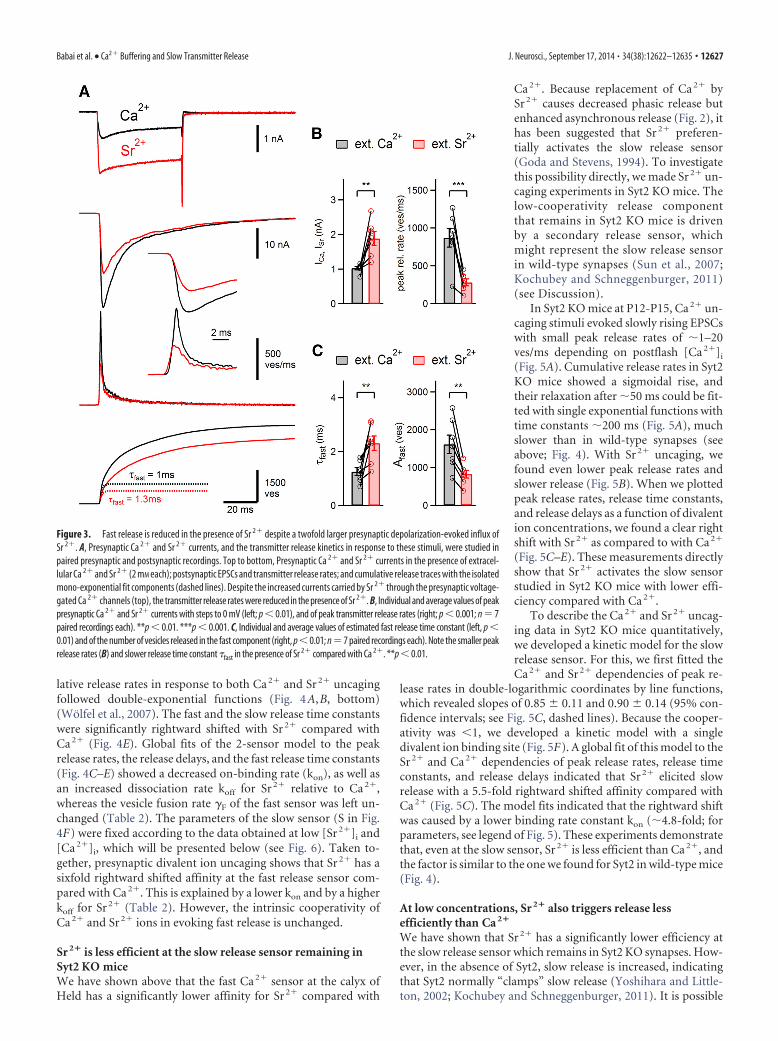
lative release rates in response to both Ca 2� and Sr 2� uncagingfollowed double-exponential functions (Fig. 4A,B, bottom)(Wolfel et al., 2007). The fast and the slow release time constantswere significantly rightward shifted with Sr 2� compared withCa 2� (Fig. 4E). Global fits of the 2-sensor model to the peakrelease rates, the release delays, and the fast release time constants(Fig. 4C–E) showed a decreased on-binding rate (kon), as well asan increased dissociation rate koff for Sr 2� relative to Ca 2�,whereas the vesicle fusion rate �F of the fast sensor was left un-changed (Table 2). The parameters of the slow sensor (S in Fig.4F) were fixed according to the data obtained at low [Sr 2�]i and[Ca 2�]i, which will be presented below (see Fig. 6). Taken to-gether, presynaptic divalent ion uncaging shows that Sr 2� has asixfold rightward shifted affinity at the fast release sensor com-pared with Ca 2�. This is explained by a lower kon and by a higherkoff for Sr 2� (Table 2). However, the intrinsic cooperativity ofCa 2� and Sr 2� ions in evoking fast release is unchanged.
Sr 2� is less efficient at the slow release sensor remaining inSyt2 KO miceWe have shown above that the fast Ca 2� sensor at the calyx ofHeld has a significantly lower affinity for Sr 2� compared with
Ca 2�. Because replacement of Ca 2� bySr 2� causes decreased phasic release butenhanced asynchronous release (Fig. 2), ithas been suggested that Sr 2� preferen-tially activates the slow release sensor(Goda and Stevens, 1994). To investigatethis possibility directly, we made Sr 2� un-caging experiments in Syt2 KO mice. Thelow-cooperativity release componentthat remains in Syt2 KO mice is drivenby a secondary release sensor, whichmight represent the slow release sensorin wild-type synapses (Sun et al., 2007;Kochubey and Schneggenburger, 2011)(see Discussion).
In Syt2 KO mice at P12-P15, Ca 2� un-caging stimuli evoked slowly rising EPSCswith small peak release rates of �1–20ves/ms depending on postflash [Ca 2�]i
(Fig. 5A). Cumulative release rates in Syt2KO mice showed a sigmoidal rise, andtheir relaxation after �50 ms could be fit-ted with single exponential functions withtime constants �200 ms (Fig. 5A), muchslower than in wild-type synapses (seeabove; Fig. 4). With Sr 2� uncaging, wefound even lower peak release rates andslower release (Fig. 5B). When we plottedpeak release rates, release time constants,and release delays as a function of divalention concentrations, we found a clear rightshift with Sr 2� as compared to with Ca 2�
(Fig. 5C–E). These measurements directlyshow that Sr 2� activates the slow sensorstudied in Syt2 KO mice with lower effi-ciency compared with Ca 2�.
To describe the Ca 2� and Sr 2� uncag-ing data in Syt2 KO mice quantitatively,we developed a kinetic model for the slowrelease sensor. For this, we first fitted theCa 2� and Sr 2� dependencies of peak re-
lease rates in double-logarithmic coordinates by line functions,which revealed slopes of 0.85 � 0.11 and 0.90 � 0.14 (95% con-fidence intervals; see Fig. 5C, dashed lines). Because the cooper-ativity was �1, we developed a kinetic model with a singledivalent ion binding site (Fig. 5F). A global fit of this model to theSr 2� and Ca 2� dependencies of peak release rates, release timeconstants, and release delays indicated that Sr 2� elicited slowrelease with a 5.5-fold rightward shifted affinity compared withCa 2� (Fig. 5C). The model fits indicated that the rightward shiftwas caused by a lower binding rate constant kon (�4.8-fold; forparameters, see legend of Fig. 5). These experiments demonstratethat, even at the slow sensor, Sr 2� is less efficient than Ca 2�, andthe factor is similar to the one we found for Syt2 in wild-type mice(Fig. 4).
At low concentrations, Sr 2� also triggers release lessefficiently than Ca 2�
We have shown that Sr 2� has a significantly lower efficiency atthe slow release sensor which remains in Syt2 KO synapses. How-ever, in the absence of Syt2, slow release is increased, indicatingthat Syt2 normally “clamps” slow release (Yoshihara and Little-ton, 2002; Kochubey and Schneggenburger, 2011). It is possible
Figure 3. Fast release is reduced in the presence of Sr 2� despite a twofold larger presynaptic depolarization-evoked influx ofSr 2�. A, Presynaptic Ca 2� and Sr 2� currents, and the transmitter release kinetics in response to these stimuli, were studied inpaired presynaptic and postsynaptic recordings. Top to bottom, Presynaptic Ca 2� and Sr 2� currents in the presence of extracel-lular Ca 2� and Sr 2� (2 mM each); postsynaptic EPSCs and transmitter release rates; and cumulative release traces with the isolatedmono-exponential fit components (dashed lines). Despite the increased currents carried by Sr 2� through the presynaptic voltage-gated Ca 2� channels (top), the transmitter release rates were reduced in the presence of Sr 2�. B, Individual and average values of peakpresynaptic Ca 2� and Sr 2� currents with steps to 0 mV (left; p � 0.01), and of peak transmitter release rates (right; p � 0.001; n � 7paired recordings each). **p � 0.01. ***p � 0.001. C, Individual and average values of estimated fast release time constant (left, p �0.01) and of the number of vesicles released in the fast component (right, p�0.01; n�7 paired recordings each). Note the smaller peakrelease rates (B) and slower release time constant �fast in the presence of Sr 2� compared with Ca 2�. **p � 0.01.
Babai et al. • Ca2� Buffering and Slow Transmitter Release J. Neurosci., September 17, 2014 • 34(38):12622–12635 • 12627
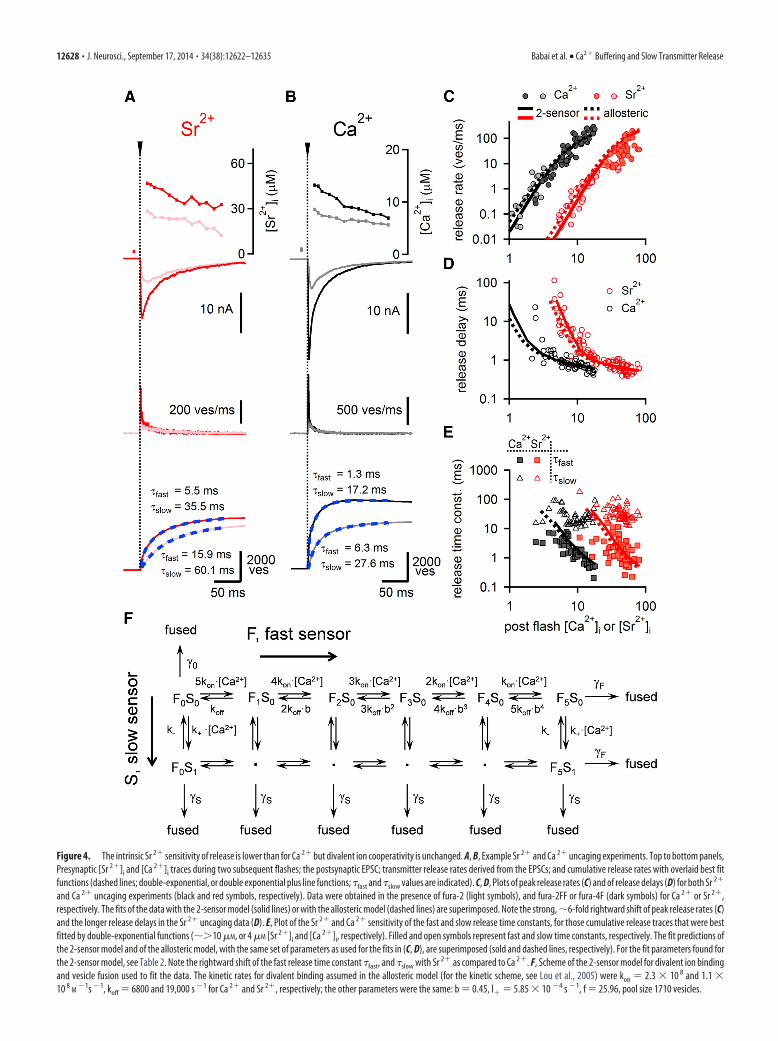
Figure 4. The intrinsic Sr 2� sensitivity of release is lower than for Ca 2� but divalent ion cooperativity is unchanged. A, B, Example Sr 2� and Ca 2� uncaging experiments. Top to bottom panels,Presynaptic [Sr 2�]i and [Ca 2�]i traces during two subsequent flashes; the postsynaptic EPSC; transmitter release rates derived from the EPSCs; and cumulative release rates with overlaid best fitfunctions (dashed lines; double-exponential, or double exponential plus line functions; �fast and �slow values are indicated). C, D, Plots of peak release rates (C) and of release delays (D) for both Sr 2�
and Ca 2� uncaging experiments (black and red symbols, respectively). Data were obtained in the presence of fura-2 (light symbols), and fura-2FF or fura-4F (dark symbols) for Ca 2� or Sr 2�,respectively. The fits of the data with the 2-sensor model (solid lines) or with the allosteric model (dashed lines) are superimposed. Note the strong, �6-fold rightward shift of peak release rates (C)and the longer release delays in the Sr 2� uncaging data (D). E, Plot of the Sr 2� and Ca 2� sensitivity of the fast and slow release time constants, for those cumulative release traces that were bestfitted by double-exponential functions (�10 �M, or 4 �M [Sr 2�]i and [Ca 2�]i, respectively). Filled and open symbols represent fast and slow time constants, respectively. The fit predictions ofthe 2-sensor model and of the allosteric model, with the same set of parameters as used for the fits in (C, D), are superimposed (sold and dashed lines, respectively). For the fit parameters found forthe 2-sensor model, see Table 2. Note the rightward shift of the fast release time constant �fast, and �slow with Sr 2� as compared to Ca 2�. F, Scheme of the 2-sensor model for divalent ion bindingand vesicle fusion used to fit the data. The kinetic rates for divalent binding assumed in the allosteric model (for the kinetic scheme, see Lou et al., 2005) were kon � 2.3 10 8 and 1.1 10 8
M�1s �1, koff � 6800 and 19,000 s �1 for Ca 2� and Sr 2�, respectively; the other parameters were the same: b � 0.45, l� � 5.85 10 �4 s �1, f � 25.96, pool size 1710 vesicles.
12628 • J. Neurosci., September 17, 2014 • 34(38):12622–12635 Babai et al. • Ca2� Buffering and Slow Transmitter Release

that the unclamped slow sensor in the absence of Syt2 has alteredCa 2�- or Sr 2�-binding properties. Therefore, we next measuredthe intracellular Sr 2� sensitivity of release in the low concentra-tion range in wild-type mice. Because train stimulation elevatesresidual divalent ion concentrations to the low micromolar range(see below; Fig. 8), understanding how Ca 2� and Sr 2� regulatevesicle fusion in this concentration range is immediately relevantto explain late asynchronous release following trains of APs.
We loaded presynaptic calyx of Held nerve terminals withSr 2�-buffered solutions using CDTA (10 mM) as a Sr 2� bufferand various concentrations of SrCl2, to achieve elevated levels ofpresynaptic [Sr 2�]i (see Materials and Methods). We then im-aged the spatially averaged [Sr 2�]i attained in calyces using 100�M Fura-2 while simultaneously measuring the rate of spontane-ous release (Fig. 6A) (Lou et al., 2005). These measurementsshowed that below �5 �M [Sr 2�]i, the slope in the double-logarithmic plot of release rate versus [Sr 2�]i progressively de-creased (Fig. 6B, pink square symbols), similarly as shownpreviously for Ca 2� (Lou et al., 2005; Sun et al., 2007). The Sr 2�
data fell below, and on the right of corresponding measurementswith Ca 2� (Fig. 6B, gray square symbols). At low concentrationsof each divalent ion in the range of 30 –100 nM, release ratesconverged to the resting spontaneous release frequency, which is�1 Hz at the calyx of Held. These data suggest that Sr 2� activatesthe slow release sensor in wild-type synapses with lower efficiencycompared with Ca 2�.
The data obtained in the range of low intracellular Ca 2� andSr 2� concentrations allowed us to fit the 2-sensor model to theCa 2� and Sr 2� datasets (Fig. 6B). We assumed that the slowsensor has a single divalent ion binding site, based on the slopevalue of �1 revealed in the Syt2 KO experiments (see above; Fig.5). Furthermore, for the fit of the wild-type data in Figure 6, we
had to introduce “clamping” of the slow sensor because Syt2suppresses the activation of the slow sensor (Kochubey andSchneggenburger, 2011). This was done by introducing an addi-tional factor to decrease the affinity of the slow sensor for bothCa 2� and Sr 2� in wild-type synapses (Fig. 6; for the model pa-rameters, see Table 2). The data and the fits clearly show that, inthe range of high divalent ion cooperativity, which is dominatedby Syt2, Sr 2� is �6-fold less efficient in triggering vesicle fusionthan Ca 2�. At lower divalent ion concentrations, this differencebecomes smaller; but at all concentrations down to �100 nM,Sr 2� is less efficient than Ca 2� in driving release.
Using the 2-sensor model with the fitted parameters, we couldpredict the contributions of release occurring without previousdivalent ion binding (spontaneous release), and release occurringafter occupancy of the slow and the fast release sensor (Fig. 6C).Surprisingly, this indicates that late release measured after 100 Hztrains in the presence of Sr 2� (Fig. 2; 150 Hz) might be carried bya larger relative activation of the fast sensor. This is because re-lease in the presence of extracellular Sr 2� extends more stronglyinto the steep part of the dose–response curve compared withCa 2� (Fig. 6B, broken lines) (see Discussion).
The intracellular buffering capacity for Sr 2� is severalfoldlower than for Ca 2�
Because Sr 2� is less efficient at both the fast and the slow releasesensors, the explanation for the significantly larger late release inthe presence of Sr 2� must lie in a higher rise of spatially averagedSr 2� compared with Ca 2�. This might be caused by inefficientintracellular buffering of Sr 2� ions and/or by a slower decay ofspatially averaged Sr 2�, as concluded previously (Xu-Friedmanand Regehr, 1999). However, quantitative information on howhigh spatially averaged Sr 2� rises in the nerve terminal, and on
Figure 5. Sr 2� is also less efficient at the slow sensor that remains at the calyx of Held synapses from Syt2 KO mice. A, B, Examples for Ca 2� and Sr 2� uncaging experiments with (top to bottom)postflash [Ca 2�]i and [Sr 2�]i transients, EPSCs, release rates, and cumulative release traces. The latter were fitted with single exponential functions with time constants (�) as indicated. C–E,Dependence of peak release rates (C), release time constants (D), and release delays (E) on postflash [Ca 2�]i and [Sr 2�]i (black and red symbols, respectively). All three datasets for each divalention were globally fitted with the slow sensor model shown in F. F, Scheme of the slow sensor release model with a single divalent ion binding site used to fit the data in C–E. The parameters usedfor the fits in C–E were as follows: k� � 3.85 10 5 and 0.8 10 5
M�1s �1 for Ca 2� and Sr 2�, respectively; k� � 7.56 s �1, �S � 28.5 s �1, �0 � 5.85 10 �4 s �1.
Babai et al. • Ca2� Buffering and Slow Transmitter Release J. Neurosci., September 17, 2014 • 34(38):12622–12635 • 12629

the Sr 2� buffering capacity of cellular cy-tosol has not been obtained. For this rea-son, we next measured the Sr 2� bufferingcapacity of the calyx nerve terminal, usingthe indicator overload method (Neherand Augustine, 1992; Helmchen et al.,1997). This again required careful calibra-tion of fura-2 for Sr 2� (see Materials andMethods).
We loaded calyces with 200 �M fura-2in the presence of 2 mM extracellular Sr 2�
and stimulated the nerve terminals re-peatedly with brief depolarizations (0 mVfor 3 ms; Fig. 7A, inset). The first stimulusduring whole-cell recordings, when onlylittle fura-2 had entered the nerve termi-nal, induced large [Sr 2�]i transients (Fig.7A, arrow). During the loading phase ofcalyces with fura-2, the [Sr 2�]i transientsprogressively decreased in amplitude, in-dicating increasing competition of fura-2with the cellular buffering mechanism(Fig. 7A), similarly as previously demon-strated for Ca 2� (Neher and Augustine,1992). Using the Kd value of Sr 2� bindingto fura-2 as determined in calibrationmeasurements (Kd � 4.2 �M; Table 1),and the Sr 2�-independent fura-2 fluores-cence as a proxy of the intracellular fura-2concentration, we calculated the exoge-nously added Sr 2� buffering capacity offura-2, �B (Sr), for each stimulus. Plots ofthe inverse of the [Sr 2�]i amplitudeagainst �B (Sr) indicated an endogenousbuffering capacity for Sr 2�, �S (Sr), of 6 inthis recording. The extrapolated [Sr 2�]i
transient at zero added exogenous bufferwas �8 �M (Fig. 7C, arrows).
In parallel experiments, we measuredthe buffer capacity for Ca 2�, �S (Ca), us-ing 75 �M fura-2 in the patch pipette and 2mM extracellular [Ca 2�]. Despite similardivalent ion charge (Fig. 7A,B, insets), thefree [Ca 2�]i transients were significantlysmaller, ��0.5 �M. As a consequence, the inverse amplitudes ofthe free divalent concentration transients were significantlylarger for Ca 2� than for Sr 2� (Fig. 7B,D). This indicates a higherbuffering capacity for the nerve terminal for Ca 2� compared withSr 2�. On average, �S (Ca) was 46 � 2.8 (n � 5 cells), whereas �S
(Sr) was only 8.5 � 0.6 (n � 11 cells; p � 0.001; Fig. 7F). Thismassive difference is most likely caused by a lower binding affin-ity of endogenous fixed buffers for Sr2� compared with Ca2� (seeDiscussion). The back-extrapolated amplitude of the [Sr2�]i tran-sient was 12 � 0.84 �M (n � 10), 10-fold higher than the back-extrapolated [Ca2�]i amplitude, which was 0.89 � 0.05 �M (Fig. 7F,middle; n � 5, p � 0.001). This difference was not caused by largercurrents carried by Sr2� through Ca2� channels because, in theseparticular experiments, the divalent ion charge was similar (Fig. 7F,right). These experiments are, to our knowledge, the first measure-ment of intracellular Sr2� buffering capacity in any cell type. Theyshow that the Ca 2� buffering system of the nerve terminal has an�5- to 6-fold lower capacity for Sr 2� compared with Ca 2�. This
admits a massively higher spatially averaged [Sr 2�]i (Figs. 7A,arrow, and see Fig. 8).
We next analyzed the Sr 2� extrusion rate constant comparedwith Ca 2� using the fura-2 overload data in Figure 7. For this pur-pose, we plotted the decay time constants of the [Sr2�]i and [Ca2�]i
transients as a function of the corresponding �B values for Ca2� andSr2� (Fig. 7E). Interestingly, the extrapolated values of the [Ca2�]i
and [Sr2�]i decay time constants for zero exogenous buffer werequite similar (�90–100 ms; Fig. 7E, arrow; y-axis intercept). How-ever, the slope of the plot of � versus �B was much higher for Sr2�
than for Ca2�, which indicates a significantly lower extrusion rate �for Sr2� (Fig. 7E,G; �4.2-fold; p � 0.001). Thus, the similar extrap-olated value of �decay for [Sr2�]i and [Ca2�]i for no added exogenousbuffers is caused by a compensation of the smaller extrusion rateconstant � by the significantly smaller endogenous buffering capac-ity for Sr2�, �S (Sr), resulting in similar time constants of decay.Taken together, fura-2 overload experiments establish that the en-dogenous divalent ion buffering capacity of the nerve terminals isdrastically lower for Sr2� than for Ca2�.
Figure 6. Sr 2� is less efficient than Ca 2� at low intracellular concentrations in wild-type synapses. A, Calyces ofwild-type mice were loaded with CDTA-buffered Sr 2� solutions with different free [Sr 2�]. The resulting effective [Sr 2�]i
was measured by fura-2 ratio imaging (open symbols), whereas the release activity was continuously measured in post-synaptic recordings of mEPSCs (bottom). B, The Sr 2� and Ca 2� sensitivities of transmitter release over a wide range ofdivalent ion concentration. The pink and gray square data points indicate the release rates measured at low intracellularSr 2� and Ca 2� concentrations (A). The round data points are from the divalent ion uncaging experiments (replotted fromFig. 4C; same meaning of symbols). Note the double-logarithmic scales and the shallower slope at low divalent ionconcentrations. The fits of the Ca 2� and Sr 2� sensitivity of release by the 2-sensor model (solid lines) and by the allostericmodel (dotted lines) are superimposed. The pink and the gray solid lines indicate the prediction of the 2-sensor model usingthe affinity for Ca 2� and Sr 2� as measured in Syt2 KO calyces (Fig. 5). For the final 2-sensor model, the affinities for Ca 2�
and Sr 2� at the slow sensor were reduced �100-fold to explain “clamping” of the slow sensor in the presence of Syt2(Kochubey and Schneggenburger, 2011) (Table 2). The horizontal dashed lines indicate the measured release rates afterhigh-frequency stimulation (Fig. 2); vertical dashed lines indicate the predicted [Ca 2�]i and [Sr 2�]i values. C, Predictionof the 2-sensor model of the origin of fused vesicles. Release was tracked as originating from the unoccupied sensor(“spontaneous”; rate �0 in the scheme of the 2-sensor model in Fig. 4F ); from the occupied slow sensor (“slow”; rate �S);or else, release upon full occupancy of the fast sensor (“fast”; �F).
12630 • J. Neurosci., September 17, 2014 • 34(38):12622–12635 Babai et al. • Ca2� Buffering and Slow Transmitter Release

Spatially averaged [Sr 2�]i elevations are much higher than[Ca 2�]i
The significantly lower buffering capacity of the presynaptic cy-tosol for Sr 2� is expected to cause a drastically larger buildup offree Sr 2� compared with Ca 2�. To investigate the Ca 2� and Sr 2�
signals relevant for the late phase of release observed after high-frequency trains (Fig. 2), we performed quantitative Ca 2� andSr 2� imaging experiments following 100 Hz trains of AP-likestimulations. We used a low-affinity indicator (fura-6F; 100 �M)to image physiologically relevant divalent ion transients whileonly minimally perturbing their amplitude or kinetics (see Ma-terials and Methods).
In presynaptic voltage-clamp recordings, we first imaged[Ca 2�]i in response to 100 Hz trains of AP-like voltage-clampdepolarizations (Fig. 8A) and then switched the extracellular so-lution to Sr 2� (2 mM in both cases; Fig. 8A, B). The peak [Sr 2�]i
transient reached at the end of the 100 Hz trains was 33.0 � 3.5�M, drastically higher than [Ca 2�]i, which was 3.6 � 0.4 �M (Fig.8C, left; p � 0.001). Part of this difference was caused by the larger
Sr 2� currents through Ca 2� channels(Fig. 8A,B, inset). The larger part of the�10-fold higher [Sr 2�]i transients com-pared with [Ca 2�]i must be caused by thesignificantly lower buffering capacity ofthe nerve terminal for Sr 2� comparedwith Ca 2� (�5.5-fold; Fig. 7). We fittedthe decay of the [Sr 2�]i and [Ca 2�]i tran-sients with exponential plus line functions(Fig. 8A,B, dashed lines). This showed asignificant difference of the decay time �(Fig. 8C, middle; p � 0.01), but the valueswere close, consistent with the results ofFigure 7E. The late residual [Sr 2�]i signal,measured at a time of 3�, was, however,10-fold higher than the corresponding[Ca 2�]i value (Fig. 8C, right; 4.6 � 0.5and 0.28 � 0.03 �M, respectively; n � 5;p 0.001). The large difference betweenthe absolute values of [Sr 2�]i and [Ca 2�]i
becomes clearer by direct overlay of tworepresentative traces recorded in the samecell (Fig. 8B). Thus, the spatially averaged[Sr 2�]i rises to �10-fold higher valuesthan [Ca 2�]i both during and after thetrain. This difference is, to a large part,caused by a significantly smaller bufferingcapacity �S of the nerve terminal for Sr 2�.
The microdomain Sr 2� signal is notstrongly affected by the weaker Sr 2�
bufferingWe finally wished to investigate whetherthe lower buffering capacity of the nerveterminal for Sr 2� would also affect the“local” Sr 2� signal relevant for phasic re-lease. For this purpose, we first back-calculated the local Ca 2� and Sr 2�
concentrations relevant for AP-driven fastrelease, based on the measured intracellu-lar Ca 2� and Sr 2� sensitivities of release(Fig. 4) (for the back-calculation ap-proach, see Schneggenburger and Neher,2000). We recorded single EPSCs in re-
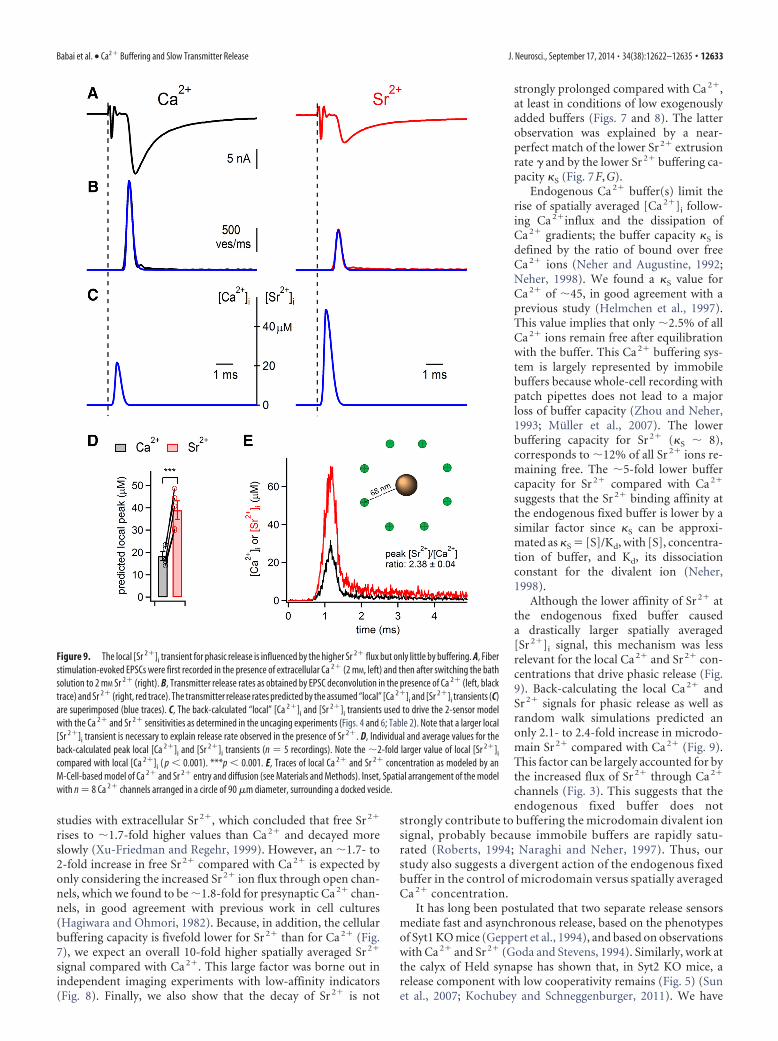
sponse to afferent fiber stimulation in the presence of Ca 2� andthen exchanged the bath solution to Sr 2�. As expected, the EPSCamplitudes and peak release rates were smaller in the presence ofSr 2� (Fig. 9A,B). Nevertheless, the back-calculation approachreturned larger local [Sr 2�]i signals compared with Ca 2� (Fig.9C), which reflects the lower efficiency of intracellular Sr 2� at thefast sensor (Fig. 4). On average, the amplitudes of the local Ca 2�
and Sr 2� transients were 18.4 � 1.98 �M and 38.9 � 4.2 �M,respectively (n � 5 cells; p � 0.001; Fig. 9D), which correspondsto a relative increase of 2.12 � 0.11-fold. This factor approxi-mately reflects the increased Sr 2� flux through open Ca 2� chan-nels (�1.8-fold; Fig. 3B), suggesting that the lower bufferingcapacity measured for spatially averaged Sr 2� transients (Fig. 7)has only little influence on the brief “local” Sr 2� signal relevantfor phasic release. This might be caused by the fact that endoge-nous fixed buffers will be rapidly saturated locally by incomingdivalent ions (Roberts, 1994; Naraghi and Neher, 1997).
To validate the role of the divalent ion buffer in controlling thelocal Ca 2� and Sr 2� signals, we performed random-walk simu-
Figure 7. The intracellular buffering capacity for Sr 2� in the nerve terminal is much weaker than for Ca 2�. A, B, Example offura-2 loading experiments in which the presynaptic terminal was repeatedly depolarized to 0 mV for 3 ms (insets) to induce Sr 2�
(A) or Ca 2� (B) influx, whereas an increasing concentration of fura-2 filled the recorded nerve terminal during the first �300 s ofwhole-cell recording of a calyx of Held. Subsequent traces of [Sr 2�]i and [Ca 2�]i transients in response to the depolarizations atdifferent times of whole-cell recordings are shown. C, D, Plots of inverse peak amplitude versus exogenously added buffer capacity(�B) for [Sr 2�]i (C), or for [Sr 2�]i and [Ca 2�]i (D). E, Plots of the [Sr 2�]i and [Ca 2�]i decay time constants as a function of �B forSr 2� and Ca 2�. C–E, Data are from the same recordings as shown in A, B. F, Average and individual values for endogenous buffercapacity �S (left), for the peak divalent ion transient extrapolated to the beginning of whole-cell recording (middle), and for thedivalent ion charge entering during the 3 ms depolarization (right). Data for Sr 2� and Ca 2� are shown. Note an�5.5-fold smallerbuffering capacity for Sr 2� compared with Ca 2� (left; p � 0.001), and the much larger [Sr 2�]i transient amplitude (middle; p �0.001). G, Average and individual values of the extrapolated decay time constant, �� of divalent ion transients (left), and of thedivalent ion extrusion rate � (right), for both Sr 2� and Ca 2�. Note the significantly smaller � for Sr 2� compared with Ca 2� ( p�0.001). ***p � 0.001. n.s., Not significant.
Babai et al. • Ca2� Buffering and Slow Transmitter Release J. Neurosci., September 17, 2014 • 34(38):12622–12635 • 12631
lations of Ca 2� and Sr 2� influx and buff-ering at a release site (Fig. 9E), assumingthat the �S-like buffer is represented by anendogenous fixed buffer with relativelylow affinity (see Discussion). We used anarray of several Ca 2� channels becauserelease at the calyx of Held synapse is con-trolled by multiple Ca 2� channels (Mein-renken et al., 2002; Wang et al., 2009).With the chosen distances, a brief localCa 2� transient with amplitude of �25 �M
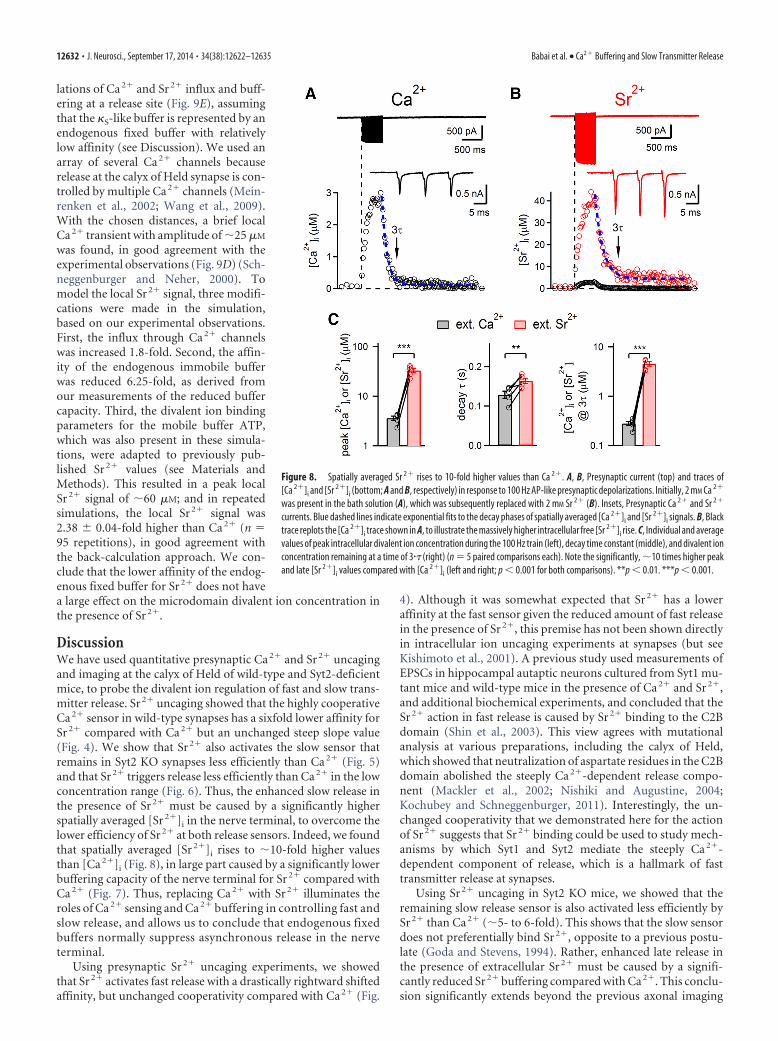
was found, in good agreement with theexperimental observations (Fig. 9D) (Sch-neggenburger and Neher, 2000). Tomodel the local Sr 2� signal, three modifi-cations were made in the simulation,based on our experimental observations.First, the influx through Ca 2� channelswas increased 1.8-fold. Second, the affin-ity of the endogenous immobile bufferwas reduced 6.25-fold, as derived fromour measurements of the reduced buffercapacity. Third, the divalent ion bindingparameters for the mobile buffer ATP,which was also present in these simula-tions, were adapted to previously pub-lished Sr 2� values (see Materials andMethods). This resulted in a peak localSr 2� signal of �60 �M; and in repeatedsimulations, the local Sr 2� signal was2.38 � 0.04-fold higher than Ca 2� (n �95 repetitions), in good agreement withthe back-calculation approach. We con-clude that the lower affinity of the endog-enous fixed buffer for Sr 2� does not havea large effect on the microdomain divalent ion concentration inthe presence of Sr 2�.
DiscussionWe have used quantitative presynaptic Ca 2� and Sr 2� uncagingand imaging at the calyx of Held of wild-type and Syt2-deficientmice, to probe the divalent ion regulation of fast and slow trans-mitter release. Sr 2� uncaging showed that the highly cooperativeCa 2� sensor in wild-type synapses has a sixfold lower affinity forSr 2� compared with Ca 2� but an unchanged steep slope value(Fig. 4). We show that Sr 2� also activates the slow sensor thatremains in Syt2 KO synapses less efficiently than Ca 2� (Fig. 5)and that Sr 2� triggers release less efficiently than Ca 2� in the lowconcentration range (Fig. 6). Thus, the enhanced slow release inthe presence of Sr 2� must be caused by a significantly higherspatially averaged [Sr 2�]i in the nerve terminal, to overcome thelower efficiency of Sr 2� at both release sensors. Indeed, we foundthat spatially averaged [Sr 2�]i rises to �10-fold higher valuesthan [Ca 2�]i (Fig. 8), in large part caused by a significantly lowerbuffering capacity of the nerve terminal for Sr 2� compared withCa 2� (Fig. 7). Thus, replacing Ca 2� with Sr 2� illuminates theroles of Ca 2� sensing and Ca 2� buffering in controlling fast andslow release, and allows us to conclude that endogenous fixedbuffers normally suppress asynchronous release in the nerveterminal.
Using presynaptic Sr 2� uncaging experiments, we showedthat Sr 2� activates fast release with a drastically rightward shiftedaffinity, but unchanged cooperativity compared with Ca 2� (Fig.
4). Although it was somewhat expected that Sr 2� has a loweraffinity at the fast sensor given the reduced amount of fast releasein the presence of Sr 2�, this premise has not been shown directlyin intracellular ion uncaging experiments at synapses (but seeKishimoto et al., 2001). A previous study used measurements ofEPSCs in hippocampal autaptic neurons cultured from Syt1 mu-tant mice and wild-type mice in the presence of Ca 2� and Sr 2�,and additional biochemical experiments, and concluded that theSr 2� action in fast release is caused by Sr 2� binding to the C2Bdomain (Shin et al., 2003). This view agrees with mutationalanalysis at various preparations, including the calyx of Held,which showed that neutralization of aspartate residues in the C2Bdomain abolished the steeply Ca 2�-dependent release compo-nent (Mackler et al., 2002; Nishiki and Augustine, 2004;Kochubey and Schneggenburger, 2011). Interestingly, the un-changed cooperativity that we demonstrated here for the actionof Sr 2� suggests that Sr 2� binding could be used to study mech-anisms by which Syt1 and Syt2 mediate the steeply Ca 2�-dependent component of release, which is a hallmark of fasttransmitter release at synapses.
Using Sr 2� uncaging in Syt2 KO mice, we showed that theremaining slow release sensor is also activated less efficiently bySr 2� than Ca 2� (�5- to 6-fold). This shows that the slow sensordoes not preferentially bind Sr 2�, opposite to a previous postu-late (Goda and Stevens, 1994). Rather, enhanced late release inthe presence of extracellular Sr 2� must be caused by a signifi-cantly reduced Sr 2� buffering compared with Ca 2�. This conclu-sion significantly extends beyond the previous axonal imaging
Figure 8. Spatially averaged Sr 2� rises to 10-fold higher values than Ca 2�. A, B, Presynaptic current (top) and traces of[Ca 2�]i and [Sr 2�]i (bottom; A and B, respectively) in response to 100 Hz AP-like presynaptic depolarizations. Initially, 2 mM Ca 2�
was present in the bath solution (A), which was subsequently replaced with 2 mM Sr 2� (B). Insets, Presynaptic Ca 2� and Sr 2�
currents. Blue dashed lines indicate exponential fits to the decay phases of spatially averaged [Ca 2�]i and [Sr 2�]i signals. B, Blacktrace replots the [Ca 2�]i trace shown in A, to illustrate the massively higher intracellular free [Sr 2�]i rise. C, Individual and averagevalues of peak intracellular divalent ion concentration during the 100 Hz train (left), decay time constant (middle), and divalent ionconcentration remaining at a time of 3�� (right) (n � 5 paired comparisons each). Note the significantly, �10 times higher peakand late [Sr 2�]i values compared with [Ca 2�]i (left and right; p � 0.001 for both comparisons). **p � 0.01. ***p � 0.001.
12632 • J. Neurosci., September 17, 2014 • 34(38):12622–12635 Babai et al. • Ca2� Buffering and Slow Transmitter Release
studies with extracellular Sr 2�, which concluded that free Sr 2�
rises to �1.7-fold higher values than Ca 2� and decayed moreslowly (Xu-Friedman and Regehr, 1999). However, an �1.7- to2-fold increase in free Sr 2� compared with Ca 2� is expected byonly considering the increased Sr 2� ion flux through open chan-nels, which we found to be �1.8-fold for presynaptic Ca 2� chan-nels, in good agreement with previous work in cell cultures(Hagiwara and Ohmori, 1982). Because, in addition, the cellularbuffering capacity is fivefold lower for Sr 2� than for Ca 2� (Fig.7), we expect an overall 10-fold higher spatially averaged Sr 2�
signal compared with Ca 2�. This large factor was borne out inindependent imaging experiments with low-affinity indicators(Fig. 8). Finally, we also show that the decay of Sr 2� is not
strongly prolonged compared with Ca 2�,at least in conditions of low exogenouslyadded buffers (Figs. 7 and 8). The latterobservation was explained by a near-perfect match of the lower Sr 2� extrusionrate � and by the lower Sr 2� buffering ca-pacity �S (Fig. 7F,G).
Endogenous Ca 2� buffer(s) limit therise of spatially averaged [Ca 2�]i follow-ing Ca 2�influx and the dissipation ofCa 2� gradients; the buffer capacity �S isdefined by the ratio of bound over freeCa 2� ions (Neher and Augustine, 1992;Neher, 1998). We found a �S value forCa 2� of �45, in good agreement with aprevious study (Helmchen et al., 1997).This value implies that only �2.5% of allCa 2� ions remain free after equilibrationwith the buffer. This Ca 2� buffering sys-tem is largely represented by immobilebuffers because whole-cell recording withpatch pipettes does not lead to a majorloss of buffer capacity (Zhou and Neher,1993; Muller et al., 2007). The lowerbuffering capacity for Sr 2� (�S � 8),corresponds to �12% of all Sr 2� ions re-maining free. The �5-fold lower buffercapacity for Sr 2� compared with Ca 2�
suggests that the Sr 2� binding affinity atthe endogenous fixed buffer is lower by asimilar factor since �S can be approxi-mated as �S � [S]/Kd, with [S], concentra-tion of buffer, and Kd, its dissociationconstant for the divalent ion (Neher,1998).
Although the lower affinity of Sr 2� atthe endogenous fixed buffer causeda drastically larger spatially averaged[Sr 2�]i signal, this mechanism was lessrelevant for the local Ca 2� and Sr 2� con-centrations that drive phasic release (Fig.9). Back-calculating the local Ca 2� andSr 2� signals for phasic release as well asrandom walk simulations predicted anonly 2.1- to 2.4-fold increase in microdo-main Sr 2� compared with Ca 2� (Fig. 9).This factor can be largely accounted for bythe increased flux of Sr 2� through Ca 2�
channels (Fig. 3). This suggests that theendogenous fixed buffer does not
strongly contribute to buffering the microdomain divalent ionsignal, probably because immobile buffers are rapidly satu-rated (Roberts, 1994; Naraghi and Neher, 1997). Thus, ourstudy also suggests a divergent action of the endogenous fixedbuffer in the control of microdomain versus spatially averagedCa 2� concentration.
It has long been postulated that two separate release sensorsmediate fast and asynchronous release, based on the phenotypesof Syt1 KO mice (Geppert et al., 1994), and based on observationswith Ca 2� and Sr 2� (Goda and Stevens, 1994). Similarly, work atthe calyx of Held synapse has shown that, in Syt2 KO mice, arelease component with low cooperativity remains (Fig. 5) (Sunet al., 2007; Kochubey and Schneggenburger, 2011). We have
Figure 9. The local [Sr 2�]i transient for phasic release is influenced by the higher Sr 2� flux but only little by buffering. A, Fiberstimulation-evoked EPSCs were first recorded in the presence of extracellular Ca 2� (2 mM, left) and then after switching the bathsolution to 2 mM Sr 2� (right). B, Transmitter release rates as obtained by EPSC deconvolution in the presence of Ca 2� (left, blacktrace) and Sr 2� (right, red trace). The transmitter release rates predicted by the assumed “local” [Ca 2�]i and [Sr 2�]i transients (C)are superimposed (blue traces). C, The back-calculated “local” [Ca 2�]i and [Sr 2�]i transients used to drive the 2-sensor modelwith the Ca 2� and Sr 2� sensitivities as determined in the uncaging experiments (Figs. 4 and 6; Table 2). Note that a larger local[Sr 2�]i transient is necessary to explain release rate observed in the presence of Sr 2�. D, Individual and average values for theback-calculated peak local [Ca 2�]i and [Sr 2�]i transients (n � 5 recordings). Note the �2-fold larger value of local [Sr 2�]i
compared with local [Ca 2�]i ( p � 0.001). ***p � 0.001. E, Traces of local Ca 2� and Sr 2� concentration as modeled by anM-Cell-based model of Ca 2� and Sr 2� entry and diffusion (see Materials and Methods). Inset, Spatial arrangement of the modelwith n � 8 Ca 2� channels arranged in a circle of 90 �m diameter, surrounding a docked vesicle.
Babai et al. • Ca2� Buffering and Slow Transmitter Release J. Neurosci., September 17, 2014 • 34(38):12622–12635 • 12633

therefore used the 2-sensor model (Sun et al., 2007) to fit theCa 2� and Sr 2� data, with the modifications that only a singlebinding site was assumed for the slow sensor (Fig. 5) and that“clamping” of the slow sensor was provided for in the presence ofSyt2 (Kochubey and Schneggenburger, 2011) (for details, seeMethods and Materials).
Using the refined 2-sensor model fitted to both the Ca 2� andthe Sr 2� uncaging data, we can predict the contribution of thefast and the slow sensors over a wide range of Ca 2� and Sr 2�
concentrations (Fig. 6C). Below 0.6 �M [Ca 2�]i and below 3 �M
[Sr 2�]i, the model predicts that 50% of release, is triggered bythe slow sensor; above these concentrations, the fast sensor takesover, as is also apparent by the steep slope values above theseconcentrations (Fig. 6B). Given the measured values of late re-lease rates of �15 and 150 Hz in the presence of Ca 2� and Sr 2�,respectively (Fig. 2), which correspond to free [Ca 2�]i and[Sr 2�]i values of �0.5 and 5 �M, we can see that the late release inthe presence of Sr 2� falls into a steeper part of the dose–responsecurve than late release with Ca 2� (Fig. 6B, red and black dashedlines, respectively). This indicates that reduced Sr 2� bufferingresults in a larger activation of the fast sensor despite the lowersensitivity of the latter for Sr 2� as compared to Ca 2�. Thus, theactivation of fast and slow sensors is more complex than initiallythought (Goda and Stevens, 1994), and slow release in the pres-ence of Sr 2� can be carried following the activation of the fast,Syt2-like sensor.
These conclusions from detailed fitting of the Ca 2� and Sr 2�
sensitivities of release at the calyx synapse are relevant to otherCNS synapses. A steep phase of release has also been observed inCa 2� uncaging experiments at cerebellar inhibitory synapses(Sakaba, 2008) and at hippocampal autaptic synapses (Burgalossiet al., 2010). In addition, the latter study has shown that Syt1 KOleads to a more shallow Ca 2�-dependency of release, again dem-onstrating the persistence of a more linear release sensor in theabsence of the main Ca 2� sensor, Syt1/2. Some brain synapses,such as GABAergic synapses made by specific interneuron types,are distinguished by slow release kinetics and large asynchronousrelease (Hefft and Jonas, 2005; Best and Regehr, 2009; Daw et al.,2009). These synapses might both have active zone architectureswith longer coupling distances between Ca 2� channels and vesi-cles implying a larger relative importance of global Ca 2� signal-ing; they might also have different mechanisms of intrinsic Ca 2�
sensing and less clamping of a secondary Ca 2� sensor. Futurework could investigate the molecular mechanisms that lead to thespecification of fast and slow release kinetics at defined types ofsynapses.
ReferencesAngleson JK, Betz WJ (2001) Intraterminal Ca 2� and spontaneous trans-
mitter release at the frog neuromuscular junction. J Neurophysiol 85:287–294. Medline
Best AR, Regehr WG (2009) Inhibitory regulation of electrically coupledneurons in the inferior olive is mediated by asynchronous release ofGABA. Neuron 62:555–565. CrossRef Medline
Bollmann JH, Sakmann B, Borst JG (2000) Calcium sensitivity of glutamaterelease in a calyx-type terminal. Science 289:953–957. CrossRef Medline
Borst JG, Sakmann B (1998) Calcium current during a single action poten-tial in a large presynaptic terminal of the rat brainstem. J Physiol 506:143–157. CrossRef Medline
Burgalossi A, Jung S, Meyer G, Jockusch WJ, Jahn O, Taschenberger H,O’Connor VM, Nishiki T, Takahashi M, Brose N, Rhee JS (2010)SNARE protein recycling by �SNAP and �SNAP supports synaptic vesiclepriming. Neuron 68:473– 487. CrossRef Medline
Clements JD, Bekkers JM (1997) Detection of spontaneous synaptic events
with an optimally scaled template. Biophys J 73:220 –229. CrossRefMedline
Daw MI, Tricoire L, Erdelyi F, Szabo G, McBain CJ (2009) Asynchronoustransmitter release from cholecystokinin-containing inhibitory interneu-rons is widespread and target-cell independent. J Neurosci 29:11112–11122. CrossRef Medline
Delaney KR, Tank DW (1994) A quantitative measurement of the depen-dence of short-term synaptic enhancement on presynaptic residual cal-cium. J Neurosci 14:5885–5902. Medline
Dodge FA Jr, Rahamimoff R (1967) Co-operative action of calcium ions intransmitter release at the neuromuscular junction. J Physiol 193:419 –432. Medline
Ellis-Davies GC (2003) Development and application of caged Calcium.Methods Enzymol 360:226 –238. CrossRef Medline
Fernandez-Chacon R, Konigstorfer A, Gerber SH, García J, Matos MF, Ste-vens CF, Brose N, Rizo J, Rosenmund C, Sudhof TC (2001) Synaptotag-min I functions as a calcium regulator of release probability. Nature 410:41– 49. CrossRef Medline
Geppert M, Goda Y, Hammer RE, Li C, Rosahl TW, Stevens CF, Sudhof TC(1994) Synaptotagmin I: a major Ca 2� sensor for transmitter release at acentral synapse. Cell 79:717–727. CrossRef Medline
Goda Y, Stevens CF (1994) Two components of transmitter release at acentral synapse. Proc Natl Acad Sci U S A 91:12942–12946. CrossRefMedline
Grynkiewicz G, Poenie M, Tsien RY (1985) A new generation of Ca 2� indi-cators with greatly improved fluorescence properties. J Biol Chem 260:3440 –3450. Medline
Hagiwara S, Ohmori H (1982) Studies of calcium channels in rat clonalpituitary cells with patch electrode voltage clamp. J Physiol 331:231–252.Medline
Hefft S, Jonas P (2005) Asynchronous GABA release generates long-lastinginhibition at a hippocampal interneuron-principal neuron synapse. NatNeurosci 8:1319 –1328. CrossRef Medline
Helmchen F, Borst JG, Sakmann B (1997) Calcium dynamics associatedwith a single action potential in a CNS presynaptic terminal. Biophys J72:1458 –1471. CrossRef Medline
Kerr RA, Bartol TM, Kaminsky B, Dittrich M, Chang JC, Baden SB, SejnowskiTJ, Stiles JR (2008) Fast Monte Carlo simulation methods for biologicalreaction-diffusion systems in solution and on surfaces. SIAM J Sci Com-put 30:3126 –3173. CrossRef Medline
Kirischuk S, Grantyn R (2003) Intraterminal Ca 2� concentration and asyn-chronous transmitter release at single GABAergic boutons in rat collicularcultures. J Physiol 548:753–764. CrossRef Medline
Kishimoto T, Liu TT, Ninomiya Y, Takagi H, Yoshioka T, Ellis-Davies GC,Miyashita Y, Kasai H (2001) Ion selectivities of the Ca 2� sensors forexocytosis in rat phaeochromocytoma cells. J Physiol 533:627– 637.CrossRef Medline
Kochubey O, Schneggenburger R (2011) Synaptotagmin increases the dy-namic range of synapses by driving Ca 2�-evoked release and by clampinga near-linear remaining Ca 2� sensor. Neuron 69:736 –748. CrossRefMedline
Kochubey O, Han Y, Schneggenburger R (2009) Developmental regulationof the intracellular Ca 2� sensitivity of vesicle fusion and Ca 2�-secretioncoupling at the rat calyx of Held. J Physiol 587:3009 –3023. CrossRefMedline
Lou X, Scheuss V, Schneggenburger R (2005) Allosteric modulation of thepresynaptic Ca 2� sensor for vesicle fusion. Nature 435:497–501. CrossRefMedline
Mackler JM, Drummond JA, Loewen CA, Robinson IM, Reist NE (2002)The C2B Ca 2�-binding motif of synaptotagmin is required for synaptictransmission in vivo. Nature 418:340 –344. CrossRef Medline
Martell AE, Smith RM (1974) Critical stability constants, Vol 1. New York:Plenum.
Meinrenken C, Borst JG, Sakmann B (2002) Calcium secretion coupling atcalyx of Held governed by nonuniform channel-vesicle topography.J Neurosci 22:1648 –1667. Medline
Miledi R (1966) Strontium as a substitute for calcium in the process oftransmitter release at the neuromuscular junction. Nature 212:1233–1234. CrossRef Medline
Muller M, Felmy F, Schwaller B, Schneggenburger R (2007) Parvalbumin isa mobile presynaptic Ca 2� buffer in the calyx of Held that accelerates the
12634 • J. Neurosci., September 17, 2014 • 34(38):12622–12635 Babai et al. • Ca2� Buffering and Slow Transmitter Release
decay of Ca 2� and short-term facilitation. J Neurosci 27:2261–2271.CrossRef Medline
Naraghi M, Neher E (1997) Linearized buffered Ca 2� diffusion in microdo-mains and its implications for calculation of [Ca 2�] at the mouth of acalcium channel. J Neurosci 17:6961– 6973. Medline
Neher E (1998) Usefulness and limitations of linear approximations to theunderstanding of Ca �� signals. Cell Calcium 24:345–357. CrossRefMedline
Neher E, Augustine GJ (1992) Calcium gradients and buffers in bovinechromaffin cells. J Physiol 450:273–301. Medline
Neher E, Sakaba T (2001) Combining deconvolution and noise analysis forthe estimation of transmitter release rates at the calyx of Held. J Neurosci21:444 – 461. Medline
Nishiki T, Augustine GJ (2004) Dual roles of the C2B domain of synaptotag-min I in synchronizing Ca 2�-dependent neurotransmitter release. J Neu-rosci 24:8542– 8550. CrossRef Medline
Pang ZP, Melicoff E, Padgett D, Liu Y, Teich AF, Dickey BF, Lin W, Adachi R,Sudhof TC (2006) Synaptotagmin-2 is essential for survival and con-tributes to Ca 2� triggering of neurotransmitter release in central andneuromuscular synapses. J Neurosci 26:13493–13504. CrossRef Medline
Ravin R, Spira ME, Parnas H, Parnas I (1997) Simultaneous measurementof intracellular Ca 2� and asynchronous transmitter release from the samecrayfish bouton. J Physiol 501:251–262. Medline
Roberts WM (1994) Localization of calcium signals by a mobile calciumbuffer in frog saccular hair cells. J Neurosci 14:3246 –3262. Medline
Rumpel E, Behrends JC (1999) Sr 2�-dependent asynchronous evokedtransmission at rat striatal inhibitory synapses in vitro. J Physiol 514:447–458. CrossRef Medline
Sakaba T (2008) Two Ca 2�-dependent steps controlling synaptic vesiclefusion and replenishment at the cerebellar basket cell terminal. Neuron57:406 – 419. CrossRef Medline
Sakaba T, Neher E (2001) Calmodulin mediates rapid recruitment of fast-releasing synaptic vesicles at a calyx-type synapse. Neuron 32:1119 –1131.CrossRef Medline
Schneggenburger R, Neher E (2000) Intracellular calcium dependence of
transmitter release rates at a fast central synapse. Nature 406:889 – 893.CrossRef Medline
Schneggenburger R, Meyer AC, Neher E (1999) Released fraction and totalsize of a pool of immediately available transmitter quanta at a calyx syn-apse. Neuron 23:399 – 409. CrossRef Medline
Shin OH, Rhee JS, Tang J, Sugita S, Rosenmund C, Sudhof TC (2003) Sr 2�
binding to the Ca 2� binding site of the synaptotagmin 1 C2B domaintriggers fast exocytosis without stimulating SNARE interactions. Neuron37:99 –108. CrossRef Medline
Sun J, Pang ZP, Qin D, Fahim AT, Adachi R, Sudhof TC (2007) A dual-Ca 2�-sensor model for neurotransmitter release in a central synapse.Nature 450:676 – 682. CrossRef Medline
von Gersdorff H, Schneggenburger R, Weis S, Neher E (1997) Presynapticdepression at a calyx synapse: the small contribution of metabotropicglutamate receptors. J Neurosci 17:8137– 8146. Medline
Wang LY, Kaczmarek LK (1998) High-frequency firing helps replenish thereadily releasable pool of synaptic vesicles. Nature 394:384 –388. CrossRefMedline
Wang LY, Fedchyshyn MJ, Yang YM (2009) Action potential evoked trans-mitter release in central synapses: insights from the developing calyx ofHeld. Mol Brain 2:36 – 46. CrossRef Medline
Wilson JE, Chin A (1991) Chelation of divalent cations by ATP, studied bytitration calorimetry. Anal Biochem 193:16 –19. CrossRef Medline
Wolfel M, Lou X, Schneggenburger R (2007) A mechanism intrinsic to thevesicle fusion machinery determines fast and slow transmitter release at alarge CNS synapse. J Neurosci 27:3198 –3210. CrossRef Medline
Xu-Friedman MA, Regehr WG (1999) Presynaptic strontium dynamics andsynaptic transmission. Biophys J 76:2029 –2042. CrossRef Medline
Xu-Friedman MA, Regehr WG (2000) Probing fundamental aspects of syn-aptic transmission with strontium. J Neurosci 20:4414 – 4422. Medline
Yoshihara M, Littleton JT (2002) Synaptotagmin I functions as a calciumsensor to synchronize neurotransmitter release. Neuron 36:897–908.CrossRef Medline
Zhou Z, Neher E (1993) Mobile and immobile calcium buffers in bovineadrenal chromaffin cells. J Physiol 469:245–273. Medline
Babai et al. • Ca2� Buffering and Slow Transmitter Release J. Neurosci., September 17, 2014 • 34(38):12622–12635 • 12635