analysis and interpretation of...
TRANSCRIPT

CHAPTER V
ANALYSIS AND INTERPRETATION OF DATA
5.1 INTRODUCTION
5.2 SUMMARY OF ANALYSIS
5.3 COMPARISON OF EXPERIMENTAL AND CONTROL GROUPS BASED
ON PRE-TEST SCORES AND SES SCORES
5.4 COMPARISON OF EXPERIMENTAL AND CONTROL GROUPS BASED
ON ACHIEVEMENT TEST SCORES
5.5 COMPARISON OF EXPERIMENTAL AND CONTROL GROUPS BASED
ON THE SELF-CONCEPT SCORES.
5.6 COMPARISON OF EXPERIMENTAL AND CONTROL GROUPS BASED
ON THE ACHIEVEMENT MOTIVATION.
5.7 COMPARISON OF EXPERIMENTAL AND CONTROL GROUP BASED
ON THE MATHEMATICAL INTEREST SCORES
5.8 GENUINENESS OF DIFFERENCE IN THE PERFORMANCE OF
EXPERIMENTAL AND CONTROL GROUPS.
5.9 ANALYSIS AND INTERPRETATION OF THE OPINION OF THE
EXPERTS ON PEER TUTORING
5.10 ANALYSIS AND INTERPRETATION OF THE DATA OBTAINED FROM
THE EVALUATION OF PEER TUTORING MODEL
5.11 EVALUATION OF TUTORS’ SKILL BY THE RESEARCHER
5.12 CONCLUSION
278
Chapter 5 Analysis and Interpretation of Data
5.1 INTRODUCTION
The analysis of data involves breaking down the complex
tabulated materials into simpler parts and putting the parts together in
new arrangements to determine the inherent meanings and facts. A
critical examination of the results will lead to acceptance or rejection of
the proposed hypothesis that in turn will contribute to knowledge in
particular area.
The major objective of the study was to test the effect of Peer
Tutoring Model on achievement, self-concept, mathematical interest
and achievement motivation of high school pupils. The data obtained
were analyzed by applying relevant statistical techniques. The details
of analysis of data are given in this chapter.
5.2 SUMMARY OF ANALYSIS
5.3 Comparison of Experimental and Control Groups Based on
Pre-test Scores and SES Scores
5.3.1 Comparison of Pre-test Score of Pupils in the Experimental and
Control Groups
5.3.2 Comparison Based on SES Scores of the Pupils in the
Experimental and Control Groups
5.4 Comparison of Experimental and Control Groups Based on
Achievement Test Scores
5.4.1 Comparison of Post-test Achievement Scores of Pupil inthe
Experimental and Control Groups
5.4.2 Comparison of Mean Gain Achievement Scores of Pupils inthe
Experimental and Control Groups

279
Chapter 5 Analysis and Interpretation of Data
5.5 Comparison of Experimental and Control Groups Based on the
Self-Concept Scores
5.5.1 Comparison of Post-test Self Concept Scores of Pupils in
Experimental and Control Groups
5.5.2 Comparison of Mean Gain Self Concept Scores of Pupils in the
Experimental and Control Groups
5.6 Comparison of Experimental and Control Groups Based on the
Achievement Motivation
5.6.1 Comparison ofPost-test Achievement Motivation Scores of
Pupils in the Experimental and Control Groups
5.6.2 Comparison of Mean Gain Achievement Motivation Scores of
Pupils in the Experimentaland Control Groups
5.7 Comparison of Experimental and Control Group Based on the
Mathematical Interest Scores
5.7.1 Comparison ofPost-test Mathematical Interest Scores of Pupils
inthe Experimental and Control Groups
5.7.2 Comparison of Mean Gain Mathematical Interest Scores of
Pupils inthe Experimental and Control Groups
5.8 Genuineness of Difference in the Performance of Experimental
and Control Groups
5.8.1 Effect of Peer Tutoring Model on Achievement inMathematics
5.8.2 Effect of Peer Tutoring Model on Self-Concept
5.8.3 Effect of Peer Tutoring Model on Achievement Motivation
5.8.4 Effect of Peer Tutoring Model on Mathematical Interest

280
Chapter 5 Analysis and Interpretation of Data
5.9 Analysis and Interpretation ofthe Opinion ofthe Experts on
Peer Tutoring
5.10 Analysis and Interpretation of the Data Obtained from the
Evaluation of PeerTutoring Model
5.10.1 Analysis and Interpretation of the Data Obtained from the
Tutors’ Diary.
5.10.2 Analysis and Interpretation of the Data Obtained from the
Tutees’ Diary
5.10.3 Analysis and Interpretation of the Opinion of Experts
Regarding the Effectiveness of Peer Tutoring Model
5.11 Evaluation of Tutors’ Skill by the Researcher
5.3 COMPARISON OF EXPERIMENTAL AND CONTROL
GROUPS BASED ON PRE-TEST SCORES AND SES SCORES
The pre-test achievement scores and SES scores of experimental
and control group were collected and analyzed for ensuring the
equivalence of the two groups. The details of the analysis of the both
the set of data are given below.
5.3.1 Comparison of Pre-Test Score of Pupils in theExperimental
and Control Groups
The mean and standard deviation of the pre-test scores of 200
pupilsin the experimental and control groups were calculated. The
critical ratio was found out and tested for significance. The data and
result of test of significance are given in Table 5.1.

281
Chapter 5 Analysis and Interpretation of Data
The critical ratio 1.46 is not significant at 0.01 level. This shows
that there is no significant difference between the means of the pre-test
scores of the pupils in experimental and control groups. It means that
the two groups do not differ significantly in their pre-test scores. So it
can be concluded that two groups are more or less of the same level in
terms of pre-test scores. The pre-test scores of experimental and control
groups are graphically represented in Graph 5.1.
0
10
20
30
40
50
60
70
80
0-5 5--10 10--15 15-20 20-25 25-30 30-35 35-40
Fre
qu
en
cy
Class
Control Experimental
Group N Mean SD CR Level of
significance
Experimental 200 19.91 6.66
1.46 P > 0.01
Control 200 18.26 6.11
Table 5.1 The Result of Test of Significance of the Difference Between the Means of
Pre-test Scores of Pupils in the Experimental and Control Groups
Graph 5.1 The Frequency Distribution of the Pre-test Scores of Pupils in the
Experimental and Control Groups

282
Chapter 5 Analysis and Interpretation of Data
5.3.2 Comparison Based on SES Scores of the Pupils in the
Experimental and Control Groups
The mean and standard deviation of SES scores of 200 pupils in
the experimental and control group were found out. The critical ratio
was found out and tested for significance. The data and result of the
test of significance are given in Table 5.2.
Group N Mean SD CR Level of
Significance
Experimental 200 22.5 7.04
0.40 P>0.01
Control 200 23.8 6.49
The critical ratio 0.40 is not significant at 0.01 level. This shows
that there is no significant difference between the means of the SES
scores of the pupils in experimental and control groups. It means that
the two groups do not differ significantly in their SES. So it can be
concluded that two groups are more or less of the same level in terms
of SES. The pre-test scores of experimental and control groups are
graphically represented in Graph5.2.
Table 5.2 The Result of the Test of Significance of the Difference Between the Means ofSocio
Economic Status of Pupils in the Experimental and Control Groups

283
Chapter 5 Analysis and Interpretation of Data
5.4 COMPARISON OF EXPERIMENTAL AND
CONTROLGROUPSBASED ON ACHIEVEMENT TEST
SCORES
The post-test achievement scores were collected from both the
control and experimental groups. The data were analyzed by
comparing them. Also analyzed the mean gain achievement scores of
pupils in the experimental and control groups. The details of the
analysis are given below.
5.4.1 Comparison of Post-test Achievement Scores of Pupils in the
Experimental and Control Groups
A post-test was conducted by the investigator after the peer
tutoring session in control and experimental group to find the variation
in the achievement scores due to peer tutoring. The critical ratio 8.74 is
0
20
40
60
80
100
120
140
0-10 20--30 20-30 30-40
Fre
qu
en
cy
Class
Experimental group Control group
Graph 5.2 The Frequency Distribution of the Socio-Economic Status
ofPupils in the Experimental and Control Groups

284
Chapter 5 Analysis and Interpretation of Data
significant at 0.01level. This shows that there is significant difference
between the means of the achievement scores of the pupils in
experimental and control groups. It means that the two groups differ
significantly in their achievement. So it can be concluded that two
groups are at different level in achievement. The data and result of the
test of significance are given in Table 5.3.
The critical ratio 8.74 is significant at 0.01 level. This shows that
there is significant difference between the means of the post-
testachievement scores of the pupils in experimental and control
groups. It means that the two groups differ significantly in their
achievement. So it can be concluded that two groups are of different
levels in terms of post-test scores. The post-test achievement scores of
experimental and control groups are graphically represented in
Graph5.3.
Group N Mean SD CR Level of
significance
Experimental 200 29.6 7.93
8.74 P>0.01
Control 200 21.2 7.67
Table 5.3 The Result of Test of Significance of the Difference between the Means of
Post-Test Achievement Scores of Pupils in the Experimental and Control Groups

285
Chapter 5 Analysis and Interpretation of Data
5.4.2 Comparison of Mean Gain Achievement Scores of Pupils in
the Experimental and Control Groups
The mean and standard deviation of the gain achievement score
of the two groups were calculated. The critical ratio was found out and
tested for significance. The data and result of the test of significance
are given in Table 5.4.
Group N Mean SD CR Level of
significance
Experimental 200 5.7 3.05
20.83 P > 0.01
Control 200 1.1 1.19
0
10
20
30
40
50
60
70
80
0-5 5--10 10--15 15-20 20-25 25-30 30-35 35-40 40-45 45-50 50-55 55-60
Fre
qu
en
cy
Class
Experimental group Control Group
Graph 5.3 The Frequency Distribution of the Post-test Achievement Scores
of Pupils in the Experimental and Control groups
Table 5.4 The Result of Test of Significance of The Difference Between Mean Gain
Achievement Scores of Pupils in the Experimental and Control Groups

286
Chapter 5 Analysis and Interpretation of Data
The mean gain achievement of 200 pupils in experiment and
control group was 5.7 and 1.1 respectively with a deviation of 3.05 and
1.19. It was observed that the two groups significantly differed in mean
gain scores with a critical value of 20.83 at 0.01 level.
5.5 COMPARISON OF EXPERIMENTAL AND
CONTROLGROUPSBASED ON THE SELF-CONCEPT
SCORES
The post-test self-concept scores were collected from both the
control and experimental groups. The data were analyzed by
comparing them. Also analyzed the mean gain self-concept scores of
pupils in the experimental and control groups. The details of the
analysis are given below.
5.5.1 Comparison of Post-test Self-Concept Scores of Pupils in
Experimental and Control Groups
The mean and standard deviation of scores of self-conceptof 200
pupils in the experimental and control group were found out before and
after peer tutoring session. The critical ratio was found out and tested
for significance. The data and result of the test of significance are given
in Table.5.5.
Group N Mean SD CR Level of
significance
Experimental 200 77.15 14.12
3.73 P > 0.01
Control 200 71.5 16.06
Table 5.5 The Result of Test of Significance of the Difference Between Means of Self
Concept Scores of Pupils in the Experimental and Control Groups

287
Chapter 5 Analysis and Interpretation of Data
The critical ratio 3.73 is significant at 0.01 level. This shows that
there is significant difference between the means of the self-
conceptscores of the pupils in experimental and control groups. It
means that the two groups differ significantly in their self-concept. So
it can be concluded that two groups are different in level in terms of
self-concept. The self-concept scores of experimental and control
groups are graphically represented in Graph 5.4.
5.5.2 Comparison of Mean Gain Self Concept Scores of Pupils in
the Experimental and Control Groups
The mean and standard deviation of gain scores of self-
conceptof 200 pupils in the experimental and control group were found
out before and after peer tutoring session. The critical ratio was found
out and tested for significance. The data and result of the test of
significance are given in Table.5.6.
0
10
20
30
40
50
60
70
80
0-10 10--20
20-30
30-40
40-50
50-60
60-70
70-80
80-90
90-100
100-110
110-120
Fre
qu
en
cy
Class
Experimental group
Graph 5.4 The Frequency Distribution of the Self Concept Scores of Pupils in the
Experimental and Control Groups.

288
Chapter 5 Analysis and Interpretation of Data
The mean gain self-concept of 200 pupils in experimental and
control groups were 7.3 and 2.7 respectively with deviations of 3.5 and
3.3. It was observed that the mean gain significantly differed in both
control and experimental group with a critical value of 14.08 at
0.01level (Table.5.6)
5.6 COMPARISON OF EXPERIMENTAL AND CONTROL
GROUPS BASED ON THE ACHIEVEMENT MOTIVATION
The post-test achievement motivation scores were collected from
both the control and experimental groups. The data were analyzed by
comparing them. Also analyzed the mean gain achievement motivation
scores of pupils in the experimental and control groups. The details of
the analysis are given below.
5.6.1 Comparison of Post-test Achievement Motivation Scores of
Pupils in the Experimental and Control Groups
The mean and standard deviation of scores of achievement
motivation of200 pupils in the experimental and control group were
found out before and after peer tutoring session. The critical ratio was
found out and tested for significance. The data and result of the test of
significance are given in Table 5.7.
Group N Mean SD CR Level of
significance
Experimental 200 7.3 3.5 14.08 P > 0.01
Control 200 2.7 3.3
Table 5.6 The Results of Test of Significance of the Difference Between Mean Gain Self
Concept Scores of Pupils in the Experimental and Control Groups

289
Chapter 5 Analysis and Interpretation of Data
The critical ratio 3.77 is significant at 0.01level. This shows that
there is significant difference between the means of the achievement
motivation scores of the pupils in experimental and control groups. It
means that the two groups differ significantly in their achievement
motivation. So it can be concluded that two groups are different in
levels in terms of achievement motivation. The achievement
motivation of experimental and control groups are graphically
represented in Graph5.5.
0
10
20
30
40
50
60
70
80
90
0-10 20 -30 20-30 30-40 40-50 50-60
Fre
qu
en
cy
Class
Experimental group Control group
Group N Mean Sd CR Level of
significance
Experimental 200 36.5 10.16 3.77 P > 0.01
Control 200 32.3 12.01
Table 5.7 The Result of Test of Significance of the Difference Between Means of
Achievement Motivation Scores of Pupils in the Experimental and Control Groups
Graph 5.5 The Frequency Distribution of the Achievement Motivation Scores
ofPupils in the Experimental and Control Groups

290
Chapter 5 Analysis and Interpretation of Data
5.6.2 Comparison of Mean Gain Achievement Motivation Scores
of Pupils in the Experimental and Control Groups
The mean and standard deviation of gain scores of achievement
motivation of 200 pupils in the experimental and control group were
found out before and after peer tutoring session. The critical ratio was
found out and tested for significance. The data and result of the test of
significance are given in Table.5.8.
Group N Mean SD CR Level of
significance
Experimental 200 6.6 2.8
23.50 P>0.01
Control 200 1.7 1.3
The mean gain achievement motivation of 200 pupils in
experimental and control groups were 6.6 and 1.7 respectively with
deviations of 2.8 and 1.3. It was observed that the mean gain
significantly differed in both control and experimental group with a
critical value of 23.50 at 0.01 level(Table.5.8).
5.7 COMPARISON OF EXPERIMENTAL AND CONTROL GROUP
BASED ON THE MATHEMATICAL INTEREST SCORES
The post-testMathematics interest scores were collected from
both the control and experimental groups.The data was analysed
bycomparing them. Also analysed the mean gain Mathematics
interestscores of pupils in the experimental and control groups. The
details of the analysis are given below:
Table 5.8 The Result of Test of Significance of the Mean GainAchievement Motivation
Scores of Pupils in theExperimental and Control Groups

291
Chapter 5 Analysis and Interpretation of Data
5.7.1Comparison of Post-testMathematical Interest Scores of
Pupils in the Experimental and Control Groups.
The mean and standard deviation of scores of mathematical
interest of 200 pupils in the experimental and control group were
found out before and after peer tutoring session. The critical ratio was
found out and tested for significance. The data and result of the test of
significance are given in Table.5.9.
Group N Mean Sd CR Level of
significance
Experimental 200 23.47 5.98
4.42 P > 0.01
Control 200 20.62 6.88
The critical ratio 4.42 is significant at 0.01 level. This shows that
there is significant difference between the means of the mathematical
interest scores of the pupils in experimental and control groups. It
means that the two groups differ significantly in their mathematical
interest. So it can be concluded that two groups are different in level in
terms of mathematical interest. The mathematical interest scores of
experimental and control groups are graphically represented in Graph
5.6.
Table 5.9 The Result of Test of Significance of the Difference Between Means
ofMathematical Interest Scores of Pupils in the Experimental and Control Groups
292
Chapter 5 Analysis and Interpretation of Data
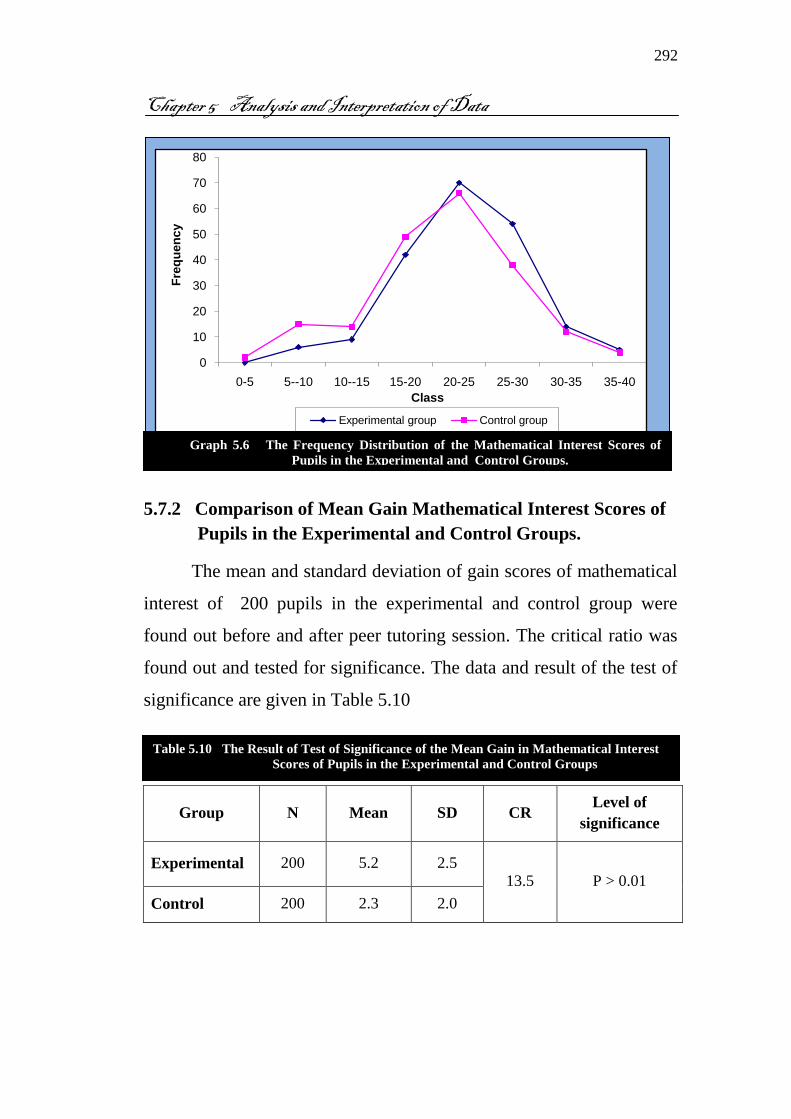
5.7.2 Comparison of Mean Gain Mathematical Interest Scores of
Pupils in the Experimental and Control Groups.
The mean and standard deviation of gain scores of mathematical
interest of 200 pupils in the experimental and control group were
found out before and after peer tutoring session. The critical ratio was
found out and tested for significance. The data and result of the test of
significance are given in Table 5.10
Group N Mean SD CR Level of
significance
Experimental 200 5.2 2.5 13.5 P > 0.01
Control 200 2.3 2.0
0
10
20
30
40
50
60
70
80
0-5 5--10 10--15 15-20 20-25 25-30 30-35 35-40
Fre
qu
en
cy
Class
Experimental group Control group
Table 5.10 The Result of Test of Significance of the Mean Gain in Mathematical Interest
Scores of Pupils in the Experimental and Control Groups
Graph 5.6 The Frequency Distribution of the Mathematical Interest Scores of
Pupils in the Experimental and Control Groups.

293
Chapter 5 Analysis and Interpretation of Data
The mean gain achievement motivation of200 pupils in
experimental and control groups were 5.2 and 2.3 respectively with
deviations of 2.5 and 2.0. It was observed that the mean gain
significantly differed in both control and experimental group with a
critical value of 13.5 at 0.01level (Table.5.10).
5.8 GENUINENESS OF DIFFERENCE IN THE PERFORMANCE
OF EXPERIMENTAL AND CONTROL GROUPS
The analysis of the post-test scores and gain scores of pupils for
each dependent variable revealed that the experimental group
performed much better than control group. Thus the investigator
concluded tentatively that Peer Tutoring Model is more effective than
prevailing method of teaching. But it cannot be conclusively say that
both the groups differ significantly by simply comparing the post-test
scores of or gain scores of the groups. Since it was highly inconvenient
to sort out the students from different classes to form equator groups,
the investigator selected intact class groups for experimentation. Even
though the groups were equated in terms of pre-test scores and socio
economic status, many other intervening variables might have affected
the experimentation. It is difficult to ascertain whether the difference
between the pre-test and post-test scores results from the experimental
factor or from other intervening variables. So it become necessary that
the scores be analysed using the technique of analysis of covariance for
much more reliable results.

294
Chapter 5 Analysis and Interpretation of Data
5.8.1 Effectof Peer Tutoring Model on Achievement in Mathematics
The achievement scores in Mathematics of 200 pupils of the
experimental and control group were subjected to analysis of
covariance to determine the effectiveness of Peer Tutoring Model over
prevailing method of teaching.
Total sum of squares, mean square variances and F ratios for the
pre and post achievement test scores of the experimental and control
groups were computed (Table 5.11).
Source of
variation df SSx SSy MSx MSy
Fx=2.16
Fy=90.95
Among
means 1 131.10 5685.16 131.10 5685.16
Within
groups 398 24130.4 24877.28 60.62 62.50
Total 399 24261.5 30562.44
The F ratios for the two sets of scores were tested for
significance. The Chi-square value of df 1/398 are 3.86 at 0.05 level.
The obtained value of Fx is 2.16 which is not significant at 0.05 level
and the obtained value of Fy is 90.95 which is significant at 0.05 level.
The total sum of squares and adjusted mean square variances for
post-test scores were computed. F ratio was calculated (Table.5.12).
Table 5.11 Summary of Analysis of Variance of Pre and Post Achievement Test Scores
of Experimental and Control Groups

295
Chapter 5 Analysis and Interpretation of Data
The obtained value of F ratio is 51.83. It is significant at 0.01
level, since the value at 0.01 level from the table is 6.7. The significant
F ratio for the adjusted post-test scores shows that the two final mean
scores, viz., the final mean score of pupil in the experimental group and
that of control group differ significantly after they have been adjusted
for differences in pre-test scores.
The adjusted means for post-test scores of pupil in the
experimental and control group were computed using correlation and
regression. The results are shown in Table 5.13.
Groups N Mx My My.x (adjusted)
Experimental 200 18.26 29.6 29.8
Control 200 19.91 21.2 20.1
General means 19.1 25.4
Source
of variation df SSx SSy SSxy SSy.x Msy.x SDy.x
Fy.x
=
51.8
3
Among
means 1 131.10 5685.16 266.35
1800.9
5 1800.95
5.89
Within
groups 397
24130.
40
24877.2
8
25028.5
5 13794 34.75
Total 398 24261.
50
30562.4
4
24762.2
0
15594.
95
Table 5.13 Data for Adjusted Means of Post-test Achievement Scores of Pupils in
Experimental and Control Groups
Table 5.12 Summary of Analysis of Covariance of Pre and Post Achievement Test Scores of
Experimental and Control Groups
296
Chapter 5 Analysis and Interpretation of Data
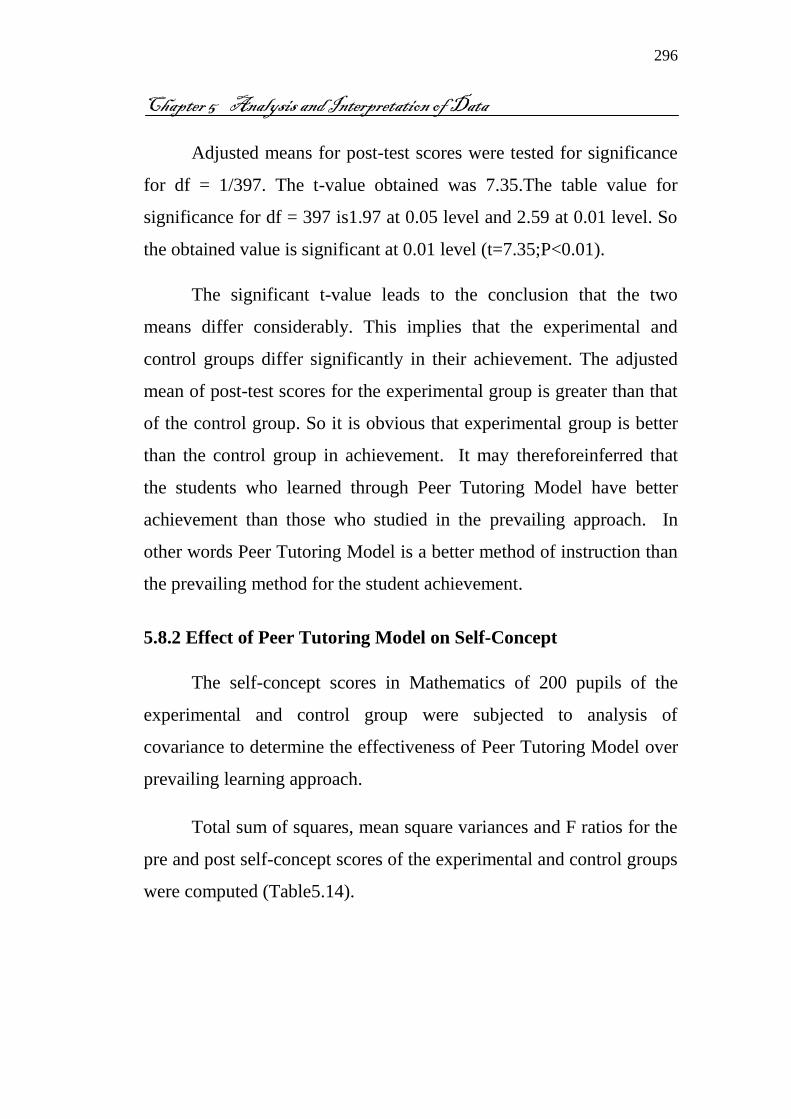
Adjusted means for post-test scores were tested for significance
for df = 1/397. The t-value obtained was 7.35.The table value for
significance for df = 397 is1.97 at 0.05 level and 2.59 at 0.01 level. So
the obtained value is significant at 0.01 level (t=7.35;P<0.01).
The significant t-value leads to the conclusion that the two
means differ considerably. This implies that the experimental and
control groups differ significantly in their achievement. The adjusted
mean of post-test scores for the experimental group is greater than that
of the control group. So it is obvious that experimental group is better
than the control group in achievement. It may thereforeinferred that
the students who learned through Peer Tutoring Model have better
achievement than those who studied in the prevailing approach. In
other words Peer Tutoring Model is a better method of instruction than
the prevailing method for the student achievement.
5.8.2 Effect of Peer Tutoring Model on Self-Concept
The self-concept scores in Mathematics of 200 pupils of the
experimental and control group were subjected to analysis of
covariance to determine the effectiveness of Peer Tutoring Model over
prevailing learning approach.
Total sum of squares, mean square variances and F ratios for the
pre and post self-concept scores of the experimental and control groups
were computed (Table5.14).

297
Chapter 5 Analysis and Interpretation of Data
Source of
variation df SSx SSy MSx MSy
Fx= 0.95
Fy=15.88
Among
means 1 246.49 3782.25 46.49 3782.25
Within
groups 398 104447.9 94811.5 262.43 238.22
Total 399 104694.4 98593.75
The F ratios for the two sets of scores were tested for
significance. The table value of df 1/397 are 3.86 at 0.05 level. The
obtained value of Fx is 0.94 which is not significant at 0.05 level and
the obtained value of Fy is15.88 which is significant at 0.01 level.
The total sum of squares and adjusted mean square variances for
post-test scores were computed. F ratio was calculated (Table.5.15).
The obtained value of F ratio is 27.1. It is significant at 0.01
level, since the value at 0.01 level from the table is 6.7. The significant
F ratio for the adjusted post-test scores shows that the two final mean
scores , viz., the final mean score of pupil in the experimental group
and that of control group differ significantly after they have been
adjusted for differences in pre-test scores.
Source of
variation df SSx SSy SSxy SSy.x Msy.x SDy.x
Fy.x
=
27.1
Among
means 1
246.
49
3782.
25
380.
67
2448.
10
2448.
10 9.51
Within
groups 397
10447.
90
94811.
50
23247.
50
35882.
52
90.
38
Total 398 104694.
40
98593.
75
23628.
17
36126.
62
Table 5.14 Summary of Analysis of Variance of Pre and Post Self Concept
Scores of Experimental and Control Groups
Table 5.15 Summary of Analysis of Covariance of Pre and Post Self
Concept Scores of Experimental and Control Groups

298
Chapter 5 Analysis and Interpretation of Data
The adjusted means for post-test scores of pupil in the
experimental and control group were computed using correlation and
regression. The results are shown in Table 5.16
Groups N Mx My My.x (adjusted)
Experimental 200 71.05 77.2 77.6
Control 200 70.05 71.58 70.42
General means 70.55 74.39
Adjusted means for post-test scores were tested for significance
for df = 1/397. The t-value obtained was 10.35. The table value for
significance for df =397 is1.97 at 0.05 level and 2.59 at 0.01 level. So
the obtained value is significant at 0.01 level (t=10.35;P<0.01).
The significant t-value leads to the conclusion that the two
means differ considerably. This implies that the experimental and
control groups differ significantly in their self-concept. The adjusted
mean of post-test scores for the experimental group is greater than that
of the control group. So it is obvious that experimental group is better
than the control group in self-concept. It may bethereforeinferred that
the students who learned through Peer Tutoring Model have better self-
concept than those who studied in the prevailing approach. In other
words Peer Tutoring Model is a better method of instruction than the
prevailing method for the student’s self-concept.
5.8.3 Effect of Peer Tutoring Model on Achievement Motivation
The achievement motivation scores in Mathematics of 200
pupils of the experimental and control group were subjected to analysis
Table 5.16 Data for Adjusted Means of Post-test Self Concept Scores of
Pupils inExperimental and Control Groups

299
Chapter 5 Analysis and Interpretation of Data
of covariance to determine the effectiveness of Peer Tutoring Model
over prevailing learning approach.
Total sum of squares, mean square variances and F ratios for the
pre and post achievement motivation scores of the experimental and
control groups were computed (Table 5.17).
Source of variation df SSx SSy MSx MSy
Fx= 32.89
Fy=0.98
Among means 1 4900 156.25 4900 156.25
Within groups 398 59300 63521.5 148.995 159.60
Total 399 64200 63677.75
The Fratios for the two sets of scores were tested for
significance. The table value of df 1/397 is 3.86 at 0.05 level. The
obtained value of Fx is 32.89which is not significant at 0.05 level and
the obtained value of Fy is 0.98 which is significant at 0.01 level.
The total sum of squares and adjusted mean square variances for
post-test scores were computed. F ratio was calculated (Table 5.18).
Source of
variation df SSx SSy SSxy SSy.x Msy.x SDy.x
Fy.x
=
64.09
Among
means 1 4900 156.25
340.
92
2315.
46
2315.
46 6.01
Within
groups 397 59300
63521.5
0
32036.
64
14345.
76
36.
14
Total 398 64200 63677.7
5
32377.
56
16661.
22
Table 5.17Summary of Analysis of Variance of Pre and Post Achievement Motivation
Scores of Experimental and Control Groups
Table 5.18 Summary of Analysis of Covariance of Pre and Post Achievement
Motivation Scores of Experimental and Control Groups
300
Chapter 5 Analysis and Interpretation of Data
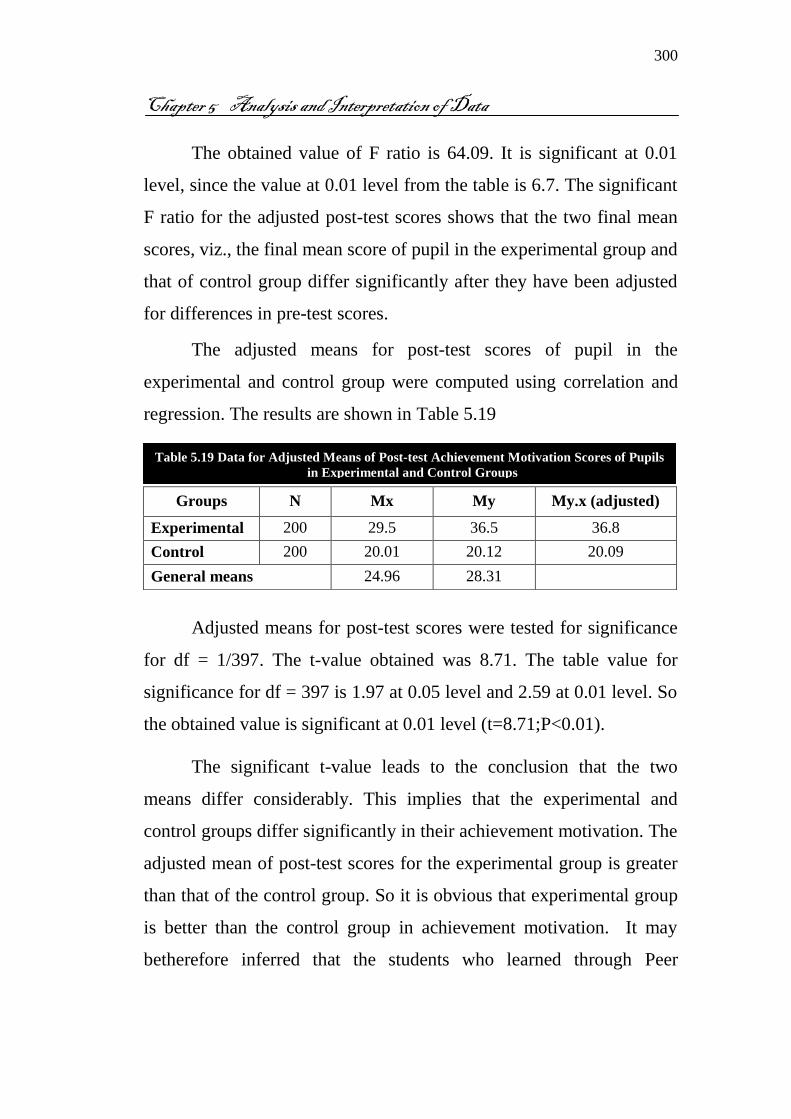
The obtained value of F ratio is 64.09. It is significant at 0.01
level, since the value at 0.01 level from the table is 6.7. The significant
F ratio for the adjusted post-test scores shows that the two final mean
scores, viz., the final mean score of pupil in the experimental group and
that of control group differ significantly after they have been adjusted
for differences in pre-test scores.
The adjusted means for post-test scores of pupil in the
experimental and control group were computed using correlation and
regression. The results are shown in Table 5.19
Adjusted means for post-test scores were tested for significance
for df = 1/397. The t-value obtained was 8.71. The table value for
significance for df = 397 is 1.97 at 0.05 level and 2.59 at 0.01 level. So
the obtained value is significant at 0.01 level (t=8.71;P<0.01).
The significant t-value leads to the conclusion that the two
means differ considerably. This implies that the experimental and
control groups differ significantly in their achievement motivation. The
adjusted mean of post-test scores for the experimental group is greater
than that of the control group. So it is obvious that experimental group
is better than the control group in achievement motivation. It may
betherefore inferred that the students who learned through Peer
Groups N Mx My My.x (adjusted)
Experimental 200 29.5 36.5 36.8
Control 200 20.01 20.12 20.09
General means 24.96 28.31
Table 5.19 Data for Adjusted Means of Post-test Achievement Motivation Scores of Pupils
in Experimental and Control Groups

301
Chapter 5 Analysis and Interpretation of Data
Tutoring Model have better achievement motivation than those who
studied in the prevailing approach. In other words Peer Tutoring
Model is a better method of instruction than the prevailing method for
the student’s achievement motivation.
5.8.4 Effect of Peer Tutoring Model on Mathematical Interest
The mathematical interest scores in Mathematics of 200 pupils
of the experimental and control group were subjected to analysis of
covariance to determine the effectiveness of Peer Tutoring Model over
prevailing learning approach.
Total sum of squares, mean square variances and F ratios for the
pre and post mathematical interest scores of the experimental and
control groups were computed (Table 5.20).
The F ratios for the two sets of scores were tested for
significance. The table value of df 1/398 is3.86 at 0.05 level. The
obtained value of Fx is 8.47 which is not significant at 0.05 level and
the obtained value of Fy is1.04 which is significant at 0.05 level.
The total sum of squares and adjusted mean square variances for
post-test scores were computed. F ratio was calculated (Table.5.21).
Source of
variation df SSx SSy MSx MSy
Fx=8.47
Fy=1.04
Among
means 1 402.0 52.101 402.01 52.10
Within
groups 398 18803.27 19801.24 47.48 50
Total 399 19205.28 19853.34
Table 5.20 Summary of Analysis of Variance of Pre and Post Mathematical Interest
Scores of Experimental and Control Groups
302
Chapter 5 Analysis and Interpretation of Data
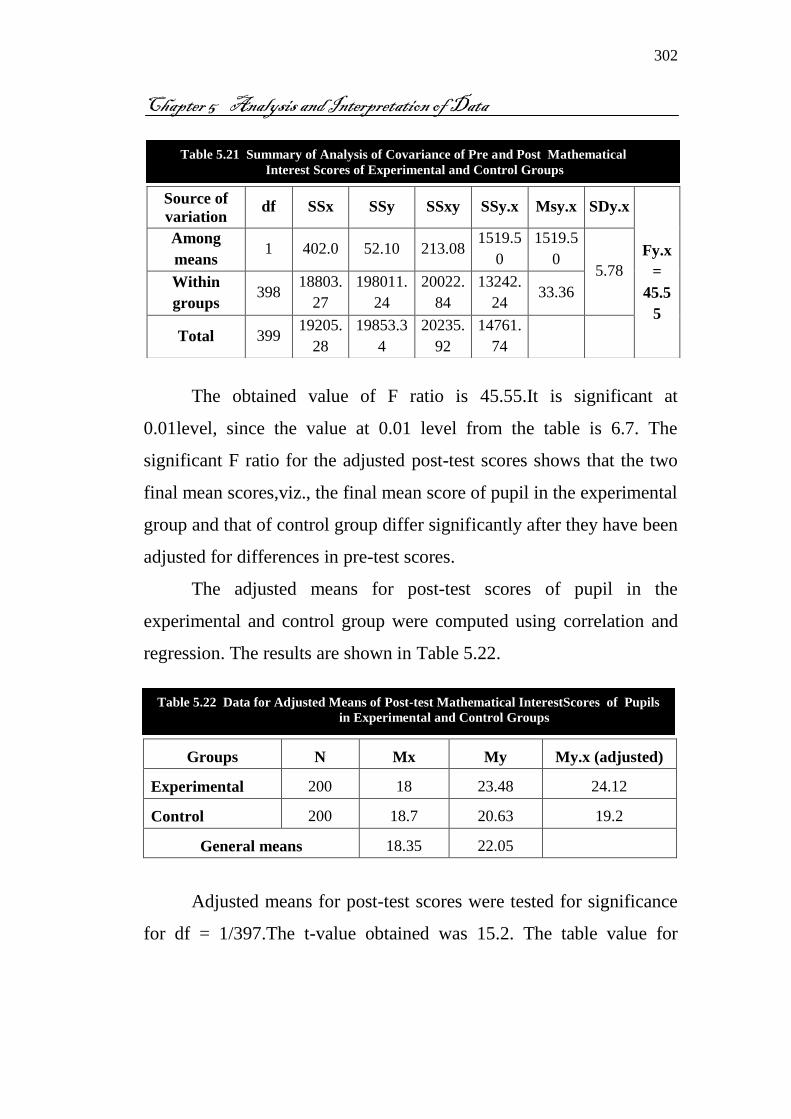
The obtained value of F ratio is 45.55.It is significant at
0.01level, since the value at 0.01 level from the table is 6.7. The
significant F ratio for the adjusted post-test scores shows that the two
final mean scores,viz., the final mean score of pupil in the experimental
group and that of control group differ significantly after they have been
adjusted for differences in pre-test scores.
The adjusted means for post-test scores of pupil in the
experimental and control group were computed using correlation and
regression. The results are shown in Table 5.22.
Groups N Mx My My.x (adjusted)
Experimental 200 18 23.48 24.12
Control 200 18.7 20.63 19.2
General means 18.35 22.05
Adjusted means for post-test scores were tested for significance
for df = 1/397.The t-value obtained was 15.2. The table value for
Source of
variation df SSx SSy SSxy SSy.x Msy.x SDy.x
Fy.x
=
45.5
5
Among
means 1 402.0 52.10 213.08
1519.5
0
1519.5
0 5.78
Within
groups 398
18803.
27
198011.
24
20022.
84
13242.
24 33.36
Total 399 19205.
28
19853.3
4
20235.
92
14761.
74
Table 5.21 Summary of Analysis of Covariance of Pre and Post Mathematical
Interest Scores of Experimental and Control Groups
Table 5.22 Data for Adjusted Means of Post-test Mathematical InterestScores of Pupils
in Experimental and Control Groups

303
Chapter 5 Analysis and Interpretation of Data
significance for df = 397 is1.97 at 0.05 level and 2.59 at 0.01 level. So
the obtained value is significant at 0.01 level (t=15.2.;P<0.01).
The significant t-value leads to the conclusion that the two
means differ considerably. This implies that the experimental and
control groups differ significantly in their mathematical interest. The
adjusted mean of post-test scores for the experimental group is greater
than that of the control group. So it is obvious that experimental group
is better than the control group in mathematical interest. It may
therefore inferred that the students who learned through Peer Tutoring
Model have better mathematical interest than those who studied in the
prevailing approach. In other words Peer Tutoring Model is a better
method of instruction than the prevailing method for the student’s
mathematical interest.
5.9 ANALYSIS AND INTERPRETATION OF THE OPINION
OFTHE EXPERTS ON PEER TUTORING
The mean and standard deviation values of the scores obtained
from the strategy evaluation proforma (Peer Tutoring) were calculated
by using the formula M±SD.
Variable Mean SD
Opinion on peer Tutoring 152.17 20.12
The mean and standard deviation obtained from the total score of
opinion on peer Tutoring are given in Table 5.2. The experts getting
score 173 and above grouped as high, score in between 132 and 172
Table 5.23 The Mean and Standard Deviation Values of Opinion of the Experts on
Peer Tutoring

304
Chapter 5 Analysis and Interpretation of Data
grouped as moderate and score 131 and below grouped as low opinion
on Peer Tutoring.
Level Number of Experts Percentage
Low 7 14
Moderate 35 70
High 8 16
Total 50 100
The table shows that the frequency of experts fall under three
levels of scores. Seventy per cent of experts have a moderate opinion
on Peer Tutoring and 16 per cent experts have high opinion on Peer
Tutoring.It showed that majority of the experts have a positive opinion
in the administration of the Peer Tutoring Method.The graphical
representation of the result from Table 5.24 is as follows.
0
10
20
30
40
50
60
70
Low Moderate High
Table 5.24 Levels of Opinion of the Experts on Peer Tutoring
Graph 5.7 Levels of Opinion of the Expert on Peer Tutoring
305
Chapter 5 Analysis and Interpretation of Data
The bar diagram shows the data and results indicating the levels
of opinion of experts on peer tutoring. It denotes that majority of the
experts have a positive opinion on peer tutoring.
5.10 ANALYSIS AND INTERPRETATION OF THE DATA OBTAINED
FROM THE EVALUATION OFPEER TUTORING MODEL
The evaluation of the Peer Tutoring Model was done with the
help of the data collected from both the students (tutors and tutee) and
teachers. The data for the evaluation was collected from tutors’ diary
and tutees’ diary.A Check-list was also given to the teachers and
experts for the same purpose. The detailsof the analysis of the dataare
given below.
5.10.1 Analysis and Interpretation of the Data Obtained from the
Tutors’ Diary
The tutors’ opinion about Peer Tutoring Model was evaluated
periodically after each session with five degrees of opinion. The data
were collected from the tutors’ dairy. Analysis and interpretation of the
data on tutors’ diary after each session was given below.
5.10.1.1The Opinion of Tutors’ with Respect to Their Self Evaluation
and Tutoring Schedule of Session 1
The opinion of tutors with respect to their self-evaluation and
tutoring schedule of session 1 is presented in Table.5.25. It was
observed that score were concentrated on good and average level and
the Chi-square is distributed normally with respect to expected ratios
since it showed good fit with it.The computed value of Chi–
square(6.4)is less than the critical value of the Chi–square, hence it

306
Chapter 5 Analysis and Interpretation of Data
cannot be taken as significant.Therefore the opinion expressed by
tutors is not based on mere chance factor.
The graphical representation of the opinion of tutors’ with
respect to their self-evaluation and tutoring schedule of session 1 is
presented in Graph 5.8. It was clearly observed that most of the tutors
possess average and above average performance in their session 1.
0
10
20
30
40
50
60
70
Excellent Good Average Poor Very poor
2.5
22.5
62.5
10Series1, 2.5
Opinion
Score Chi
df Level of
significance Frequency Percentage
Computed
value
Table
value
Excellent 1 2.5
6.4 9.49 4 0.05
Good 9 22.5
Average 25 62.5
Poor 4 10
Very poor 1 2.5
Graph 5.8 Distribution of Responses Obtained from Tutors’ Diary after Session 1
Table 5.25 Computation of the Chi-square with the Data Obtained
fromTutors’Diary after Session 1
307
Chapter 5 Analysis and Interpretation of Data
The opinion of tutors with respect to their self-evaluation in
session 1 indicated that the performance is excellent for 2.5 per
centtutors, good for 22.5 per cent and average for 62.5 per cent of
tutors.
5.10.1.2The Opinion of Tutors’ with Respect to Their SelfEvaluation
and Tutoring Schedule of Session 2
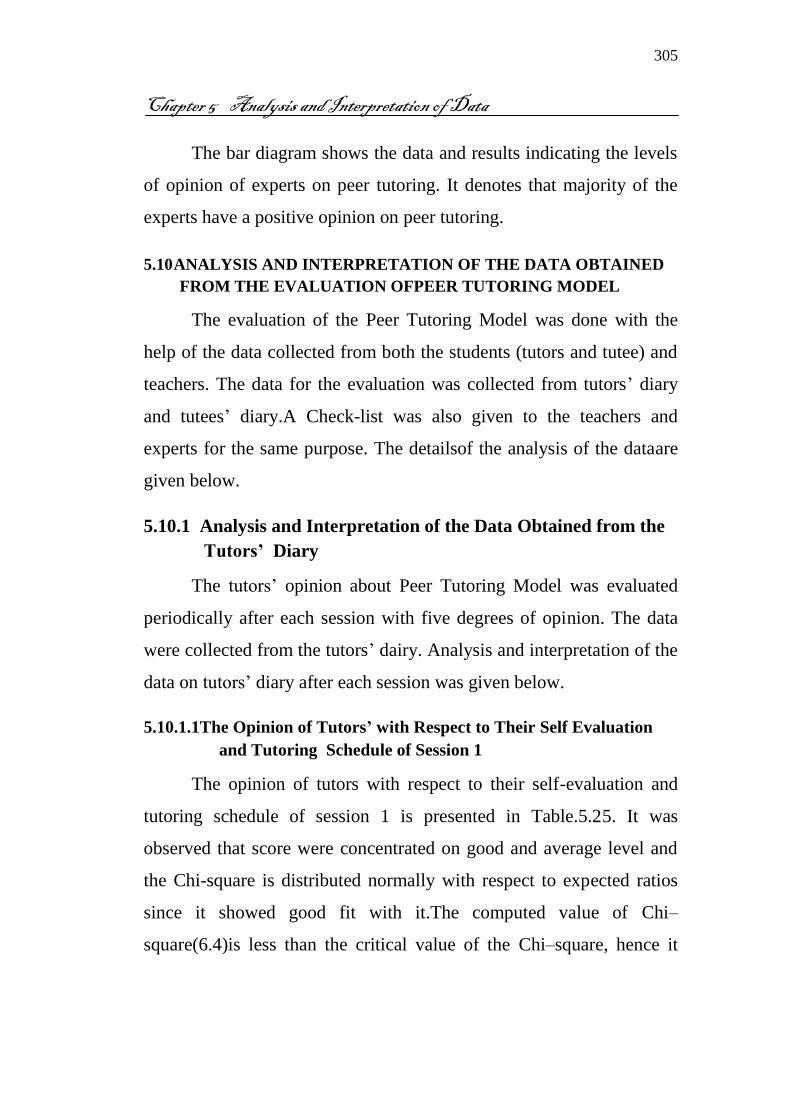
The opinion of tutors with respect to their self-evaluation and
tutoring schedule of session 2 is presented in Table.5.26. It was
observed that score were concentrated on good and average level and
the Chi–square is distributed normally with respect to expected ratios
since it showed good fit with it.The computed value of Chi–square(5.0)
is less than the critical value of the Chi–square, hence it cannot be
taken as significant. Therefore the opinions expressed by tutors are not
based on mere chance factor.
Opinion
Score Chi
df Level of
significance Frequency Percentage Computed
value
Table
value
Excellent 1 2.5
5.0 9.49 4 0.05
Good 11 27.5
Average 23 57.5
Poor 4 10.0
Very poor 1 2.5
The graphical representation of the opinion of tutors’ with
respect to their self-evaluation and tutoring schedule of session 2 is
presented in Graph.5.9. It was clearly observed that most of the tutors
possess average and above average performance in their session 2.
Table.5.26 Computation of the Chi-square with the Data Obtained
from Tutors’ Diary after Session 2

308
Chapter 5 Analysis and Interpretation of Data
The opinion of tutors with respect to their self-evaluation in
session 2 indicated that the performance is excellent for 2.5 per cent
tutors, good for 27.5 per cent and average for 57.5 per cent of tutors.
5.10.1.3The Opinion of Tutors ’ with Respect to TheirSelf
Evaluation and Tutoring Schedule of Session 3
The opinion of tutors with respect to their self-evaluation and
tutoring schedule of session 3 is presented in Table.5.27. It was
observed that score were concentrated on good and average level and
the Chi–square is distributed normally with respect to expected ratios
since it showed good fit with it. The computed value of Chi–square
(5.8)is less than the critical value of the Chi–square, hence it cannot be
taken as significant. .Therefore the opinions expressed by tutors are not
based on mere chance factor.
0
10
20
30
40
50
60
Excellent Good Average Poor Very poor
2.5
27.5
57.5
102.5
Graph 5.9 Distributionof Responses Obtained from Tutors’Diary after Session 2

309
Chapter 5 Analysis and Interpretation of Data
Opinion
Score Chi
df Level of
significance Frequency Percentage Computed
value
Table
value
Excellent 2 5.0
5.8 19.49 4 0.05
Good 10 25.0
Average 23 57.5
Poor 5 12.5
Very poor 0 0
The graphical representation of the opinion of tutors’ with
respect to their self-evaluation and tutoring schedule of session 3 is
presented in Graph.5.10. It was clearly observed that most of the tutors
possess average and above average performance in their session 3.
0
10
20
30
40
50
60
Excellent Good Average Poor Very poor
5
25
57.5
12.5
0
Table 5.27 Computation of the Chi-square with the Data Obtained
fromTutors’Diary after Session 3
Graph 5.10Distribution of Responses Obtained from Tutors’Diaryafter Session 3

310
Chapter 5 Analysis and Interpretation of Data
The opinion of tutors with respect to their self-evaluation in
session 3 indicated that the performance is excellent for fiveper
centtutors, good for 25 per cent and average for 57.5 percent of tutors.
5.10.1.4 The Opinion of Tutors’ with Respect to Their Self-Evaluation
and Tutoring Schedule of Session 4
The opinion of tutors with respect to their self-evaluation and
tutoring schedule of session 4 is presented in Table.5.28. It was
observed that score were concentrated on good and average level and
the Chi–square is distributed normally with respect to expected ratios
since it showed good fit with it. The computed value of Chi–
square(3.58 )is less than the critical value of the Chi–square, hence it
cannot be taken as significant. .Therefore the opinions expressed by
tutors are not based on mere chance factor.
Opinion
Score Chi
df Level of
significance Frequency Percentage Computed
value Table
value
Excellent 1 2.5
3.58 9.49 4 0.05
Good 11 27.5
Average 22 55.0
Poor 6 15.0
Very poor 0 0
The graphical representation of the opinion of tutors’ with
respect to their self-evaluation and tutoring schedule of session 4 is
presented in Graph.5.11. It was clearly observed that most of the tutors
possess average and above average performance in their session 4.
Table.5.28 Computation of the Chi-square with the Data Obtained from Tutors’Diary after
Session 4.

311
Chapter 5 Analysis and Interpretation of Data
The opinion of tutors with respect to their self-evaluation in
session 4 indicated that the performance is excellent for 2.5 per cent
tutors, good for 27.5 per cent tutors and average for 55.0 per cent of
tutors.
5.10.1.5 The Opinion of Tutors’ with Respect to Their Self-Evaluation
and Tutoring Schedule of Session 5
The opinion of tutors with respect to their self-evaluation and
tutoring schedule of session 5 is presented in Table.5.29. It was
observed that score were concentrated on good and average level and
the Chi–square is distributed normally with respect to expected ratios
since it showed good fit with it. The computed value of Chi–
square(6.9)is less than the critical value of the Chi–square, hence it
cannot be taken as significant. .Therefore the opinions expressed by
tutors are not based on mere chance factor.
0
10
20
30
40
50
60
Excellent Good Average Poor Very poor
2.5
27.5
55
15
0
Graph 5.11 Distribution of Responses Obtained from Tutors’Diary after Session 4

312
Chapter 5 Analysis and Interpretation of Data
The graphical representation of the opinion of tutors’ with
respect to their self-evaluation and tutoring schedule of session 5 is
presented in Graph5.12. It was clearly observed that most of the tutors
possess average and above average performance in their session 5.
The
0
5
10
15
20
25
30
35
40
45
50
Excellent Good Average Poor Very poor
7.5
27.5
50
15
0
Opinion
Score Chi
df Level of
significance Frequency Percentage Computed
value
Table
value
Excellent 3 7.5
6.9 9.49 4 0.05
Good 11 27.5
Average 20 50.0
Poor 6 15.0
Very poor 0 0
Table 5.29 Computation of the Chi-square with the Data Obtained from Tutors’ Diary
after Session 5.
Graph 5.12 Distribution of Responses Obtained from Tutors’Diary after Session 5

313
Chapter 5 Analysis and Interpretation of Data
The opinion of tutors with respect to their self-evaluation in
session 5 indicated that the performance is excellent for 7.5 per
centtutors, good for 27.5 per centand average for 50.0 per cent of
tutors.
5.10.1.6 The opinion of Tutors’ with Respect to Their Self-Evaluation
and Tutoring Schedule of Session 6
The opinion of tutors with respect to their self-evaluation and
tutoring schedule of session 6 is presented in Table.5.30. It was
observed that score were concentrated on good and average level and
the Chi–square is distributed normally with respect to expected ratios
since it showed good fit with it.The computed value of Chi–square(3.3)
is less than the critical value of the Chi–square, hence it cannot be
taken as significant. Therefore the responses expressed by tutors are
not based on mere chance factor.
Opinion
Score Chi
df Level of
significance Frequency Percentage Computed
value Table
value
Excellent 2 5.0
3.3 9.49 4 0.05
Good 13 32.5
Average 18 45.0
Poor 6 15.0
Very poor 1 2.5
The graphical representation of the opinion of tutors’ with
respect to their self-evaluation and tutoring schedule of session 6 is
Table 5.30 Computation of the Chi-square with the Data Obtained from
Tutors’Diary after Session 6

314
Chapter 5 Analysis and Interpretation of Data
presented in Graph.5.13. It was clearly observed that most of the tutors
possess average and above average performance in their session 6.
The opinion of tutors with respect to their self-evaluation in
session 6 indicated that the performance is excellent for fiveper cent
tutors’, good for 32.5 per cent and average for 45.0 per cent of tutors.
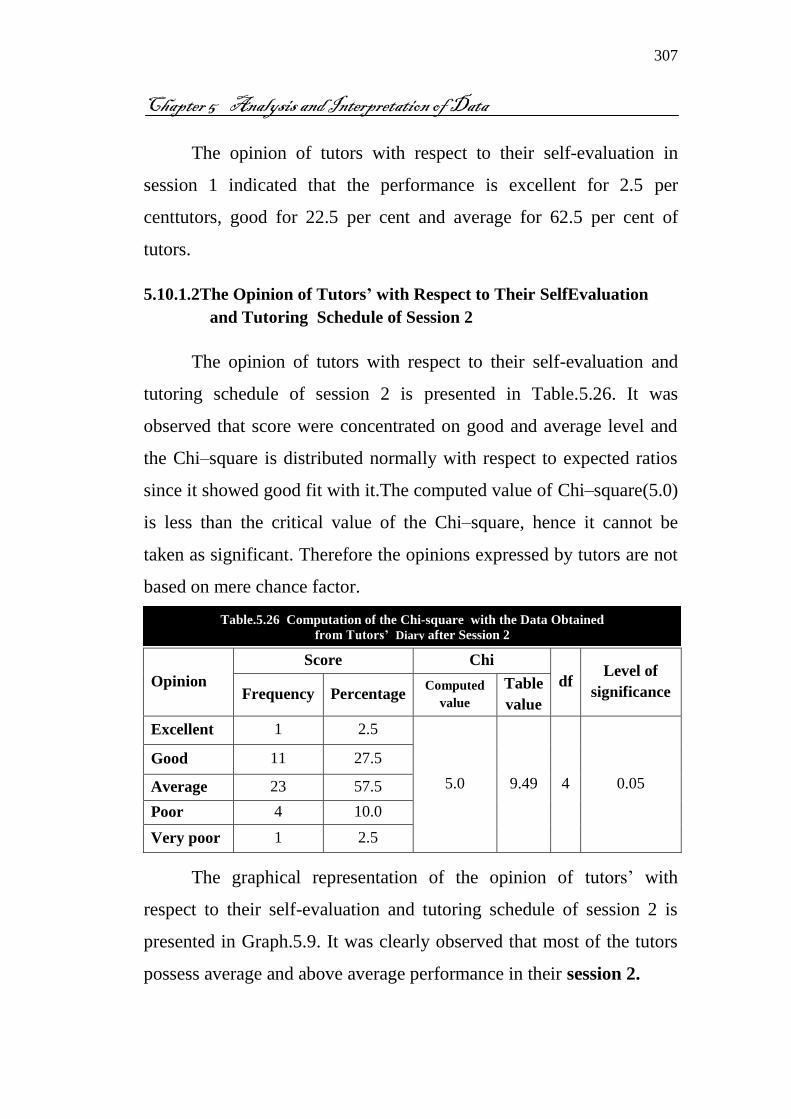
5.10.1.7 The Opinion of Tutors’ with Respect to Their Self-Evaluation
and Tutoring Schedule of Session 7
The opinion of tutors with respect to their self-evaluation and
tutoring schedule of session 7 is presented in Table.5.31. It was
observed that score were concentrated on good and average leveland
the Chi–square is distributed normally with respect to expected ratios
since it showed good fit with it.The computed value of Chi–
square(5.8)is less than the critical value of the Chi–square, hence it
0
5
10
15
20
25
30
35
40
45
Excellent Good Average Poor Very poor
5
32.5
45
15
2.5
Graph 5.13 Distribution of Responses Obtained from Tutors’Diary after Session 6
315
Chapter 5 Analysis and Interpretation of Data
cannot be taken as significant. .Therefore the opinions expressed by
tutors are not based on mere chance factor.
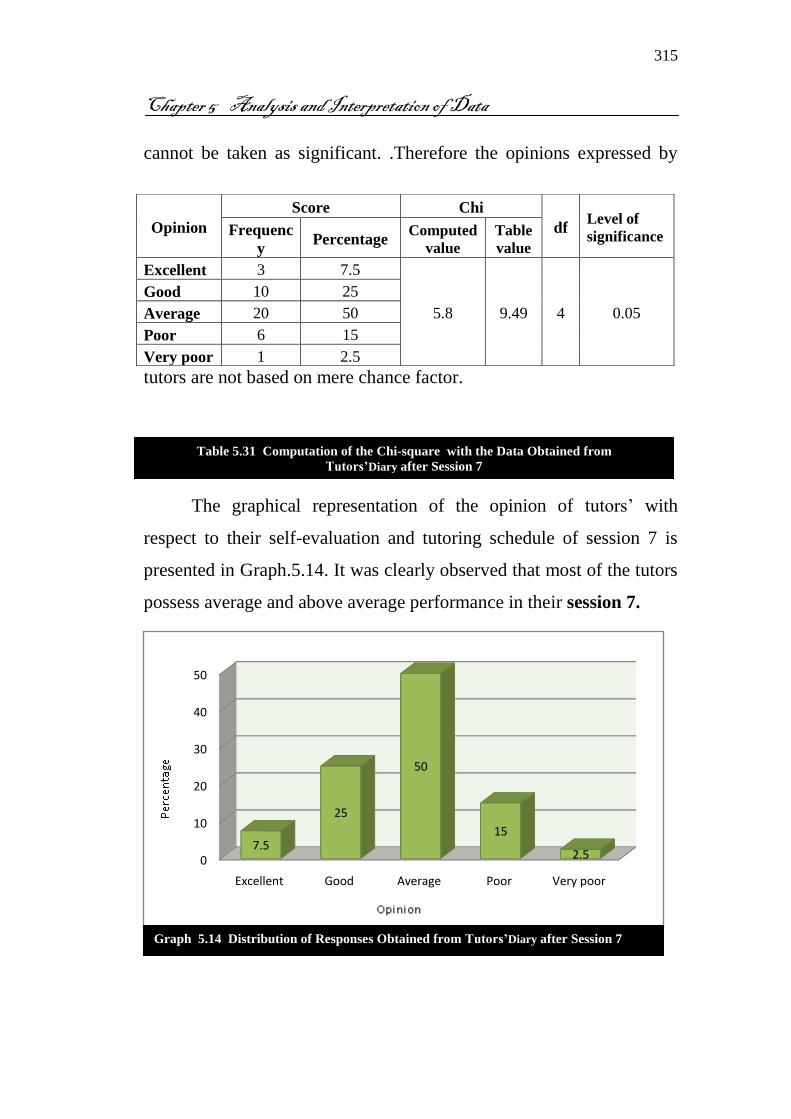
The graphical representation of the opinion of tutors’ with
respect to their self-evaluation and tutoring schedule of session 7 is
presented in Graph.5.14. It was clearly observed that most of the tutors
possess average and above average performance in their session 7.
0
10
20
30
40
50
Excellent Good Average Poor Very poor
7.5
25
50
15
2.5
Series1
Opinion
Score Chi
df Level of
significance Frequenc
y Percentage
Computed
value
Table
value
Excellent 3 7.5
5.8 9.49 4 0.05
Good 10 25
Average 20 50
Poor 6 15
Very poor 1 2.5
Table 5.31 Computation of the Chi-square with the Data Obtained from
Tutors’Diary after Session 7
Graph 5.14 Distribution of Responses Obtained from Tutors’Diary after Session 7

316
Chapter 5 Analysis and Interpretation of Data
The opinion of tutors with respect to their self-evaluation in
session 7 indicated that the performance is excellent for 7.5 per cent
tutors, good for 25 per cent and average for 50 per cent of tutors.
5.10.1.8 The Opinion of Tutors’ with Respect to Their Self-Evaluation
and Tutoring Schedule of Session 8.
The opinion of tutors with respect to their self-evaluation and
tutoring schedule of session 8 is presented in Table.5.32. It was
observed that score were concentrated on good and average level and
the Chi–square is distributed normally with respect to expected ratios
since it showed good fit with it.The computed value of Chi–square
(5.5)is less than the critical value of the Chi–square, hence it cannot be
taken as significant.Therefore the opinions expressed by tutors are not
based on mere chance factor.
The graphical representation of the opinion of tutors’ with
respect to their self-evaluation and tutoring schedule of session 8 is
presented in Graph.5.15. It was clearly observed that most of the tutors
possess average and above average performance in their session 8.
Opinion
Score Chi
df Level of
significance Frequency Percentage Computed
value
Table
value
Excellent 2 2.0
5.5 9.49 4 0.05
Good 11 27.5
Average 22 55.0
Poor 4 10.0
Very
poor 1 2.5
Table 5.32 Computation of the Chi-square with the Data Obtained from
Tutors’Diaryafter Session 8

317
Chapter 5 Analysis and Interpretation of Data
The opinion of tutors with respect to their self-evaluation in
session 8 indicated that the performance is excellent for twoper cent
tutors, good for 27.5 per cent and average for 55.0 per cent of tutors.
5.10.1.9 The Opinion of Tutors’ with Respect to Their Self-Evaluation
andTutoring Schedule of Session 9
The opinion of tutors with respect to their self-evaluation and
tutoring schedule of session 9 is presented in Table.5.33. It was
observed that score were concentrated on good and average level and
the Chi–square is distributed normally with respect to expected ratios
since it showed good fit with it. The computed value of Chi–
square(3.4) is less than the critical value of the Chi–square, hence it
cannot be taken as significant. Therefore the opinion expressed by
tutors are not based on mere chance factor.
0
10
20
30
40
50
60
Excellent Good Average Poor Very poor
2
27.5
55
102.5
Graph 5.15 Distribution of Responses Obtained from Tutors’Diary after Session 8

318
Chapter 5 Analysis and Interpretation of Data
Opinion
Score Chi
df Level of
significance Frequency Percentage Computed
value
Table
value
Excellent 1 2.5
3.4 9.49 4 0.05
Good 11 27.5
Average 22 55.0
Poor 5 12.5
Very poor 1 2.5
The graphical representation of the opinion of tutors with respect
to their self-evaluation and tutoring schedule of session 9 is presented
in Graph.5.16. It was clearly observed that most of the tutors possess
average and above average performance in their session 9.
The opinion of tutors with respect to their self-evaluation in
session 9 indicated that the performance is excellent for 2.5 per cent
tutors, good for 27.5 per cent and average for 55.0 per cent of tutors.
0
10
20
30
40
50
60
Excellent Good Average Poor Very poor
2.5
27.5
55
12.52.5
Table 5.33 Computation of the Chi-square with the Data Obtained from
Tutors’Diary after Session 9
Graph 5.16 Distribution of Responses Obtained from Tutors’Diary after Session 9

319
Chapter 5 Analysis and Interpretation of Data
5.10.1.10 The opinion of Tutors’ with Respect to Their Self-Evaluation
and Tutoring Schedule of Session 10
The opinion of tutors with respect to their self-evaluation and
tutoring schedule of session 10 is presented in Table.5.34. It was
observed that score were concentrated on good and average level
andthe Chi–square is distributed normally with respect to expected
ratios since it showed good fit with it. The computed value of Chi–
square(8.3)is less than the critical value of the Chi–square, hence it
cannot be taken as significant. Therefore the opinions expressed by
tutors are not based on mere chance factor.
The graphical representation of the opinion of tutorswith respect
to their self-evaluation and tutoring schedule of session 10 is presented
in Graph.5.17. It was clearly observed that most of the tutors possess
average and above average performance in their session 10.
Opinion
Score Chi
df Level of
significance Frequency Percentage Computed
value Table
value
Excellent 3 7.5
8.3 9.49 4 0.05
Good 10 25
Average 22 55.0
Poor 5 12.5
Very poor 0 0
Table 5.34 Computation of the Chi-square with the Data Obtained from
Tutors’ Diaryafter Session 10
320
Chapter 5 Analysis and Interpretation of Data
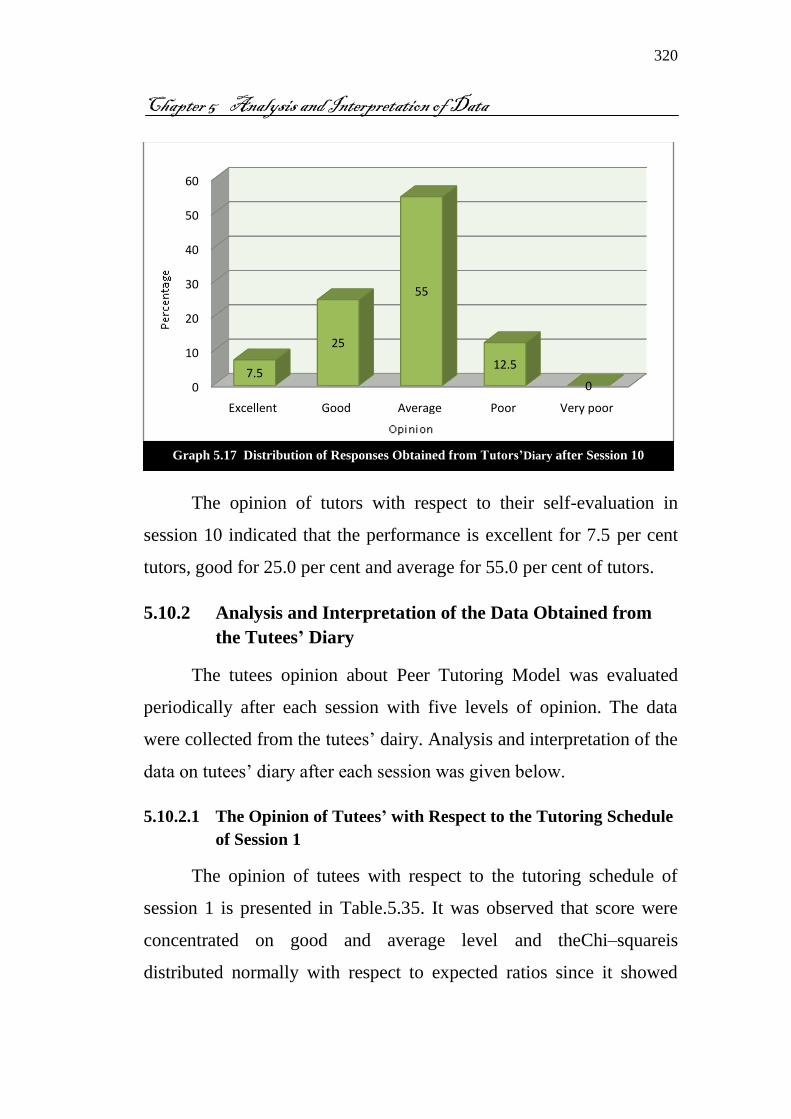
The opinion of tutors with respect to their self-evaluation in
session 10 indicated that the performance is excellent for 7.5 per cent
tutors, good for 25.0 per cent and average for 55.0 per cent of tutors.
5.10.2 Analysis and Interpretation of the Data Obtained from
the Tutees’ Diary
The tutees opinion about Peer Tutoring Model was evaluated
periodically after each session with five levels of opinion. The data
were collected from the tutees’ dairy. Analysis and interpretation of the
data on tutees’ diary after each session was given below.
5.10.2.1 The Opinion of Tutees’ with Respect to the Tutoring Schedule
of Session 1
The opinion of tutees with respect to the tutoring schedule of
session 1 is presented in Table.5.35. It was observed that score were
concentrated on good and average level and theChi–squareis
distributed normally with respect to expected ratios since it showed
0
10
20
30
40
50
60
Excellent Good Average Poor Very poor
7.5
25
55
12.5
0
Graph 5.17 Distribution of Responses Obtained from Tutors’Diary after Session 10
321
Chapter 5 Analysis and Interpretation of Data
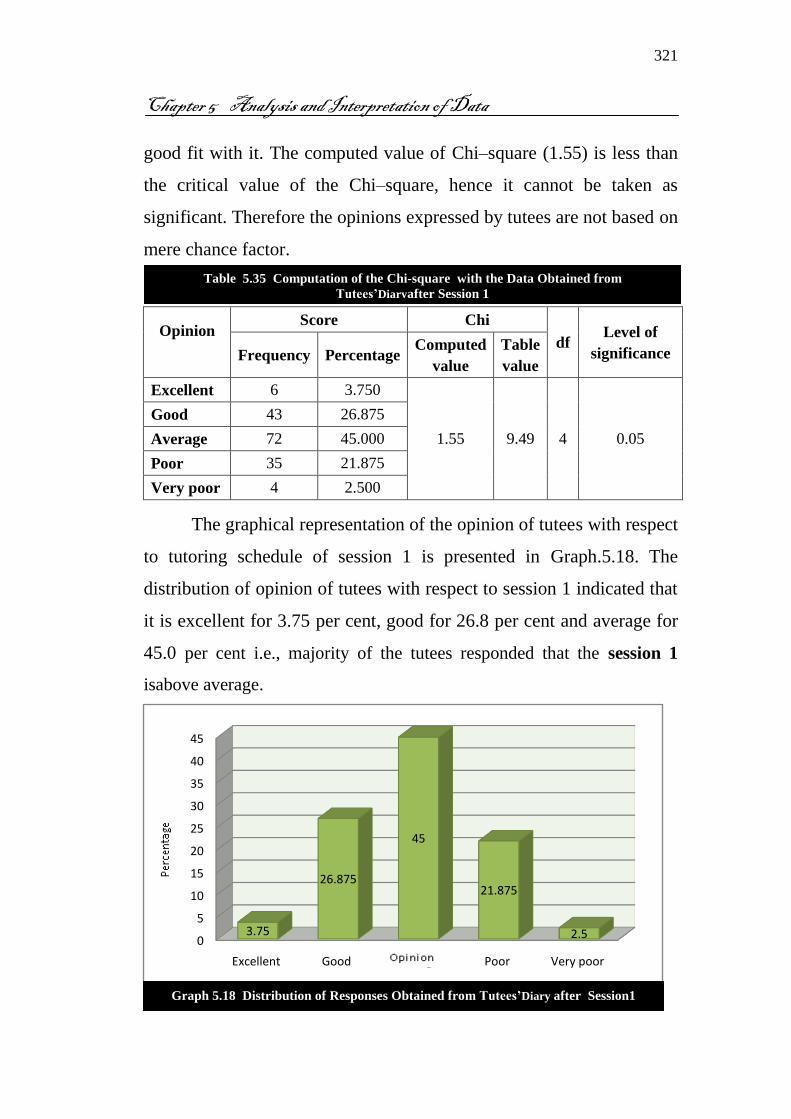
good fit with it. The computed value of Chi–square (1.55) is less than
the critical value of the Chi–square, hence it cannot be taken as
significant. Therefore the opinions expressed by tutees are not based on
mere chance factor.
Opinion
Score Chi
df Level of
significance Frequency Percentage Computed
value
Table
value
Excellent 6 3.750
1.55 9.49 4 0.05
Good 43 26.875
Average 72 45.000
Poor 35 21.875
Very poor 4 2.500
The graphical representation of the opinion of tutees with respect
to tutoring schedule of session 1 is presented in Graph.5.18. The
distribution of opinion of tutees with respect to session 1 indicated that
it is excellent for 3.75 per cent, good for 26.8 per cent and average for
45.0 per cent i.e., majority of the tutees responded that the session 1
isabove.average.
0
5
10
15
20
25
30
35
40
45
Excellent Good Average Poor Very poor
3.75
26.875
45
21.875
2.5
Table 5.35 Computation of the Chi-square with the Data Obtained from
Tutees’Diaryafter Session 1
Graph 5.18 Distribution of Responses Obtained from Tutees’Diary after Session1

322
Chapter 5 Analysis and Interpretation of Data
5.10.2.2The Opinion of Tutees’ with Respect to the Tutoring Schedule of
Session 2
The opinion of tutees with respect to the tutoring schedule of
session 2 is presented in Table.5.36. It was observed that score were
concentrated on good and average level andthe Chi–square is
distributed normally with respect to expected ratios since it showed
good fit with it. The computed value of Chi–square(2.38)is less than
the critical value of the Chi–square, hence it cannot be taken as
significant.Therefore the opinions expressed by tutees are not based on
mere chance factor.
Opinion
Score Chi
df Level of
significance Frequency Percentage Computed
value
Table
value
Excellent 8 5
2.38 9.49 4 0.05
Good 40 25
Average 73 45.63
Poor 36 22.5
Very poor 3 1.875
The graphical representation of the opinion of tutees with respect
to tutoring schedule of session 2 is presented in Graph.5.19. The
distribution of opinion of tutees with respect to session 2 indicated that
it is excellent for fiveper cent, good for 25 per cent and average for
45.6 per cent, i.e., majority of the tutees responded that the session 2 is
above average.
Table 5.36 Computation of the Chi-square with the Data Obtained
from Tutees’Diary after Session 2

323
Chapter 5 Analysis and Interpretation of Data
5.10.2.3 The Opinion of Tutees’ with Respect to the Tutoring Schedule
of Session 3.
The opinion of tutees with respect to the tutoring schedule of
session 3 is presented in Table.5.37. It was observed that score were
concentrated on good and average level and the Chi–square
isdistributed normally with respect to expected ratios since it showed
good fit with it. The computed value of Chi–square (1.34)is less than
the critical value of the Chi–square, hence it cannot be taken as
significant. Therefore the opinions expressed by tutees are not based on
mere chance factor.
Opinion
Score Chi
df Level of
significance Frequency Percentage Computed
value
Table
value
Excellent 7 4.375
1.34 9.49 4 0.05
Good 40 25.0
Average 75 46.875
Poor 32 20.0
Very poor 6 3.750
0
5
10
15
20
25
30
35
40
45
50
Excellent Good Average Poor Very poor
5
25
45.63
22.5
1.875
Graph 5.19 Distribution of Responses Obtained from Tutees’Diary after Session 2
Table 5.37 Computation of the Chi-square with the Data Obtained
from Tutees’Diaryafter Session 3

324
Chapter 5 Analysis and Interpretation of Data
The graphical representation of the opinion of tutee with respect
to tutoring schedule of session 3 is presented in Graph.5.20. The
distribution of opinion of tutees with respect to session 3 indicated that
it is excellent for 4.37 per cent, good for 25 per cent and average for
46.8 per cent, i.e., majority ofthe tutees responded that the session 3 is
above average.
5.10.2.4 The Opinion of Tutees’ with Respect to the Tutoring Schedule
of Session 4.
The opinion of tutees with respect to the tutoring schedule of
session 4 is presented in Table.5.38. It was observed that score were
concentrated on good and average level and the Chi–square is
distributed normally with respect to expected ratios since it showed
good fit with it. The computed value of Chi–square(2.30)is less than
the critical value of the Chi–square, hence it cannot be taken as
significant. Therefore the opinions expressed by tutees are not based on
mere chance factor.
0
5
10
15
20
25
30
35
40
45
50
Excellent Good Average Poor Very poor
4.375
25
46.875
20
3.75
Graph 5.20 Distribution of responses Obtained from Tutees’Diary after Session3

325
Chapter 5 Analysis and Interpretation of Data
The graphical representation of the opinion of tutees with respect
to tutoring schedule of session 4 is presented in Graph.5.21. The
distribution of opinion of tutees with respect to session 4 indicated that
it is excellent for 5.6 per cent, good for 24.37per cent and average for
45.0 per cent, i.e., majority of the tutees responded that the session 4 is
above average.
0
5
10
15
20
25
30
35
40
45
Excellent Good Average Poor Very poor
5.6
24.37
45
22.5
2.5
Opinion
Score Chi
df Level of
significance Frequency Percentage Computed
value
Table
value
Excellent 9 5.6
2.30 9.49 4 0.05
Good 39 24.37
Average 72 45.0
Poor 36 22.5
Very poor 4 2.5
Table 5.38 Computation of the Chi-square with the Data Obtained from
Tutees’Diaryafter Session 4
Graph 5.21 Distribution of Responses Obtained from Tutees’Diary after Session4

326
Chapter 5 Analysis and Interpretation of Data
5.10.2.5 The Opinion of Tutees’ with Respect to the Tutoring
Schedule of Session 5
The opinion of tutees with respect to the tutoring schedule of
session 5 is presented in Table.5.39. It was observed that score were
concentrated on good and average level and the Chi–square is
distributed normally with respect to expected ratios since it showed
good fit with it. The computed value of Chi–square (5.14) is less than
the critical value of the Chi–square; hence it cannot be taken as
significant. Therefore the opinions expressed by tutees are not based on
mere chance factor.
Opinion
Score Chi
df Level of
significance Frequency Percentage Computed
value
Table
value
Excellent 9 5.62
5.14 9.49 4 0.05
Good 39 24.37
Average 73 45.62
Poor 35 21.88
Very poor 4 2.5
The graphical representation of the opinion of tutees with respect
to tutoring schedule of session 5 is presented in Graph.5.22. The
distribution of opinion of tutees with respect to session 5 indicated that
it is excellent for 5.62 per cent, good for 24.37 per cent and average for
45.62 per cent i.e., majority of the tutees responded that the session 5 is
above average.
Table 5.39 Computation of the Chi-square with the Data Obtained from
Tutees’Diary after Session 5.

327
Chapter 5 Analysis and Interpretation of Data
5.10.2.6 The Opinion of Tutees’ with Respect to theTutoring Schedule
of Session 6
The opinion of tutees with respect to the tutoring schedule of
session 6 is presented in Table.5.40.It was observed that score were
concentrated on good and average level and the Chi–square is
distributed normally with respect to expected ratios since it showed
good fit with it. The computed value of Chi–square(3.25)is less than
the critical value of the Chi–square, hence it cannot be taken as
significant. Therefore the opinions expressed by tutees are not based on
mere chance factor.
0
5
10
15
20
25
30
35
40
45
50
Excellent Good Average Poor Very poor
5.62
24.37
45.62
21.88
2.5
Series1
Graph 5.22 Distribution of Responses Obtained from Tutees’Diary after Session 5
328
Chapter 5 Analysis and Interpretation of Data
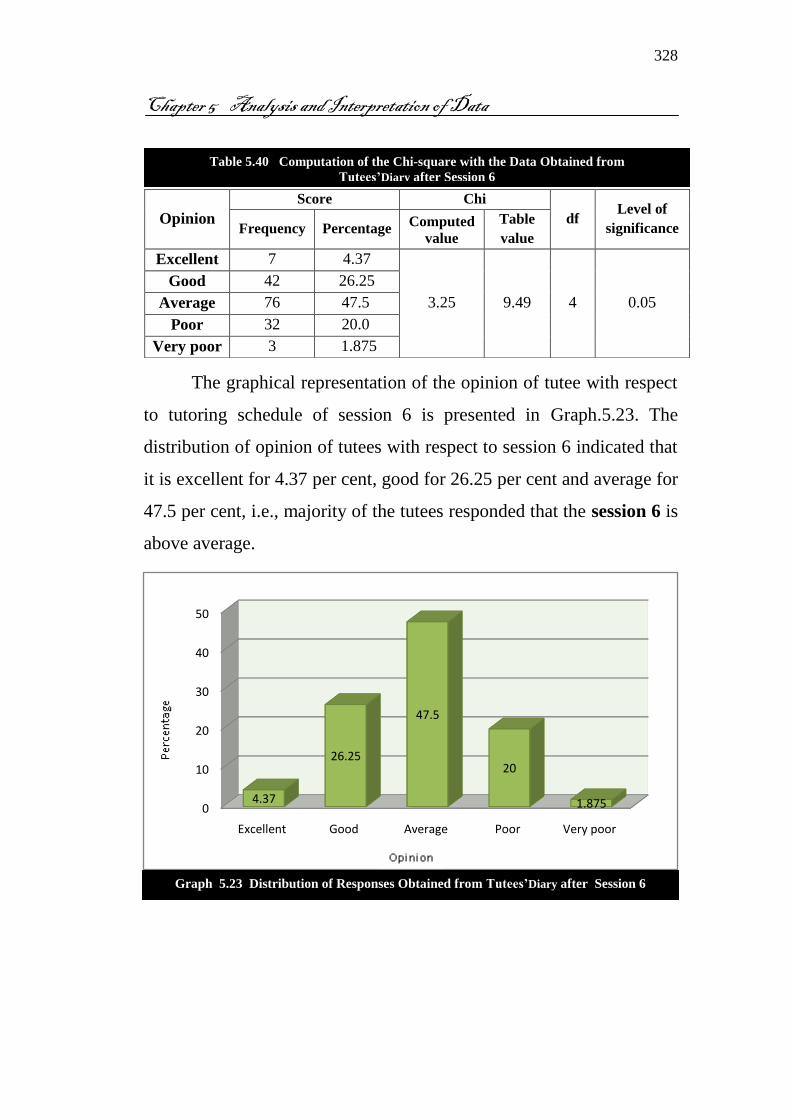
The graphical representation of the opinion of tutee with respect
to tutoring schedule of session 6 is presented in Graph.5.23. The
distribution of opinion of tutees with respect to session 6 indicated that
it is excellent for 4.37 per cent, good for 26.25 per cent and average for
47.5 per cent, i.e., majority of the tutees responded that the session 6 is
above average.
0
10
20
30
40
50
Excellent Good Average Poor Very poor
4.37
26.25
47.5
20
1.875
Opinion
Score Chi
df Level of
significance Frequency Percentage Computed
value
Table
value
Excellent 7 4.37
3.25 9.49 4 0.05
Good 42 26.25
Average 76 47.5
Poor 32 20.0
Very poor 3 1.875
Table 5.40 Computation of the Chi-square with the Data Obtained from
Tutees’Diary after Session 6
Graph 5.23 Distribution of Responses Obtained from Tutees’Diary after Session 6

329
Chapter 5 Analysis and Interpretation of Data
5.10.2.7 The Opinion of Tutees’ with Respect to the Tutoring
Schedule of Session 7
The opinion of tutees with respect to the tutoring schedule of
session 7 is presented in Table. 5.41. It was observed that score were
concentrated on good and average level and the Chi–square is
distributed normally with respect to expected ratios since it showed
good fit with it. The computed value of Chi–square(1.82)is less than
the critical value of the Chi–square, hence it cannot be taken as
significant. Therefore the opinions expressed by tutees are not based on
mere chance factor.
The graphical representation of the opinion of tutees with respect
to tutoring schedule of session 7 is presented in Graph.5.24. The
distribution of opinion of tutees with respect to session 7 indicated that
it is excellent for fiveper cent, good for 26.8 per cent and average for
45.62 per cent, i.e., majority ofthe tutees responded that the session 7 is
above average.
Opinion
Score Chi
df Level of
significance Frequency Percentage Computed
value
Table
value
Excellent 8 5.0
1.82 9.49 4 0.05
Good 43 26.875
Average 73 45.625
Poor 33 20.625
Very poor 3 1.874
Table.5.41 Computation of the Chi-square with the Data Obtained from
Tutees’Diary after Session 7

330
Chapter 5 Analysis and Interpretation of Data
5.10.2.8 The Opinion of Tutees’ with Respect to the Tutoring Schedule
of Session 8
The opinion of tutees with respect to the tutoring schedule of
session 8 is presented in Table.5.42. It was observed that score were
concentrated on good and average level and the Chi–square is
distributed normally with respect to expected ratios since it showed
good fit with it. The computed value of Chi–square(2.98)is less than
the critical value of the Chi–square, hence it cannot be taken as
significant. Therefore the opinions expressed by tutees are not based on
mere chance factor.
0
10
20
30
40
50
Excellent Good Average Poor Very poor
5
26.875
45.625
20.625
1.874
Graph 5.24 Distribution of Responses Obtained from Tutees’Diary after Session 7

331
Chapter 5 Analysis and Interpretation of Data
Opinion
Score Chi
df Level of
significance Frequency Percentage
Computed
value
Table
value
Excellent 9 5.625
2.98 9.49 4 0.05
Good 40 25.00
Average 74 46.25
Poor 33 20.62
Very poor 4 2.5
The graphical representation of the opinion of tutees with respect
to tutoring schedule of session 8 is presented in Graph.5.25. The
distribution of opinion of tutees with respect to session 8 indicated that
it is excellent for 5.62 per cent, good for 25 per cent and average for
46.25 per cent, i.e., majority of the tutees responded that the session 8
is above average.
0
10
20
30
40
50
Excellent Good Average Poor Very poor
5.625
25
46.25
20.62
2.5
Table 5.42 Computation of the Chi-square with the Data Obtained from
Tutees’ Diary after Session 8
Graph 5. 25 Distribution of Responses Obtained from Tutees’Diary after Session 8
332
Chapter 5 Analysis and Interpretation of Data
5.10.2.9 The Opinion of Tutees’ with Respect to the Tutoring Schedule
of Session 9
The opinion of tutees with respect to the tutoring schedule of
session 9 is presented in Table.5.43. It was observed that score were
concentrated on good and average level and the Chi–square is
distributed normally with respect to expected ratios since it showed
good fit with it. The computed value of Chi–square(1.56 )is less than
the critical value of the Chi–square, hence it cannot be taken as
significant. Therefore the opinions expressed by tutees are not based on
mere chance factor.
Opinion
Score Chi
df Level of
significance Frequency Percentage Computed
value
Table
value
Excellent 6 3.750
1.56 9.49 4 0.05
Good 42 26.25
Average 74 46.25
Poor 34 21.25
Very poor 4 2.5
The graphical representation of the opinion of tutees with respect
to tutoring schedule of session 9 is presented in Graph.5.26. The
distribution of opinion of tutees with respect to session 9 indicated that
it is excellent for 3.75 per cent, good for 26.25 per cent and average for
46.25 per cent, i.e., majority of the tutees responded that the session 9
is above average.
Table 5.43 Computation of the Chi-square with the Data Obtained from
Tutees’Diaryafter Session 9

333
Chapter 5 Analysis and Interpretation of Data
5.10.2.10 The Opinion of Tutees’ with respect to the Tutoring
Schedule of Session 10
The opinion of tutees with respect to the tutoring schedule of
session 10 is presented in Table.5.44. It was observed that score were
concentrated on good and average level and the Chi–square is
distributed normally with respect to expected ratios since it showed
good fit with it. The computed value of Chi–square(2.55)is less than
the critical value of the Chi–square, hence it cannot be taken as
significant. Therefore the opinions expressed by tutees are not based on
mere chance factor.
0
10
20
30
40
50
Excellent Good Average Poor Very poor
3.75
26.25
46.25
21.25
2.5
Graph 5.26 Distribution of responses obtained from Tutees’Diary after Session 9

334
Chapter 5 Analysis and Interpretation of Data
The graphical representation of the opinion of tutee with respect
to tutoring schedule of session 10 is presented in Graph.5.27. The
distribution of opinion of tutees with respect to session 10 indicated
that it is excellent for 3.75 per cent, good for 27.5 per cent and average
for 44.3per cent i.e., majority of the tutees responded that the session10
is above average.
0
5
10
15
20
25
30
35
40
45
Excellent Good Average Poor Very poor
3.75
27.5
44.3
22.5
1.875
Opinion
Score Chi
df Level of
significance Frequency Percentage Computed
value
Table
value
Excellent 6 3.750
2.55 9.49 4 0.05
Good 44 27.5
Average 71 44.3
Poor 36 22.5
Very poor 3 1.875
Table 5.44 Computation of the Chi-square with the Data obtained
fromTutees’Diary after Session 10
Graph 5.27 Distribution of Responses Obtained from Tutees’Diary after Session 10

335
Chapter 5 Analysis and Interpretation of Data
5.10.3 Analysis and Interpretation of the Opinion of Experts
Regarding the Effectiveness of Peer Tutoring Model
The experts’ opinion about Peer Tutoring Model was evaluated
after the completion of the peer tutoring. A check-list containing 10
statement regarding different aspects of peer tutoring was examined by
50 experts and their critical opinion were grouped with five levels of
classes like 'very high', 'high', 'moderate', 'low' and 'none'. The data
collected were analysed, interpreted and presented in following tables
and graphs.
5.10.3.1 Experts’ Opinion about Statement 1.
“At what level of subject knowledge and grade level was the
students performancebefore tutoring?”
Regarding experts’ opinion about the subject knowledge and
grade level attainment of students before tutoring is categorized in to
'very high', 'high', 'moderate', 'low' and 'none'. Twoper cent of the
experts opined that there is very high level of attainment, 26 per cent is
of opinion that there is high level of attainment, 48 per cent supports
the view that there is moderate level of attainment and 20 per cent
observed low level of attainment and four per cent were neutral in
opinion. The Chi-square distribution of the data showed good fit with
normal (Table.5.45). The computed value of Chi-square(0.95 )is less
than the critical value of the Chi–square, hence it cannot be taken as
significant. Therefore the opinions expressed by experts are not based
on mere chance factor.

336
Chapter 5 Analysis and Interpretation of Data
Opinion
Score Chi
df Level of
significance Frequency Percentage Computed
value
Table
value
Very high 1 2
0.95 9.49 4 0.05
High 13 26
Moderate 24 48
Low 10 20
None 2 4
Graphical representation of the data regarding the subject
knowledge and grade level attainment of students before tutoring
clearly indicating the dominance of positive responses especially at
moderate and high levels (Graph 5.28).
0
5
10
15
20
25
30
35
40
45
50
Very high High Moderate Low None
2
26
48
20
4
Table 5.45 Computation of the Chi-square with the Data Obtained from
Experts Evaluation Regarding the Model of PeerTutoring on the Basis of Statement 1
Graph 5.28 Opinion of Experts Evaluation Regarding the Model of PeerTutoring
on the Basis of Statement 1

337
Chapter 5 Analysis and Interpretation of Data
5.10.3.2 Experts’ Opinion about Statement 2
“To what extent did the students self-concept improve due to
peer tutoring?”
Regarding self-concept 50 per cent of the expert is of opinion
that there is moderate improvement in self-concept after peer tutoring.
Twenty eightper cent opined that there is high level of improvement,
twoper cent opined that there is very high level of improvement, 18 per
cent supports low improvement and twoper cent is neutral. The Chi-
square distribution of the data showed good fit with normal
(Table.5.46). The computed value of Chi–square(1.75)is less than the
critical value of the Chi–square, hence it cannot be taken as significant.
Therefore the opinions expressed by experts are not based on mere
chance factor.
Opinion
Score Chi
df Level of
significance Frequency Percentage Compute
d value
Table
value
Very high 1 2
1.75 9.49 4 0.05
High 14 28
Moderate 25 50
Low 9 18
None 1 2
Graphical representation of the data regarding the model of
peer tutoring on the basis of self-concept of students after tutoring
clearly indicating the dominance of positive responses of experts
especially at moderate and high levels (Graph 5.29).
Table 5.46- Computation of the Chi-square with the Data Obtained from Experts
Evaluation Regarding the Model of Peer Tutoring on the Basis of Statement 2

338
Chapter 5 Analysis and Interpretation of Data
5.10.3.3 Experts’ Opinion about Statement 3
“To what extent did the peer tutoring improve the students study
skills?”
Regarding study skills 48 per cent of the expertsare of opinion
that there is moderate improvement in study skills after peer tutoring.
Twenty eightper cent opined that there is high level of improvement,
sixper cent opined that there is very high level of improvement and 18
per cent supports low improvement. The Chi-square distribution of the
data showed good fit with normal. The computed value of Chi–
square(4.37)is less than the critical value of the Chi–square, hence it
cannot be taken as significant.Therefore the opinions expressed by
tutors are not based on mere chance factor (Table.5.47).
0
10
20
30
40
50
Very high High Moderate Low None
2
28
50
18
2
Graph 5.29 Opinion of Experts Evaluation Regarding the Model of PeerTutoring
on the Basis of Statement 2
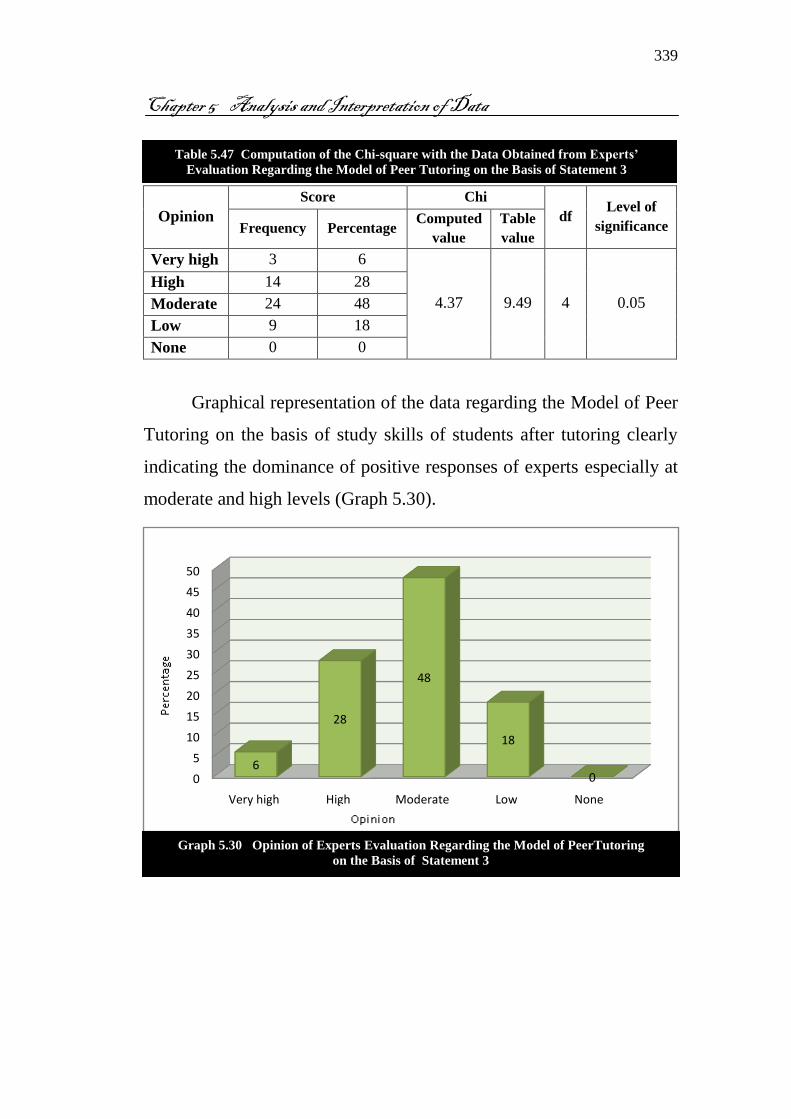
339
Chapter 5 Analysis and Interpretation of Data
Opinion
Score Chi
df Level of
significance Frequency Percentage Computed
value
Table
value
Very high 3 6
4.37 9.49 4 0.05
High 14 28
Moderate 24 48
Low 9 18
None 0 0
Graphical representation of the data regarding the Model of Peer
Tutoring on the basis of study skills of students after tutoring clearly
indicating the dominance of positive responses of experts especially at
moderate and high levels (Graph 5.30).
0
5
10
15
20
25
30
35
40
45
50
Very high High Moderate Low None
6
28
48
18
0
Table 5.47 Computation of the Chi-square with the Data Obtained from Experts’
Evaluation Regarding the Model of Peer Tutoring on the Basis of Statement 3
Graph 5.30 Opinion of Experts Evaluation Regarding the Model of PeerTutoring
on the Basis of Statement 3
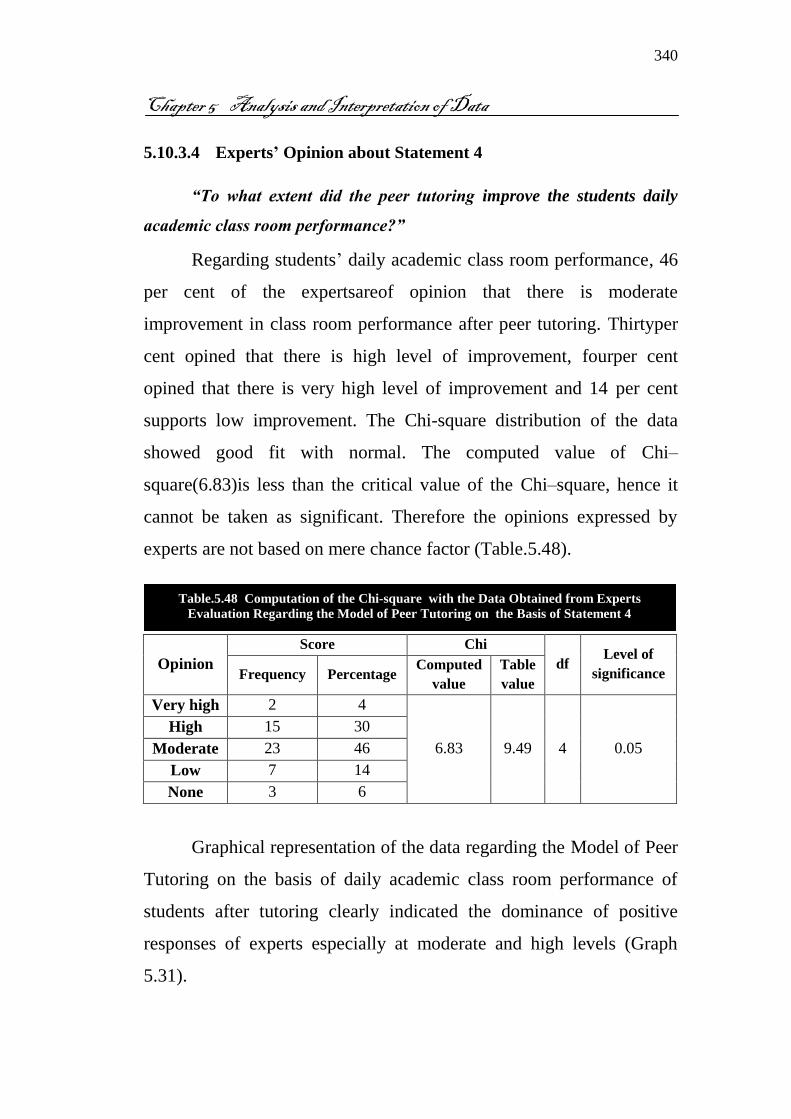
340
Chapter 5 Analysis and Interpretation of Data
5.10.3.4 Experts’ Opinion about Statement 4
“To what extent did the peer tutoring improve the students daily
academic class room performance?”
Regarding students’ daily academic class room performance, 46
per cent of the expertsareof opinion that there is moderate
improvement in class room performance after peer tutoring. Thirtyper
cent opined that there is high level of improvement, fourper cent
opined that there is very high level of improvement and 14 per cent
supports low improvement. The Chi-square distribution of the data
showed good fit with normal. The computed value of Chi–
square(6.83)is less than the critical value of the Chi–square, hence it
cannot be taken as significant. Therefore the opinions expressed by
experts are not based on mere chance factor (Table.5.48).
Opinion
Score Chi
df Level of
significance Frequency Percentage Computed
value
Table
value
Very high 2 4
6.83 9.49 4 0.05
High 15 30
Moderate 23 46
Low 7 14
None 3 6
Graphical representation of the data regarding the Model of Peer
Tutoring on the basis of daily academic class room performance of
students after tutoring clearly indicated the dominance of positive
responses of experts especially at moderate and high levels (Graph
5.31).
Table.5.48 Computation of the Chi-square with the Data Obtained from Experts
Evaluation Regarding the Model of Peer Tutoring on the Basis of Statement 4

341
Chapter 5 Analysis and Interpretation of Data
5.10.3.5 Experts’Opinion about Statement 5
“To what extent did the peer tutoring improve the students
achievement motivation towards academic achievement?”
Regarding students’ achievement motivation 46 per cent of the
expertsareof opinion that there is moderate improvement in motivation
after peer tutoring. Thirtyper cent opined that there is high level of
improvement, 6 per cent opined that there is very high level of
improvement and 18per cent supports low improvement. The Chi-
square distribution of the data showed good fit with normal .The
computed value of Chi–square(2.5)is less than the critical value of the
Chi–square, hence it cannot be taken as significant. Therefore the
opinions expressed by tutors are not based on mere chance factor
(Table.5.49).
0
5
10
15
20
25
30
35
40
45
50
Very high High Moderate Low None
4
30
46
146
Graph 5.31 Opinion of Experts Evaluation Regarding the Model of PeerTutoring
on the Basis of Statement 4

342
Chapter 5 Analysis and Interpretation of Data
Graphical representation of the data regarding the Model of Peer
Tutoring on the basis of achievement motivation of students after
tutoring clearly indicated the dominance of positive responses of
experts especially at moderate and high levels (Graph 5.32).
0
10
20
30
40
50
Very high High Moderate Low None
6
30
46
18
0
Opinion
Score Chi
df Level of
significance Frequency Percentage Computed
value
Table
value
Very high 3 6
2.5 9.49 4 0.05
High 15 30
Moderate 23 46
Low 9 18
None 0 0
Table 5.49 Computation of the Chi-square with the DataObtained from Experts
Evaluation Regarding the Model of Peer Tutoring on the Basis of Statement 5
Graph 5.32 Opinion of Experts EvaluationRegarding the Model of
PeerTutoring on the Basis of Statement 5
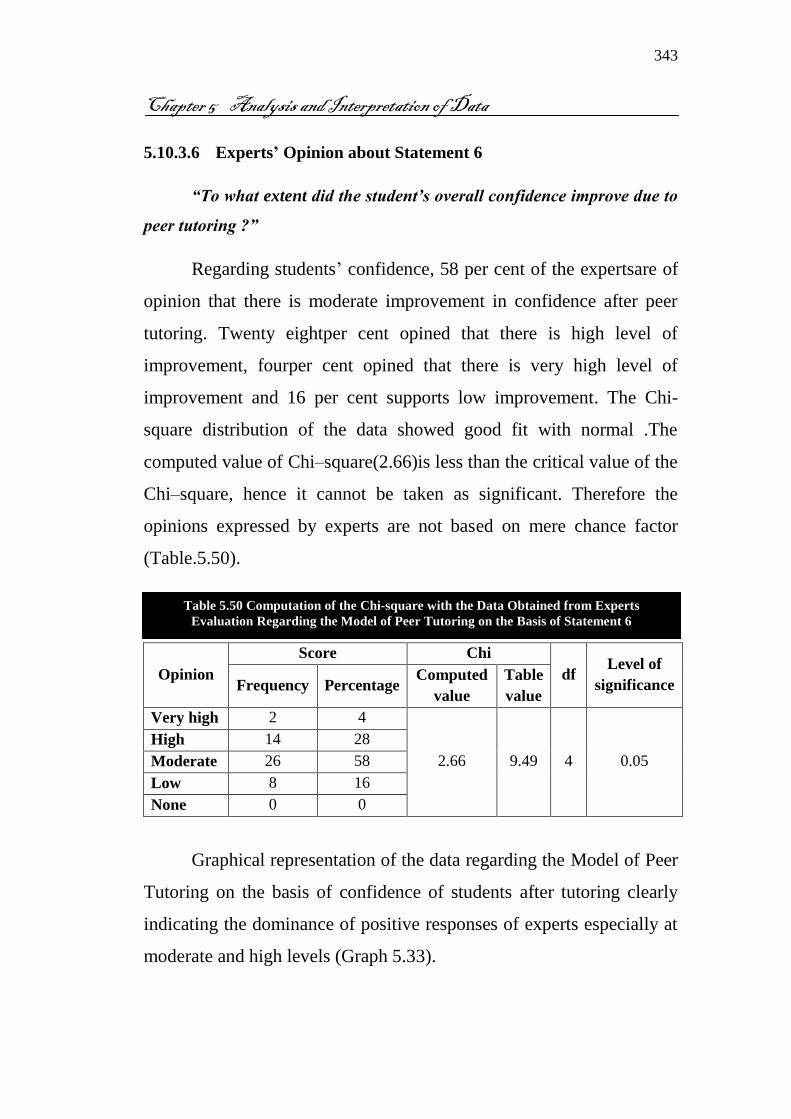
343
Chapter 5 Analysis and Interpretation of Data
5.10.3.6 Experts’ Opinion about Statement 6
“To what extent did the student’s overall confidence improve due to
peer tutoring ?”
Regarding students’ confidence, 58 per cent of the expertsare of
opinion that there is moderate improvement in confidence after peer
tutoring. Twenty eightper cent opined that there is high level of
improvement, fourper cent opined that there is very high level of
improvement and 16 per cent supports low improvement. The Chi-
square distribution of the data showed good fit with normal .The
computed value of Chi–square(2.66)is less than the critical value of the
Chi–square, hence it cannot be taken as significant. Therefore the
opinions expressed by experts are not based on mere chance factor
(Table.5.50).
Opinion
Score Chi
df Level of
significance Frequency Percentage Computed
value
Table
value
Very high 2 4
2.66 9.49 4 0.05
High 14 28
Moderate 26 58
Low 8 16
None 0 0
Graphical representation of the data regarding the Model of Peer
Tutoring on the basis of confidence of students after tutoring clearly
indicating the dominance of positive responses of experts especially at
moderate and high levels (Graph 5.33).
Table 5.50 Computation of the Chi-square with the Data Obtained from Experts
Evaluation Regarding the Model of Peer Tutoring on the Basis of Statement 6

344
Chapter 5 Analysis and Interpretation of Data
5.10.3.7 Experts’ Opinion about Statement 7
“To what extent did the students interest in Mathematics improve
due to peer tutoring ?”
Regarding students’ ability to logical thinking 52 percent of the
expertsare of opinion that there is moderate improvement in confidence
after peer tutoring. Twenty fourper cent opined that there is high level
of improvement, eightper cent opined that there is very high level of
improvement and 16 per cent supports low improvement. The Chi-
square distribution of the data showed good fit with normal. The
computed value of Chi–square(4.72)is less than the critical value of the
Chi–square, hence it cannot be taken as significant. Therefore the
opinions expressed by tutors are not based on mere chance factor
(Table.5.51).
0
10
20
30
40
50
60
Very high High Moderate Low None
4
28
58
16
0
Graph 5.33 Opinion of Experts Evaluation Regarding the Model of PeerTutoring
on the Basis of Statement 6

345
Chapter 5 Analysis and Interpretation of Data
Graphical representation of the data regarding the Model of Peer
Tutoring on the basis of logical thinking of students after tutoring
clearly indicated the dominance of positive responses of experts
especially at moderate and high levels (Graph 5.34).
0
10
20
30
40
50
60
Very high High Moderate Low None
8
24
52
16
0
Opinion
Score Chi
df Level of
significance Frequency Percentage Computed
value
Table
value
Very high 4 8
4.72 9.49 4 0.05
High 12 24
Moderate 26 52
Low 8 16
None 0 0
Table 5.51 Computation of the Chi-square with the Data Obtained from
Experts Evaluation Regarding the Model of Peer Tutoring on the Basis of Statement 7
Graph 5.34 Opinion of Experts Evaluation Regarding the Model of Peer Tutoring
on the Basis of Statement 7

346
Chapter 5 Analysis and Interpretation of Data
5.10.3.8 Experts’ Opinion about Statement 8
“To what extent has the socio- economic status of a student
influenced his adaptability towards peer tutoring programme?”
Regarding the influence of socio-economic status to the
adaptability to peer tutoring programme, 52 per cent of the expertsare
of opinion that there is moderate influence of SES on peer tutoring
while 30 per cent opined that there is high influence, fourper cent
opined very high level of influence and 14 per cent supported low
influence. The Chi-square distribution of the data showed good fit with
normal. The computed value of Chi–square (4.22) is less than the
critical value, hence it cannot be taken as significant.Therefore the
opinions expressed by experts are not based on mere chance factor
(Table.5.52).
Opinion
Score Chi
df Level of
significance Frequency Percentage Computed
value
Table
value
Very high 2 4
4.22 9.49 4 0.05
High 15 30
Moderate 26 52
Low 7 14
None 0 0
Graphical representation of the data regarding opinion of experts
with respect to the Model of Peer Tutoring on the basis of socio-
economic status of students after tutoring clearly indicated the
dominance of positive responses of experts especially at moderate and
high levels (Graph 5.35).
Table 5.52 Computation of the Chi-square with the Data Obtained from
Experts Evaluation Regarding the Model of Peer Tutoring on the Basis of Statement 8
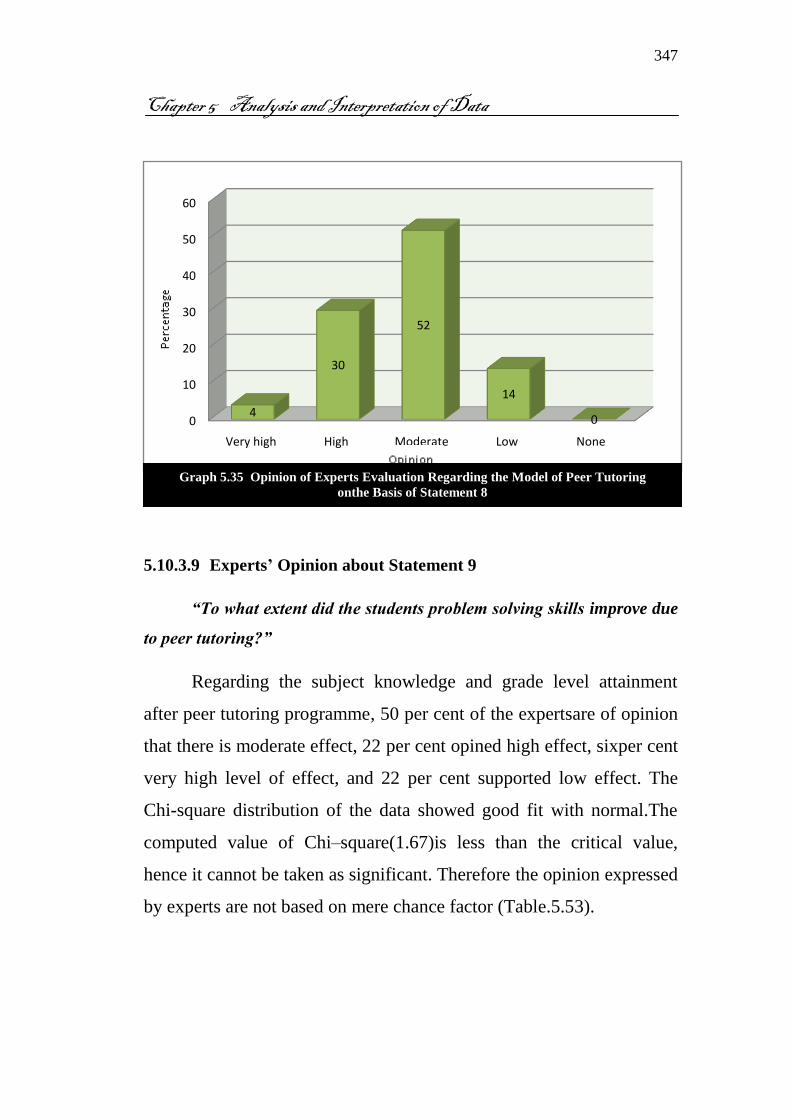
347
Chapter 5 Analysis and Interpretation of Data
5.10.3.9 Experts’ Opinion about Statement 9
“To what extent did the students problem solving skills improve due
to peer tutoring?”
Regarding the subject knowledge and grade level attainment
after peer tutoring programme, 50 per cent of the expertsare of opinion
that there is moderate effect, 22 per cent opined high effect, sixper cent
very high level of effect, and 22 per cent supported low effect. The
Chi-square distribution of the data showed good fit with normal.The
computed value of Chi–square(1.67)is less than the critical value,
hence it cannot be taken as significant. Therefore the opinion expressed
by experts are not based on mere chance factor (Table.5.53).
0
10
20
30
40
50
60
Very high High Moderate Low None
4
30
52
14
0
Graph 5.35 Opinion of Experts Evaluation Regarding the Model of Peer Tutoring
onthe Basis of Statement 8
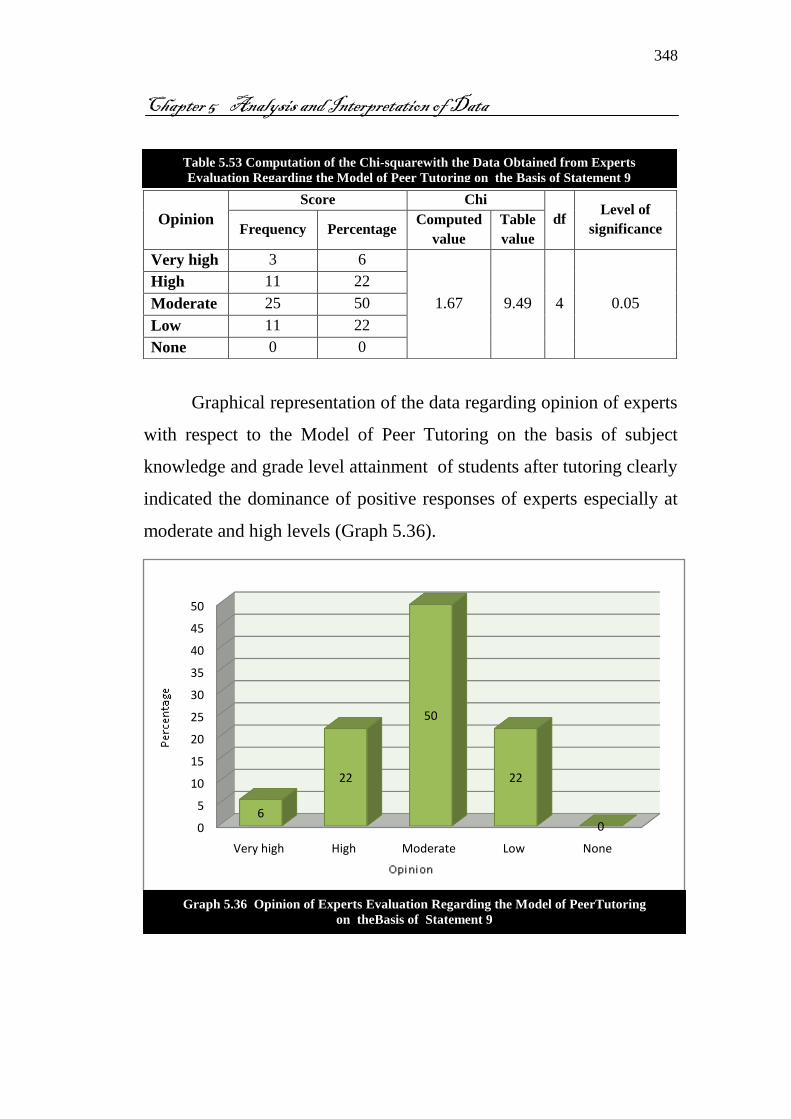
348
Chapter 5 Analysis and Interpretation of Data
Graphical representation of the data regarding opinion of experts
with respect to the Model of Peer Tutoring on the basis of subject
knowledge and grade level attainment of students after tutoring clearly
indicated the dominance of positive responses of experts especially at
moderate and high levels (Graph 5.36).
0
5
10
15
20
25
30
35
40
45
50
Very high High Moderate Low None
6
22
50
22
0
Opinion
Score Chi
df Level of
significance Frequency Percentage Computed
value
Table
value
Very high 3 6
1.67 9.49 4 0.05
High 11 22
Moderate 25 50
Low 11 22
None 0 0
Table 5.53 Computation of the Chi-squarewith the Data Obtained from Experts
Evaluation Regarding the Model of Peer Tutoring on the Basis of Statement 9
Graph 5.36 Opinion of Experts Evaluation Regarding the Model of PeerTutoring
on theBasis of Statement 9

349
Chapter 5 Analysis and Interpretation of Data
5.10.3.10 Experts’ Opinion about Statement 10
“To what extent did the educational values improve due to peer
tutoring programme ?”
Regarding the opinion of experts about peer tutoring
programme, 48 per cent of the expertsare of opinion that the system is
of moderate importance, 24 per cent opined high importance, 10 per
cent very high level of importance, and 16 per cent supported low
importance. The Chi-square distribution of the data showed good fit
with normal.The computed value of Chi–square (5.87)is less than the
critical value, hence it cannot be taken as significant. Therefore the
opinions expressed by experts are not based on mere chance factor
(Table.5.54).
Opinion
Score Chi
df Level of
significance Frequency Percentage Computed
value
Table
value
Very high 5 10
5.87 9.49 4 0.05
High 12 24
Moderate 24 48
Low 8 16
None 1 2
Graphical representation of the data regarding opinion of experts
with respect to the importance of the Model of Peer Tutoring clearly
indicated the dominance of positive responses of experts especially at
moderate and high levels (Graph 5.37).
Table 5.54 Computation of the Chi-square with the Data Obtained from Experts Evaluation
Regarding the Model of Peer Tutoring on the Basis of Statement 10

350
Chapter 5 Analysis and Interpretation of Data
5.11 EVALUATION OF TUTORS’ SKILL BY THE RESEARCHER
When the peer tutoring programme was going on, the researcher
evaluated the tutors’ skill. She used a check-list containing 25 items to
identify the tutors’ skill in handling peer tutoring sessions. She
observed that tutors fall under three categories, excellent with 35
percentof tutors, very good with 37.5 per cent, good with 27.5 per cent,
and fair with the least (2.5 per cent). The data indicated that all the
tutors are competent in handling the sessions (Table.5.55).
Category Score Frequency Percentage
Poor 1-25 0 0
Fair 25-50 1 2.5
Good 50-75 10 25
Very good 75-100 15 37.5
Excellent 100-125 14 35
Total 40 100
0
10
20
30
40
50
Very high High Moderate Low None
10
24
48
16
2
Graph 5.37 Opinion of Experts Evaluation Regarding the Modelof Peer Tutoring
on the Basis of Statement 10
Table. 5.55 Researcher’s Evaluation about the Tutors’ Skill

351
Chapter 5 Analysis and Interpretation of Data
The graphical representation of the data on competency of tutors
indicated that the distribution of frequency are all in the positive levels;
with none at poor level.
5.12 CONCLUSION
Research data becomes meaningful in the process of being
analyzed and interpreted. The purpose of analysis is to build upon
intellectual model that explains the relationships between various
variables. The data after collection has to be processed at the time of
developing the research plan. The analysed data is then synthesized in
such a way that hypotheses may be verified or rejected. A tentative
plan for the analysis of the research result is very important because
this plan may have a considerable bearing upon the number of subjects
needed. The summary of findings and the detailed discussion of results
are given in the next chapter.
0
5
10
15
20
25
30
35
40
Poor Fair Good Very good Excellent
02.5
25
37.535
Graph 5.38 Researcher’s Evaluation about the Tutors’ Skill