analysis of 2011 survey - area 12
TRANSCRIPT

Prepared by:
© DecisionWise, Inc. All Rights Reserved.
Analysis of 2011 Survey

© DecisionWise, Inc. All Rights Reserved. 2
Executive Summary
Demographics The Area 12 survey was completed by 1410 participants from five
counties, including Tuolumne, Amador, Calaveras, Mariposa. 69% of the respondents were women.
Half of the respondents are married, 66% live in a house and 61% don’t live alone.
Wellness According to the data, the majority of respondents are happy.
Approximately 45% have no trouble remembering and 62% reported having good health overall.
Arthritis was the highest reported chronic health problem.
Money The greatest source of income is Social Security. Respondent’s
number one concern was having enough money to live on and 63% still need to work for sufficient income.

© DecisionWise, Inc. All Rights Reserved. 3
Executive Summary (continued)
Healthcare Medicare is the most common type of health insurance and 57% report
having adequate post-retirement health care. The number one health concern among participants is paying for health
care, dental care and prescriptions. 35% of respondents visit the doctor 2-3 times each year.
Activities Respondents have no difficulty with basic activities, such as eating, using
the toilet and dressing. The activities they have serious difficulty with and need help are home
repairs/ maintenance, heavy housework and stairs. Immediate family members help the most with these activities, 58% of
whom are not paid.

© DecisionWise, Inc. All Rights Reserved. 4
Services The service most used by respondents is by far that of a handyman. The most significant services noted as not available include Alive Driver,
adult day care and transportation.
Caregivers Caregivers are generally caring for an immediate family member: parent,
spouse, son or daughter. The majority of caregivers spend 20+ hours each week on caregiving
activities.
Executive Summary (continued)

© DecisionWise, Inc. All Rights Reserved. 5
Methodology
The Area 12 Agency on Aging, established as a five county Joint Powers Agency in 1988, provides services to approximately 11,000 older adults. It is part of an aging network which includes 33 Area Agencies on Aging statewide and over 675 nationwide. A survey was distributed in 2011 and was completed by 1410 participants
from four counties.Survey information was entered into an electronic data base and analyzed
using the Statistical Package for Social Sciences (SPSS) by consultants and project managers at DecisionWise, Inc. (www.decision-wise.com).The survey was comprised of several quantitative, as well as qualitative,
response options.Analysis was conducted on an individual item basis, which created varied
visual representations (i.e. bar graphs, pie-charts, etc.). This report summarizes the data presented in the survey and does not
extrapolate or make interpretations as to the application of information.

© DecisionWise, Inc. All Rights Reserved. 6
Contents
Section (Survey Questions) Slide #I. Background Information (1-22) 7-26II. Health and Wellness (23-27) 27-33III. Activities (28-31) 34-39IV. Needs & Concerns (32-34) 40-48V. Services Used (35-38) 49-54VI. Staying Healthy (39-45) 55-62VII. Caregivers (46-60) 63-71

© DecisionWise, Inc. All Rights Reserved. 7
Background InformationSURVEY QUESTIONS 1 - 22

© DecisionWise, Inc. All Rights Reserved. 8
Location: County & Zip Code
Frequency Percentage
427 32%
397 30%
255 19%
219 16%
21 2%
15 44%
1334 100%
County 7. Zip Code
Of the 1410 survey respondents, 1334 provided a valid zip code. The largest percent of these reside in Tuolumne County (32%), followed by Amador County (30%) and Calaveras (19%). Cities with the most respondents include Mariposa, then Sonora in Tuolumne County, followed by Jackson in Amador County.

© DecisionWise, Inc. All Rights Reserved. 9
Age & Gender
Frequency Percentage
39 3%
79 6%
185 13%
220 16%
235 17%
207 15%
210 15%
202 15%
1377 100%
69% of the respondents are female. Respondents’ ages cover a wide distribution and include every age group from 50 to over 85. Only 9% reported being under age 60. 22% of respondents are veterans.
3. Gender2. Age
Frequency Percentage
893 69%
407 31%
1300 100%

© DecisionWise, Inc. All Rights Reserved. 10
Ethnicity & Language
Frequency Percentage
23 2%
46 3%
6 0%
1218 91%
3 0%
3 0%
39 3%
1338 100%
The vast majority of respondents (94%) indicated White as their racial/ethnic background, and English as their primary language (99%).
5. Language
Frequency Percentage
1364 99%
3 0%
10 1%
1377 100%
4. Ethnicity

© DecisionWise, Inc. All Rights Reserved. 11
Marital Status & Volunteer HoursHalf of all respondents indicated they were currently married, followed by widowed (28%), and divorced (12%). 451 respondents reported they do volunteer work, 41% of which volunteer more than 5 hours per week.
0
>2
2.5-5
5-10
11-20
21-50
Frequency Percentage
687 50%
165 12%
389 28%
98 7%
23 2%
15 1%
1377 100%
Frequency Percentage
35 7%
76 16%
173 36%
122 25%
60 12%
20 4%
486 100%
14. Volunteer hours per week6. Marital Status

© DecisionWise, Inc. All Rights Reserved. 12
Education & Work Status
Frequency Percentage
38 3%
393 29%
385 26%
131 10%
203 15%
205 15%
1355 100%
8. Education 13. Work Status
Frequency Percentage
82 6%
1019 75%
102 8%
123 9%
28 2%
1354 100%
The majority of respondents have at least some college education, with 30% earning a bachelor’s degree or higher. Three-fourths of the respondents are retired, while the remainder are working, disabled, or seeking work.

© DecisionWise, Inc. All Rights Reserved. 13
0 - 5
6 - 10
11 - 15
16 - 20
21 - 30
31 - 50
51+
9. Years in current community 12. Live alone?
Living ArrangementsThe majority of survey respondents have lived in their current community for more than 10 years. 61% of respondents do not live alone.
Frequency Percentage
533 39%
844 61%
1377 100%
Frequency Percentage
214 16%
209 16%
217 16%
172 13%
251 19%
203 15%
53 4%
1319 100%

© DecisionWise, Inc. All Rights Reserved. 14
HousingHalf of the respondents have paid off their homes. 26% pay a mortgage and 21% pay rent. The majority of respondents live in a house (66%), while 21% live in a mobile home.
10. Pay for Housing? 11. Living accommodations
Frequency Percentage
676 50%
290 21%
354 26%
43 3%
1363 100%
Frequency Percentage
915 66%
10 1%
3 0%
126 9%
290 21%
19 1%
16 1%
1379 100%

© DecisionWise, Inc. All Rights Reserved. 15
IncomeApproximately two-thirds of single income earners brought home more than $1,084 per month, while one-third brought home over $1,671. Most couples (72%) had a combined income of over $2,247 per month.
15. Single Couple
Frequency Percentage
144 20%
93 13%
84 11%
74 10%
109 15%
228 31%
732 100%
Frequency Percentage
12 2%
18 3%
16 3%
38 6%
89 14%
445 72%
618 100%

© DecisionWise, Inc. All Rights Reserved. 16
Income Source
72
104
330
5491082
29
116
185
0 200 400 600 800 1000
SSD Paymen
ts
Veteran
's Ben
efits
Other
SSI Pay
mentsEmplo
ymen
t
Savings
/Inve
stmen
tsPen
sion
Social S
ecuri
ty
3
323
262
0
50
100
150
200
250
300
350
Railroad Government Company
16. Income Source Pension Type
1,082 respondents receive their income from Social Security payments, 549 have pensions, and 330 have savings or investments (more than one can apply). The most common pension comes from Companies (262) and Federal, State or Local Government (323).

© DecisionWise, Inc. All Rights Reserved. 17
Retirement AgeA total of 177 people responded to items in Question 17 concerning those who were born between the years 1946 and 1964 and have not yet retired. Of these, the majority indicated that they did not know the age at which they expected to retire (66%). 19% believe they will retire between ages 61-65.
Frequency Percentage
5 3%
34 19%
21 12%
1 1%
116 66%
177 100%
17a. Expected Retirement Age

© DecisionWise, Inc. All Rights Reserved. 18
Pension Plan & Lifestyle
Frequency Percentage
128 57%
96 43%
224 100%
17b. Pension Plan 17c. Standard of Living
Frequency Percentage
57 28%
10 5%
84 41%
53 26%
204 100%
Of those respondents who answered items b and c under Q 17, 43% indicate that they or their spouse are currently in a pension plan or retirement program. 41% of respondents feel that their standard of living will worsen after retirement.

© DecisionWise, Inc. All Rights Reserved. 19
Post-Retirement Work Of those respondents in this age category who are not yet retired, 63% feel they will need to work after retirement in order to have sufficient income. The majority of respondents also indicated that they would like to work part-time after retirement.
17d. Need to Work for Sufficient Income
17e. Enjoy Part-time Work After Retirement
Frequency Percentage
128 63%
74 37%
202 100%
Frequency Percentage
122 60%
80 40%
202 100%

© DecisionWise, Inc. All Rights Reserved. 20
Post-Retirement Housing
Frequency Percentage
158 76%
51 24%
209 100%
17f. Remain in same residence Moving where?
Frequency Percentage
31 41%
9 12%
10 13%
1 1%
3 4%
3 4%
10 13%
9 12%
76 100%
After retiring, a majority of respondents plan to stay in their current residence (76%). For those respondents who plan to move, the average amount of time between retirement and the move is 3.9 years. 41% of those moving after retirement will find a smaller home, 38% will move to a retirement community, mobile home, or a relative’s home.

© DecisionWise, Inc. All Rights Reserved. 21
Adequate Health CareFor respondents between ages 47 and 65 who are not retired, a majority (57%) believed that they would have adequate health care available to them after retirement.
Frequency Percentage
116 57%
88 43%
204 100%
17g. Post-Retirement Adequate Health Care

© DecisionWise, Inc. All Rights Reserved. 22
Activity Difficulty Level
17h. Difficulty level with activities
Most respondents between the ages of 47 and 65 who have not yet retired feel comfortable doing the activities below with no difficulty. However, they do have the most difficulty with home repair and maintenance.

© DecisionWise, Inc. All Rights Reserved. 23
Planning for Retirement
70
34
63
118
32
77
0
20
40
60
80
100
120
FinancialPreparations
Health carepreparations
Looking intohousing options
Learning newskills
Learning aboutservices available
to older adults
Other
17i. Preparation for Retirement
When respondents were asked to select all of the steps they have taken to prepare for retirement, the largest number responded that they have made financial preparations. The least common preparation is looking into housing options.

© DecisionWise, Inc. All Rights Reserved. 24
CommentsRespondents were asked to comment regarding their main concerns about retirement and aging. The top 10 responses are listed below. Most are concerned about not having enough money, inadequate health care and poor health.
17j. Concerns about retirement and aging
14
17
18
18
20
22
25
51
56
86
0 20 40 60 80 100
Home maintenance
Transportation
Social Security benefits
Unable to care for self
Housing
Rising costs (Inflation)
Affordable healthcare
Poor health
Inadequate healthcare
Not having enough money

© DecisionWise, Inc. All Rights Reserved. 25
Health Insurance & Documents
448
846
322
598
0
200
400
600
800
1000
None Pow er ofAttorney
AdvanceDirective
Will or Trust
125
184
305
991
315
150
40
0 200 400 600 800 1000
No Insurance
HMO
Medigap Plan
Medi-Cal
Retiree GroupPlan
Private
Medicare
18. Health Insurance 19. Document Types
A majority of respondents rely on Medicare (991) for their health insurance (more than one can apply). 846 respondents have a Will or Trust set up and 598 have an Advance Directive for Health Care.

© DecisionWise, Inc. All Rights Reserved. 26
Veteran Status
20. Are you a veteran?
Only 22% of survey respondents are veterans, while 78% are not.
1054
291
No
Yes

© DecisionWise, Inc. All Rights Reserved. 27
Speaking Up & Calling for HelpOver half of the respondents (51%) feel that if a problem arises they can speak up all the time, 25% can most times. If an unsolvable problem arises, 92% of respondents would call a friend or relative for help.
Frequency Percentage
702 51%
343 25%
268 20%
52 4%
1365 100%
Frequency Percentage
1195 89%
42 3%
108 8%
1345 100%
21. Are you comfortable speaking up? 22. Who would you call for help?

© DecisionWise, Inc. All Rights Reserved. 28
Health & WellnessSURVEY QUESTIONS 23 - 27

© DecisionWise, Inc. All Rights Reserved. 29
Memory & Age
37%34%40%
51%53%
47%48%51%
45%
47%47%
46%36%33%
36%33%
35%41%
15%
13%
19%14%
14%13%
15%
16%
14%85 Years or older
80-84 Years
75-79 Years
70-74 Years
65-69 Years
60-64 Years
55-59 Years
50-54 Years
Total
I have no trouble rembering thingsIt takes me longer to remember thingsI sometimes forget things completely
23. There is a steady increase between ages 65 and 84 in the percentage of those who responded that it takes longer to remember things. However, surprisingly, the group with the highest percentage who responded that they forget things completely was 55-59 years.

© DecisionWise, Inc. All Rights Reserved. 30
Memory & Gender
46%
43%
40%
41%
14%
16%
Female
Male
I have no trouble rembering thingsIt takes me longer to remember thingsI sometimes forget things completely
23. There is not a significant difference in memory between genders, although a slightly higher percentage of women said they have no trouble remembering things, and a higher percentage of men responded that they sometimes forget things completely.

© DecisionWise, Inc. All Rights Reserved. 31
Happiness & Age
71%70%
66%75%76%
66%68%
50%70%
28%25%
31%22%24%
31%30%
37%27%
2%
4%
3%
3%
0%
3%
3%
13%
3%
85 Years +
80-84 Years
75-79 Years
70-74 Years
65-69 Years
60-64 Years
55-59 Years
50-54 Years
Total
I am Happy I am getting by I am not Happy
24. Respondents between ages 65 and 74 report the highest levels of happiness, while those between 50 and 54 report the lowest. In general, happiness levels increase with age.

© DecisionWise, Inc. All Rights Reserved. 32
Happiness & Gender
71%
68%
26% 2%
3%29%
Female
Male
I am Happy I am getting by I am not Happy
24. Females report happiness at a slightly higher rate than males, with a difference of 3%.

© DecisionWise, Inc. All Rights Reserved. 33
Chronic Health Problems
557
247207 188 170
138 137
76
263225
0
100
200
300
400
500
600
Arthriti
s
Heart D
iseas
e
Osteop
orisis
Diabete
s
Eye D
iseas
e
Obesit
y
Asthma
Cance
rOthe
rNon
e
The most frequently cited chronic health problem was arthritis, which was cited as a problem by 40% of respondents (557 out of 1410). 16% of respondents (225) responded that they have no chronic health problems.
25. Chronic Health Problems

© DecisionWise, Inc. All Rights Reserved. 34
Overall HealthThe majority of respondents reported that their overall health was good (62%). This is the same percent that reported good health in 2008. Only 14% reported their overall health as poor or very poor, which is a 2% increase from 2008.
27. Overall Health
Frequency Percentage
330 24%
852 62%
179 13%
14 1%
1,375 100%

© DecisionWise, Inc. All Rights Reserved. 35
ActivitiesSURVEY QUESTIONS 28 - 31

© DecisionWise, Inc. All Rights Reserved. 36
Socialize + Exercise
Frequency Percentage
550 40%
482 36%
266 20%
55 4%
1353 100%
28. How often do you socialize with other people?
29. How often do you get at least 20 min of exercise?
Frequency Percentage
513 38%
480 36%
192 14%
169 12%
1354 100%
40% of respondents socialize daily, while 36% socialize 3-4 times a week. 38% exercise daily and 36% exercise 3-4 times a week.

© DecisionWise, Inc. All Rights Reserved. 37
When asked how much difficulty you have with daily activities, the majority of respondents have no difficulty with basic activities such as eating and using the telephone and toilet. Respondents have some difficulty with stairs, heavy housework and home maintenance.
30. No Difficulty Some Difficulty
Out of the 1410 people who took the survey, the numbers above reflect how many people answered that particular question.
Activities: Level of Difficulty-Overall

© DecisionWise, Inc. All Rights Reserved. 38
43
63
103
140
184
38
48
80
0 20 40 60 80 100 120 140 160 180 200
Reading
Walking
Preparingmeals
Doing lighthousework
Getting up anddown stairs
Doing heavyhousework
Homemaintenance
Home repairs
50
62
100
205
359
42
56
83
0 50 100 150 200 250 300 350 400
Getting up anddown stairs
Doing lighthousework
Shopping forpersonal items
Grocery shopping
Driving
Doing heavyhousework
Home maintenance
Home repairs
Serious Difficulty Cannot Do Alone
Out of the 1410 people who took the survey, the numbers above reflect how many people answered that particular question.
Activities: Level of Difficulty-OverallRespondents report having serious difficulty with home repairs, home maintenance and heavy housework. Of these activities, 359 respondents cannot make home repairs by themselves.

© DecisionWise, Inc. All Rights Reserved. 39
Someone Helps Me With These Activities
Out of the 1410 people who took the survey, the numbers above reflect how many people answered that particular question.
Activities: Someone Helps-OverallAccording to the respondents, home repairs and home maintenance are the activities requiring the most help.

© DecisionWise, Inc. All Rights Reserved. 40
0% 10% 20% 30% 40% 50% 60% 70% 80% 90% 100%
Walking
Getting in/out of Bed
Climbing Stairs
Using toilet
Bathing
Dressing
Eating
Preparing Meals
Grocery shopping
Shopping for personal items
Driving
Arranging Rides
Using telephone
Reading
Managing Money
Managing medications
Light Housework
Heavy Housework
Home maintenance
Home repairs
No DifficultySome DifficultySerious DifficultyCannot Do Alone
Activities Level of Difficulty: Amador County

© DecisionWise, Inc. All Rights Reserved. 41
0% 10% 20% 30% 40% 50% 60% 70% 80% 90% 100%
Walking
Getting in/out of Bed
Climbing Stairs
Using toilet
Bathing
Dressing
Eating
Preparing Meals
Grocery shopping
Shopping for personal items
Driving
Arranging Rides
Using telephone
Reading
Managing Money
Managing medications
Light Housework
Heavy Housework
Home maintenance
Home repairs
No DifficultySome DifficultySerious DifficultyCannot Do Alone
Activities Level of Difficulty: Calaveras County

© DecisionWise, Inc. All Rights Reserved. 42
0% 10% 20% 30% 40% 50% 60% 70% 80% 90% 100%
Walking
Getting in/out of Bed
Climbing Stairs
Using toilet
Bathing
Dressing
Eating
Preparing Meals
Grocery shopping
Shopping for personal items
Driving
Arranging Rides
Using telephone
Reading
Managing Money
Managing medications
Light Housework
Heavy Housework
Home maintenance
Home repairs
No DifficultySome DifficultySerious DifficultyCannot Do Alone
Activities Level of Difficulty: Mariposa County
© DecisionWise, Inc. All Rights Reserved. 43
0% 10% 20% 30% 40% 50% 60% 70% 80% 90% 100%
Walking
Getting in/out of Bed
Climbing Stairs
Using toilet
Bathing
Dressing
Eating
Preparing Meals
Grocery shopping
Shopping for personal items
Driving
Arranging Rides
Using telephone
Reading
Managing Money
Managing medications
Light Housework
Heavy Housework
Home maintenance
Home repairs
No DifficultySome DifficultySerious DifficultyCannot Do Alone
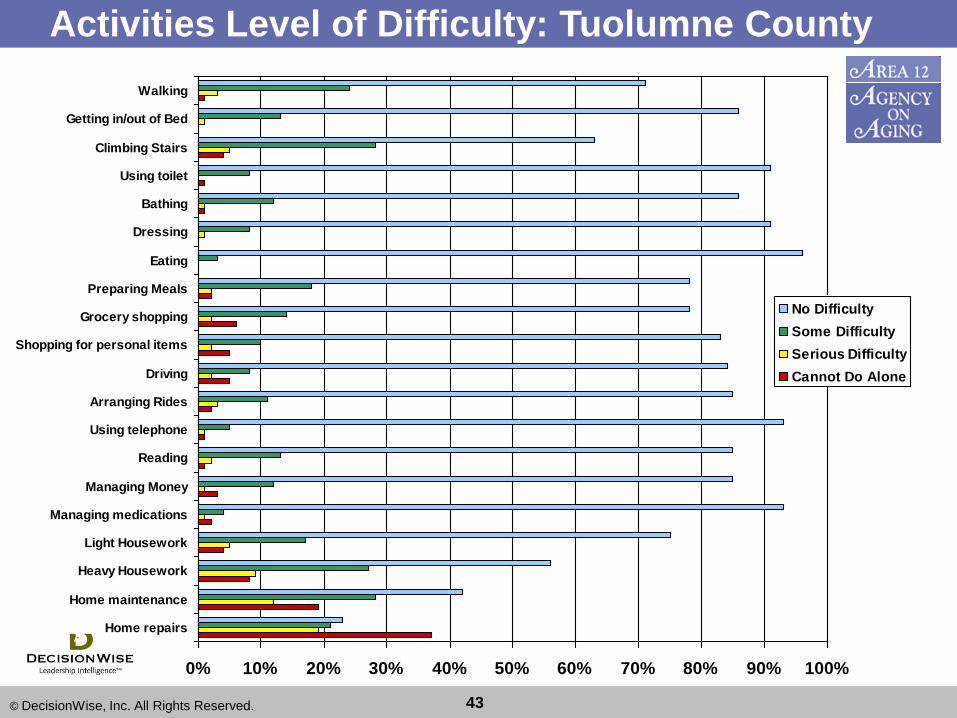
Activities Level of Difficulty: Tuolumne County

© DecisionWise, Inc. All Rights Reserved. 44
0% 5% 10% 15% 20% 25% 30% 35% 40% 45% 50%
Walking
Getting in/out of Bed
Climbing Stairs
Using toilet
Bathing
Dressing
Eating
Preparing Meals
Grocery shopping
Shopping for personal items
Driving
Arranging Rides
Using telephone
Reading
Managing Money
Managing medications
Light Housework
Heavy Housework
Home maintenance
Home repairs
AmadorCalaverasMariposaTuolumne
Activities: Someone Helps (By County)

© DecisionWise, Inc. All Rights Reserved. 45
31a. Paid to help?
Frequency Percentage
404 28%
324 23%
117 8%
228 16%
23 2%
321 23%
1417 100%
42%
58%
Activities: Someone HelpsWhen asked who helps most often with these activities, 28% said their spouse/partner helps. 23% cite their son/daughter. The majority of respondents (58%) do not pay others to help them with these activities.
31. Who helps?

© DecisionWise, Inc. All Rights Reserved. 46
Needs & ConcernsSURVEY QUESTIONS 32 - 34

© DecisionWise, Inc. All Rights Reserved. 47
Most respondents report that dealing with alcohol and drug abuse is not an issue. Getting someone to do home repairs, power outages, and stopping or preventing falls in the home are small issues for respondents.
32. Not An Issue For Me A Small Issue For Me
Out of the 1410 people who took the survey, the numbers above reflect how many people answered that particular question.
Needs & Concerns: Level of Issue

© DecisionWise, Inc. All Rights Reserved. 48
A Big Issue For Me I Need Help With This
Out of the 534 people who took the survey, the numbers above reflect how many people answered that particular question.
Needs & Concerns: Level of IssuePaying for dental care and handling severe weather conditions are big issues for respondents. Getting someone to do home repairs and paying for dental care require the most help, according to respondents.

© DecisionWise, Inc. All Rights Reserved. 49
0% 20% 40% 60% 80% 100%
Driving
Caregivers time-off
Others' Substance Abuse
Own Substance abuse
Depression/Mental Illness
Loneliness/Isolation
Employment
Home Repairs
Household Chores
Personal care
Legal Advice
Services for Grandchildren
Trans. For errands
Trans. For medical appts.
Enough food
Enough money
Being aware of services
Paying for dental
Paying for health care
Paying for utilities
Paying for meds
Power outages
Planning future care
Crime
Elder abuse
Falls in home
Severe weather
Other
Not an IssueSmall IssueBig Issue
Needs & Concerns: Amador County

© DecisionWise, Inc. All Rights Reserved. 50
0% 20% 40% 60% 80% 100%
Driving
Caregivers time-off
Others' Substance Abuse
Own Substance abuse
Depression/Mental Illness
Loneliness/Isolation
Employment
Home Repairs
Household Chores
Personal care
Legal Advice
Services for Grandchildren
Trans. For errands
Trans. For medical appts.
Enough food
Enough money
Being aware of services
Paying for dental
Paying for health care
Paying for utilities
Paying for meds
Power outages
Planning future care
Crime
Elder abuse
Falls in home
Severe weather
Other
Not an IssueSmall IssueBig Issue
Needs & Concerns: Calaveras County

© DecisionWise, Inc. All Rights Reserved. 51
0% 20% 40% 60% 80% 100%
Driving
Caregivers time-off
Others' Substance Abuse
Own Substance abuse
Depression/Mental Illness
Loneliness/Isolation
Employment
Home Repairs
Household Chores
Personal care
Legal Advice
Services for Grandchildren
Trans. For errands
Trans. For medical appts.
Enough food
Enough money
Being aware of services
Paying for dental
Paying for health care
Paying for utilities
Paying for meds
Power outages
Planning future care
Crime
Elder abuse
Falls in home
Severe weather
Other
Not an IssueSmall IssueBig Issue
Needs & Concerns: Mariposa County

© DecisionWise, Inc. All Rights Reserved. 52
0% 20% 40% 60% 80% 100%
Driving
Caregivers time-off
Others' Substance Abuse
Own Substance abuse
Depression/Mental Illness
Loneliness/Isolation
Employment
Home Repairs
Household Chores
Personal care
Legal Advice
Services for Grandchildren
Trans. For errands
Trans. For medical appts.
Enough food
Enough money
Being aware of services
Paying for dental
Paying for health care
Paying for utilities
Paying for meds
Power outages
Planning future care
Crime
Elder abuse
Falls in home
Severe weather
Other
Not an IssueSmall IssueBig Issue
Needs & Concerns: Tuolumne County

© DecisionWise, Inc. All Rights Reserved. 53
Needs & Concerns: Other comments
Caring for spouse/other family memberFuture of Social Security/MedicareEyesight/Paying for eye care and glassesEating nutritional foodWould like to use bus transit but no place to park car (Amador station)Problem with steps, need rampStandard of living decreasing in Calaveras CountyHaving enough money to pay for outside helpNo recreation for seniors in Mariposa No learning choices/access to libraryIn-home health careGetting mail/taking out trashSleeplessnessCost of propane and heating home during power outages, can’t carry woodEmergency PreparednessTaxesVisiting FamilyCost of gasoline
The Needs and Concerns not listed on the survey that people wrote in the “Other” category include the following:

© DecisionWise, Inc. All Rights Reserved. 54
0% 5% 10% 15% 20%
Driving
Caregivers time-off
Others' Substance Abuse
Own Substance abuse
Depression/Mental Illness
Loneliness/Isolation
Employment
Home Repairs
Household Chores
Personal care
Legal Advice
Services for Grandchildren
Trans. For errands
Trans. For medical appts.
Enough food
Enough money
Being aware of services
Paying for dental
Paying for health care
Paying for utilities
Paying for meds
Power outages
Planning future care
Crime
Elder abuse
Falls in home
Severe weather
Other
AmadorCalaverasMariposaTuolumne
Needs&Concerns: I Need Help (By County)

© DecisionWise, Inc. All Rights Reserved. 55
Paid to Help?
Frequency Percentage
416 32%
337 26%
217 17%
194 15%
105 8%
25 2%
1294 100%
Needs & Concerns: Someone Helps
33. Who helps ?
Immediate family members help most often with respondent needs and concerns. 68% of those identified do not get paid to help.
32%
68%

© DecisionWise, Inc. All Rights Reserved. 56
Comments
The greatest concerns for respondents right now deal with having enough money to live on (26%), paying for health care (20%), having someone do home repairs (15%), and being able to drive (12%).
34. Greatest Concerns
Needs & Concerns: Comments
Frequency Percentage
119 26%
92 20%
67 15%
53 12%
49 11%
41 9%
33 7%
454 100%

© DecisionWise, Inc. All Rights Reserved. 57
Concern: Driving
How it affects them: Not able to go when and where I want
Concern: Dental care
How it affects them: Can’t afford dental care, need new dentures
Concern: Having enough money to live on
How it affects them: Depressing; Worry, as costs for everything rise
Concern: Home repair and maintenance
How it affects them: Frustrates me; Don’t know how to find honest help
Needs & Concerns: CommentsParticipants were asked how these current issues affect them (34a). The following are samples of responses that were provided:

© DecisionWise, Inc. All Rights Reserved. 58
Comments
Easier, more reliable public transportation
Get a job
Financial assistance
Affordable dental insurance
Low-cost dental care
More income
A reliable, affordable handyman list
Lower prices
Getting someone to help
Needs & Concerns: CommentsBelow are examples of comments respondents made when asked what could be done to make these issues less of a concern (34b).

© DecisionWise, Inc. All Rights Reserved. 59
Comments
Taking care of myself
Being able to drive
Declining heath
Having enough money to live on
Housing costs
Paying for medical costs
Staying in own home
Home healthcare
Home repairs and yard work
Needs & Concerns: CommentsWhen asked which concerns they anticipate to become a serious problem in the next 3-4 years (34c), many cited taking care of themselves and their homes, being able to drive and declining health.

© DecisionWise, Inc. All Rights Reserved. 60
Services UsedSURVEY QUESTIONS 35 - 38

© DecisionWise, Inc. All Rights Reserved. 61
Services Used in the Last Year
72
73
74
84
88
96
107
110
129
164
221
227
228
263
441
0 50 100 150 200 250 300 350 400 450 500
Ed/Support Groups
Home Modif ication
Disease Prev
Volunteer Trans
IHSS
Info & Asst
Restaurant
Medical Trans
Health Ins Counseling
Alive Driver
Meal Sites
Home Meals
Energy Asst
Exercise
Handyman
Respondents were asked which services they used in the last year. 441 (31%) cited handyman services while 263 utilized a community exercise program. These were the most-used services in 2008 as well.
35. Services used in the last year

© DecisionWise, Inc. All Rights Reserved. 62
Services: Not Available
65 63
44
34
Alive Driver Adult Day Care Alzheimer's Day Care Linkages
When asked which services were not available in the community, the most common responses cited Alive Driver, Adult and Alzheimer’s Day Health Care, and Care Management (Linkages).
35a. Services not available in my community

© DecisionWise, Inc. All Rights Reserved. 63
Services: Would UseWhen asked what services would be used if available, the largest number of respondents listed Handyman services and the 55 Alive Driver training class.
53
53
53
60
60
67
67
69
75
81
81
0 10 20 30 40 50 60 70 80 90
Family Caregiver
Home Safety
Restaurant
Energy Asst
Home Owners Asst
Firewood
Legal
Exercise
Weatherization
Alive Driver
Handyman
35b. Would use services if available

© DecisionWise, Inc. All Rights Reserved. 64
Services: Not meeting needs
TransportationTransportation is not always available It’s difficult to obtain transportationNeed more information about transportationPublic transportation has poor service, routes and frequency
Other commentsAdult day health care closedMeals on Wheels needs new food optionsNeed a Senior Center; more activitiesNeed assistance clearing snowGarbage pickupDental and eye care that’s affordable
38. When asked if there are any senior services not meeting their needs most respondents noted problems with transportation.

© DecisionWise, Inc. All Rights Reserved. 65
Mobility
60
65
263
1043
0 200 400 600 800 1000 1200
Walk or Bicycle
Someone is paid to driveme
Friends/relatives drive me
Drive my own car
The clear majority of respondents said they usually get to the places they need to go by driving their own car.
37. How do you usually get to the places you need to go?

© DecisionWise, Inc. All Rights Reserved. 66
Staying HealthySURVEY QUESTIONS 39 - 45

© DecisionWise, Inc. All Rights Reserved. 67
Travel to see doctorThe average reported driving time to see their regular doctor is 33.01 minutes, with a wide variation among respondents.
0
50
100
150
200
250
Travel Time to Doctor (min)
34. Travel time to visit doctor

© DecisionWise, Inc. All Rights Reserved. 68
Frequency of Doctor VisitWhen asked how often they see their doctor for checkups, most respondents (461) reported visiting their doctor 2-3 times per year. Only 3% indicated that they did not visit their doctor at all.
40. Frequency of doctor visits

© DecisionWise, Inc. All Rights Reserved. 69
Talking to Doctor
41a. More time talking to doctor? b. If yes, what would you talk about? My Specific Ailments
Medication
General Questions
Pain
c. Would you attend classes on how to communicate better with your doctor?
The majority of respondents reported that they did not wish to have more time talking to their doctor (73%). For those who did, most of the questions they would ask related to specific ailments, medication, general questions, and pain issues. While many participants did not answer part (c), 48% of those that did respond indicated they would not attend classes about how to communicate better with their doctors.
Percentage
73%
19%
8%
100%
Percentage
48%
37%
15%
100%

© DecisionWise, Inc. All Rights Reserved. 70
Activities to Stay HealthyWhen asked what they do to stay healthy, most respondents indicated eating healthy foods and exercising.
42. What do you do to stay healthy?

© DecisionWise, Inc. All Rights Reserved. 71
Wellness CheckupsOf the 1410 respondents, 89% indicated they have received Blood Pressure Checks in the last three years. Many respondents have also received Vision Tests (73%), and Cholesterol Screenings (71%).
43. Wellness checkups received in the last three years

© DecisionWise, Inc. All Rights Reserved. 72
Wellness Checkup LocationThe majority of respondents (83%) indicated that they visit their regular doctor’s office for wellness checkups. 20% also responded that they go to a health clinic or hospital for wellness checkups.
44. Location of wellness checkups

© DecisionWise, Inc. All Rights Reserved. 73
Out-of-pocket Pay for CheckupsThere was great variety in responses to how much respondents pay (out-of-pocket) for well/routine checkups annually. The median response was $75.00.
42. How much do you pay annually for checkups?

© DecisionWise, Inc. All Rights Reserved. 74
CaregiversSURVEY QUESTIONS 46 - 60

© DecisionWise, Inc. All Rights Reserved. 75
48. Of those not currently a caregiver, 80 people responded that they were expecting to undertake caregiving duties in the next 5 years.
Percentage Frequency
19% 269
11% 153
1% 17
0%
69%
100%
5
966
1410
46. A person over 60 years old 47. A child under 18, who is not your own
Percentage Frequency
29% 401
1% 13
0% 8
0%
70%
100%
2
986
1410
Currently a Caregiver for:

© DecisionWise, Inc. All Rights Reserved. 76
Relationship to the Caregiver49. Those who are caregivers for an elderly person care for the following people:
51
20
116 9
93
55
0
10
20
30
40
50
60
70
80
90
100
110
120
130
Mother Father Mother-in-law/Father-in-law
Aunt/Uncle Brother/ Sister Spouse/Partner
Other
The “other” category consists mainly of spouse, son or daughter.

© DecisionWise, Inc. All Rights Reserved. 77
Relationship to the Caregiver
50. Those who are caregivers to children, care for the following people:
Most of those who marked “other” specified son, daughter or friend.

© DecisionWise, Inc. All Rights Reserved. 78
Caregiving Demographics
48
30
30
19
90
0 50 100
> 5 hours
5-9 hours
10-14 hours
15-20 hours
20+ hours
Number of respondents
51. Average number of hours per week spent on caregiving activities.
52. Gender of the person receiving care
Percentage
41%
59%
100%
Frequency
91
134
225

© DecisionWise, Inc. All Rights Reserved. 79
Caregiving Statistics
Caregivers indicate that 65% of the people they care for live with them, while 35% do not.
75% of caregivers indicate that they are the main caregiver for the person indicated in the previous questions.
Most caregivers (81%) responded that they have not reduced the number of hours they work due to their caregiving duties.
Only 17% of respondents indicated that they have had to take extended personal leave in order to fulfill their caregiving duties.
81% of caregivers do not use any sick or vacation time for caregiving activities, while another 13% use over 10 hours.
Survey questions 53 – 57 asked for various responses regarding caregiving activities.

© DecisionWise, Inc. All Rights Reserved. 80
Caregiving Information58. Areas in which caregivers would like more information.

© DecisionWise, Inc. All Rights Reserved. 81
Caregiver Funding59. Prescription drugs and doctor visits were the highest reported areas paid for by caregivers. The fewest number of respondents reported paying for day care.

© DecisionWise, Inc. All Rights Reserved. 82
Additional caregiver programs
Evaluation of lifestyle circumstances by a professional Information about affordable home maintenance/repair services Publicize warming centers for elderly during power outagesReduced cost clinicsHome haircuttingAdult day careHelp for Alzheimer/Dementia patientsCaregiver support meetings Legal adviceTransportation to appointmentsHelp with household chores Intervention for drug/abuse issues
60. When asked what additional caregiving programs would be helpful, the responses were varied. The following comments were made: